Champaign, Illinois

Champaign: Sunset Behind Corner's House, Champaign, Dec 4th 2005

Champaign: Champaign Park, Dec 4th 2005
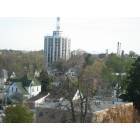
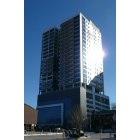
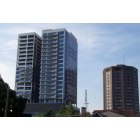
Champaign: Champaign skyline from roof
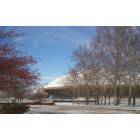
Champaign: Assembly Hall, Champaign, Dec 4th 2005
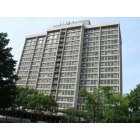
Champaign: Illini tower
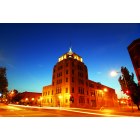
Champaign: city building
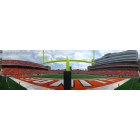
Champaign: Memorial stadium - Home of the Illini
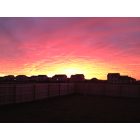
Champaign: Sunset over Southwest Champaign
Champaign: 309 green

Champaign: downtown
Champaign: 309 green
- see
19
more - add
your
Submit your own pictures of this city and show them to the world
- OSM Map
- General Map
- Google Map
- MSN Map
Population change since 2000: +32.2%
| Males: 42,373 | |
| Females: 46,868 |
| Median resident age: | 27.3 years |
| Illinois median age: | 39.1 years |
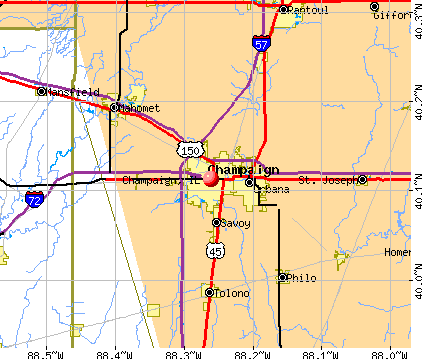
Zip codes: 61801, 61820, 61821.
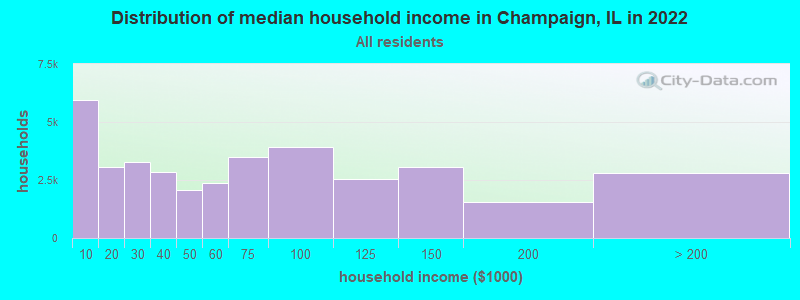
Champaign Zip Code Map| Champaign: | $56,148 |
| IL: | $76,708 |
Estimated per capita income in 2022: $37,390 (it was $18,664 in 2000)
Champaign city income, earnings, and wages data
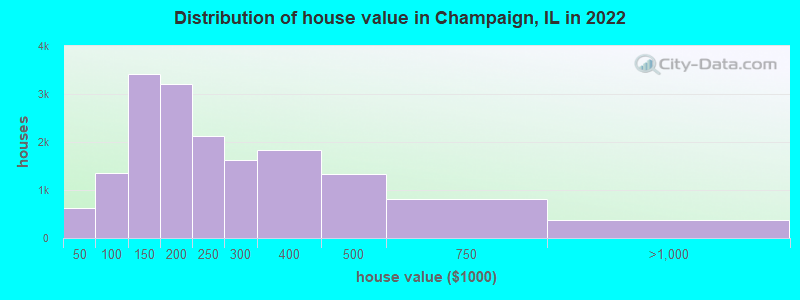
Estimated median house or condo value in 2022: $211,700 (it was $89,500 in 2000)
| Champaign: | $211,700 |
| IL: | $251,600 |
Mean prices in 2022: all housing units: $219,505; detached houses: $230,945; townhouses or other attached units: $243,199; in 2-unit structures: $65,661; in 3-to-4-unit structures: $137,180; in 5-or-more-unit structures: $161,289; mobile homes: $28,115
Median gross rent in 2022: $1,043.
(18.6% for White Non-Hispanic residents, 25.6% for Black residents, 25.9% for Hispanic or Latino residents, 27.4% for American Indian residents, 23.3% for other race residents, 32.5% for two or more races residents)
Detailed information about poverty and poor residents in Champaign, IL


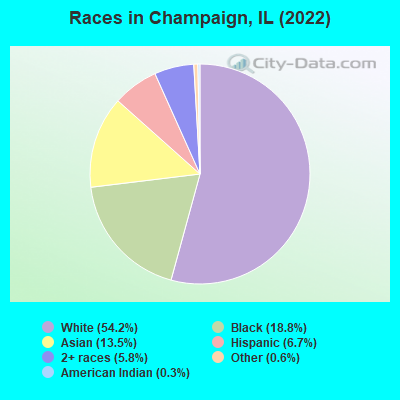
- 48,39854.2%White alone
- 16,77118.8%Black alone
- 12,08713.5%Asian alone
- 5,9826.7%Hispanic
- 5,2155.8%Two or more races
- 5520.6%Other race alone
- 2400.3%American Indian alone
Races in Champaign detailed stats: ancestries, foreign born residents, place of birth
According to our research of Illinois and other state lists, there were 136 registered sex offenders living in Champaign, Illinois as of April 27, 2024.
The ratio of all residents to sex offenders in Champaign is 629 to 1.
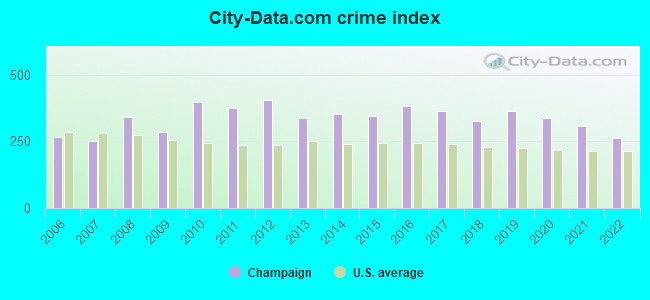
The City-Data.com crime index weighs serious crimes and violent crimes more heavily. Higher means more crime, U.S. average is 246.1. It adjusts for the number of visitors and daily workers commuting into cities.
- means the value is smaller than the state average.- means the value is about the same as the state average.
- means the value is bigger than the state average.
- means the value is much bigger than the state average.
Crime rate in Champaign detailed stats: murders, rapes, robberies, assaults, burglaries, thefts, arson
Full-time law enforcement employees in 2020, including police officers: 134 (113 officers - 103 male; 10 female).
| Officers per 1,000 residents here: | 1.26 |
| Illinois average: | 3.04 |
 Recent articles from our blog. Our writers, many of them Ph.D. graduates or candidates, create easy-to-read articles on a wide variety of topics.

 | Anyone know about these areas in Champaign-Urbana? (3 replies) |
| I'm moving to Champaign Urbana (14 replies) |
| Champaign illinois Zip Code 61820 (7 replies) |
| U of I's Chicago identity: Champaign? Urbana? Others? (51 replies) |
| Nexamp Community Solar in Champaign county (0 replies) |
| Bloomington-Normal vs. Champaign-Urbana? (5 replies) |
Latest news from Champaign, IL collected exclusively by city-data.com from local newspapers, TV, and radio stations
Ancestries: German (10.1%), Irish (4.6%), English (3.9%), American (3.6%), European (2.8%), Italian (2.2%).
Current Local Time: CST time zone
Incorporated on 04/24/1883
Elevation: 750 feet
Land area: 17.0 square miles.
Population density: 5,253 people per square mile (average).
15,124 residents are foreign born (11.1% Asia, 2.4% Africa, 2.1% Latin America).
| This city: | 17.1% |
| Illinois: | 14.1% |
Median real estate property taxes paid for housing units with mortgages in 2022: $4,820 (2.1%)
Median real estate property taxes paid for housing units with no mortgage in 2022: $3,807 (2.2%)
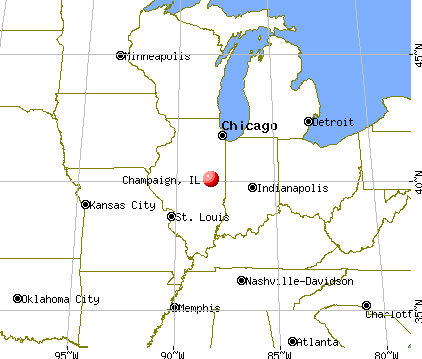
Nearest city with pop. 200,000+: Indianapolis, IN  (114.3 miles , pop. 781,870).
Nearest city with pop. 1,000,000+: Chicago, IL (123.3 miles , pop. 2,896,016).
Nearest cities:
), ), ), ), ), )Latitude: 40.11 N, Longitude: 88.26 W
Daytime population change due to commuting: +8,451 (+9.5%)
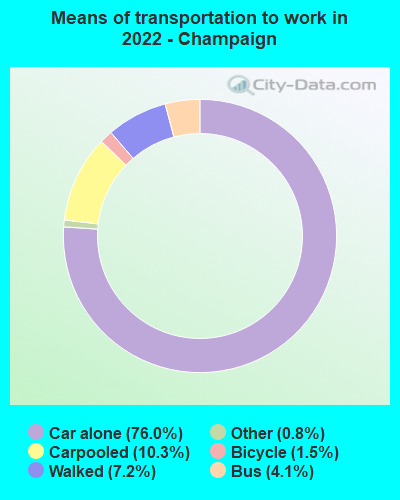
Workers who live and work in this city: 29,741 (68.0%)
Area code: 217
Champaign tourist attractions:
Champaign, Illinois accommodation & food services, waste management - Economy and Business Data
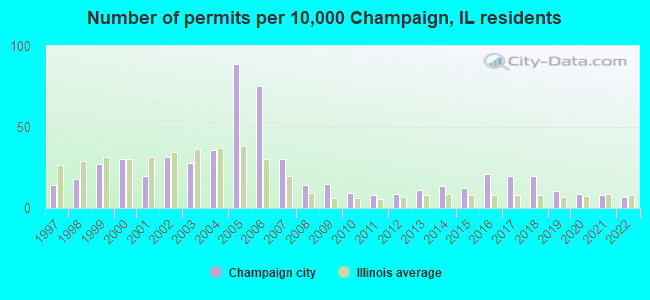
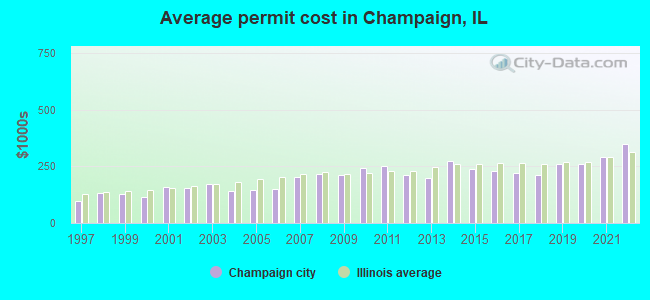
Single-family new house construction building permits:
- 2022: 45 buildings, average cost: $348,500
- 2021: 55 buildings, average cost: $293,400
- 2020: 58 buildings, average cost: $260,100
- 2019: 71 buildings, average cost: $262,500
- 2018: 132 buildings, average cost: $213,700
- 2017: 133 buildings, average cost: $218,500
- 2016: 141 buildings, average cost: $230,700
- 2015: 82 buildings, average cost: $238,100
- 2014: 92 buildings, average cost: $273,100
- 2013: 73 buildings, average cost: $200,100
- 2012: 59 buildings, average cost: $214,000
- 2011: 54 buildings, average cost: $250,000
- 2010: 63 buildings, average cost: $242,100
- 2009: 98 buildings, average cost: $210,800
- 2008: 97 buildings, average cost: $216,500
- 2007: 206 buildings, average cost: $205,400
- 2006: 507 buildings, average cost: $149,800
- 2005: 600 buildings, average cost: $144,600
- 2004: 241 buildings, average cost: $140,500
- 2003: 187 buildings, average cost: $173,900
- 2002: 211 buildings, average cost: $154,200
- 2001: 135 buildings, average cost: $158,700
- 2000: 204 buildings, average cost: $116,600
- 1999: 183 buildings, average cost: $127,900
- 1998: 122 buildings, average cost: $130,500
- 1997: 96 buildings, average cost: $98,500
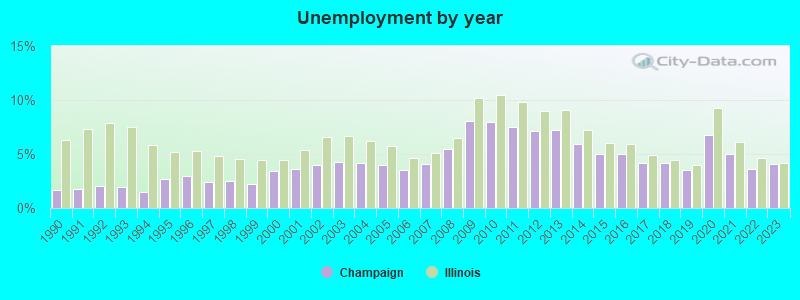
| Here: | 4.1% |
| Illinois: | 4.2% |
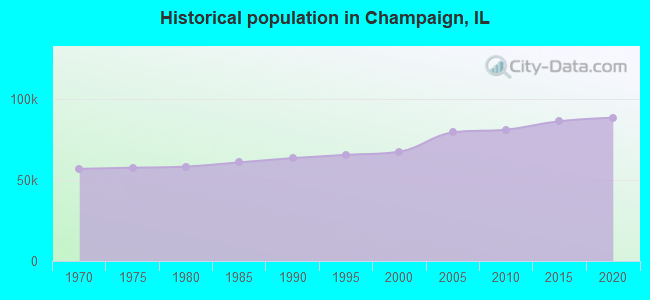
Population change in the 1990s: +3,195 (+5.0%).
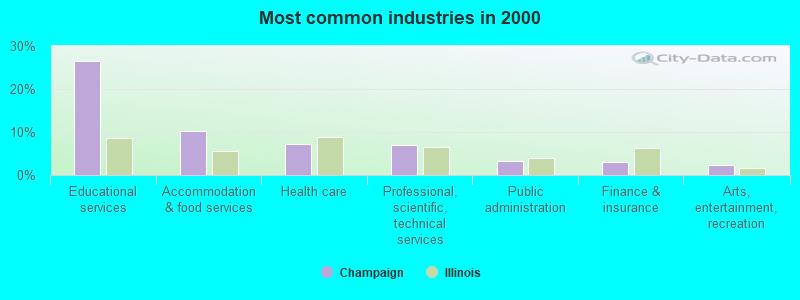
- Educational services (26.4%)
- Accommodation & food services (10.3%)
- Health care (7.3%)
- Professional, scientific, technical services (7.0%)
- Public administration (3.2%)
- Finance & insurance (2.9%)
- Arts, entertainment, recreation (2.4%)
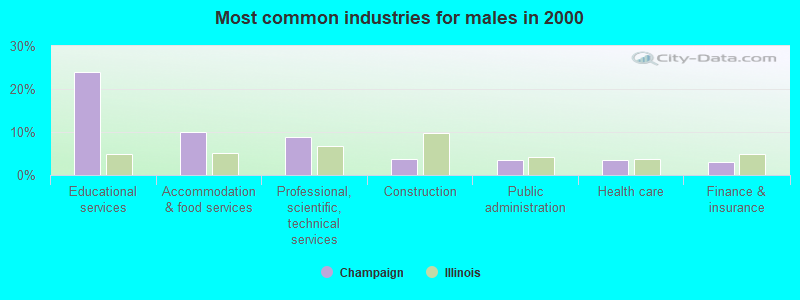
- Educational services (23.9%)
- Accommodation & food services (9.9%)
- Professional, scientific, technical services (8.9%)
- Construction (3.8%)
- Public administration (3.5%)
- Health care (3.5%)
- Finance & insurance (2.9%)
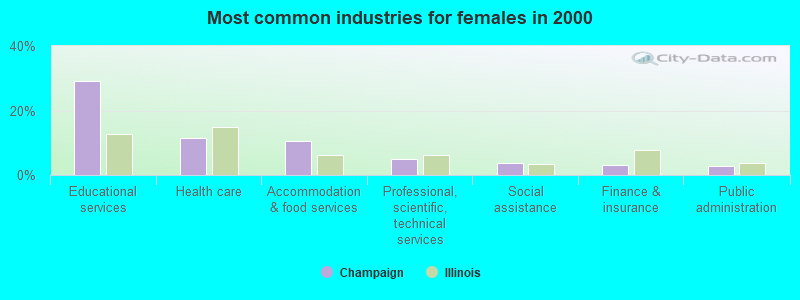
- Educational services (29.2%)
- Health care (11.5%)
- Accommodation & food services (10.6%)
- Professional, scientific, technical services (4.9%)
- Social assistance (3.6%)
- Finance & insurance (3.0%)
- Public administration (2.9%)
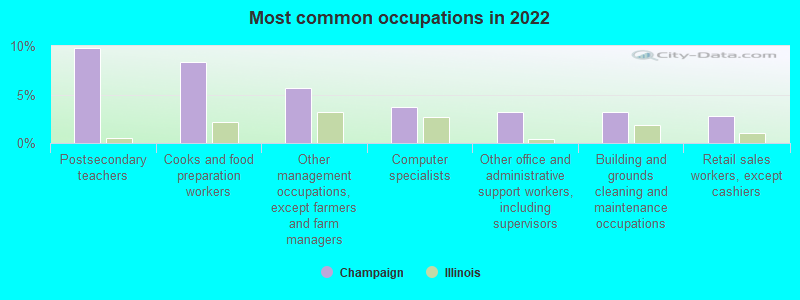
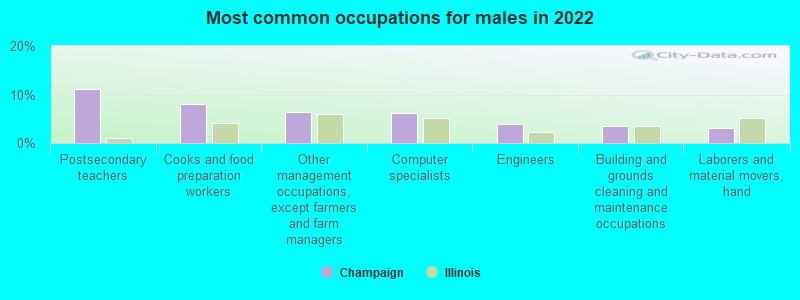
- Postsecondary teachers (9.8%)
- Cooks and food preparation workers (8.3%)
- Other management occupations, except farmers and farm managers (5.7%)
- Computer specialists (3.7%)
- Other office and administrative support workers, including supervisors (3.2%)
- Building and grounds cleaning and maintenance occupations (3.2%)
- Retail sales workers, except cashiers (2.8%)
- Postsecondary teachers (11.1%)
- Cooks and food preparation workers (8.0%)
- Other management occupations, except farmers and farm managers (6.3%)
- Computer specialists (6.2%)
- Engineers (3.8%)
- Building and grounds cleaning and maintenance occupations (3.5%)
- Laborers and material movers, hand (3.1%)
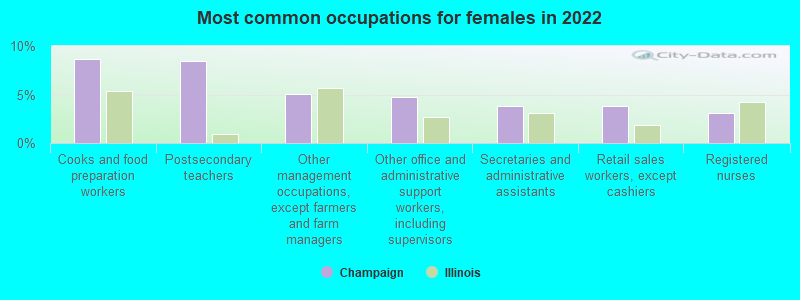
- Cooks and food preparation workers (8.7%)
- Postsecondary teachers (8.4%)
- Other management occupations, except farmers and farm managers (5.0%)
- Other office and administrative support workers, including supervisors (4.7%)
- Secretaries and administrative assistants (3.9%)
- Retail sales workers, except cashiers (3.8%)
- Registered nurses (3.0%)
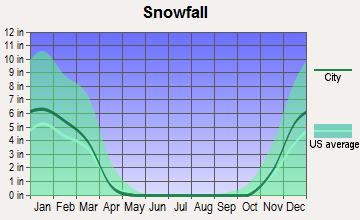
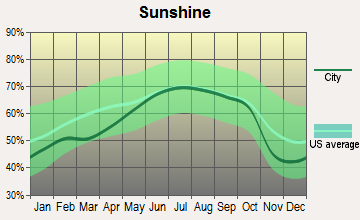
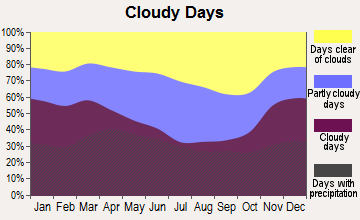
Average climate in Champaign, Illinois
Based on data reported by over 4,000 weather stations


|
|

(lower is better)
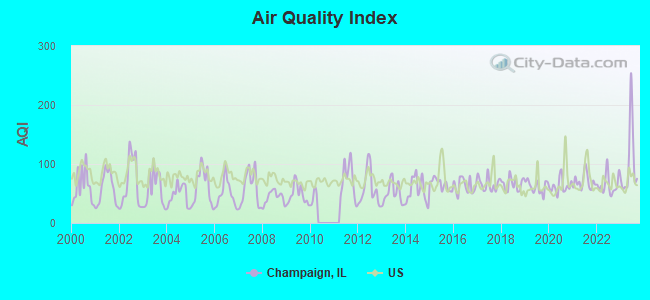
Air Quality Index (AQI) level in 2023 was 101. This is worse than average.
| City: | 101 |
| U.S.: | 73 |
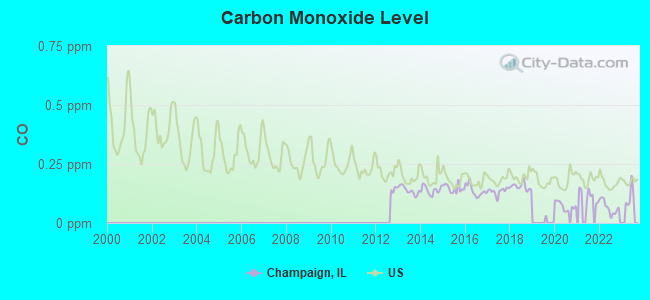
Carbon Monoxide (CO) [ppm] level in 2022 was 0.0661. This is significantly better than average. Closest monitor was 7.2 miles away from the city center.
| City: | 0.0661 |
| U.S.: | 0.2513 |
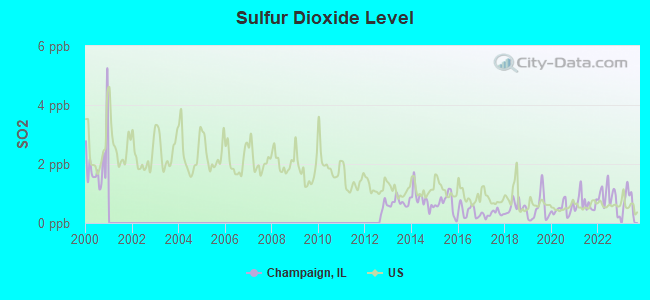
Sulfur Dioxide (SO2) [ppb] level in 2023 was 0.732. This is significantly better than average. Closest monitor was 1.1 miles away from the city center.
| City: | 0.732 |
| U.S.: | 1.515 |
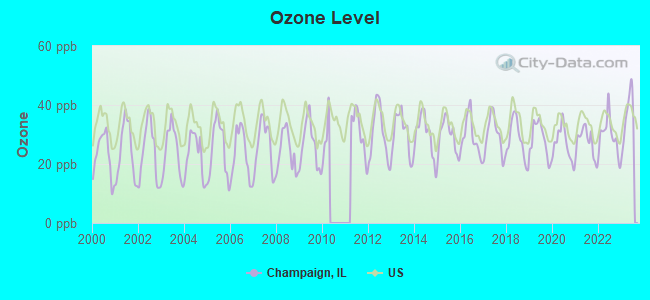
Ozone [ppb] level in 2023 was 36.1. This is about average. Closest monitor was 0.9 miles away from the city center.
| City: | 36.1 |
| U.S.: | 33.3 |
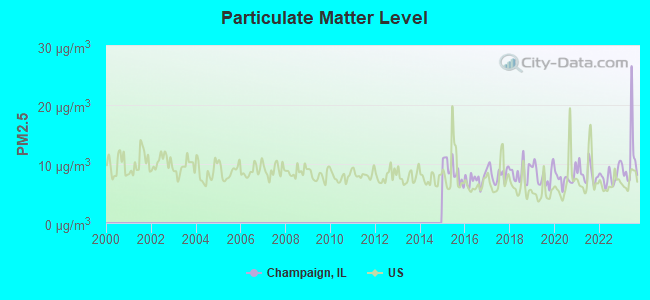
Particulate Matter (PM2.5) [µg/m3] level in 2023 was 10.9. This is worse than average. Closest monitor was 1.3 miles away from the city center.
| City: | 10.9 |
| U.S.: | 8.1 |
Tornado activity:
Champaign-area historical tornado activity is near Illinois state average. It is 81% greater than the overall U.S. average.
On 4/19/1996, a category F3 (max. wind speeds 158-206 mph) tornado 3.0 miles away from the Champaign city center injured 12 people and caused $9 million in damages.
On 4/9/1953, a category F3 tornado 5.1 miles away from the city center killed 3 people and injured 22 people and caused between $5,000,000 and $50,000,000 in damages.
Earthquake activity:
Champaign-area historical earthquake activity is significantly above Illinois state average. It is 111% greater than the overall U.S. average.On 4/18/2008 at 09:36:59, a magnitude 5.4 (5.1 MB, 4.8 MS, 5.4 MW, 5.2 MW, Class: Moderate, Intensity: VI - VII) earthquake occurred 116.6 miles away from Champaign center
On 6/10/1987 at 23:48:54, a magnitude 5.1 (4.9 MB, 4.4 MS, 4.6 MS, 5.1 LG) earthquake occurred 91.6 miles away from Champaign center
On 4/18/2008 at 09:36:59, a magnitude 5.2 (5.2 MW, Depth: 8.9 mi) earthquake occurred 116.7 miles away from Champaign center
On 6/18/2002 at 17:37:15, a magnitude 5.0 (4.3 MB, 4.6 MW, 5.0 LG) earthquake occurred 149.3 miles away from the city center
On 4/18/2008 at 15:14:16, a magnitude 4.8 (4.5 MB, 4.8 MW, 4.6 MW, Class: Light, Intensity: IV - V) earthquake occurred 115.4 miles away from Champaign center
On 4/3/1974 at 23:05:02, a magnitude 4.7 (4.5 MB, 4.7 LG) earthquake occurred 105.6 miles away from Champaign center
Magnitude types: regional Lg-wave magnitude (LG), body-wave magnitude (MB), surface-wave magnitude (MS), moment magnitude (MW)
Natural disasters:
The number of natural disasters in Champaign County (11) is smaller than the US average (15).Major Disasters (Presidential) Declared: 8
Emergencies Declared: 2
Causes of natural disasters: Storms: 8, Tornadoes: 5, Floods: 4, Hurricane: 1, Ice Storm: 1, Snow: 1, Wind: 1, Other: 1 (Note: some incidents may be assigned to more than one category).
Hospitals in Champaign:
- CARLE HOSPICE (2011 ROUNDBARN ROAD)
- CARLE PAVILION INC (provides emergency services, 809 W CHURCH ST)
- CHAMPAIGN SURGICENTER, LLC (1702 S MATTIS)
- COVENANT MEDICAL CTR-CHAMPAIGN CAMPUS (provides emergency services, 407 S 4TH ST)
- PAVILION FOUNDATION,THE (809 W CHURCH ST)
- PROVENA HOSPICE, URBANA (1501 INTERSTATE DRIVE)
Nursing Homes in Champaign:
- CHAMPAIGN CHILDRENS HOME (109 KENWOOD RD)
- HEARTLAND OF CHAMPAIGN (309 EAST SPRINGFIELD)
- HELIA HEALTHCARE OF CHAMPAIGN (1915 SOUTH MATTIS STREET)
- ILLINI HERITAGE REHAB AND HC (1315B CURT DRIVE)
Dialysis Facilities in Champaign:
Home Health Centers in Champaign:
Airports located in Champaign:
- Mc Culley Airport (IL56) (Runways: 1)
Colleges/Universities in Champaign:
- University of Illinois at Urbana-Champaign (Full-time enrollment: 47,528; Location: 601 E John Street; Public; Website: www.illinois.edu/; Offers Doctor's degree)
- Parkland College (Full-time enrollment: 7,326; Location: 2400 W Bradley Ave; Public; Website: www.parkland.edu)
- Regency Beauty Institute-Champaign (Full-time enrollment: 107; Location: 517 West Town Center Blvd.; Private, for-profit; Website: www.regency.edu)
Other colleges/universities with over 2000 students near Champaign:
- Danville Area Community College (about 36 miles; Danville, IL; Full-time enrollment: 2,229)
- Richland Community College (about 38 miles; Decatur, IL; FT enrollment: 2,434)
- Millikin University (about 43 miles; Decatur, IL; FT enrollment: 2,419)
- Eastern Illinois University (about 44 miles; Charleston, IL; FT enrollment: 9,414)
- Illinois Wesleyan University (about 47 miles; Bloomington, IL; FT enrollment: 2,323)
- Illinois State University (about 48 miles; Normal, IL; FT enrollment: 18,804)
- Lake Land College (about 48 miles; Mattoon, IL; FT enrollment: 7,499)
Public high schools in Champaign:
- CENTENNIAL HIGH SCHOOL (Students: 1,519, Location: 913 CRESCENT DR, Grades: 9-12)
- R E A D Y PROGRAM (Location: 45 E UNIVERSITY AVE, Grades: 6-12)
- CENTRAL HIGH SCHOOL (Location: 610 W UNIVERSITY AVE, Grades: 9-12)
- NOVAK ACADEMY (Location: 815 N RANDOLPH ST, Grades: 9-12)
- ACTIONS PROGRAM (Location: 1103 N NEIL ST, Grades: KG-12)
Private high schools in Champaign:
Biggest public elementary/middle schools in Champaign:
- JEFFERSON MIDDLE SCHOOL (Students: 673, Location: 1115 CRESCENT DR, Grades: 6-8)
- ROBESON ELEM SCHOOL (Students: 516, Location: 2501 SOUTHMOOR DR, Grades: KG-5)
- BOTTENFIELD ELEM SCHOOL (Students: 419, Location: 1801 S PROSPECT AVE, Grades: KG-5)
- VERNON L BARKSTALL ELEMENTARY SCH (Students: 418, Location: 2201 HALLBECK DR, Grades: KG-5)
- DR HOWARD ELEM SCHOOL (Students: 395, Location: 1117 W PARK AVE, Grades: KG-5)
- STRATTON ELEMENTARY SCHOOL (Students: 390, Location: 902 N RANDOLPH ST, Grades: KG-5)
- KENWOOD ELEM SCHOOL (Students: 389, Location: 1605 W KIRBY AVE, Grades: KG-5)
- GARDEN HILLS ELEM SCHOOL (Students: 357, Location: 2001 GARDEN HILLS DR, Grades: KG-5)
- SOUTH SIDE ELEMENTARY SCHOOL (Students: 274, Location: 712 S PINE ST, Grades: KG-5)
- WASHINGTON ELEM SCHOOL (Students: 254, Location: 606 E GROVE ST, Grades: KG-5)
Private elementary/middle schools in Champaign:
- ST MATTHEW SCHOOL (Students: 416, Location: 1307 LINCOLNSHIRE DR, Grades: KG-8)
- NEXT GENERATION SCHOOL (Students: 341, Location: 2521 GALEN DR, Grades: PK-8)
- HOLY CROSS ELEMENTARY SCHOOL (Students: 316, Location: 410 W WHITE ST, Grades: KG-8)
- ST JOHN LUTHERAN SCHOOL (Students: 185, Location: 509 S MATTIS AVE, Grades: PK-8)
- COUNTRYSIDE SCHOOL (Students: 144, Location: 4301 W KIRBY AVE, Grades: KG-8)
- MONTESSORI HABITAT SCHOOL (Students: 78, Location: 801 W KIRBY AVE, Grades: PK-8)
- UNIVERSITY PRIMARY SCHOOL (Students: 51, Location: 51 GERTY DR, Grades: PK-1)
Library in Champaign:
- CHAMPAIGN PUBLIC LIBRARY (Operating income: $6,042,790; Location: 200 WEST GREEN STREET; 278,378 books; 1,945 e-books; 33,568 audio materials; 31,656 video materials; 21 local licensed databases; 19 state licensed databases; 1 other licensed databases; 596 print serial subscriptions; 1 electronic serial subscriptions)
User-submitted facts and corrections:
- Please add Campus Middle School for Girls as a private school for the Champaign-Urbana area. The school's address is: 1203 W. Green St. Urbana, IL 61801
Points of interest:
Notable locations in Champaign: Champaign Country Club (A), Devonshire Corporate Centre (B), Interstate Research Park (C), Market Street Industrial Park (D), Weston Hall (E), Van Doren Hall (F), Turner Student Services Building (G), Taft Hall (H), Swanlund Administration Building (I), Snyder Hall (J), Sherman Hall (K), Shelford Vivarium (L), Scott Hall (M), Noble Hall (N), Merriam Laboratory (O), Lundgren Hall (P), La Casa Cultural Latina (Q), Krannert Art Museum (R), Illini Hall (S), Huff Hall (T). Display/hide their locations on the map
Shopping Centers: Country Fair Shopping Center (1), Market Place Mall Shopping Center (2). Display/hide their locations on the map
Church in Champaign: Saint John Church (A). Display/hide its location on the map
Cemeteries: Mount Hope Cemetery (1), Roselawn Cemetery (2), Saint Marys Cemetery (3). Display/hide their locations on the map
Lakes and reservoirs: Clear Lake (A), Mattis Lake (B). Display/hide their locations on the map
Creek: Boneyard Creek (A). Display/hide its location on the map
Parks in Champaign include: Scott Park (1), Beardsley Park (2), Centennial Park (3), Clark Park (4), Davidson Park (5), Wisegarver Park (6), Willis Park (7), Robeson Park (8), Mayfair Park (9). Display/hide their locations on the map
Tourist attractions: Champaign County - Historical Museum (111 East University Avenue) (1), Champaign County Historical Museum Cattle Bank (102 East University Avenue) (2), Champaign Urbana Astronomical Society (Nature Centers; 706 Kenwood Road) (3), G T'S Western Bowl Inc (Amusement & Theme Parks; Francis Drive) (4), Ants in Their Pants (Amusement & Theme Parks; 125 South Mattis Avenue) (5), Education America Limited (Tours & Charters; 2007 Round Barn Road # A) (6), Franklin Travel (Tours & Charters; 1710 South Neil Street Suite 1) (7). Display/hide their approximate locations on the map
Hotels: C. B.Independent .Director.Coastal.Vacation (112 Kenwood Road 394) (1), Country Inn & Suites by Carlson (602 W Marketview Dr.) (2), Days Inn (1019 West Bloomington Road) (3), Comfort Inn Champaign (305 Market View Drive) (4), Country Inn & Suites Champaign (602 West Marketview Drive) (5), Comfort Inn (305 W Marketview Dr) (6), Hawthorn Suites Ltd. - Champaign (101 Trade Centre Dr) (7), Extended Stayamerica (610 West Marketview Drive) (8), Drury Inn and Suites Champaign (Urbana) (905 West Anthony Drive) (9). Display/hide their approximate locations on the map
Courts: Federal Bureau Of Investigation (116 North Chestnut Street) (1), Breese Court C-O Ppm Inc (108 East John Street) (2), Champaign County - Probation & Court Services- Juvenile Detention Ce (400 South Art Bartell Road) (3), Champaign County - Probation & Court Services (101 East Main) (4). Display/hide their approximate locations on the map
Birthplace of: Ludacris, John Bargh - US- social psychologist, Katherine Reutter - Short track speed skater, Mark Kirk - Senator, James Tobin - Economist, Stanford Parris - Former Congressman, Tim Johnson (Illinois politician) - Politician, Adam Seward - 2005 NFL player (Carolina Panthers, born: Jun 15, 1982), Amy Chua - Professor of Law at Yale Law School, Paul Buhle - Book editor.
Drinking water stations with addresses in Champaign and their reported violations in the past:
ILLINI PRAIRIE REST AREAS (Population served: 1,000, Groundwater):Past health violations:MASCOUTIN SRA (Population served: 500, Groundwater):
- MCL, Monthly (TCR) - Between JAN-2009 and DEC-2009, Contaminant: Coliform. Follow-up actions: St Public Notif requested (SEP-29-2009), St Violation/Reminder Notice (SEP-29-2009), St Public Notif received (OCT-07-2009), St Compliance achieved (NOV-18-2009)
Past health violations:FOREST GLEN - POND WATER (Population served: 200, Surface water):
- MCL, Acute (TCR) - Between JAN-2011 and MAR-2011, Contaminant: Coliform
Past monitoring violations:MIDDLE FORK RIVER FOREST PRESV (Population served: 200, Groundwater):
- Monitoring of Treatment (SWTR-Filter) - In JUN-2007. Follow-up actions: St Violation/Reminder Notice (JAN-04-2007), St Compliance achieved (AUG-06-2007)
- Monitoring of Treatment (SWTR-Filter) - In MAY-2007. Follow-up actions: St Violation/Reminder Notice (JAN-04-2007), St Compliance achieved (AUG-06-2007)
- Monitoring of Treatment (SWTR-Filter) - In APR-2007. Follow-up actions: St Violation/Reminder Notice (JAN-04-2007), St Compliance achieved (AUG-06-2007)
- Monitoring of Treatment (SWTR-Filter) - In MAR-2007. Follow-up actions: St Violation/Reminder Notice (JAN-04-2007), St Compliance achieved (AUG-06-2007)
- Monitoring of Treatment (SWTR-Filter) - In FEB-2007. Follow-up actions: St Violation/Reminder Notice (JAN-04-2007), St Compliance achieved (AUG-06-2007)
- One routine major monitoring violation
- One minor monitoring violation
- 27 other older monitoring violations
Past health violations:TIMBER POINTE OC-STERNS LODGE (Population served: 150, Groundwater):Past monitoring violations:
- MCL, Monthly (TCR) - Between JAN-2010 and DEC-2010, Contaminant: Coliform. Follow-up actions: St Compliance achieved (AUG-18-2010)
- MCL, Monthly (TCR) - Between JAN-2006 and DEC-2006, Contaminant: Coliform. Follow-up actions: St Compliance achieved (SEP-05-2006)
- Monitoring, Repeat Major (TCR) - Between JAN-2010 and DEC-2010, Contaminant: Coliform (TCR). Follow-up actions: St Compliance achieved (AUG-18-2010)
- One regular monitoring violation
Past health violations:LITTLE GALILEE CHRISTIAN ASMBY (Population served: 150, Groundwater):Past monitoring violations:
- MCL, Monthly (TCR) - Between OCT-2009 and DEC-2009, Contaminant: Coliform. Follow-up actions: St Public Notif requested (DEC-05-2009), St Compliance achieved (APR-21-2010)
- Monitoring, Repeat Major (TCR) - Between OCT-2009 and DEC-2009, Contaminant: Coliform (TCR). Follow-up actions: St Compliance achieved (DEC-01-2009)
Past monitoring violations:TIMBER PNTE OTDR CNTR-POOL BHS (Population served: 140, Groundwater):
- 2 routine major monitoring violations
Past health violations:MORAINE VIEW SP (Population served: 100, Groundwater):
- MCL, Monthly (TCR) - Between APR-2010 and JUN-2010, Contaminant: Coliform. Follow-up actions: St Formal NOV issued (JUL-19-2010), St Public Notif received (JUL-19-2010)
Past health violations:Past monitoring violations:
- MCL, Monthly (TCR) - Between JAN-2010 and DEC-2010, Contaminant: Coliform. Follow-up actions: St Public Notif requested (JUN-09-2010), St Compliance achieved (JUN-14-2010)
- MCL, Monthly (TCR) - Between APR-2007 and JUN-2007, Contaminant: Coliform. Follow-up actions: St Tech Assistance Visit (JUN-06-2007), St Compliance achieved (JUN-12-2007)
- One routine major monitoring violation
- One regular monitoring violation
Drinking water stations with addresses in Champaign that have no violations reported:
- POLLYWOGS ASSOCIATION INC (Population served: 200, Primary Water Source Type: Surface water)
- SPORTSMEN CLUB OF URBANA (Population served: 150, Primary Water Source Type: Groundwater)
- HINDU TEMPLE AND CULTURAL CENTER (Population served: 60, Primary Water Source Type: Groundwater)
- WELDON SPRINGS SP CAMPGRND (Population served: 25, Primary Water Source Type: Groundwater)
- IDOT LEVERETT (Population served: 25, Primary Water Source Type: Groundwater)
| This city: | 2.2 people |
| Illinois: | 2.6 people |
| This city: | 46.3% |
| Whole state: | 65.8% |
| This city: | 6.3% |
| Whole state: | 6.3% |
Likely homosexual households (counted as self-reported same-sex unmarried-partner households)
- Lesbian couples: 0.5% of all households
- Gay men: 0.3% of all households
People in group quarters in Champaign in 2010:
- 7,789 people in college/university student housing
- 341 people in nursing facilities/skilled-nursing facilities
- 229 people in emergency and transitional shelters (with sleeping facilities) for people experiencing homelessness
- 59 people in other noninstitutional facilities
- 30 people in residential treatment centers for juveniles (non-correctional)
- 24 people in residential treatment centers for adults
- 21 people in group homes intended for adults
- 11 people in group homes for juveniles (non-correctional)
- 10 people in correctional residential facilities
People in group quarters in Champaign in 2000:
- 6,680 people in college dormitories (includes college quarters off campus)
- 253 people in nursing homes
- 113 people in homes for the mentally retarded
- 64 people in other noninstitutional group quarters
- 57 people in other group homes
- 33 people in federal prisons and detention centers
- 21 people in mental (psychiatric) hospitals or wards
- 8 people in religious group quarters
- 4 people in homes for the physically handicapped
- 4 people in other nonhousehold living situations
- 2 people in agriculture workers' dormitories on farms
Banks with most branches in Champaign (2011 data):
- Busey Bank: 9 branches. Info updated 2010/01/25: Bank assets: $3,345.6 mil, Deposits: $2,767.4 mil, local headquarters, positive income, Commercial Lending Specialization, 49 total offices, Holding Company: First Busey Corporation
- First Financial Bank, National Association: Prospect Avenue Branch, Green Strret Champaign Branch, Freestar Bank - Champaign Branch. Info updated 2012/01/04: Bank assets: $2,852.7 mil, Deposits: $2,227.7 mil, headquarters in Terre Haute, IN, positive income, Commercial Lending Specialization, 66 total offices, Holding Company: First Financial Corporation
- BankChampaign, National Association: Market Place Branch, M2 Downtown Branch, Bankchampaign, National Association. Info updated 2006/11/03: Bank assets: $208.6 mil, Deposits: $165.7 mil, local headquarters, positive income, Commercial Lending Specialization, 3 total offices, Holding Company: Market Place Bancshares, Inc.
- PNC Bank, National Association: Main Walnut Branch, 5th And Green Branch, Kirby And Mattis Facility. Info updated 2012/03/20: Bank assets: $263,309.6 mil, Deposits: $197,343.0 mil, headquarters in Wilmington, DE, positive income, Commercial Lending Specialization, 3085 total offices, Holding Company: Pnc Financial Services Group, Inc., The
- CIBM Bank: Midtown Branch at 302 West Springfield, branch established on 1959/01/03; Cibm Bank at 2913 West Kirby Avenue, branch established on 1921/01/01. Info updated 2010/08/18: Bank assets: $500.2 mil, Deposits: $431.1 mil, local headquarters, negative income in the last year, Commercial Lending Specialization, 14 total offices, Holding Company: Cib Marine Bancshares, Inc.
- Marine Bank: Champaign Branch at 2434 Village Green Place, branch established on 2007/03/01; Champaign Branch at 1001 South Neil Street, branch established on 1989/06/30. Info updated 2011/11/30: Bank assets: $600.4 mil, Deposits: $516.0 mil, headquarters in Springfield, IL, positive income, Commercial Lending Specialization, 10 total offices, Holding Company: Marine Bancorp, Inc.
- Heartland Bank and Trust Company: Springfield Road Branch at 2101 West Springfield Road, branch established on 2004/06/21; Windsor Office Branch at 1101 W Windsor Road, branch established on 2001/06/15. Info updated 2011/08/08: Bank assets: $1,943.8 mil, Deposits: $1,632.9 mil, headquarters in Bloomington, IL, positive income, Commercial Lending Specialization, 49 total offices, Holding Company: Heartland Bancorp, Inc.
- JPMorgan Chase Bank, National Association: Champaign Main Branch at 201 West University Avenue, branch established on 1899/02/01; County Fair Branch at 303 S Mattis Avenue, branch established on 1964/08/10. Info updated 2011/11/10: Bank assets: $1,811,678.0 mil, Deposits: $1,190,738.0 mil, headquarters in Columbus, OH, positive income, International Specialization, 5577 total offices, Holding Company: Jpmorgan Chase & Co.
- FIRST MID-ILLINOIS BANK & TRUST, NATIONAL ASSOCIATION: Champaign North Branch at 913 West Marketview, branch established on 2009/11/02; Champaign Branch at 2229 South Neil Street, branch established on 2002/11/13. Info updated 2010/09/16: Bank assets: $1,492.8 mil, Deposits: $1,192.9 mil, headquarters in Mattoon, IL, positive income, Commercial Lending Specialization, 37 total offices, Holding Company: First Mid-Illinois Bancshares, Inc.
- 13 other banks with 14 local branches
For population 15 years and over in Champaign:
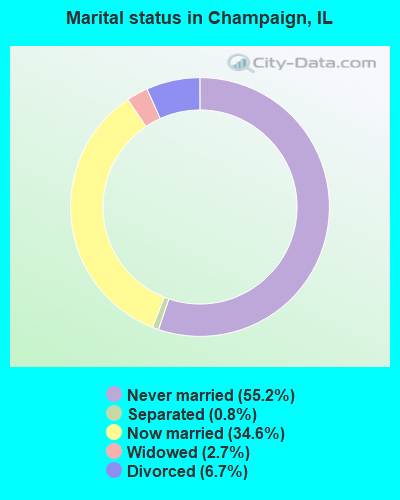
- Never married: 55.2%
- Now married: 34.6%
- Separated: 0.8%
- Widowed: 2.7%
- Divorced: 6.7%
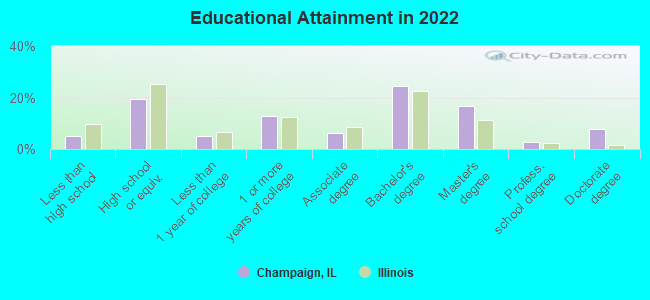
For population 25 years and over in Champaign:
- High school or higher: 95.1%
- Bachelor's degree or higher: 51.6%
- Graduate or professional degree: 27.3%
- Unemployed: 7.1%
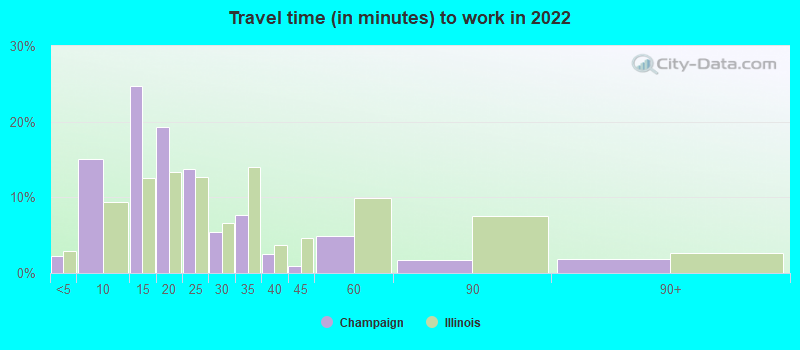
- Mean travel time to work (commute): 10.7 minutes
| Here: | 12.1 |
| Illinois average: | 12.5 |
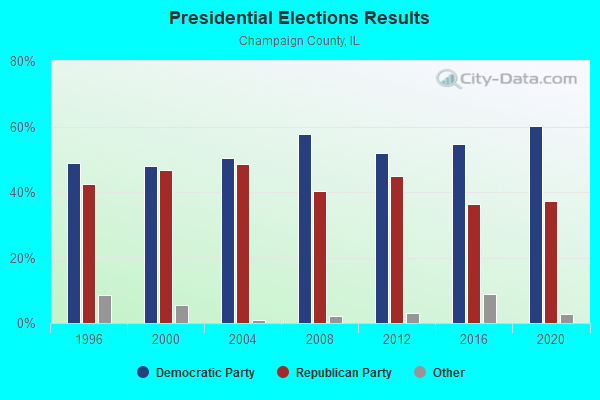
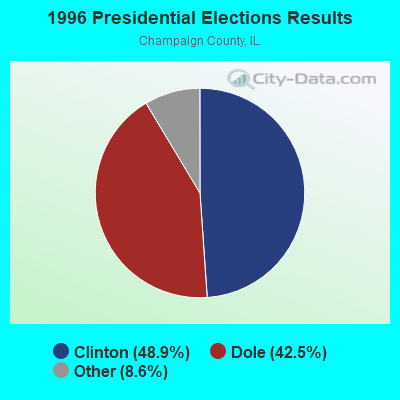
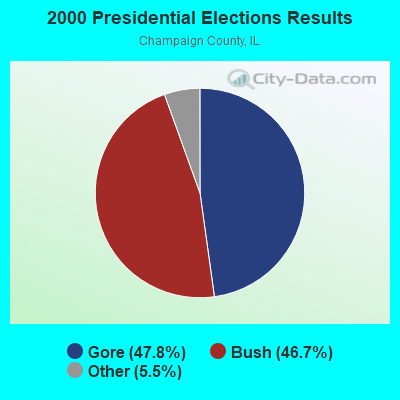
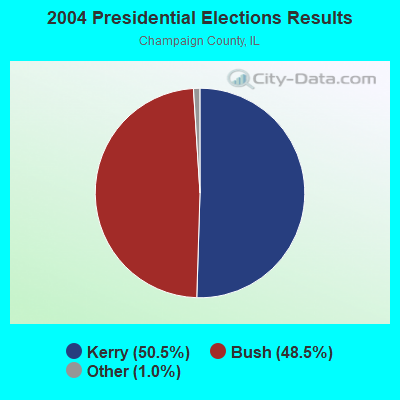
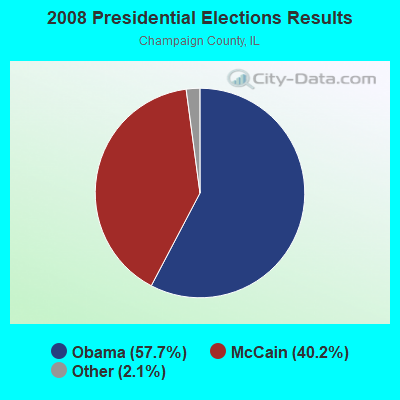
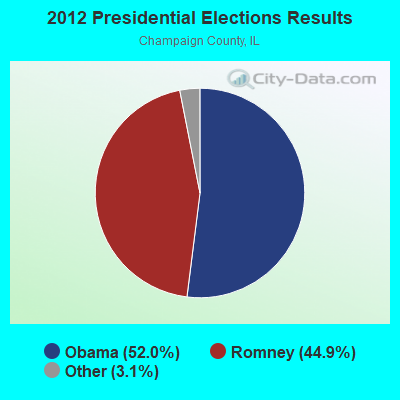
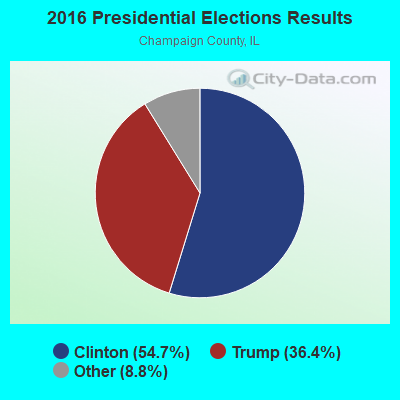
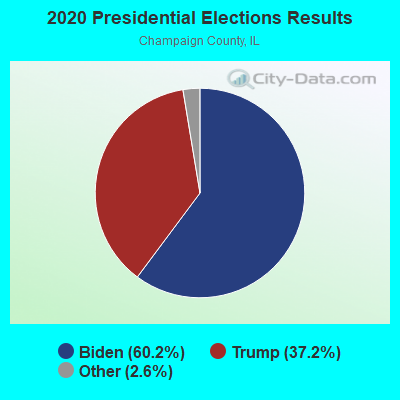
Graphs represent county-level data. Detailed 2008 Election Results
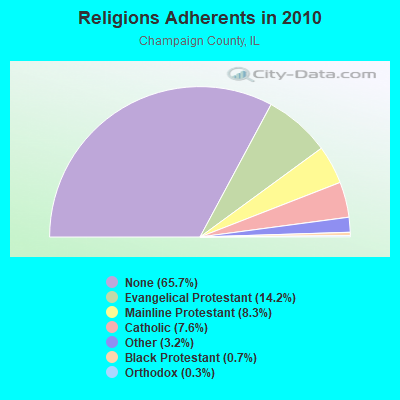
Religion statistics for Champaign, IL (based on Champaign County data)
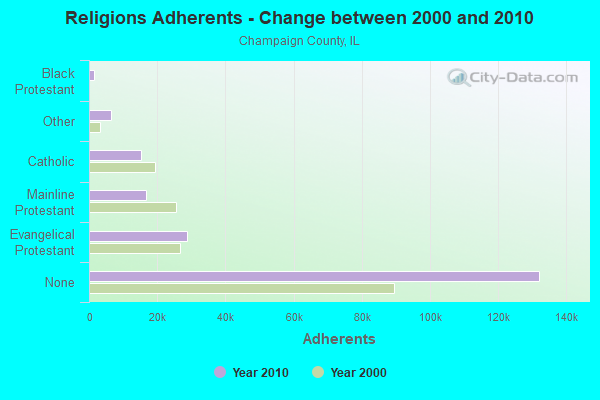
| Religion | Adherents | Congregations |
|---|---|---|
| Evangelical Protestant | 28,618 | 111 |
| Mainline Protestant | 16,652 | 54 |
| Catholic | 15,215 | 17 |
| Other | 6,441 | 20 |
| Black Protestant | 1,451 | 7 |
| Orthodox | 595 | 2 |
| None | 132,109 | - |
Food Environment Statistics:
| Champaign County: | 1.71 / 10,000 pop. |
| State: | 2.24 / 10,000 pop. |
| This county: | 0.16 / 10,000 pop. |
| State: | 0.08 / 10,000 pop. |
| This county: | 0.41 / 10,000 pop. |
| Illinois: | 0.75 / 10,000 pop. |
| Here: | 3.47 / 10,000 pop. |
| Illinois: | 2.61 / 10,000 pop. |
| Champaign County: | 7.98 / 10,000 pop. |
| Illinois: | 6.86 / 10,000 pop. |
| Champaign County: | 7.9% |
| Illinois: | 8.3% |
| Champaign County: | 27.6% |
| Illinois: | 25.2% |
| This county: | 9.5% |
| State: | 14.5% |
Health and Nutrition:
| Champaign: | 52.9% |
| Illinois: | 49.5% |
| Here: | 54.4% |
| Illinois: | 47.2% |
| Champaign: | 27.5 |
| State: | 28.6 |
| This city: | 17.6% |
| Illinois: | 20.5% |
| Champaign: | 9.7% |
| State: | 10.8% |
| Here: | 6.9 |
| Illinois: | 6.8 |
| Here: | 28.3% |
| State: | 33.4% |
| Champaign: | 62.2% |
| Illinois: | 56.4% |
| Champaign: | 83.2% |
| Illinois: | 79.9% |
More about Health and Nutrition of Champaign, IL Residents
| Local government employment and payroll (March 2022) | |||||
| Function | Full-time employees | Monthly full-time payroll | Average yearly full-time wage | Part-time employees | Monthly part-time payroll |
|---|---|---|---|---|---|
| Firefighters | 107 | $1,020,831 | $114,486 | 0 | $0 |
| Police Protection - Officers | 97 | $806,932 | $99,827 | 0 | $0 |
| Local Libraries | 70 | $336,579 | $57,699 | 136 | $339,376 |
| Other and Unallocable | 66 | $428,179 | $77,851 | 0 | $0 |
| Other Government Administration | 44 | $350,575 | $95,611 | 11 | $7,357 |
| Streets and Highways | 34 | $279,209 | $98,544 | 1 | $1,086 |
| Financial Administration | 28 | $196,079 | $84,034 | 0 | $0 |
| Police - Other | 20 | $110,449 | $66,269 | 2 | $4,711 |
| Judicial and Legal | 9 | $74,950 | $99,933 | 3 | $8,501 |
| Sewerage | 7 | $53,028 | $90,905 | 0 | $0 |
| Natural Resources | 7 | $58,225 | $99,814 | 0 | $0 |
| Housing and Community Development (Local) | 7 | $53,229 | $91,250 | 0 | $0 |
| Fire - Other | 3 | $17,960 | $71,840 | 0 | $0 |
| Solid Waste Management | 2 | $15,751 | $94,506 | 0 | $0 |
| Totals for Government | 501 | $3,801,977 | $91,065 | 153 | $361,032 |
Champaign government finances - Expenditure in 2021 (per resident):
- Construction - General - Other: $6,902,000 ($77.34)
Libraries: $1,000 ($0.01)
- Current Operations - Police Protection: $25,337,000 ($283.92)
Local Fire Protection: $20,809,000 ($233.18)
Central Staff Services: $14,981,000 ($167.87)
Libraries: $7,993,000 ($89.57)
Regular Highways: $7,143,000 ($80.04)
Public Welfare - Other: $4,017,000 ($45.01)
Parking Facilities: $2,214,000 ($24.81)
Sewerage: $1,841,000 ($20.63)
Financial Administration: $1,574,000 ($17.64)
General - Other: $1,566,000 ($17.55)
Solid Waste Management: $616,000 ($6.90)
- General - Interest on Debt: $7,379,000 ($82.69)
- Intergovernmental to Local - Other - General - Other: $920,000 ($10.31)
- Other Capital Outlay - Regular Highways: $8,120,000 ($90.99)
Central Staff Services: $2,666,000 ($29.87)
Libraries: $1,471,000 ($16.48)
Local Fire Protection: $174,000 ($1.95)
Police Protection: $58,000 ($0.65)
- Total Salaries and Wages: $46,451,000 ($520.51)
Champaign government finances - Revenue in 2021 (per resident):
- Charges - Sewerage: $2,317,000 ($25.96)
Parking Facilities: $2,234,000 ($25.03)
Other: $1,646,000 ($18.44)
Solid Waste Management: $637,000 ($7.14)
Parks and Recreation: $104,000 ($1.17)
- Local Intergovernmental - Other: $10,608,000 ($118.87)
- Miscellaneous - General Revenue - Other: $1,467,000 ($16.44)
Fines and Forfeits: $604,000 ($6.77)
Interest Earnings: $470,000 ($5.27)
- State Intergovernmental - General Local Government Support: $34,681,000 ($388.62)
Highways: $4,664,000 ($52.26)
- Tax - Property: $30,199,000 ($338.40)
General Sales and Gross Receipts: $19,760,000 ($221.42)
Other Selective Sales: $10,212,000 ($114.43)
Other License: $5,781,000 ($64.78)
Public Utilities Sales: $4,963,000 ($55.61)
Champaign government finances - Debt in 2021 (per resident):
- Long Term Debt - Beginning Outstanding - Unspecified Public Purpose: $184,476,000 ($2067.17)
Outstanding Unspecified Public Purpose: $126,682,000 ($1419.55)
Retired Unspecified Public Purpose: $59,845,000 ($670.60)
Issue, Unspecified Public Purpose: $2,052,000 ($22.99)
Champaign government finances - Cash and Securities in 2021 (per resident):
- Other Funds - Cash and Securities: $121,368,000 ($1360.00)
| Businesses in Champaign, IL | ||||
| Name | Count | Name | Count | |
|---|---|---|---|---|
| AT&T | 2 | La-Z-Boy | 2 | |
| Abercrombie & Fitch | 1 | LensCrafters | 1 | |
| Advance Auto Parts | 2 | Little Caesars Pizza | 1 | |
| Aeropostale | 1 | Long John Silver's | 1 | |
| American Eagle Outfitters | 1 | Lowe's | 1 | |
| Ann Taylor | 1 | Macy's | 1 | |
| Applebee's | 1 | Marriott | 2 | |
| Arby's | 3 | MasterBrand Cabinets | 11 | |
| Ashley Furniture | 1 | Maurices | 1 | |
| AutoZone | 2 | McDonald's | 5 | |
| Banana Republic | 1 | Meijer | 1 | |
| Barnes & Noble | 1 | Men's Wearhouse | 1 | |
| Baskin-Robbins | 1 | Menards | 1 | |
| Bath & Body Works | 1 | Microtel | 1 | |
| Baymont Inn | 1 | Motherhood Maternity | 3 | |
| Bed Bath & Beyond | 1 | New Balance | 2 | |
| Blockbuster | 1 | Nike | 18 | |
| Buffalo Wild Wings | 1 | Nissan | 1 | |
| Burger King | 2 | Office Depot | 1 | |
| CVS | 2 | Old Navy | 1 | |
| Caribou Coffee | 3 | Olive Garden | 1 | |
| Carson Pirie Scott | 1 | Outback | 1 | |
| Casual Male XL | 1 | Outback Steakhouse | 1 | |
| Catherines | 1 | Pac Sun | 1 | |
| Charlotte Russe | 1 | Panda Express | 2 | |
| Chevrolet | 1 | Panera Bread | 3 | |
| Chico's | 1 | Papa John's Pizza | 2 | |
| Chipotle | 1 | Payless | 2 | |
| Circle K | 7 | PetSmart | 1 | |
| Cold Stone Creamery | 1 | Pier 1 Imports | 1 | |
| Coldwater Creek | 1 | Pizza Hut | 2 | |
| Curves | 2 | Plato's Closet | 1 | |
| DHL | 2 | Qdoba Mexican Grill | 1 | |
| Dairy Queen | 1 | Quality | 1 | |
| Days Inn | 1 | Quiznos | 1 | |
| Decora Cabinetry | 1 | RadioShack | 1 | |
| Domino's Pizza | 3 | Red Lobster | 1 | |
| DressBarn | 1 | Red Roof Inn | 1 | |
| Dressbarn | 1 | Ruby Tuesday | 1 | |
| Dunkin Donuts | 3 | Ryan's Grill | 1 | |
| Eddie Bauer | 1 | SAS Shoes | 1 | |
| Express | 1 | SONIC Drive-In | 1 | |
| Extended Stay America | 1 | Sam's Club | 1 | |
| Fashion Bug | 1 | Sears | 2 | |
| FedEx | 12 | Sephora | 1 | |
| Finish Line | 1 | Shoe Carnival | 1 | |
| Foot Locker | 1 | Slumberland | 1 | |
| Ford | 1 | Spencer Gifts | 1 | |
| Forever 21 | 1 | Sprint Nextel | 4 | |
| GNC | 1 | Staples | 1 | |
| GameStop | 3 | Starbucks | 2 | |
| Gap | 1 | Steak 'n Shake | 2 | |
| Goodwill | 10 | Subway | 11 | |
| Gymboree | 1 | Super 8 | 1 | |
| H&R Block | 4 | T-Mobile | 4 | |
| Hardee's | 1 | T.G.I. Driday's | 1 | |
| Hawthorn | 1 | T.J.Maxx | 1 | |
| Hilton | 2 | Taco Bell | 4 | |
| Hobby Lobby | 1 | Talbots | 1 | |
| Holiday Inn | 1 | Target | 1 | |
| Hollister Co. | 1 | The Limited | 1 | |
| Home Depot | 1 | Toys"R"Us | 1 | |
| HomeTown Buffet | 1 | True Value | 1 | |
| Hot Topic | 1 | U-Haul | 3 | |
| Houlihan's | 1 | U.S. Cellular | 2 | |
| IHOP | 1 | UPS | 25 | |
| J. Jill | 1 | Urban Outfitters | 1 | |
| JCPenney | 1 | Vans | 2 | |
| Jimmy John's | 4 | Verizon Wireless | 1 | |
| JoS. A. Bank | 1 | Victoria's Secret | 1 | |
| Jones New York | 5 | Walgreens | 4 | |
| Journeys | 1 | Walmart | 1 | |
| Justice | 1 | Wendy's | 1 | |
| KFC | 1 | Wet Seal | 1 | |
| Kohl's | 1 | Wingate | 1 | |
| La Quinta | 1 | YMCA | 2 | |
Strongest AM radio stations in Champaign:
- WILL (580 AM; 5 kW; URBANA, IL; Owner: UNIV. OF ILLINOIS BOARD OF TRUSTEES)
- WDWS (1400 AM; 1 kW; CHAMPAIGN, IL; Owner: D.W.S., INC.)
- WBCP (1580 AM; 0 kW; URBANA, IL)
- WLS (890 AM; 50 kW; CHICAGO, IL; Owner: WLS, INC.)
- WIBC (1070 AM; 50 kW; INDIANAPOLIS, IN; Owner: EMMIS RADIO LICENSE CORPORATION)
- WSCR (670 AM; 50 kW; CHICAGO, IL; Owner: INFINITY BROADCASTING OPERATIONS, INC.)
- WYLL (1160 AM; 50 kW; CHICAGO, IL; Owner: SCA LICENSE CORPORATION)
- WGN (720 AM; 50 kW; CHICAGO, IL; Owner: WGN CONTINENTAL BROADCASTING CO.)
- WBBM (780 AM; 50 kW; CHICAGO, IL; Owner: INFINITY BROADCASTING OPERATIONS, INC.)
- WMVP (1000 AM; 50 kW; CHICAGO, IL; Owner: ABC, INC.)
- KXEN (1010 AM; 50 kW; FESTUS-ST. LOUIS, MO; Owner: BDJ RADIO ENTERPRISES, LLC)
- WLBH (1170 AM; daytime; 5 kW; MATTOON, IL; Owner: MATTOON BROADCASTING COMPANY)
- KMOX (1120 AM; 50 kW; ST. LOUIS, MO; Owner: INFINITY BROADCASTING OPERATIONS, INC.)
Strongest FM radio stations in Champaign:
- WLRW (94.5 FM; CHAMPAIGN, IL; Owner: SAGA COMMUNICATIONS OF ILLINOIS, LLC)
- WPCD (88.7 FM; CHAMPAIGN, IL; Owner: PARKLAND COLLEGE)
- WPGU (107.1 FM; URBANA, IL; Owner: ILLINI MEDIA COMPANY)
- WHMS-FM (97.5 FM; CHAMPAIGN, IL; Owner: D.W.S., INC.)
- WEFT (90.1 FM; CHAMPAIGN, IL; Owner: WEFT/PRAIRIE AIR, INC.)
- WGKC (105.9 FM; MAHOMET, IL; Owner: AAA ENTERTAINMENT LICENSING LLC)
- WQQB (96.1 FM; RANTOUL, IL; Owner: AAA ENTERTAINMENT LICENSING LLC)
- WBGL (91.7 FM; CHAMPAIGN, IL; Owner: ILLINOIS BIBLE INSTITUTE,INC)
- WKIO (92.5 FM; URBANA, IL; Owner: SAGA COMMUNICATIONS OF ILLINOIS, LLC)
- WIXY (100.3 FM; CHAMPAIGN, IL; Owner: SAGA COMMUNICATIONS OF ILLINOIS, LLC)
- WEVX (95.3 FM; RANTOUL, IL; Owner: AAA ENTERTAINMENT LICENSING LLC)
- WILL-FM (90.9 FM; URBANA, IL; Owner: UNIV. OF ILLINOIS BOARD OF TRUSTEES)
- W266AF (101.1 FM; URBANA, IL; Owner: THE BD OF TRUSTEES OF UNIV. OF IL)
- WGNJ (89.3 FM; ST. JOSEPH, IL; Owner: GOOD NEWS RADIO, INC.)
- WEBX (93.5 FM; TUSCOLA, IL; Owner: AAA ENTERTAINMENT LICENSING LLC)
- WGNN (102.5 FM; FISHER, IL; Owner: GOOD NEWS RADIO, INC)
- WCZQ (105.5 FM; MONTICELLO, IL; Owner: NM LICENSING, LLC)
- WXLS (99.1 FM; DANVILLE, IL; Owner: I.A.I. BROADCASTING, INC.)
- WWHP (98.3 FM; FARMER CITY, IL; Owner: WMS1, INC.)
- W201CK (88.1 FM; CHAMPAIGN, IL; Owner: PENSACOLA CHRISTIAN COLLEGE, INC.)
TV broadcast stations around Champaign:
- WBXC-CA (Channel 46; CHAMPAIGN/URBANA, IL; Owner: THE BOX WORLDWIDE LLC)
- W32CM (Channel 32; CHAMPAIGN, IL; Owner: VENTANA TELEVISION, INC.)
- W52BR (Channel 52; CHAMPAIGN-URBANA, IL; Owner: MARCIA COHEN)
- WCIA (Channel 3; CHAMPAIGN, IL; Owner: NEXSTAR BROADCASTING OF CHAMPAIGN, L.L.C.)
- W07DD (Channel 7; CHAMPAIGN, IL; Owner: THREE ANGELS BROADCASTING NETWORK)
- W58DA (Channel 58; CHAMPAIGN, IL; Owner: TRINITY BROADCASTING NETWORK)
- WICD (Channel 15; CHAMPAIGN, IL; Owner: WICD LICENSEE, LLC)
- WILL-TV (Channel 12; URBANA, IL; Owner: UNIV. OF ILLINOIS BD. OF TRUSTEES)
- WBUI (Channel 23; DECATUR, IL; Owner: ACME TV LICENSES OF ILLINOIS, LLC)
- WAND (Channel 17; DECATUR, IL; Owner: WAND(TV) PARTNERSHIP)
- W34CD (Channel 34; QUINCY, IL; Owner: MS COMMUNICATIONS, LLC)
- WCCU (Channel 27; URBANA, IL; Owner: URBANA-CHAMPAIGN BROADCASTING PARTNERS)
- National Bridge Inventory (NBI) Statistics
- 128Number of bridges
- 994ft / 303mTotal length
- $5,142,000Total costs
- 1,456,725Total average daily traffic
- 285,480Total average daily truck traffic
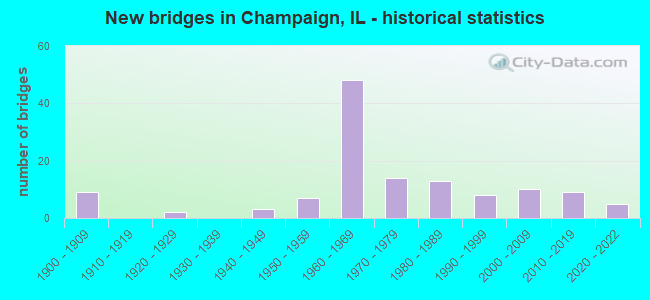
- New bridges - historical statistics
- 91900-1909
- 21920-1929
- 31940-1949
- 71950-1959
- 481960-1969
- 141970-1979
- 131980-1989
- 81990-1999
- 102000-2009
- 92010-2019
- 52020-2022
FCC Registered Antenna Towers: 259 (See the full list of FCC Registered Antenna Towers)
FCC Registered Commercial Land Mobile Towers: 7 (See the full list of FCC Registered Commercial Land Mobile Towers in Champaign, IL)
FCC Registered Private Land Mobile Towers: 10 (See the full list of FCC Registered Private Land Mobile Towers)
FCC Registered Broadcast Land Mobile Towers: 69 (See the full list of FCC Registered Broadcast Land Mobile Towers)
FCC Registered Microwave Towers: 83 (See the full list of FCC Registered Microwave Towers in this town)
FCC Registered Paging Towers: 14 (See the full list of FCC Registered Paging Towers)
FCC Registered Maritime Coast & Aviation Ground Towers: 9 (See the full list of FCC Registered Maritime Coast & Aviation Ground Towers)
FCC Registered Amateur Radio Licenses: 432 (See the full list of FCC Registered Amateur Radio Licenses in Champaign)
FAA Registered Aircraft: 65 (See the full list of FAA Registered Aircraft in Champaign)
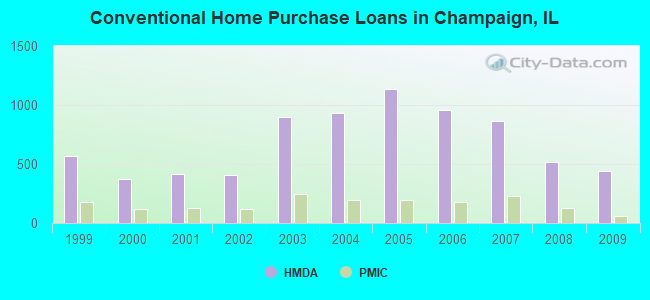
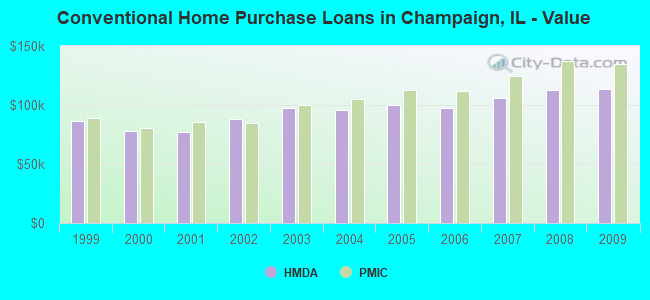
| Home Mortgage Disclosure Act Aggregated Statistics For Year 2009 (Based on 9 full and 9 partial tracts) | ||||||||||||||
| A) FHA, FSA/RHS & VA Home Purchase Loans | B) Conventional Home Purchase Loans | C) Refinancings | D) Home Improvement Loans | E) Loans on Dwellings For 5+ Families | F) Non-occupant Loans on < 5 Family Dwellings (A B C & D) | G) Loans On Manufactured Home Dwelling (A B C & D) | ||||||||
|---|---|---|---|---|---|---|---|---|---|---|---|---|---|---|
| Number | Average Value | Number | Average Value | Number | Average Value | Number | Average Value | Number | Average Value | Number | Average Value | Number | Average Value | |
| LOANS ORIGINATED | 197 | $123,077 | 443 | $113,556 | 1,338 | $131,374 | 83 | $63,760 | 57 | $1,106,190 | 300 | $117,106 | 0 | $0 |
| APPLICATIONS APPROVED, NOT ACCEPTED | 6 | $128,148 | 15 | $129,961 | 103 | $129,149 | 8 | $77,760 | 0 | $0 | 7 | $115,016 | 1 | $51,150 |
| APPLICATIONS DENIED | 21 | $107,969 | 32 | $98,676 | 213 | $113,342 | 28 | $42,329 | 0 | $0 | 25 | $95,087 | 1 | $6,000 |
| APPLICATIONS WITHDRAWN | 7 | $109,169 | 13 | $115,599 | 137 | $127,564 | 2 | $63,410 | 0 | $0 | 17 | $103,520 | 0 | $0 |
| FILES CLOSED FOR INCOMPLETENESS | 2 | $133,735 | 8 | $164,204 | 40 | $146,940 | 1 | $180,000 | 0 | $0 | 1 | $127,000 | 0 | $0 |
Detailed mortgage data for all 18 tracts in Champaign, IL
| Private Mortgage Insurance Companies Aggregated Statistics For Year 2009 (Based on 7 full and 9 partial tracts) | ||||||
| A) Conventional Home Purchase Loans | B) Refinancings | C) Non-occupant Loans on < 5 Family Dwellings (A & B) | ||||
|---|---|---|---|---|---|---|
| Number | Average Value | Number | Average Value | Number | Average Value | |
| LOANS ORIGINATED | 56 | $134,449 | 56 | $147,176 | 1 | $59,000 |
| APPLICATIONS APPROVED, NOT ACCEPTED | 8 | $136,426 | 9 | $163,859 | 0 | $0 |
| APPLICATIONS DENIED | 4 | $126,750 | 8 | $124,279 | 1 | $96,210 |
| APPLICATIONS WITHDRAWN | 1 | $206,120 | 9 | $113,887 | 0 | $0 |
| FILES CLOSED FOR INCOMPLETENESS | 0 | $0 | 1 | $139,240 | 0 | $0 |
2002 - 2018 National Fire Incident Reporting System (NFIRS) incidents
- Fire incident types reported to NFIRS in Champaign, IL
- 2,10940.8%Structure Fires
- 2,01038.9%Outside Fires
- 67013.0%Mobile Property/Vehicle Fires
- 3747.2%Other
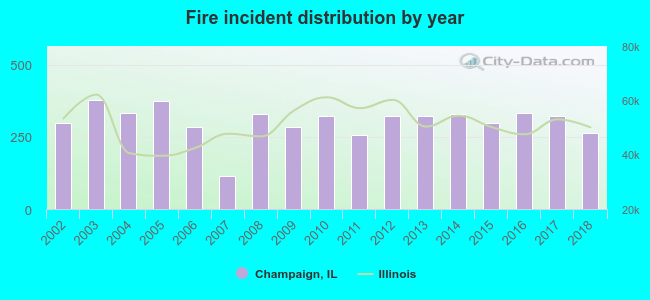 Based on the data from the years 2002 - 2018 the average number of fire incidents per year is 304. The highest number of fires - 377 took place in 2003, and the least - 113 in 2007. The data has a dropping trend.
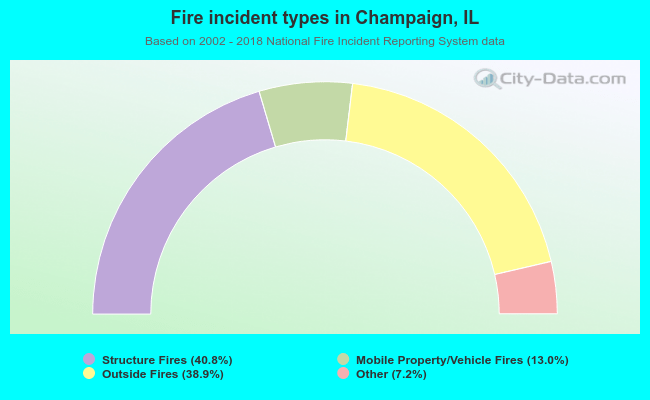 When looking into fire subcategories, the most incidents belonged to: Structure Fires (40.8%), and Outside Fires (38.9%).
Fire-safe hotels and motels in Champaign, Illinois:
- Raddisson Suite Hotel Champaign Urbana, 101 Trade CTR Dr, Champaign, Illinois 61820 , Phone: (217) 398-3400, Fax: (217) 398-6147
- La Quinta Inn #553 Champaign, 1900 Center Dr, Champaign, Illinois 61820 , Phone: (217) 356-4000, Fax: (217) 352-7783
- Baymont Inn & Suites, 302 W Anthony Dr, Champaign, Illinois 61822 , Phone: (217) 356-8900, Fax: (217) 356-9253
- Super 8 Motel, 202 Marketview Dr, Champaign, Illinois 61820 , Phone: (217) 359-2388
- Comfort Inn, 305 Marketview Dr, Champaign, Illinois 61821 , Phone: (217) 352-4055, Fax: (217) 352-4055
- Holiday Inn Champaign, 1505 N Neil, Champaign, Illinois 61820 , Phone: (217) 359-1601, Fax: (217) 359-2062
- Days Inn Champaign, 1019 Bloomington Rd, Champaign, Illinois 61821 , Phone: (217) 356-6873, Fax: (217) 356-6950
- Hilton Garden Inn-Champaign/Urbana, 1501 S Neil St, Champaign, Illinois 61820 , Phone: (217) 352-9970, Fax: (217) 398-5763
- 15 other hotels and motels
| Most common first names in Champaign, IL among deceased individuals | ||
| Name | Count | Lived (average) |
|---|---|---|
| Mary | 338 | 80.2 years |
| John | 327 | 73.6 years |
| William | 298 | 75.9 years |
| Robert | 277 | 71.4 years |
| James | 252 | 70.7 years |
| Charles | 211 | 74.6 years |
| George | 159 | 75.6 years |
| Dorothy | 157 | 78.9 years |
| Helen | 155 | 81.7 years |
| Margaret | 145 | 80.0 years |
| Most common last names in Champaign, IL among deceased individuals | ||
| Last name | Count | Lived (average) |
|---|---|---|
| Smith | 161 | 74.4 years |
| Johnson | 117 | 74.7 years |
| Brown | 93 | 71.7 years |
| Williams | 90 | 71.8 years |
| Jones | 90 | 71.8 years |
| Miller | 75 | 77.7 years |
| Anderson | 62 | 79.6 years |
| Wilson | 62 | 75.3 years |
| Davis | 57 | 76.0 years |
| Jackson | 55 | 78.0 years |
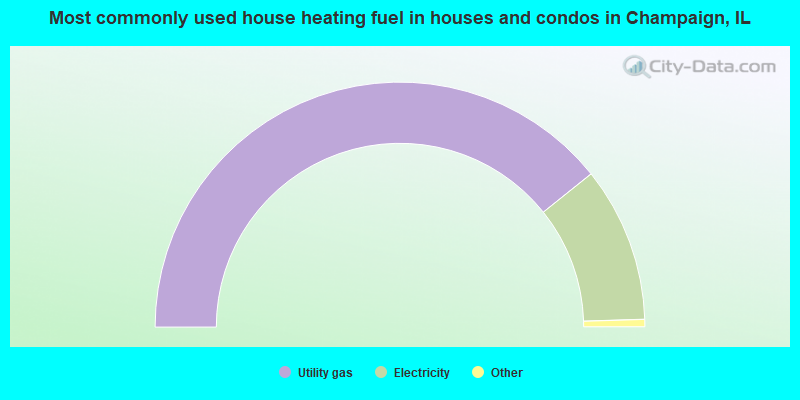
- 78.6%Utility gas
- 20.5%Electricity
- 0.5%Bottled, tank, or LP gas
- 0.2%Fuel oil, kerosene, etc.
- 0.2%Other fuel
- 0.1%No fuel used
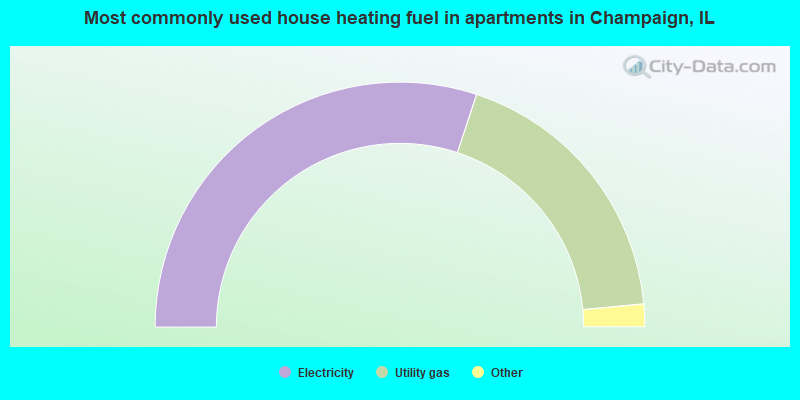
- 60.2%Electricity
- 36.9%Utility gas
- 1.2%Bottled, tank, or LP gas
- 0.9%Other fuel
- 0.6%No fuel used
- 0.1%Fuel oil, kerosene, etc.
Champaign compared to Illinois state average:
- Unemployed percentage below state average.
- Black race population percentage above state average.
- Hispanic race population percentage below state average.
- Median age significantly below state average.
- Foreign-born population percentage above state average.
- Renting percentage above state average.
- House age below state average.
- Number of college students significantly above state average.
- Percentage of population with a bachelor's degree or higher above state average.
Champaign on our top lists:
- #5 on the list of "Top 101 cities with the largest wind speed differences during a year (population 50,000+)"
- #7 on the list of "Top 101 cities with largest percentage of males in occupations: education, training, and library occupations (population 50,000+)"
- #8 on the list of "Top 101 cities with largest percentage of females in occupations: education, training, and library occupations (population 50,000+)"
- #8 on the list of "Top 101 cities with largest percentage of females in industries: educational services (population 50,000+)"
- #9 on the list of "Top 101 cities with largest percentage of males in industries: educational services (population 50,000+)"
- #11 on the list of "Top 101 cities with the most full-time local library workers per 1000 residents (population 5,000+)"
- #15 on the list of "Top 100 cities with shortest commuting times (pop. 50,000+)"
- #18 on the list of "Top 101 cities with largest percentage of males in occupations: healthcare support occupations (population 50,000+)"
- #18 on the list of "Top 100 cities with youngest residents (pop. 50,000+)"
- #20 on the list of "Top 100 cities with highest percentage of college students (pop. 50,000+)"
- #26 on the list of "Top 101 cities with the most people having Doctorate degrees (population 50,000+)"
- #33 on the list of "Top 101 cities with largest percentage of females in occupations: health technologists and technicians (population 50,000+)"
- #33 on the list of "Top 101 cities with the highest ratio of rapes to murders between 2002 and 2012 (population 50,000+)"
- #38 on the list of "Top 100 cities with the largest percentage of males (pop. 50,000+)"
- #40 on the list of "Top 101 cities with largest percentage of males in occupations: food preparation and serving related occupations (population 50,000+)"
- #43 on the list of "Top 101 cities with the highest number of assaults per 100,000 residents, excludes tourist destinations and others with a lot of outsiders visiting based on city industries data (population 50,000+)"
- #47 on the list of "Top 100 cities with strongest arts, entertainment, recreation, accommodation and food services industries (pop. 50,000+)"
- #49 on the list of "Top 101 cities with largest percentage of males in industries: health care and social assistance (population 50,000+)"
- #49 on the list of "Top 101 cities where the highest percentage of males (15+ years) which never married (with at least 10,000 males in this group)"
- #52 on the list of "Top 101 cities with largest percentage of males in occupations: health diagnosing and treating practitioners and other technical occupations (population 50,000+)"
- #83 (61820) on the list of "Top 101 zip codes with the most alcohol drinking places in 2005"
- #37 on the list of "Top 101 counties with the largest number of people moving out compared to moving in (pop. 50,000+)"
- #49 on the list of "Top 101 counties with highest percentage of residents voting for 3rd party candidates in the 2012 Presidential Election (pop. 50,000+)"
- #58 on the list of "Top 101 counties with the largest decrease in the number of deaths per 1000 residents 2000-2006 to 2007-2013 (pop. 50,000+)"
- #79 on the list of "Top 101 counties with the highest percentage of residents relocating to foreign countries in 2011 (pop. 50,000+)"
- #80 on the list of "Top 101 counties with the lowest number of deaths per 1000 residents 2007-2013 (pop. 50,000+)"

|
|
Total of 1697 patent applications in 2008-2024.