Charlotte, Michigan Submit your own pictures of this city and show them to the world
OSM Map
General Map
Google Map
MSN Map
OSM Map
General Map
Google Map
MSN Map
OSM Map
General Map
Google Map
MSN Map
OSM Map
General Map
Google Map
MSN Map
Please wait while loading the map...
Population in 2022: 9,260 (97% urban, 3% rural). Population change since 2000: +10.4%Males: 4,622 Females: 4,638
March 2022 cost of living index in Charlotte: 82.9 (low, U.S. average is 100) Percentage of residents living in poverty in 2022: 9.7%for White Non-Hispanic residents , 20.6% for Hispanic or Latino residents , 100.0% for American Indian residents , 57.9% for other race residents , 26.6% for two or more races residents )
Profiles of local businesses
Business Search - 14 Million verified businesses
Data:
Median household income ($)
Median household income (% change since 2000)
Household income diversity
Ratio of average income to average house value (%)
Ratio of average income to average rent
Median household income ($) - White
Median household income ($) - Black or African American
Median household income ($) - Asian
Median household income ($) - Hispanic or Latino
Median household income ($) - American Indian and Alaska Native
Median household income ($) - Multirace
Median household income ($) - Other Race
Median household income for houses/condos with a mortgage ($)
Median household income for apartments without a mortgage ($)
Races - White alone (%)
Races - White alone (% change since 2000)
Races - Black alone (%)
Races - Black alone (% change since 2000)
Races - American Indian alone (%)
Races - American Indian alone (% change since 2000)
Races - Asian alone (%)
Races - Asian alone (% change since 2000)
Races - Hispanic (%)
Races - Hispanic (% change since 2000)
Races - Native Hawaiian and Other Pacific Islander alone (%)
Races - Native Hawaiian and Other Pacific Islander alone (% change since 2000)
Races - Two or more races (%)
Races - Two or more races (% change since 2000)
Races - Other race alone (%)
Races - Other race alone (% change since 2000)
Racial diversity
Unemployment (%)
Unemployment (% change since 2000)
Unemployment (%) - White
Unemployment (%) - Black or African American
Unemployment (%) - Asian
Unemployment (%) - Hispanic or Latino
Unemployment (%) - American Indian and Alaska Native
Unemployment (%) - Multirace
Unemployment (%) - Other Race
Population density (people per square mile)
Population - Males (%)
Population - Females (%)
Population - Males (%) - White
Population - Males (%) - Black or African American
Population - Males (%) - Asian
Population - Males (%) - Hispanic or Latino
Population - Males (%) - American Indian and Alaska Native
Population - Males (%) - Multirace
Population - Males (%) - Other Race
Population - Females (%) - White
Population - Females (%) - Black or African American
Population - Females (%) - Asian
Population - Females (%) - Hispanic or Latino
Population - Females (%) - American Indian and Alaska Native
Population - Females (%) - Multirace
Population - Females (%) - Other Race
Coronavirus confirmed cases (Apr 27, 2024)
Deaths caused by coronavirus (Apr 27, 2024)
Coronavirus confirmed cases (per 100k population) (Apr 27, 2024)
Deaths caused by coronavirus (per 100k population) (Apr 27, 2024)
Daily increase in number of cases (Apr 27, 2024)
Weekly increase in number of cases (Apr 27, 2024)
Cases doubled (in days) (Apr 27, 2024)
Hospitalized patients (Apr 18, 2022)
Negative test results (Apr 18, 2022)
Total test results (Apr 18, 2022)
COVID Vaccine doses distributed (per 100k population) (Sep 19, 2023)
COVID Vaccine doses administered (per 100k population) (Sep 19, 2023)
COVID Vaccine doses distributed (Sep 19, 2023)
COVID Vaccine doses administered (Sep 19, 2023)
Likely homosexual households (%)
Likely homosexual households (% change since 2000)
Likely homosexual households - Lesbian couples (%)
Likely homosexual households - Lesbian couples (% change since 2000)
Likely homosexual households - Gay men (%)
Likely homosexual households - Gay men (% change since 2000)
Cost of living index
Median gross rent ($)
Median contract rent ($)
Median monthly housing costs ($)
Median house or condo value ($)
Median house or condo value ($ change since 2000)
Mean house or condo value by units in structure - 1, detached ($)
Mean house or condo value by units in structure - 1, attached ($)
Mean house or condo value by units in structure - 2 ($)
Mean house or condo value by units in structure by units in structure - 3 or 4 ($)
Mean house or condo value by units in structure - 5 or more ($)
Mean house or condo value by units in structure - Boat, RV, van, etc. ($)
Mean house or condo value by units in structure - Mobile home ($)
Median house or condo value ($) - White
Median house or condo value ($) - Black or African American
Median house or condo value ($) - Asian
Median house or condo value ($) - Hispanic or Latino
Median house or condo value ($) - American Indian and Alaska Native
Median house or condo value ($) - Multirace
Median house or condo value ($) - Other Race
Median resident age
Resident age diversity
Median resident age - Males
Median resident age - Females
Median resident age - White
Median resident age - Black or African American
Median resident age - Asian
Median resident age - Hispanic or Latino
Median resident age - American Indian and Alaska Native
Median resident age - Multirace
Median resident age - Other Race
Median resident age - Males - White
Median resident age - Males - Black or African American
Median resident age - Males - Asian
Median resident age - Males - Hispanic or Latino
Median resident age - Males - American Indian and Alaska Native
Median resident age - Males - Multirace
Median resident age - Males - Other Race
Median resident age - Females - White
Median resident age - Females - Black or African American
Median resident age - Females - Asian
Median resident age - Females - Hispanic or Latino
Median resident age - Females - American Indian and Alaska Native
Median resident age - Females - Multirace
Median resident age - Females - Other Race
Commute - mean travel time to work (minutes)
Travel time to work - Less than 5 minutes (%)
Travel time to work - Less than 5 minutes (% change since 2000)
Travel time to work - 5 to 9 minutes (%)
Travel time to work - 5 to 9 minutes (% change since 2000)
Travel time to work - 10 to 19 minutes (%)
Travel time to work - 10 to 19 minutes (% change since 2000)
Travel time to work - 20 to 29 minutes (%)
Travel time to work - 20 to 29 minutes (% change since 2000)
Travel time to work - 30 to 39 minutes (%)
Travel time to work - 30 to 39 minutes (% change since 2000)
Travel time to work - 40 to 59 minutes (%)
Travel time to work - 40 to 59 minutes (% change since 2000)
Travel time to work - 60 to 89 minutes (%)
Travel time to work - 60 to 89 minutes (% change since 2000)
Travel time to work - 90 or more minutes (%)
Travel time to work - 90 or more minutes (% change since 2000)
Marital status - Never married (%)
Marital status - Now married (%)
Marital status - Separated (%)
Marital status - Widowed (%)
Marital status - Divorced (%)
Median family income ($)
Median family income (% change since 2000)
Median non-family income ($)
Median non-family income (% change since 2000)
Median per capita income ($)
Median per capita income (% change since 2000)
Median family income ($) - White
Median family income ($) - Black or African American
Median family income ($) - Asian
Median family income ($) - Hispanic or Latino
Median family income ($) - American Indian and Alaska Native
Median family income ($) - Multirace
Median family income ($) - Other Race
Median year house/condo built
Median year apartment built
Year house built - Built 2005 or later (%)
Year house built - Built 2000 to 2004 (%)
Year house built - Built 1990 to 1999 (%)
Year house built - Built 1980 to 1989 (%)
Year house built - Built 1970 to 1979 (%)
Year house built - Built 1960 to 1969 (%)
Year house built - Built 1950 to 1959 (%)
Year house built - Built 1940 to 1949 (%)
Year house built - Built 1939 or earlier (%)
Average household size
Household density (households per square mile)
Average household size - White
Average household size - Black or African American
Average household size - Asian
Average household size - Hispanic or Latino
Average household size - American Indian and Alaska Native
Average household size - Multirace
Average household size - Other Race
Occupied housing units (%)
Vacant housing units (%)
Owner occupied housing units (%)
Renter occupied housing units (%)
Vacancy status - For rent (%)
Vacancy status - For sale only (%)
Vacancy status - Rented or sold, not occupied (%)
Vacancy status - For seasonal, recreational, or occasional use (%)
Vacancy status - For migrant workers (%)
Vacancy status - Other vacant (%)
Residents with income below the poverty level (%)
Residents with income below 50% of the poverty level (%)
Children below poverty level (%)
Poor families by family type - Married-couple family (%)
Poor families by family type - Male, no wife present (%)
Poor families by family type - Female, no husband present (%)
Poverty status for native-born residents (%)
Poverty status for foreign-born residents (%)
Poverty among high school graduates not in families (%)
Poverty among people who did not graduate high school not in families (%)
Residents with income below the poverty level (%) - White
Residents with income below the poverty level (%) - Black or African American
Residents with income below the poverty level (%) - Asian
Residents with income below the poverty level (%) - Hispanic or Latino
Residents with income below the poverty level (%) - American Indian and Alaska Native
Residents with income below the poverty level (%) - Multirace
Residents with income below the poverty level (%) - Other Race
Air pollution - Air Quality Index (AQI)
Air pollution - CO
Air pollution - NO2
Air pollution - SO2
Air pollution - Ozone
Air pollution - PM10
Air pollution - PM25
Air pollution - Pb
Crime - Murders per 100,000 population
Crime - Rapes per 100,000 population
Crime - Robberies per 100,000 population
Crime - Assaults per 100,000 population
Crime - Burglaries per 100,000 population
Crime - Thefts per 100,000 population
Crime - Auto thefts per 100,000 population
Crime - Arson per 100,000 population
Crime - City-data.com crime index
Crime - Violent crime index
Crime - Property crime index
Crime - Murders per 100,000 population (5 year average)
Crime - Rapes per 100,000 population (5 year average)
Crime - Robberies per 100,000 population (5 year average)
Crime - Assaults per 100,000 population (5 year average)
Crime - Burglaries per 100,000 population (5 year average)
Crime - Thefts per 100,000 population (5 year average)
Crime - Auto thefts per 100,000 population (5 year average)
Crime - Arson per 100,000 population (5 year average)
Crime - City-data.com crime index (5 year average)
Crime - Violent crime index (5 year average)
Crime - Property crime index (5 year average)
1996 Presidential Elections Results (%) - Democratic Party (Clinton)
1996 Presidential Elections Results (%) - Republican Party (Dole)
1996 Presidential Elections Results (%) - Other
2000 Presidential Elections Results (%) - Democratic Party (Gore)
2000 Presidential Elections Results (%) - Republican Party (Bush)
2000 Presidential Elections Results (%) - Other
2004 Presidential Elections Results (%) - Democratic Party (Kerry)
2004 Presidential Elections Results (%) - Republican Party (Bush)
2004 Presidential Elections Results (%) - Other
2008 Presidential Elections Results (%) - Democratic Party (Obama)
2008 Presidential Elections Results (%) - Republican Party (McCain)
2008 Presidential Elections Results (%) - Other
2012 Presidential Elections Results (%) - Democratic Party (Obama)
2012 Presidential Elections Results (%) - Republican Party (Romney)
2012 Presidential Elections Results (%) - Other
2016 Presidential Elections Results (%) - Democratic Party (Clinton)
2016 Presidential Elections Results (%) - Republican Party (Trump)
2016 Presidential Elections Results (%) - Other
2020 Presidential Elections Results (%) - Democratic Party (Biden)
2020 Presidential Elections Results (%) - Republican Party (Trump)
2020 Presidential Elections Results (%) - Other
Ancestries Reported - Arab (%)
Ancestries Reported - Czech (%)
Ancestries Reported - Danish (%)
Ancestries Reported - Dutch (%)
Ancestries Reported - English (%)
Ancestries Reported - French (%)
Ancestries Reported - French Canadian (%)
Ancestries Reported - German (%)
Ancestries Reported - Greek (%)
Ancestries Reported - Hungarian (%)
Ancestries Reported - Irish (%)
Ancestries Reported - Italian (%)
Ancestries Reported - Lithuanian (%)
Ancestries Reported - Norwegian (%)
Ancestries Reported - Polish (%)
Ancestries Reported - Portuguese (%)
Ancestries Reported - Russian (%)
Ancestries Reported - Scotch-Irish (%)
Ancestries Reported - Scottish (%)
Ancestries Reported - Slovak (%)
Ancestries Reported - Subsaharan African (%)
Ancestries Reported - Swedish (%)
Ancestries Reported - Swiss (%)
Ancestries Reported - Ukrainian (%)
Ancestries Reported - United States (%)
Ancestries Reported - Welsh (%)
Ancestries Reported - West Indian (%)
Ancestries Reported - Other (%)
Educational Attainment - No schooling completed (%)
Educational Attainment - Less than high school (%)
Educational Attainment - High school or equivalent (%)
Educational Attainment - Less than 1 year of college (%)
Educational Attainment - 1 or more years of college (%)
Educational Attainment - Associate degree (%)
Educational Attainment - Bachelor's degree (%)
Educational Attainment - Master's degree (%)
Educational Attainment - Professional school degree (%)
Educational Attainment - Doctorate degree (%)
School Enrollment - Nursery, preschool (%)
School Enrollment - Kindergarten (%)
School Enrollment - Grade 1 to 4 (%)
School Enrollment - Grade 5 to 8 (%)
School Enrollment - Grade 9 to 12 (%)
School Enrollment - College undergrad (%)
School Enrollment - Graduate or professional (%)
School Enrollment - Not enrolled in school (%)
School enrollment - Public schools (%)
School enrollment - Private schools (%)
School enrollment - Not enrolled (%)
Median number of rooms in houses and condos
Median number of rooms in apartments
Housing units lacking complete plumbing facilities (%)
Housing units lacking complete kitchen facilities (%)
Density of houses
Urban houses (%)
Rural houses (%)
Households with people 60 years and over (%)
Households with people 65 years and over (%)
Households with people 75 years and over (%)
Households with one or more nonrelatives (%)
Households with no nonrelatives (%)
Population in households (%)
Family households (%)
Nonfamily households (%)
Population in families (%)
Family households with own children (%)
Median number of bedrooms in owner occupied houses
Mean number of bedrooms in owner occupied houses
Median number of bedrooms in renter occupied houses
Mean number of bedrooms in renter occupied houses
Median number of vehichles in owner occupied houses
Mean number of vehichles in owner occupied houses
Median number of vehichles in renter occupied houses
Mean number of vehichles in renter occupied houses
Mortgage status - with mortgage (%)
Mortgage status - with second mortgage (%)
Mortgage status - with home equity loan (%)
Mortgage status - with both second mortgage and home equity loan (%)
Mortgage status - without a mortgage (%)
Average family size
Average family size - White
Average family size - Black or African American
Average family size - Asian
Average family size - Hispanic or Latino
Average family size - American Indian and Alaska Native
Average family size - Multirace
Average family size - Other Race
Geographical mobility - Same house 1 year ago (%)
Geographical mobility - Moved within same county (%)
Geographical mobility - Moved from different county within same state (%)
Geographical mobility - Moved from different state (%)
Geographical mobility - Moved from abroad (%)
Place of birth - Born in state of residence (%)
Place of birth - Born in other state (%)
Place of birth - Native, outside of US (%)
Place of birth - Foreign born (%)
Housing units in structures - 1, detached (%)
Housing units in structures - 1, attached (%)
Housing units in structures - 2 (%)
Housing units in structures - 3 or 4 (%)
Housing units in structures - 5 to 9 (%)
Housing units in structures - 10 to 19 (%)
Housing units in structures - 20 to 49 (%)
Housing units in structures - 50 or more (%)
Housing units in structures - Mobile home (%)
Housing units in structures - Boat, RV, van, etc. (%)
House/condo owner moved in on average (years ago)
Renter moved in on average (years ago)
Year householder moved into unit - Moved in 1999 to March 2000 (%)
Year householder moved into unit - Moved in 1995 to 1998 (%)
Year householder moved into unit - Moved in 1990 to 1994 (%)
Year householder moved into unit - Moved in 1980 to 1989 (%)
Year householder moved into unit - Moved in 1970 to 1979 (%)
Year householder moved into unit - Moved in 1969 or earlier (%)
Means of transportation to work - Drove car alone (%)
Means of transportation to work - Carpooled (%)
Means of transportation to work - Public transportation (%)
Means of transportation to work - Bus or trolley bus (%)
Means of transportation to work - Streetcar or trolley car (%)
Means of transportation to work - Subway or elevated (%)
Means of transportation to work - Railroad (%)
Means of transportation to work - Ferryboat (%)
Means of transportation to work - Taxicab (%)
Means of transportation to work - Motorcycle (%)
Means of transportation to work - Bicycle (%)
Means of transportation to work - Walked (%)
Means of transportation to work - Other means (%)
Working at home (%)
Industry diversity
Most Common Industries - Agriculture, forestry, fishing and hunting, and mining (%)
Most Common Industries - Agriculture, forestry, fishing and hunting (%)
Most Common Industries - Mining, quarrying, and oil and gas extraction (%)
Most Common Industries - Construction (%)
Most Common Industries - Manufacturing (%)
Most Common Industries - Wholesale trade (%)
Most Common Industries - Retail trade (%)
Most Common Industries - Transportation and warehousing, and utilities (%)
Most Common Industries - Transportation and warehousing (%)
Most Common Industries - Utilities (%)
Most Common Industries - Information (%)
Most Common Industries - Finance and insurance, and real estate and rental and leasing (%)
Most Common Industries - Finance and insurance (%)
Most Common Industries - Real estate and rental and leasing (%)
Most Common Industries - Professional, scientific, and management, and administrative and waste management services (%)
Most Common Industries - Professional, scientific, and technical services (%)
Most Common Industries - Management of companies and enterprises (%)
Most Common Industries - Administrative and support and waste management services (%)
Most Common Industries - Educational services, and health care and social assistance (%)
Most Common Industries - Educational services (%)
Most Common Industries - Health care and social assistance (%)
Most Common Industries - Arts, entertainment, and recreation, and accommodation and food services (%)
Most Common Industries - Arts, entertainment, and recreation (%)
Most Common Industries - Accommodation and food services (%)
Most Common Industries - Other services, except public administration (%)
Most Common Industries - Public administration (%)
Occupation diversity
Most Common Occupations - Management, business, science, and arts occupations (%)
Most Common Occupations - Management, business, and financial occupations (%)
Most Common Occupations - Management occupations (%)
Most Common Occupations - Business and financial operations occupations (%)
Most Common Occupations - Computer, engineering, and science occupations (%)
Most Common Occupations - Computer and mathematical occupations (%)
Most Common Occupations - Architecture and engineering occupations (%)
Most Common Occupations - Life, physical, and social science occupations (%)
Most Common Occupations - Education, legal, community service, arts, and media occupations (%)
Most Common Occupations - Community and social service occupations (%)
Most Common Occupations - Legal occupations (%)
Most Common Occupations - Education, training, and library occupations (%)
Most Common Occupations - Arts, design, entertainment, sports, and media occupations (%)
Most Common Occupations - Healthcare practitioners and technical occupations (%)
Most Common Occupations - Health diagnosing and treating practitioners and other technical occupations (%)
Most Common Occupations - Health technologists and technicians (%)
Most Common Occupations - Service occupations (%)
Most Common Occupations - Healthcare support occupations (%)
Most Common Occupations - Protective service occupations (%)
Most Common Occupations - Fire fighting and prevention, and other protective service workers including supervisors (%)
Most Common Occupations - Law enforcement workers including supervisors (%)
Most Common Occupations - Food preparation and serving related occupations (%)
Most Common Occupations - Building and grounds cleaning and maintenance occupations (%)
Most Common Occupations - Personal care and service occupations (%)
Most Common Occupations - Sales and office occupations (%)
Most Common Occupations - Sales and related occupations (%)
Most Common Occupations - Office and administrative support occupations (%)
Most Common Occupations - Natural resources, construction, and maintenance occupations (%)
Most Common Occupations - Farming, fishing, and forestry occupations (%)
Most Common Occupations - Construction and extraction occupations (%)
Most Common Occupations - Installation, maintenance, and repair occupations (%)
Most Common Occupations - Production, transportation, and material moving occupations (%)
Most Common Occupations - Production occupations (%)
Most Common Occupations - Transportation occupations (%)
Most Common Occupations - Material moving occupations (%)
People in Group quarters - Institutionalized population (%)
People in Group quarters - Correctional institutions (%)
People in Group quarters - Federal prisons and detention centers (%)
People in Group quarters - Halfway houses (%)
People in Group quarters - Local jails and other confinement facilities (including police lockups) (%)
People in Group quarters - Military disciplinary barracks (%)
People in Group quarters - State prisons (%)
People in Group quarters - Other types of correctional institutions (%)
People in Group quarters - Nursing homes (%)
People in Group quarters - Hospitals/wards, hospices, and schools for the handicapped (%)
People in Group quarters - Hospitals/wards and hospices for chronically ill (%)
People in Group quarters - Hospices or homes for chronically ill (%)
People in Group quarters - Military hospitals or wards for chronically ill (%)
People in Group quarters - Other hospitals or wards for chronically ill (%)
People in Group quarters - Hospitals or wards for drug/alcohol abuse (%)
People in Group quarters - Mental (Psychiatric) hospitals or wards (%)
People in Group quarters - Schools, hospitals, or wards for the mentally retarded (%)
People in Group quarters - Schools, hospitals, or wards for the physically handicapped (%)
People in Group quarters - Institutions for the deaf (%)
People in Group quarters - Institutions for the blind (%)
People in Group quarters - Orthopedic wards and institutions for the physically handicapped (%)
People in Group quarters - Wards in general hospitals for patients who have no usual home elsewhere (%)
People in Group quarters - Wards in military hospitals for patients who have no usual home elsewhere (%)
People in Group quarters - Juvenile institutions (%)
People in Group quarters - Long-term care (%)
People in Group quarters - Homes for abused, dependent, and neglected children (%)
People in Group quarters - Residential treatment centers for emotionally disturbed children (%)
People in Group quarters - Training schools for juvenile delinquents (%)
People in Group quarters - Short-term care, detention or diagnostic centers for delinquent children (%)
People in Group quarters - Type of juvenile institution unknown (%)
People in Group quarters - Noninstitutionalized population (%)
People in Group quarters - College dormitories (includes college quarters off campus) (%)
People in Group quarters - Military quarters (%)
People in Group quarters - On base (%)
People in Group quarters - Barracks, unaccompanied personnel housing (UPH), (Enlisted/Officer), ;and similar group living quarters for military personnel (%)
People in Group quarters - Transient quarters for temporary residents (%)
People in Group quarters - Military ships (%)
People in Group quarters - Group homes (%)
People in Group quarters - Homes or halfway houses for drug/alcohol abuse (%)
People in Group quarters - Homes for the mentally ill (%)
People in Group quarters - Homes for the mentally retarded (%)
People in Group quarters - Homes for the physically handicapped (%)
People in Group quarters - Other group homes (%)
People in Group quarters - Religious group quarters (%)
People in Group quarters - Dormitories (%)
People in Group quarters - Agriculture workers' dormitories on farms (%)
People in Group quarters - Job Corps and vocational training facilities (%)
People in Group quarters - Other workers' dormitories (%)
People in Group quarters - Crews of maritime vessels (%)
People in Group quarters - Other nonhousehold living situations (%)
People in Group quarters - Other noninstitutional group quarters (%)
Residents speaking English at home (%)
Residents speaking English at home - Born in the United States (%)
Residents speaking English at home - Native, born elsewhere (%)
Residents speaking English at home - Foreign born (%)
Residents speaking Spanish at home (%)
Residents speaking Spanish at home - Born in the United States (%)
Residents speaking Spanish at home - Native, born elsewhere (%)
Residents speaking Spanish at home - Foreign born (%)
Residents speaking other language at home (%)
Residents speaking other language at home - Born in the United States (%)
Residents speaking other language at home - Native, born elsewhere (%)
Residents speaking other language at home - Foreign born (%)
Class of Workers - Employee of private company (%)
Class of Workers - Self-employed in own incorporated business (%)
Class of Workers - Private not-for-profit wage and salary workers (%)
Class of Workers - Local government workers (%)
Class of Workers - State government workers (%)
Class of Workers - Federal government workers (%)
Class of Workers - Self-employed workers in own not incorporated business and Unpaid family workers (%)
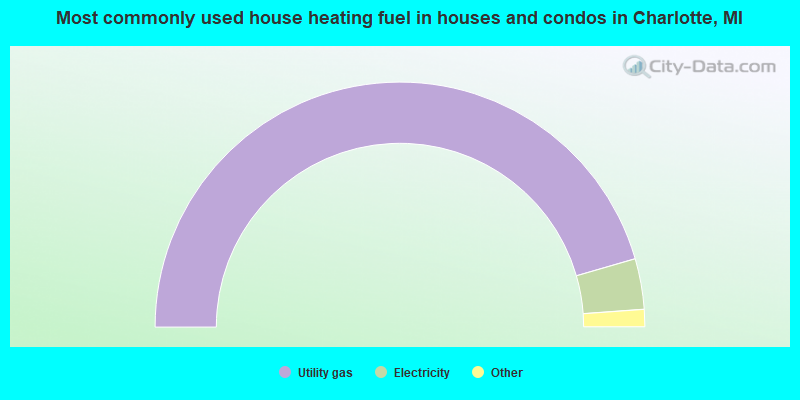
House heating fuel used in houses and condos - Utility gas (%)
House heating fuel used in houses and condos - Bottled, tank, or LP gas (%)
House heating fuel used in houses and condos - Electricity (%)
House heating fuel used in houses and condos - Fuel oil, kerosene, etc. (%)
House heating fuel used in houses and condos - Coal or coke (%)
House heating fuel used in houses and condos - Wood (%)
House heating fuel used in houses and condos - Solar energy (%)
House heating fuel used in houses and condos - Other fuel (%)
House heating fuel used in houses and condos - No fuel used (%)
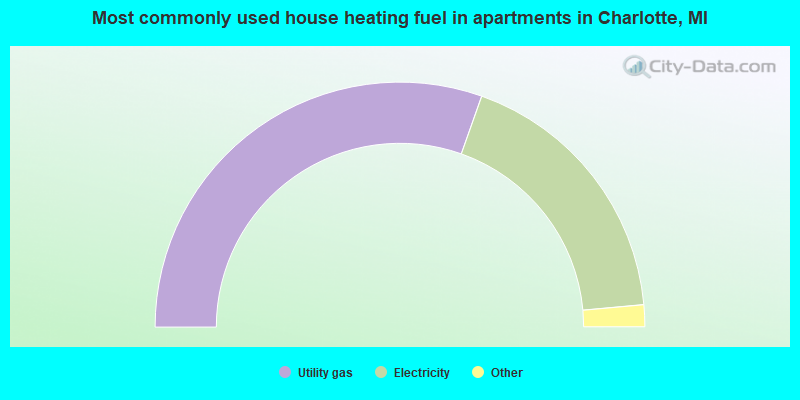
House heating fuel used in apartments - Utility gas (%)
House heating fuel used in apartments - Bottled, tank, or LP gas (%)
House heating fuel used in apartments - Electricity (%)
House heating fuel used in apartments - Fuel oil, kerosene, etc. (%)
House heating fuel used in apartments - Coal or coke (%)
House heating fuel used in apartments - Wood (%)
House heating fuel used in apartments - Solar energy (%)
House heating fuel used in apartments - Other fuel (%)
House heating fuel used in apartments - No fuel used (%)
Armed forces status - In Armed Forces (%)
Armed forces status - Civilian (%)
Armed forces status - Civilian - Veteran (%)
Armed forces status - Civilian - Nonveteran (%)
Fatal accidents locations in years 2005-2021
Fatal accidents locations in 2005
Fatal accidents locations in 2006
Fatal accidents locations in 2007
Fatal accidents locations in 2008
Fatal accidents locations in 2009
Fatal accidents locations in 2010
Fatal accidents locations in 2011
Fatal accidents locations in 2012
Fatal accidents locations in 2013
Fatal accidents locations in 2014
Fatal accidents locations in 2015
Fatal accidents locations in 2016
Fatal accidents locations in 2017
Fatal accidents locations in 2018
Fatal accidents locations in 2019
Fatal accidents locations in 2020
Fatal accidents locations in 2021
Alcohol use - People drinking some alcohol every month (%)
Alcohol use - People not drinking at all (%)
Alcohol use - Average days/month drinking alcohol
Alcohol use - Average drinks/week
Alcohol use - Average days/year people drink much
Audiometry - Average condition of hearing (%)
Audiometry - People that can hear a whisper from across a quiet room (%)
Audiometry - People that can hear normal voice from across a quiet room (%)
Audiometry - Ears ringing, roaring, buzzing (%)
Audiometry - Had a job exposure to loud noise (%)
Audiometry - Had off-work exposure to loud noise (%)
Blood Pressure & Cholesterol - Has high blood pressure (%)
Blood Pressure & Cholesterol - Checking blood pressure at home (%)
Blood Pressure & Cholesterol - Frequently checking blood cholesterol (%)
Blood Pressure & Cholesterol - Has high cholesterol level (%)
Consumer Behavior - Money monthly spent on food at supermarket/grocery store
Consumer Behavior - Money monthly spent on food at other stores
Consumer Behavior - Money monthly spent on eating out
Consumer Behavior - Money monthly spent on carryout/delivered foods
Consumer Behavior - Income spent on food at supermarket/grocery store (%)
Consumer Behavior - Income spent on food at other stores (%)
Consumer Behavior - Income spent on eating out (%)
Consumer Behavior - Income spent on carryout/delivered foods (%)
Current Health Status - General health condition (%)
Current Health Status - Blood donors (%)
Current Health Status - Has blood ever tested for HIV virus (%)
Current Health Status - Left-handed people (%)
Dermatology - People using sunscreen (%)
Diabetes - Diabetics (%)
Diabetes - Had a blood test for high blood sugar (%)
Diabetes - People taking insulin (%)
Diet Behavior & Nutrition - Diet health (%)
Diet Behavior & Nutrition - Milk product consumption (# of products/month)
Diet Behavior & Nutrition - Meals not home prepared (#/week)
Diet Behavior & Nutrition - Meals from fast food or pizza place (#/week)
Diet Behavior & Nutrition - Ready-to-eat foods (#/month)
Diet Behavior & Nutrition - Frozen meals/pizza (#/month)
Drug Use - People that ever used marijuana or hashish (%)
Drug Use - Ever used hard drugs (%)
Drug Use - Ever used any form of cocaine (%)
Drug Use - Ever used heroin (%)
Drug Use - Ever used methamphetamine (%)
Health Insurance - People covered by health insurance (%)
Kidney Conditions-Urology - Avg. # of times urinating at night
Medical Conditions - People with asthma (%)
Medical Conditions - People with anemia (%)
Medical Conditions - People with psoriasis (%)
Medical Conditions - People with overweight (%)
Medical Conditions - Elderly people having difficulties in thinking or remembering (%)
Medical Conditions - People who ever received blood transfusion (%)
Medical Conditions - People having trouble seeing even with glass/contacts (%)
Medical Conditions - People with arthritis (%)
Medical Conditions - People with gout (%)
Medical Conditions - People with congestive heart failure (%)
Medical Conditions - People with coronary heart disease (%)
Medical Conditions - People with angina pectoris (%)
Medical Conditions - People who ever had heart attack (%)
Medical Conditions - People who ever had stroke (%)
Medical Conditions - People with emphysema (%)
Medical Conditions - People with thyroid problem (%)
Medical Conditions - People with chronic bronchitis (%)
Medical Conditions - People with any liver condition (%)
Medical Conditions - People who ever had cancer or malignancy (%)
Mental Health - People who have little interest in doing things (%)
Mental Health - People feeling down, depressed, or hopeless (%)
Mental Health - People who have trouble sleeping or sleeping too much (%)
Mental Health - People feeling tired or having little energy (%)
Mental Health - People with poor appetite or overeating (%)
Mental Health - People feeling bad about themself (%)
Mental Health - People who have trouble concentrating on things (%)
Mental Health - People moving or speaking slowly or too fast (%)
Mental Health - People having thoughts they would be better off dead (%)
Oral Health - Average years since last visit a dentist
Oral Health - People embarrassed because of mouth (%)
Oral Health - People with gum disease (%)
Oral Health - General health of teeth and gums (%)
Oral Health - Average days a week using dental floss/device
Oral Health - Average days a week using mouthwash for dental problem
Oral Health - Average number of teeth
Pesticide Use - Households using pesticides to control insects (%)
Pesticide Use - Households using pesticides to kill weeds (%)
Physical Activity - People doing vigorous-intensity work activities (%)
Physical Activity - People doing moderate-intensity work activities (%)
Physical Activity - People walking or bicycling (%)
Physical Activity - People doing vigorous-intensity recreational activities (%)
Physical Activity - People doing moderate-intensity recreational activities (%)
Physical Activity - Average hours a day doing sedentary activities
Physical Activity - Average hours a day watching TV or videos
Physical Activity - Average hours a day using computer
Physical Functioning - People having limitations keeping them from working (%)
Physical Functioning - People limited in amount of work they can do (%)
Physical Functioning - People that need special equipment to walk (%)
Physical Functioning - People experiencing confusion/memory problems (%)
Physical Functioning - People requiring special healthcare equipment (%)
Prescription Medications - Average number of prescription medicines taking
Preventive Aspirin Use - Adults 40+ taking low-dose aspirin (%)
Reproductive Health - Vaginal deliveries (%)
Reproductive Health - Cesarean deliveries (%)
Reproductive Health - Deliveries resulted in a live birth (%)
Reproductive Health - Pregnancies resulted in a delivery (%)
Reproductive Health - Women breastfeeding newborns (%)
Reproductive Health - Women that had a hysterectomy (%)
Reproductive Health - Women that had both ovaries removed (%)
Reproductive Health - Women that have ever taken birth control pills (%)
Reproductive Health - Women taking birth control pills (%)
Reproductive Health - Women that have ever used Depo-Provera or injectables (%)
Reproductive Health - Women that have ever used female hormones (%)
Sexual Behavior - People 18+ that ever had sex (vaginal, anal, or oral) (%)
Sexual Behavior - Males 18+ that ever had vaginal sex with a woman (%)
Sexual Behavior - Males 18+ that ever performed oral sex on a woman (%)
Sexual Behavior - Males 18+ that ever had anal sex with a woman (%)
Sexual Behavior - Males 18+ that ever had any sex with a man (%)
Sexual Behavior - Females 18+ that ever had vaginal sex with a man (%)
Sexual Behavior - Females 18+ that ever performed oral sex on a man (%)
Sexual Behavior - Females 18+ that ever had anal sex with a man (%)
Sexual Behavior - Females 18+ that ever had any kind of sex with a woman (%)
Sexual Behavior - Average age people first had sex
Sexual Behavior - Average number of female sex partners in lifetime (males 18+)
Sexual Behavior - Average number of female vaginal sex partners in lifetime (males 18+)
Sexual Behavior - Average age people first performed oral sex on a woman (18+)
Sexual Behavior - Average number of woman performed oral sex on in lifetime (18+)
Sexual Behavior - Average number of male sex partners in lifetime (males 18+)
Sexual Behavior - Average number of male anal sex partners in lifetime (males 18+)
Sexual Behavior - Average age people first performed oral sex on a man (18+)
Sexual Behavior - Average number of male oral sex partners in lifetime (18+)
Sexual Behavior - People using protection when performing oral sex (%)
Sexual Behavior - Average number of times people have vaginal or anal sex a year
Sexual Behavior - People having sex without condom (%)
Sexual Behavior - Average number of male sex partners in lifetime (females 18+)
Sexual Behavior - Average number of male vaginal sex partners in lifetime (females 18+)
Sexual Behavior - Average number of female sex partners in lifetime (females 18+)
Sexual Behavior - Circumcised males 18+ (%)
Sleep Disorders - Average hours sleeping at night
Sleep Disorders - People that has trouble sleeping (%)
Smoking-Cigarette Use - People smoking cigarettes (%)
Taste & Smell - People 40+ having problems with smell (%)
Taste & Smell - People 40+ having problems with taste (%)
Taste & Smell - People 40+ that ever had wisdom teeth removed (%)
Taste & Smell - People 40+ that ever had tonsils teeth removed (%)
Taste & Smell - People 40+ that ever had a loss of consciousness because of a head injury (%)
Taste & Smell - People 40+ that ever had a broken nose or other serious injury to face or skull (%)
Taste & Smell - People 40+ that ever had two or more sinus infections (%)
Weight - Average height (inches)
Weight - Average weight (pounds)
Weight - Average BMI
Weight - People that are obese (%)
Weight - People that ever were obese (%)
Weight - People trying to lose weight (%)
Officers per 1,000 residents here:
1.66Michigan average:
1.86
Latest news from Charlotte, MI collected exclusively by city-data.com from local newspapers, TV, and radio stations
Ancestries: German (18.8%), American (15.1%), Irish (13.6%), Polish (7.0%), English (5.5%), Italian (2.5%).
Current Local Time:
Land area: 5.98 square miles.
Population density: 1,550 people per square mile (low).
136 residents are foreign born
This city:
1.5%Michigan:
6.9%
Median real estate property taxes paid for housing units with mortgages in 2022: $2,336 (1.8%)Median real estate property taxes paid for housing units with no mortgage in 2022: $2,191 (1.8%)
Nearest city with pop. 50,000+: Lansing, MI
Nearest city with pop. 200,000+: Detroit, MI
Nearest city with pop. 1,000,000+: Chicago, IL
Nearest cities:
Latitude: 42.56 N, Longitude: 84.83 W
Daytime population change due to commuting: +3,370 (+36.4%)Workers who live and work in this city: 2,401 (59.5%)
Single-family new house construction building permits:
2020: 3 buildings , average cost: $161,5002019: 3 buildings , average cost: $161,5002018: 3 buildings , average cost: $161,5002017: 3 buildings , average cost: $161,5002016: 3 buildings , average cost: $161,5002015: 3 buildings , average cost: $161,5002014: 2 buildings , average cost: $161,5002013: 2 buildings , average cost: $161,5002012: 2 buildings , average cost: $175,5002011: 5 buildings , average cost: $100,2002010: 1 building , cost: $100,0002009: 1 building , cost: $100,0002008: 1 building , cost: $100,0002007: 24 buildings , average cost: $50,1002006: 5 buildings , average cost: $137,8002005: 27 buildings , average cost: $120,8002004: 47 buildings , average cost: $101,1002003: 29 buildings , average cost: $96,6002002: 21 buildings , average cost: $78,7002001: 30 buildings , average cost: $52,2002000: 42 buildings , average cost: $52,2001999: 14 buildings , average cost: $55,6001998: 15 buildings , average cost: $72,0001997: 6 buildings , average cost: $120,300Unemployment in December 2023:
Population change in the 1990s: +173 (+2.1%).
Most common occupations in Charlotte, MI (%)
Both Males Females
Other office and administrative support workers, including supervisors (5.3%)
Retail sales workers, except cashiers (5.3%)
Assemblers and fabricators (4.6%)
Other production occupations, including supervisors (4.6%)
Metal workers and plastic workers (4.5%)
Other sales and related occupations, including supervisors (3.3%)
Preschool, kindergarten, elementary, and middle school teachers (3.1%)
Other production occupations, including supervisors (7.4%)
Metal workers and plastic workers (7.2%)
Assemblers and fabricators (5.4%)
Laborers and material movers, hand (4.6%)
Retail sales workers, except cashiers (4.4%)
Building and grounds cleaning and maintenance occupations (4.1%)
Driver/sales workers and truck drivers (3.9%)
Other office and administrative support workers, including supervisors (9.8%)
Retail sales workers, except cashiers (6.3%)
Secretaries and administrative assistants (5.7%)
Preschool, kindergarten, elementary, and middle school teachers (4.2%)
Information and record clerks, except customer service representatives (3.8%)
Cashiers (3.8%)
Assemblers and fabricators (3.8%)
Tornado activity:
Charlotte-area historical tornado activity is above Michigan state average. It is 65% greater than the overall U.S. average.
On 4/2/1977, a category F4 (max. wind speeds 207-260 mph) tornado 6.2 miles away from the Charlotte city center killed one person and injured 44 people and caused between $500,000 and $5,000,000 in damages.
On 4/11/1965, a category F4 tornado 22.1 miles away from the city center killed one person and injured 8 people and caused between $50,000 and $500,000 in damages.
Earthquake activity:
Charlotte-area historical earthquake activity is significantly above Michigan state average. It is 30% smaller than the overall U.S. average. On 1/31/1986 at 16:46:43, a magnitude 5.0 (5.0 MB, Class: Moderate, Intensity: VI - VII) earthquake occurred 199.9 miles away from the city center On 9/25/1998 at 19:52:52, a magnitude 5.2 (4.8 MB, 4.3 MS, 5.2 LG, 4.5 MW, Depth: 3.1 mi) earthquake occurred 239.7 miles away from Charlotte center On 5/2/2015 at 16:23:07, a magnitude 4.2 (4.2 MW, Depth: 2.8 mi, Class: Light, Intensity: IV - V) earthquake occurred 37.7 miles away from the city center On 7/12/1986 at 08:19:37, a magnitude 4.5 (4.5 MB) earthquake occurred 142.0 miles away from Charlotte center On 4/18/2008 at 09:36:59, a magnitude 5.4 (5.1 MB, 4.8 MS, 5.4 MW, 5.2 MW) earthquake occurred 326.3 miles away from the city center On 7/27/1980 at 18:52:21, a magnitude 5.2 (5.1 MB, 4.7 MS, 5.0 UK, 5.2 UK) earthquake occurred 304.9 miles away from the city center Magnitude types: regional Lg-wave magnitude (LG), body-wave magnitude (MB), surface-wave magnitude (MS), moment magnitude (MW) Natural disasters: The number of natural disasters in Eaton County (11) is smaller than the US average (15).Major Disasters (Presidential) Declared: 5Emergencies Declared: 5Storms: 5, Floods: 3, Tornadoes: 3, Snowstorms: 2, Blizzard: 1, Freeze: 1, Hurricane: 1, Power Outage: 1, Wind: 1, Winter Storm: 1, Other: 1 (Note: some incidents may be assigned to more than one category). Main business address for: SPARTAN MOTORS INC MOTOR VEHICLES & PASSENGER CAR BODIES ).
Hospitals and medical centers in Charlotte: BARRY-EATON DIST HLTH DEPT HOSPC PGM (1033 HEALTH CARE DRIVE) HAYES GREEN BEACH MEMORIAL HOSPITAL (Voluntary non-profit - Other, provides emergency services, 321 E HARRIS STREET) EATON COUNTY MEDICAL CARE FACI (530 W BEECH ST)
EATON MANOR, INC (511 E SHEPHERD ST)
FMC - CHARLOTTE (111 LANSING ST, SUITE 120)
HAYES GREEN BEACH HOMECARE (111 LANSING ROAD, SUITE 210)
Colleges/universities with over 2000 students nearest to Charlotte:
Lansing Community College (about 19 miles; Lansing, MI ; Full-time enrollment: 12,822)
Michigan State University (about 22 miles; East Lansing, MI ; FT enrollment: 41,736)
Kellogg Community College (about 24 miles; Battle Creek, MI ; FT enrollment: 4,078)
Spring Arbor University (about 29 miles; Spring Arbor, MI ; FT enrollment: 3,374)
Jackson College (about 36 miles; Jackson, MI ; FT enrollment: 4,258)
Davenport University (about 41 miles; Grand Rapids, MI ; FT enrollment: 6,955)
Western Michigan University (about 45 miles; Kalamazoo, MI ; FT enrollment: 20,840)
Public high schools in Charlotte: CHARLOTTE SENIOR HIGH SCHOOL Students: 1,005, Location: 378 STATE ST, Grades: 9-12)RELEVANT ACADEMY OF EATON COUNTY Location: 512 E LOVETT ST, Grades: 9-12, Charter school )
EATON COUNTY YOUTH FACILITY Location: 822 COURTHOUSE DRIVER, Grades: 6-12)
MEADOWVIEW SCHOOL Location: 1790 PACKARD HWY, Grades: PK-12)MEADOWVIEW OFFSITE Location: 240 SOUTH COCHRAN AVE, Grades: 1-12)Public elementary/middle schools in Charlotte:
Private elementary/middle schools in Charlotte: ST MARY ELEMENTARY SCHOOL Students: 77, Location: 905 SAINT MARYS BLVD, Grades: KG-6)
MAPLE COUNTRY SCHOOL Students: 24, Location: 1827 N AINGER RD, Grades: 1-8)
CHARLOTTE SDA SCHOOL Students: 14, Location: 1510 S COCHRAN RD, Grades: 1-8)
See full list of schools located in Charlotte Library in Charlotte: CHARLOTTE COMMUNITY LIBRARY Operating income: $688,662; Location: 226 SOUTH BOSTWICK STREET; 72,005 books ; 10 e-books ; 1,600 audio materials ; 6,000 video materials ; 126 print serial subscriptions )
User-submitted facts and corrections:
Official Website: Http://www.charlottemi.org
Official Website: Http://www.charlottemi.org
Notable locations in Charlotte: (A) , Charlotte Station (B) , Charlotte Country Club (C) , Charlotte Police Department (D) , Eaton County Courthouse (E) , Charlotte Community Library (F) , Charlotte Fire Department (G) . Display/hide their locations on the map
Main business address in Charlotte: (A) . Display/hide its location on the map
Churches in Charlotte include: (A) , Church of Christ (B) , Charlotte Penecostal Church (C) , Seventh-Day Adventist Church (D) , First Congregational Church (E) , Peace Lutheran Church (F) , Calvary Baptist Church (G) , Christian Reformed Church (H) , Free Methodist Church (I) . Display/hide their locations on the map
Cemetery: (1) . Display/hide its location on the map
Parks in Charlotte include: (1) , Bennett Park (2) , Lincoln Park (3) , Dean Park (4) , Southridge Park (5) , Oak Park (6) , Eaton County Courthouse Square Historical Marker (7) , 1845 Eaton County Courthouse Historical Marker (8) , Eaton County Historical Marker (9) . Display/hide their locations on the map
Tourist attraction:
Hotels:
Birthplace of: Paul H. Bruske - Writer, Brock Gutierrez - 2005 NFL player (Detroit Lions, born : Sep 25, 1973), Francis C. Flaherty - Navy Medal of Honor recipient, A. Whitney Brown - comedian, Jack Curtis (WWII aviator) - Recipient of the Purple Heart medal.
Eaton County has a predicted average indoor radon screening level between 2 and 4 pCi/L (pico curies per liter) - Moderate Potential Drinking water stations with addresses in Charlotte and their reported violations in the past:
EATON GREEN ESTATES SUBDIVISION (Population served: 363, Groundwater):
Past monitoring violations:
One regular monitoring violation
Drinking water stations with addresses in Charlotte that have no violations reported:
CHARLOTTE, CITY OF (Population served: 9,074, Primary Water Source Type: Groundwater)
SHADY GREEN PASTURE BIBLE CAMP (Population served: 125, Primary Water Source Type: Groundwater)
LISA L. KNOWLES, DDS, PC (Population served: 34, Primary Water Source Type: Groundwater)
Average household size: This city:
2.4 peopleMichigan:
2.5 people
Percentage of family households: This city:
62.6%Whole state:
66.0%
Percentage of households with unmarried partners: This city:
8.0%Whole state:
6.4%
Likely homosexual households (counted as self-reported same-sex unmarried-partner households)
Lesbian couples: 0.3% of all households Gay men: 0.2% of all households
People in group quarters in Charlotte in 2010:
207 people in local jails and other municipal confinement facilities
102 people in nursing facilities/skilled-nursing facilities
28 people in group homes intended for adults
20 people in correctional facilities intended for juveniles
13 people in emergency and transitional shelters (with sleeping facilities) for people experiencing homelessness
People in group quarters in Charlotte in 2000:
217 people in local jails and other confinement facilities (including police lockups)
145 people in nursing homes
30 people in other group homes
15 people in training schools for juvenile delinquents
13 people in homes for the mentally retarded
Banks with branches in Charlotte (2011 data):
PNC Bank, National Association: Charlotte Branch at 101 South Cochran Avenue, branch established on 1974/05/15; Charlotte-Lansing Street Du Branch at 226 Lansing Street, branch established on 2007/07/01. Info updated 2012/03/20: Bank assets: $263,309.6 mil, Deposits: $197,343.0 mil, headquarters in Wilmington, DE, positive income , Commercial Lending Specialization, 3085 total offices , Holding Company: Pnc Financial Services Group, Inc., The
Eaton Federal Savings Bank: at 236 South Cochran Avenue, branch established on 1936/01/01. Info updated 2011/07/21: Bank assets: $321.9 mil, Deposits: $254.2 mil, local headquarters , positive income , Mortgage Lending Specialization, 5 total offices
Fifth Third Bank: Charlotte Banking Center at 328 Lansing Street, branch established on 1890/01/01. Info updated 2009/10/05: Bank assets: $114,540.4 mil, Deposits: $89,689.1 mil, headquarters in Cincinnati, OH, positive income , Commercial Lending Specialization, 1378 total offices , Holding Company: Fifth Third Bancorp
Independent Bank: Charlotte Branch at 129 Lansing St, branch established on 1989/04/03. Info updated 2010/10/20: Bank assets: $2,304.7 mil, Deposits: $2,092.2 mil, headquarters in Ionia, MI, negative income in the last year , Commercial Lending Specialization, 107 total offices , Holding Company: Independent Bank Corporation
Bank of America, National Association: Charlotte Branch at 122 South Cochran Avenue, branch established on 1959/11/30. Info updated 2009/11/18: Bank assets: $1,451,969.3 mil, Deposits: $1,077,176.8 mil, headquarters in Charlotte, NC, positive income , 5782 total offices , Holding Company: Bank Of America Corporation
For population 15 years and over in Charlotte:
Never married: 32.8%Now married: 41.7%Separated: 2.0%Widowed: 6.3%Divorced: 17.2% For population 25 years and over in Charlotte:
High school or higher: 91.9%Bachelor's degree or higher: 17.4%Graduate or professional degree: 4.2%Unemployed: 3.3%Mean travel time to work (commute): 18.7 minutes
Education Gini index (Inequality in education) Here:
8.4Michigan average:
11.0
Religion statistics for Charlotte, MI (based on Eaton County data)
Religion Adherents Congregations Evangelical Protestant 23,299 58 Mainline Protestant 7,847 30 Catholic 6,420 4 Other 481 5 None 69,712 -
Source: Clifford Grammich, Kirk Hadaway, Richard Houseal, Dale E.Jones, Alexei Krindatch, Richie Stanley and Richard H.Taylor. 2012. 2010 U.S.Religion Census: Religious Congregations & Membership Study. Association of Statisticians of American Religious Bodies. Jones, Dale E., et al. 2002. Congregations and Membership in the United States 2000. Nashville, TN: Glenmary Research Center. Graphs represent county-level data
Food Environment Statistics: Number of grocery stores : 11This county :
1.03 / 10,000 pop.Michigan :
2.34 / 10,000 pop.
Number of supercenters and club stores : 4Eaton County :
0.37 / 10,000 pop.State :
0.18 / 10,000 pop.
Number of convenience stores (no gas) : 16Eaton County :
1.49 / 10,000 pop.State :
1.52 / 10,000 pop.
Number of convenience stores (with gas) : 26This county :
2.43 / 10,000 pop.State :
2.99 / 10,000 pop.
Number of full-service restaurants : 63Here :
5.88 / 10,000 pop.Michigan :
6.80 / 10,000 pop.
Adult diabetes rate : This county :
9.1%Michigan :
9.7%
Adult obesity rate : This county :
30.5%State :
29.7%
Low-income preschool obesity rate : This county :
13.4%State :
13.4%
Health and Nutrition:
Average overall health of teeth and gums : Charlotte:
48.4%State:
47.9%
Average BMI : Charlotte:
28.7Michigan:
28.7
People feeling badly about themselves : Charlotte:
20.6%State:
20.6%
People not drinking alcohol at all : This city:
10.2%State:
10.4%
Average hours sleeping at night : This city:
6.8Michigan:
6.8
Overweight people : Charlotte:
34.8%Michigan:
34.1%
General health condition : Charlotte:
57.9%State:
57.0%
Average condition of hearing : Charlotte:
79.2%State:
79.6%
More about Health and Nutrition of Charlotte, MI Residents
Local government employment and payroll (March 2022)
Function
Full-time employees
Monthly full-time payroll
Average yearly full-time wage
Part-time employees
Monthly part-time payroll
Police Protection - Officers
18 $100,597 $67,065 0 $0 Streets and Highways
13 $66,977 $61,825 0 $0 Firefighters
7 $35,756 $61,296 0 $0 Sewerage
7 $38,986 $66,833 0 $0 Financial Administration
4 $24,412 $73,236 0 $0 Other Government Administration
3 $24,152 $96,608 9 $1,820 Other and Unallocable
3 $12,326 $49,304 1 $1,607 Police - Other
1 $4,296 $51,552 0 $0 Water Supply
1 $6,005 $72,060 0 $0 Solid Waste Management
0 $0 7 $6,276
Totals for Government
57 $313,507 $66,001 17 $9,703
Charlotte government finances - Expenditure in 2017 (per resident):
Current Operations - Sewerage: $2,527,000 ($272.89)
Police Protection: $1,944,000 ($209.94)Regular Highways: $1,240,000 ($133.91)Local Fire Protection: $964,000 ($104.10)General - Other: $687,000 ($74.19)Financial Administration: $268,000 ($28.94)Central Staff Services: $236,000 ($25.49)Air Transportation: $120,000 ($12.96)Parks and Recreation: $99,000 ($10.69)Solid Waste Management: $67,000 ($7.24)General - Interest on Debt: $108,000 ($11.66)
Other Capital Outlay - Regular Highways: $414,000 ($44.71)
Local Fire Protection: $99,000 ($10.69)Police Protection: $44,000 ($4.75)General - Other: $19,000 ($2.05)Parks and Recreation: $11,000 ($1.19)Housing and Community Development: $6,000 ($0.65)Air Transportation: $3,000 ($0.32)Total Salaries and Wages: $2,581,000 ($278.73)
Water Utilities - Interest on Debt: $87,000 ($9.40)
Charlotte government finances - Revenue in 2017 (per resident):
Charges - Sewerage: $2,325,000 ($251.08)
Other: $229,000 ($24.73)Solid Waste Management: $56,000 ($6.05)Parking Facilities: $1,000 ($0.11)Federal Intergovernmental - Other: $1,000 ($0.11)
Local Intergovernmental - Other: $68,000 ($7.34)
Miscellaneous - General Revenue - Other: $225,000 ($24.30)
Donations From Private Sources: $129,000 ($13.93)Rents: $49,000 ($5.29)Fines and Forfeits: $27,000 ($2.92)Sale of Property: $24,000 ($2.59)Interest Earnings: $21,000 ($2.27)Special Assessments: $18,000 ($1.94)Revenue - Water Utilities: $1,504,000 ($162.42)
State Intergovernmental - General Local Government Support: $866,000 ($93.52)
Highways: $731,000 ($78.94)Other: $14,000 ($1.51)Tax - Property: $3,840,000 ($414.69)
Occupation and Business License - Other: $41,000 ($4.43)Other Selective Sales: $1,000 ($0.11)
Charlotte government finances - Debt in 2017 (per resident):
Long Term Debt - Beginning Outstanding - Unspecified Public Purpose: $6,834,000 ($738.01)
Outstanding Unspecified Public Purpose: $6,182,000 ($667.60)Retired Unspecified Public Purpose: $913,000 ($98.60)Issue, Unspecified Public Purpose: $261,000 ($28.19)
Charlotte government finances - Cash and Securities in 2017 (per resident):
Other Funds - Cash and Securities: $7,338,000 ($792.44)
Businesses in Charlotte, MI
Name Count Name Count
Advance Auto Parts 1 Little Caesars Pizza 1 Applebee's 1 MasterBrand Cabinets 1 Arby's 1 McDonald's 1 AutoZone 1 Meijer 1 Blockbuster 1 Nike 2 Burger King 1 Payless 1 CVS 1 Pizza Hut 1 Chevrolet 1 Subway 2 Comfort Inn 1 Super 8 1 Dairy Queen 1 T-Mobile 1 FedEx 2 Taco Bell 1 Ford 1 True Value 1 H&R Block 1 U-Haul 1 Holiday Inn 1 UPS 5 KFC 1 Walmart 1 Lane Furniture 2 Wendy's 1
Strongest AM radio stations in Charlotte:
WLCM (1390 AM; 5 kW; CHARLOTTE, MI)
WKAR (870 AM; daytime; 10 kW; EAST LANSING, MI; Owner: MICHIGAN STATE UNIVERSITY)
WOAP (1080 AM; 50 kW; OWOSSO, MI)
WILS (1320 AM; 5 kW; LANSING, MI)
WJR (760 AM; 50 kW; DETROIT, MI; Owner: ABC, INC.)
WFDF (910 AM; 50 kW; FLINT, MI; Owner: ABC, INC.)
WBCK (930 AM; 5 kW; BATTLE CREEK, MI; Owner: CAPSTAR TX LIMITED PARTNERSHIP)
WOOD (1300 AM; 20 kW; GRAND RAPIDS, MI; Owner: CLEAR CHANNEL BROADCASTING LICENSES, INC.)
WWJ (950 AM; 50 kW; DETROIT, MI; Owner: INFINITY BROADCASTING OPERATIONS, INC.)
WCHB (1200 AM; 50 kW; TAYLOR, MI; Owner: RADIO ONE OF DETROIT, LLC)
WXYT (1270 AM; 50 kW; DETROIT, MI; Owner: INFINITY BROADCASTING CORP. OF DETROIT)
WDFN (1130 AM; 50 kW; DETROIT, MI; Owner: AMFM RADIO LICENSES, L.L.C.)
WKZO (590 AM; 5 kW; KALAMAZOO, MI; Owner: FAIRFIELD BROADCASTING COMPANY)
Strongest FM radio stations in Charlotte:
WQTX (92.7 FM; CHARLOTTE, MI; Owner: RUBBER CITY RADIO GROUP)
WVIC (94.1 FM; JACKSON, MI; Owner: RUBBER CITY RADIO GROUP)
WJIM-FM (97.5 FM; LANSING, MI; Owner: CITADEL BROADCASTING COMPANY)
WFMK (99.1 FM; EAST LANSING, MI; Owner: CITADEL BROADCASTING COMPANY)
WKAR-FM (90.5 FM; EAST LANSING, MI; Owner: MICHIGAN STATE UNIVERSITY)
WMMQ (94.9 FM; EAST LANSING, MI; Owner: CITADEL BROADCASTING COMPANY)
WITL-FM (100.7 FM; LANSING, MI; Owner: CITADEL BROADCASTING COMPANY)
WJXQ (106.1 FM; JACKSON, MI; Owner: RUBBER CITY RADIO GROUP)
WHZZ (101.7 FM; LANSING, MI; Owner: THE MACDONALD BROADCASTING COMPANY)
WLGH (88.1 FM; LEROY TOWNSHIP, MI; Owner: SUPERIOR COMMUNICATIONS)
WUFN (96.7 FM; ALBION, MI; Owner: FAMILY LIFE BROADCASTING SYSTEM)
WWKN (104.9 FM; MARSHALL, MI; Owner: CASPTAR TX LIMITED PARTNERSHIP)
WOOD-FM (105.7 FM; GRAND RAPIDS, MI; Owner: CLEAR CHANNEL BROADCASTING LICENSES, INC.)
WBCT (93.7 FM; GRAND RAPIDS, MI; Owner: CLEAR CHANNEL BROADCASTING LICENSES, INC.)
WVGR (104.1 FM; GRAND RAPIDS, MI; Owner: REGENTS OF THE UNIVERSITY OF MICHIGAN)
WQLR (106.5 FM; KALAMAZOO, MI; Owner: FAIRFIELD BROADCASTING COMPANY)
WQHH (96.5 FM; DEWITT, MI; Owner: MID MICHIGAN FM, INC.)
WKFR-FM (103.3 FM; BATTLE CREEK, MI; Owner: CUMULUS LICENSING CORP.)
WKMY (92.1 FM; ST. JOHNS, MI; Owner: RUBBER CITY RADIO GROUP)
WDBM (88.9 FM; EAST LANSING, MI; Owner: BD OF TRUSTEE OF MICHIGAN STATE UNIV)
TV broadcast stations around Charlotte:
WSYM-TV (Channel 47; LANSING, MI; Owner: JOURNAL BROADCAST CORPORATION)
WZPX (Channel 43; BATTLE CREEK, MI; Owner: PAXSON BATTLE CREEK LICENSE, INC.)
WILX-TV (Channel 10; ONONDAGA, MI; Owner: GRAY MIDAMERICA TV LICENSEE CORP.)
WLAJ (Channel 53; LANSING, MI; Owner: FREEDOM BROADCASTING OF MICHIGAN, INC.)
WHTV (Channel 18; JACKSON, MI; Owner: SPARTAN-TV, L.L.C.)
W69BJ (Channel 69; LANSING, MI; Owner: TRI-STATE CHRISTIAN TV, INC.)
WKAR-TV (Channel 23; EAST LANSING, MI; Owner: BOARD OF TRUSTEES, MICH. STATE UNIV.)
WLNS-TV (Channel 6; LANSING, MI; Owner: YOUNG BROADCASTING OF LANSING, INC.)
W24CG (Channel 24; HOUGHTON LAKE, MI; Owner: MS COMMUNICATIONS, LLC)
WWMT (Channel 3; KALAMAZOO, MI; Owner: FREEDOM BROADCASTING OF MICHIGAN, INC.)
WLLA (Channel 64; KALAMAZOO, MI; Owner: CHRISTIAN FAITH BROADCAST, INC.)
W27CJ (Channel 27; ANN ARBOR, MI; Owner: TCT OF MICHIGAN, INC.)
WOTV (Channel 41; BATTLE CREEK, MI; Owner: WOOD LICENSE COMPANY, LLC)
WXMI (Channel 17; GRAND RAPIDS, MI; Owner: TRIBUNE TELEVISION HOLDINGS, INC.)
WOOD-TV (Channel 8; GRAND RAPIDS, MI; Owner: WOOD LICENSE COMPANY, LLC)
WPXD (Channel 31; ANN ARBOR, MI; Owner: PAXSON COMMUNICATIONS LICENSE COMPANY, LLC)
Medal of Honor Recipients
Medal of Honor Recipient born in Charlotte: Francis C. Flaherty.
National Bridge Inventory (NBI) Statistics 41 Number of bridges407ft / 124m Total length $870,000 Total costs353,337 Total average daily traffic55,847 Total average daily truck traffic
New bridges - historical statistics
1 1920-1929 2 1940-1949 2 1950-1959 2 1960-1969 14 1970-1979 13 1980-1989 3 1990-1999 1 2000-2009 3 2010-2019
See full National Bridge Inventory statistics for Charlotte, MI
Home Mortgage Disclosure Act Aggregated Statistics For Year 2009(Based on 2 partial tracts) A) FHA, FSA/RHS & VA B) Conventional C) Refinancings D) Home Improvement Loans E) Loans on Dwellings For 5+ Families F) Non-occupant Loans on Number Average Value Number Average Value Number Average Value Number Average Value Number Average Value Number Average Value
LOANS ORIGINATED 36 $85,764 10 $79,702 61 $98,328 11 $25,513 1 $361,380 7 $63,891 APPLICATIONS APPROVED, NOT ACCEPTED 0 $0 0 $0 7 $86,760 2 $3,630 0 $0 1 $40,650 APPLICATIONS DENIED 2 $99,390 1 $130,980 31 $105,875 3 $38,290 0 $0 1 $35,570 APPLICATIONS WITHDRAWN 5 $80,468 1 $91,270 22 $100,219 1 $97,790 0 $0 0 $0 FILES CLOSED FOR INCOMPLETENESS 1 $18,830 0 $0 3 $76,413 1 $4,350 0 $0 0 $0
Aggregated Statistics For Year 2008(Based on 2 partial tracts) A) FHA, FSA/RHS & VA B) Conventional C) Refinancings D) Home Improvement Loans F) Non-occupant Loans on G) Loans On Manufactured Number Average Value Number Average Value Number Average Value Number Average Value Number Average Value Number Average Value
LOANS ORIGINATED 43 $85,311 21 $85,124 54 $93,642 12 $22,888 13 $60,299 0 $0 APPLICATIONS APPROVED, NOT ACCEPTED 4 $87,288 2 $101,670 7 $94,156 0 $0 1 $89,800 0 $0 APPLICATIONS DENIED 3 $111,710 6 $53,715 39 $104,103 10 $48,179 1 $108,640 3 $31,880 APPLICATIONS WITHDRAWN 1 $130,690 4 $93,558 19 $119,987 4 $33,952 5 $79,108 0 $0 FILES CLOSED FOR INCOMPLETENESS 0 $0 1 $13,040 2 $138,015 2 $12,675 1 $13,040 0 $0
Aggregated Statistics For Year 2007(Based on 2 partial tracts) A) FHA, FSA/RHS & VA B) Conventional C) Refinancings D) Home Improvement Loans E) Loans on Dwellings For 5+ Families F) Non-occupant Loans on G) Loans On Manufactured Number Average Value Number Average Value Number Average Value Number Average Value Number Average Value Number Average Value Number Average Value
LOANS ORIGINATED 17 $105,682 57 $95,086 83 $91,290 23 $44,127 1 $123,110 21 $72,007 0 $0 APPLICATIONS APPROVED, NOT ACCEPTED 0 $0 11 $75,169 14 $76,124 4 $47,102 0 $0 1 $125,290 1 $40,560 APPLICATIONS DENIED 2 $94,375 19 $103,250 65 $105,245 20 $52,251 0 $0 7 $82,296 2 $76,355 APPLICATIONS WITHDRAWN 0 $0 8 $83,675 20 $106,798 2 $75,785 0 $0 4 $68,255 0 $0 FILES CLOSED FOR INCOMPLETENESS 0 $0 4 $76,820 5 $112,716 0 $0 0 $0 2 $95,230 0 $0
Aggregated Statistics For Year 2006(Based on 2 partial tracts) A) FHA, FSA/RHS & VA B) Conventional C) Refinancings D) Home Improvement Loans E) Loans on Dwellings For 5+ Families F) Non-occupant Loans on G) Loans On Manufactured Number Average Value Number Average Value Number Average Value Number Average Value Number Average Value Number Average Value Number Average Value
LOANS ORIGINATED 14 $104,474 118 $80,447 140 $86,707 26 $40,005 1 $235,370 22 $72,985 0 $0 APPLICATIONS APPROVED, NOT ACCEPTED 0 $0 15 $72,611 24 $101,085 3 $70,743 0 $0 2 $79,135 0 $0 APPLICATIONS DENIED 4 $91,698 22 $80,610 117 $94,701 25 $41,856 0 $0 12 $81,794 1 $48,880 APPLICATIONS WITHDRAWN 1 $109,580 19 $68,601 42 $110,908 3 $66,193 0 $0 4 $73,868 0 $0 FILES CLOSED FOR INCOMPLETENESS 0 $0 4 $108,845 20 $109,973 0 $0 0 $0 1 $133,980 0 $0
Aggregated Statistics For Year 2005(Based on 2 partial tracts) A) FHA, FSA/RHS & VA B) Conventional C) Refinancings D) Home Improvement Loans E) Loans on Dwellings For 5+ Families F) Non-occupant Loans on G) Loans On Manufactured Number Average Value Number Average Value Number Average Value Number Average Value Number Average Value Number Average Value Number Average Value
LOANS ORIGINATED 25 $110,036 137 $87,200 175 $95,457 22 $35,744 1 $374,130 30 $97,284 1 $73,540 APPLICATIONS APPROVED, NOT ACCEPTED 3 $98,527 22 $76,718 38 $95,372 3 $41,810 1 $305,610 7 $68,301 3 $48,253 APPLICATIONS DENIED 1 $84,950 14 $75,688 107 $89,236 17 $25,911 0 $0 8 $62,878 4 $57,808 APPLICATIONS WITHDRAWN 3 $88,633 17 $82,936 73 $97,723 4 $98,750 0 $0 6 $74,323 1 $38,520 FILES CLOSED FOR INCOMPLETENESS 0 $0 4 $87,312 34 $102,974 1 $16,240 0 $0 2 $101,055 0 $0
Aggregated Statistics For Year 2004(Based on 2 partial tracts) A) FHA, FSA/RHS & VA B) Conventional C) Refinancings D) Home Improvement Loans E) Loans on Dwellings For 5+ Families F) Non-occupant Loans on G) Loans On Manufactured Number Average Value Number Average Value Number Average Value Number Average Value Number Average Value Number Average Value Number Average Value
LOANS ORIGINATED 20 $106,538 109 $95,506 181 $96,240 20 $49,049 1 $1,075,250 26 $86,168 1 $134,940 APPLICATIONS APPROVED, NOT ACCEPTED 6 $95,473 20 $89,511 29 $97,578 7 $27,871 0 $0 4 $89,258 3 $43,053 APPLICATIONS DENIED 6 $110,957 28 $72,651 86 $94,927 18 $23,178 0 $0 10 $83,653 5 $29,688 APPLICATIONS WITHDRAWN 1 $125,400 7 $61,769 48 $109,689 4 $36,648 0 $0 2 $120,580 0 $0 FILES CLOSED FOR INCOMPLETENESS 0 $0 2 $154,085 25 $114,786 1 $29,060 0 $0 1 $125,290 0 $0
Aggregated Statistics For Year 2003(Based on 2 partial tracts) A) FHA, FSA/RHS & VA B) Conventional C) Refinancings D) Home Improvement Loans E) Loans on Dwellings For 5+ Families F) Non-occupant Loans on Number Average Value Number Average Value Number Average Value Number Average Value Number Average Value Number Average Value
LOANS ORIGINATED 28 $100,837 109 $101,556 339 $86,528 19 $21,451 1 $4,238,020 25 $69,124 APPLICATIONS APPROVED, NOT ACCEPTED 1 $80,390 14 $75,257 36 $92,282 1 $39,850 0 $0 2 $68,160 APPLICATIONS DENIED 2 $95,650 22 $73,738 117 $88,826 6 $19,945 0 $0 4 $75,722 APPLICATIONS WITHDRAWN 0 $0 7 $93,447 65 $99,717 2 $42,425 0 $0 3 $77,503 FILES CLOSED FOR INCOMPLETENESS 1 $126,010 2 $91,205 11 $89,527 1 $1,470 0 $0 1 $49,250
Aggregated Statistics For Year 2002(Based on 2 partial tracts) A) FHA, FSA/RHS & VA B) Conventional C) Refinancings D) Home Improvement Loans E) Loans on Dwellings For 5+ Families F) Non-occupant Loans on Number Average Value Number Average Value Number Average Value Number Average Value Number Average Value Number Average Value
LOANS ORIGINATED 35 $94,830 83 $95,597 233 $84,227 13 $13,850 1 $250,570 14 $70,541 APPLICATIONS APPROVED, NOT ACCEPTED 1 $45,620 12 $75,342 36 $88,310 3 $15,953 0 $0 3 $51,177 APPLICATIONS DENIED 2 $89,440 21 $80,180 81 $77,603 17 $14,792 0 $0 5 $76,100 APPLICATIONS WITHDRAWN 1 $71,260 9 $125,094 43 $80,337 2 $9,065 0 $0 1 $84,010 FILES CLOSED FOR INCOMPLETENESS 0 $0 7 $88,476 35 $83,247 0 $0 0 $0 4 $65,902
Aggregated Statistics For Year 2001(Based on 2 partial tracts) A) FHA, FSA/RHS & VA B) Conventional C) Refinancings D) Home Improvement Loans F) Non-occupant Loans on Number Average Value Number Average Value Number Average Value Number Average Value Number Average Value
LOANS ORIGINATED 41 $88,563 86 $86,768 193 $80,964 20 $21,570 18 $65,106 APPLICATIONS APPROVED, NOT ACCEPTED 1 $51,420 11 $86,737 28 $73,956 7 $24,954 4 $44,948 APPLICATIONS DENIED 3 $76,523 35 $73,892 88 $69,114 14 $26,297 7 $62,914 APPLICATIONS WITHDRAWN 1 $91,360 7 $94,937 58 $81,796 1 $10,920 3 $71,487 FILES CLOSED FOR INCOMPLETENESS 1 $52,870 2 $96,125 14 $88,534 0 $0 2 $86,180
Aggregated Statistics For Year 2000(Based on 2 partial tracts) A) FHA, FSA/RHS & VA B) Conventional C) Refinancings D) Home Improvement Loans E) Loans on Dwellings For 5+ Families F) Non-occupant Loans on Number Average Value Number Average Value Number Average Value Number Average Value Number Average Value Number Average Value
LOANS ORIGINATED 30 $85,371 82 $89,241 74 $67,784 34 $17,844 0 $0 20 $55,669 APPLICATIONS APPROVED, NOT ACCEPTED 1 $54,410 10 $62,715 23 $73,030 9 $24,822 0 $0 1 $5,070 APPLICATIONS DENIED 2 $79,355 53 $48,711 72 $60,461 19 $19,838 1 $60,110 4 $54,558 APPLICATIONS WITHDRAWN 1 $113,910 9 $69,278 42 $59,524 4 $29,032 0 $0 4 $44,175 FILES CLOSED FOR INCOMPLETENESS 1 $47,800 1 $113,700 7 $80,033 1 $1,470 0 $0 1 $71,700
Aggregated Statistics For Year 1999(Based on 2 partial tracts) A) FHA, FSA/RHS & VA B) Conventional C) Refinancings D) Home Improvement Loans E) Loans on Dwellings For 5+ Families F) Non-occupant Loans on Number Average Value Number Average Value Number Average Value Number Average Value Number Average Value Number Average Value
LOANS ORIGINATED 42 $82,313 66 $76,466 138 $66,341 42 $14,793 1 $168,990 15 $56,533 APPLICATIONS APPROVED, NOT ACCEPTED 1 $90,710 5 $74,354 20 $75,628 5 $10,836 0 $0 3 $47,477 APPLICATIONS DENIED 2 $90,605 28 $51,496 58 $54,037 24 $11,230 0 $0 3 $42,713 APPLICATIONS WITHDRAWN 3 $66,203 6 $60,637 41 $64,323 2 $62,920 1 $47,460 1 $88,490 FILES CLOSED FOR INCOMPLETENESS 0 $0 1 $17,980 9 $60,156 1 $32,360 0 $0 0 $0
Detailed HMDA statistics for the following Tracts:
0209.00
, 0210.00
Private Mortgage Insurance Companies Aggregated Statistics For Year 2009(Based on 2 partial tracts) A) Conventional B) Refinancings C) Non-occupant Loans on Number Average Value Number Average Value Number Average Value
LOANS ORIGINATED 0 $0 1 $68,510 0 $0 APPLICATIONS APPROVED, NOT ACCEPTED 1 $163,180 1 $61,000 1 $60,830 APPLICATIONS DENIED 0 $0 0 $0 0 $0 APPLICATIONS WITHDRAWN 1 $326,040 0 $0 0 $0 FILES CLOSED FOR INCOMPLETENESS 0 $0 0 $0 0 $0
Aggregated Statistics For Year 2008(Based on 2 partial tracts) A) Conventional B) Refinancings C) Non-occupant Loans on Number Average Value Number Average Value Number Average Value
LOANS ORIGINATED 7 $87,199 6 $109,415 2 $92,730 APPLICATIONS APPROVED, NOT ACCEPTED 2 $64,735 2 $130,770 1 $31,140 APPLICATIONS DENIED 1 $82,000 3 $92,380 2 $100,740 APPLICATIONS WITHDRAWN 1 $120,490 1 $117,560 0 $0 FILES CLOSED FOR INCOMPLETENESS 0 $0 0 $0 0 $0
Aggregated Statistics For Year 2007(Based on 2 partial tracts) A) Conventional B) Refinancings C) Non-occupant Loans on Number Average Value Number Average Value Number Average Value
LOANS ORIGINATED 28 $110,498 12 $124,557 2 $83,645 APPLICATIONS APPROVED, NOT ACCEPTED 4 $118,760 4 $114,752 1 $97,770 APPLICATIONS DENIED 0 $0 1 $148,890 1 $57,940 APPLICATIONS WITHDRAWN 0 $0 1 $100,810 1 $57,940 FILES CLOSED FOR INCOMPLETENESS 0 $0 0 $0 0 $0
Aggregated Statistics For Year 2006(Based on 2 partial tracts) A) Conventional B) Refinancings Number Average Value Number Average Value
LOANS ORIGINATED 22 $105,308 9 $133,309 APPLICATIONS APPROVED, NOT ACCEPTED 2 $119,335 1 $74,430 APPLICATIONS DENIED 1 $76,100 0 $0 APPLICATIONS WITHDRAWN 1 $71,970 0 $0 FILES CLOSED FOR INCOMPLETENESS 0 $0 1 $92,700
Aggregated Statistics For Year 2005(Based on 2 partial tracts) A) Conventional B) Refinancings C) Non-occupant Loans on Number Average Value Number Average Value Number Average Value
LOANS ORIGINATED 24 $102,757 16 $117,394 3 $79,690 APPLICATIONS APPROVED, NOT ACCEPTED 8 $119,096 7 $133,666 1 $62,280 APPLICATIONS DENIED 1 $222,240 1 $91,250 0 $0 APPLICATIONS WITHDRAWN 1 $55,190 3 $80,033 1 $55,130 FILES CLOSED FOR INCOMPLETENESS 1 $110,210 0 $0 0 $0
Aggregated Statistics For Year 2004(Based on 2 partial tracts) A) Conventional B) Refinancings C) Non-occupant Loans on Number Average Value Number Average Value Number Average Value
LOANS ORIGINATED 28 $102,898 19 $119,951 2 $94,685 APPLICATIONS APPROVED, NOT ACCEPTED 2 $107,555 14 $100,531 0 $0 APPLICATIONS DENIED 1 $231,250 1 $172,360 0 $0 APPLICATIONS WITHDRAWN 1 $159,650 0 $0 0 $0 FILES CLOSED FOR INCOMPLETENESS 0 $0 0 $0 0 $0
Aggregated Statistics For Year 2003(Based on 2 partial tracts) A) Conventional B) Refinancings C) Non-occupant Loans on Number Average Value Number Average Value Number Average Value
LOANS ORIGINATED 41 $98,176 46 $96,620 6 $67,510 APPLICATIONS APPROVED, NOT ACCEPTED 9 $93,951 17 $102,111 1 $43,450 APPLICATIONS DENIED 3 $53,430 7 $115,449 0 $0 APPLICATIONS WITHDRAWN 0 $0 0 $0 0 $0 FILES CLOSED FOR INCOMPLETENESS 0 $0 1 $84,850 0 $0
Aggregated Statistics For Year 2002(Based on 2 partial tracts) A) Conventional B) Refinancings C) Non-occupant Loans on Number Average Value Number Average Value Number Average Value
LOANS ORIGINATED 33 $102,340 30 $103,972 3 $62,340 APPLICATIONS APPROVED, NOT ACCEPTED 9 $100,548 8 $103,966 1 $121,670 APPLICATIONS DENIED 7 $98,491 9 $88,989 1 $93,420 APPLICATIONS WITHDRAWN 2 $109,715 4 $91,152 1 $53,680 FILES CLOSED FOR INCOMPLETENESS 1 $43,450 1 $133,250 1 $43,450
Aggregated Statistics For Year 2001(Based on 2 partial tracts) A) Conventional B) Refinancings C) Non-occupant Loans on Number Average Value Number Average Value Number Average Value
LOANS ORIGINATED 28 $85,156 20 $92,848 6 $61,823 APPLICATIONS APPROVED, NOT ACCEPTED 6 $108,530 5 $88,684 0 $0 APPLICATIONS DENIED 2 $71,735 4 $90,010 2 $76,765 APPLICATIONS WITHDRAWN 1 $65,370 0 $0 0 $0 FILES CLOSED FOR INCOMPLETENESS 0 $0 0 $0 0 $0
Aggregated Statistics For Year 2000(Based on 2 partial tracts) A) Conventional B) Refinancings C) Non-occupant Loans on Number Average Value Number Average Value Number Average Value
LOANS ORIGINATED 27 $79,264 8 $85,372 4 $50,168 APPLICATIONS APPROVED, NOT ACCEPTED 6 $80,423 0 $0 0 $0 APPLICATIONS DENIED 8 $57,928 1 $51,420 1 $32,590 APPLICATIONS WITHDRAWN 0 $0 1 $54,530 0 $0 FILES CLOSED FOR INCOMPLETENESS 0 $0 0 $0 0 $0
Aggregated Statistics For Year 1999(Based on 2 partial tracts) A) Conventional B) Refinancings C) Non-occupant Loans on Number Average Value Number Average Value Number Average Value
LOANS ORIGINATED 22 $84,267 11 $75,525 1 $80,580 APPLICATIONS APPROVED, NOT ACCEPTED 1 $73,260 3 $92,153 0 $0 APPLICATIONS DENIED 12 $57,685 2 $94,130 3 $43,147 APPLICATIONS WITHDRAWN 0 $0 0 $0 0 $0 FILES CLOSED FOR INCOMPLETENESS 0 $0 0 $0 0 $0
Detailed PMIC statistics for the following Tracts:
0209.00
, 0210.00 Fire-safe hotels and motels in Charlotte, Michigan:
Americas Best Value Inn & Suites, 828 E Shepherd St, Charlotte, Michigan 48813 Phone: (517) 543-8288, Fax: (517) 543-8481
Comfort Inn, 1302 E Packard Hwy, Charlotte, Michigan 48813 Phone: (517) 543-7307, Fax: (517) 543-7311
All 2 fire-safe hotels and motels in Charlotte, Michigan
Most common first names in Charlotte, MI among deceased individuals Name Count Lived (average)
Mary 101 79.2 years Robert 91 71.9 years John 74 73.9 years William 69 75.0 years Charles 67 76.4 years James 59 70.3 years Ruth 56 80.8 years Helen 55 78.6 years George 51 75.1 years Margaret 48 78.2 years
Most common last names in Charlotte, MI among deceased individuals Last name Count Lived (average)
Smith 65 76.6 years Johnson 36 81.1 years Jones 28 76.1 years Miller 26 72.6 years King 25 77.4 years Williams 24 75.2 years Davis 21 77.4 years Reed 20 71.9 years Cook 19 82.1 years Brown 19 79.1 years
Charlotte compared to Michigan state average:
Median house value below state average. Unemployed percentage significantly below state average. Black race population percentage significantly below state average. Median age below state average. Foreign-born population percentage significantly below state average. Institutionalized population percentage above state average. Number of college students below state average.
#11 on the list of "Top 101 cities with the highest number of rapes per 100,000 residents, excludes tourist destinations and others with a lot of outsiders visiting based on city industries data (population 5,000+)"
#34 on the list of "Top 101 counties with the largest increase in the number of deaths per 1000 residents 2000-2006 to 2007-2013 (pop. 50,000+)"
#61 on the list of "Top 101 counties with the lowest total withdrawal of fresh water for public supply (pop. 50,000+)"
#74 on the list of "Top 101 counties with the lowest percentage of residents relocating to foreign countries in 2011"
#76 on the list of "Top 101 counties with the lowest number of births per 1000 residents 2007-2013"
#92 on the list of "Top 101 counties with the largest number of children under 18 without health insurance coverage in 2000 (pop. 50,000+)"
Top Patent Applicants
Ryan P. Gingras (7)
Steven R. Siler (3)
Robert J. Hanchar (3)
Randy Linn (3)
Roy Frank Engelbrecht (3)
Chad A. Mccoige (3)
Randy W. Linn (3)
Robert Hanchar (2)
Ronald Eugene Hannold (2)
Mark James Shewchuck (2)
Total of 46 patent applications in 2008-2024.
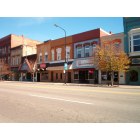
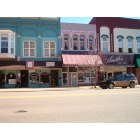
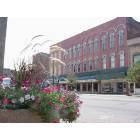
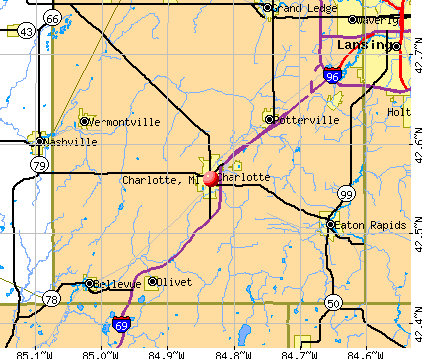


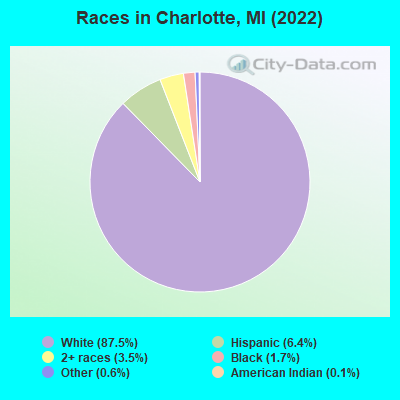
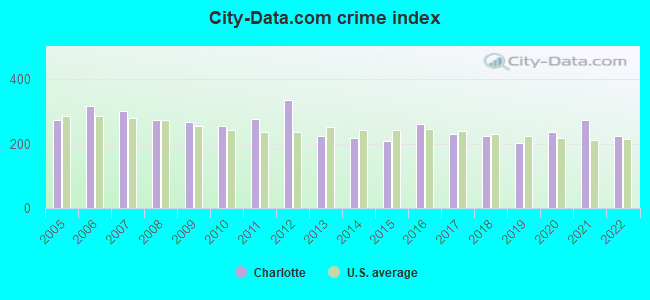
 Recent articles from our blog. Our writers, many of them Ph.D. graduates or candidates, create easy-to-read articles on a wide variety of topics.

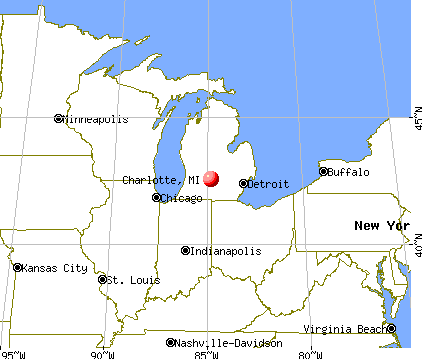
 (17.9 miles
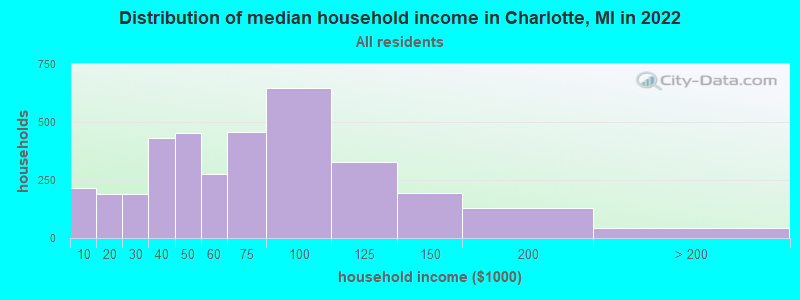
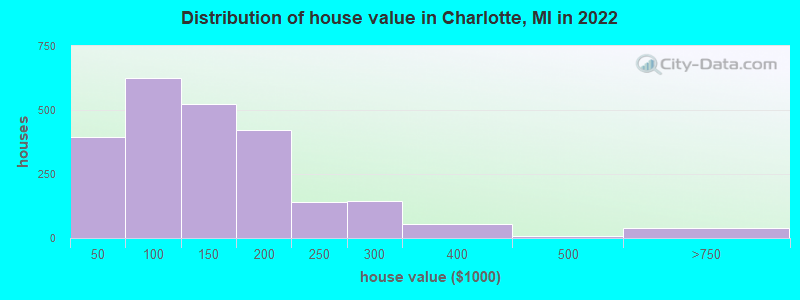

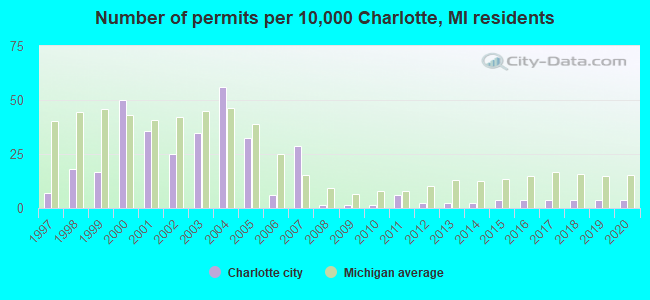
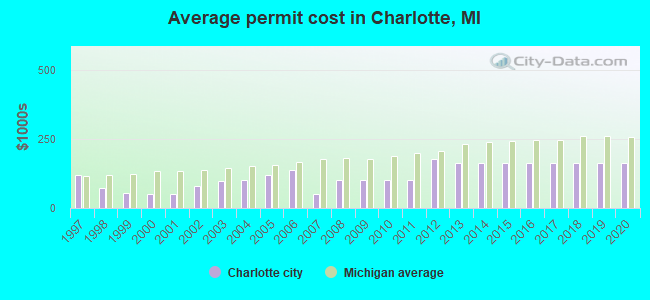
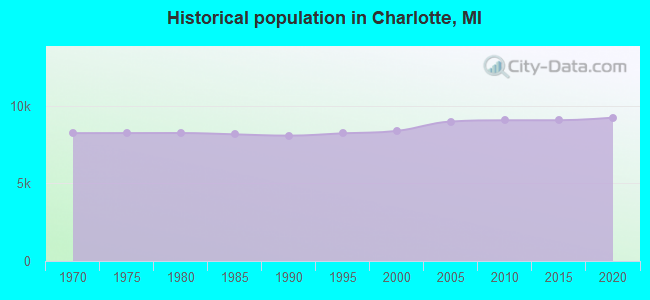
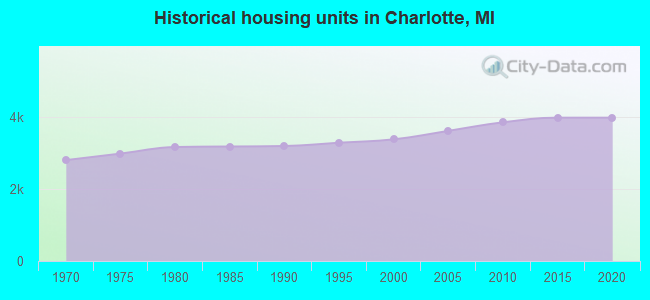
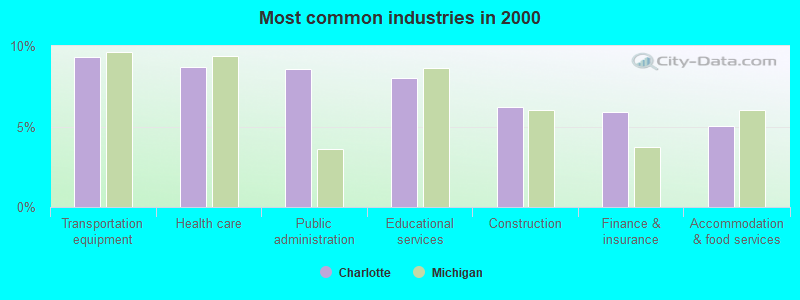
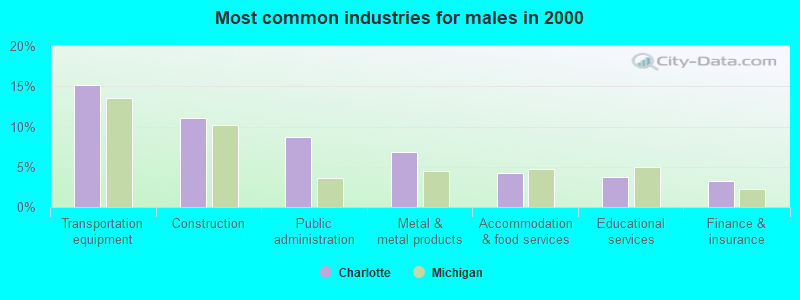
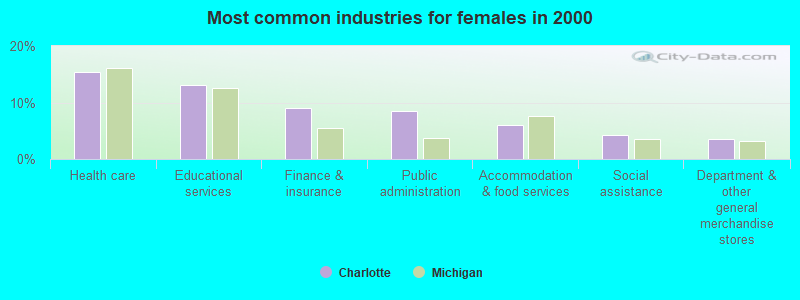
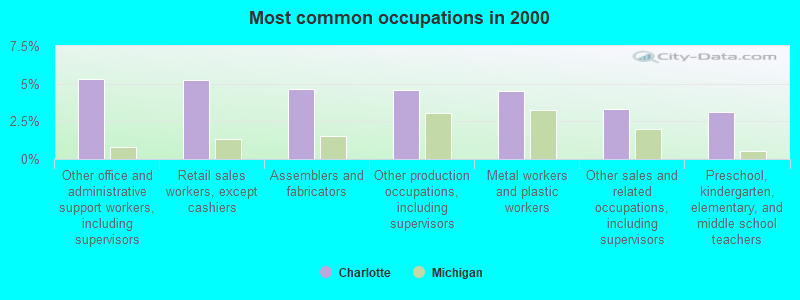
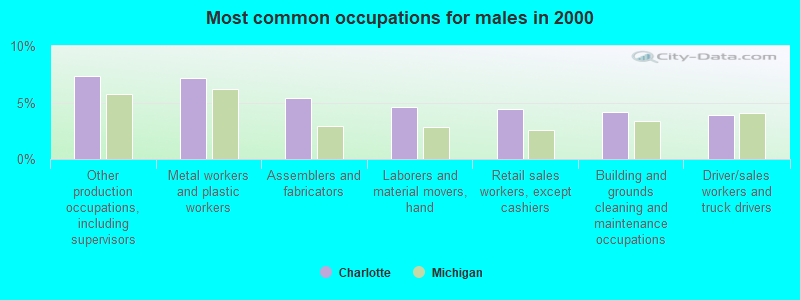
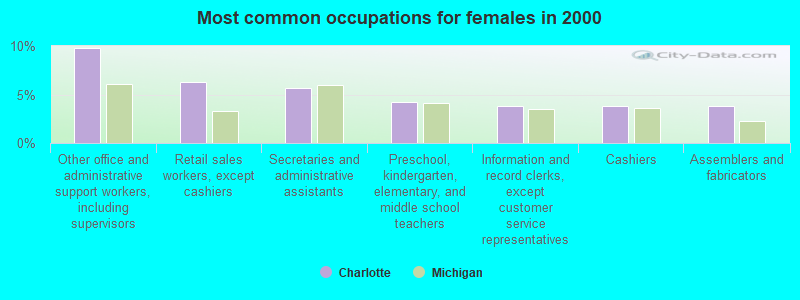
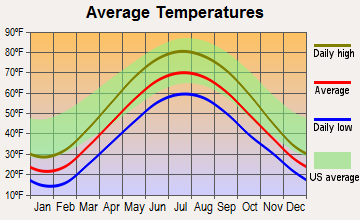
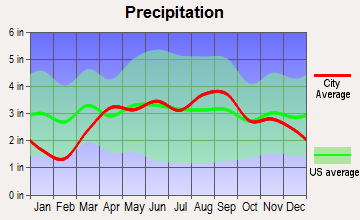
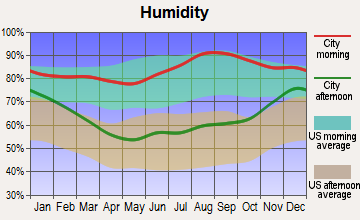
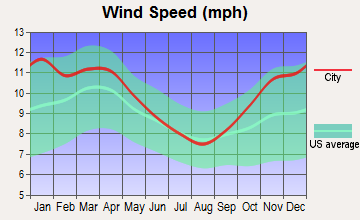
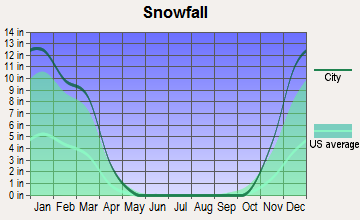
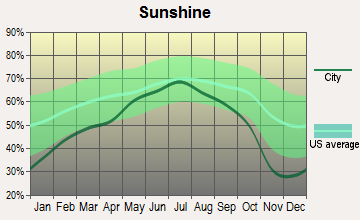
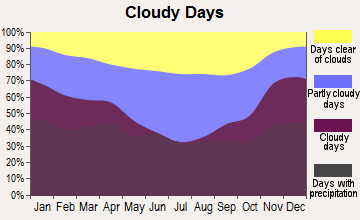


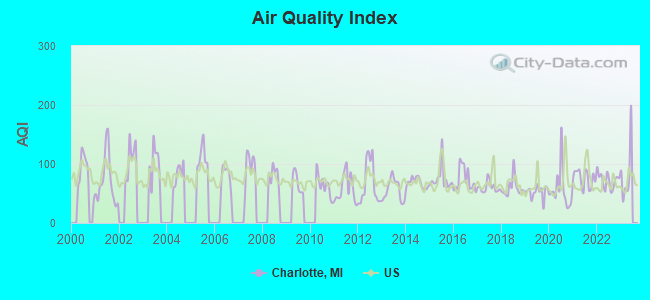
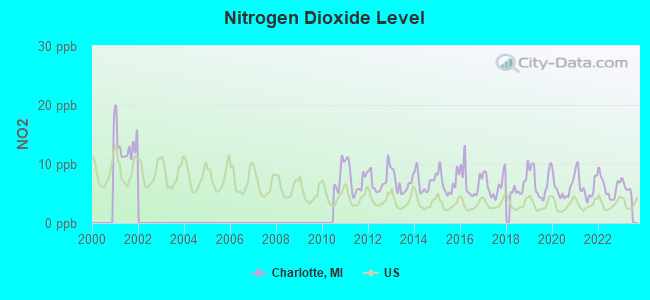
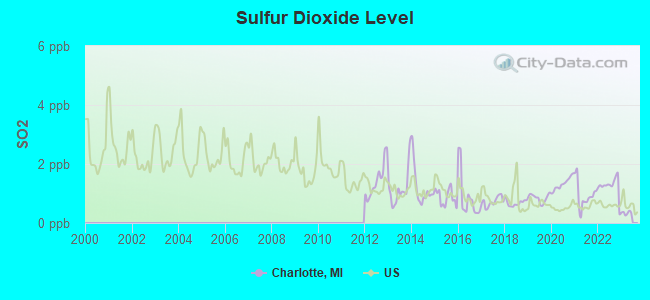
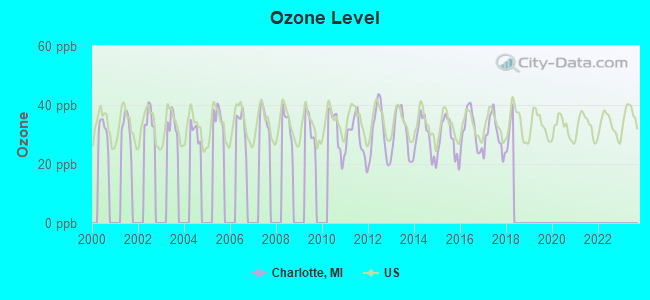
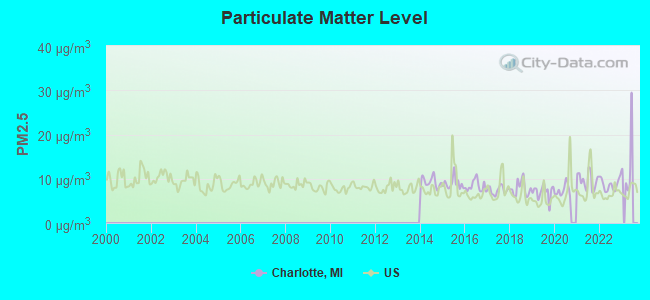

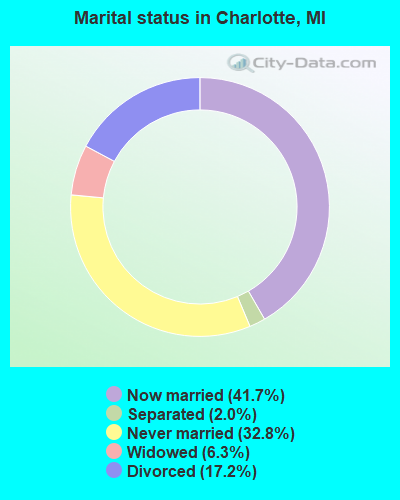
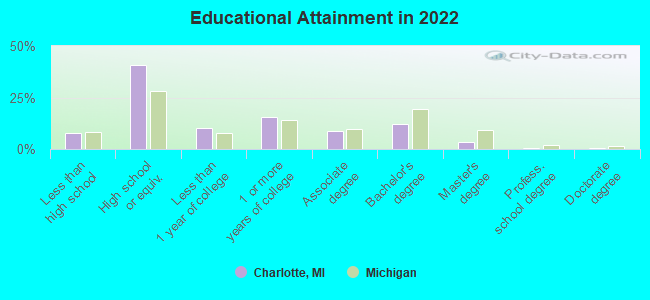
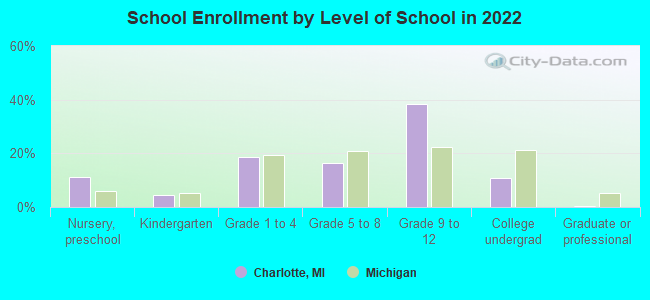
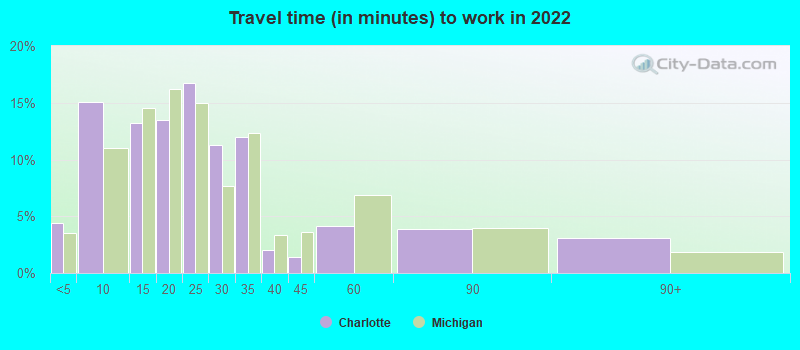
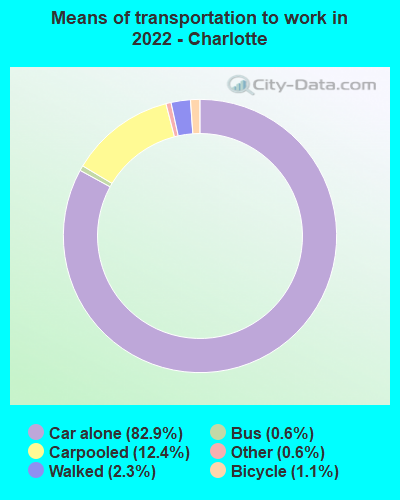
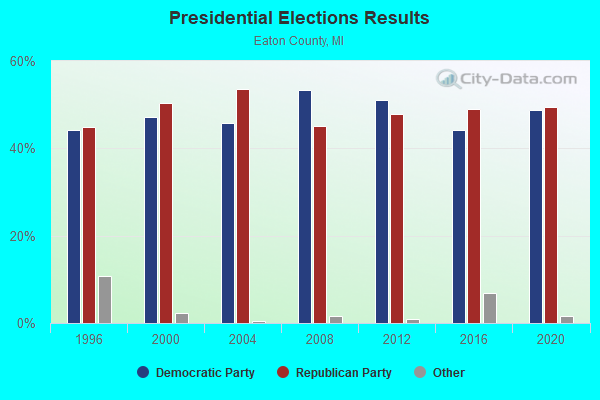
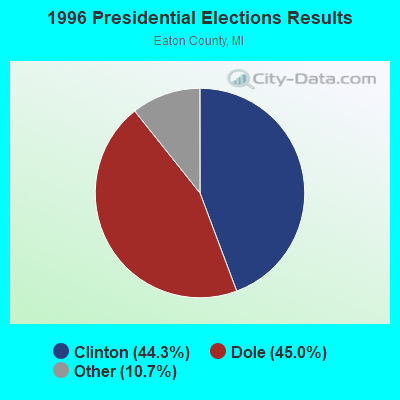
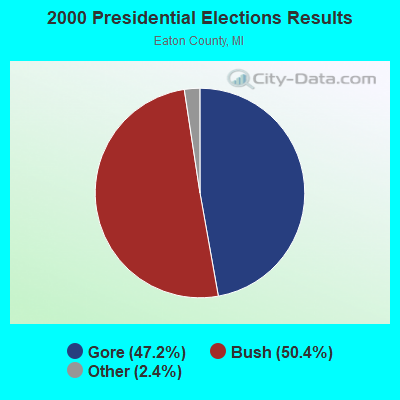
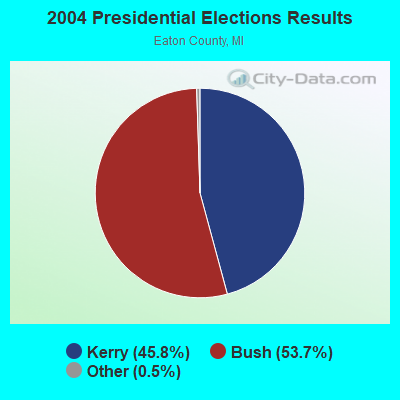
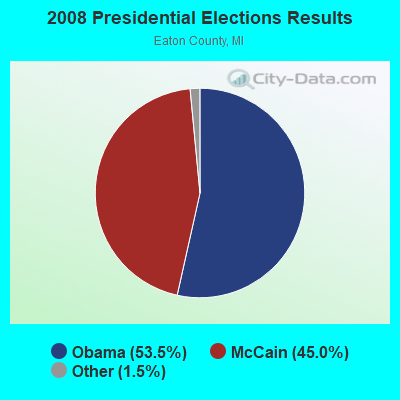
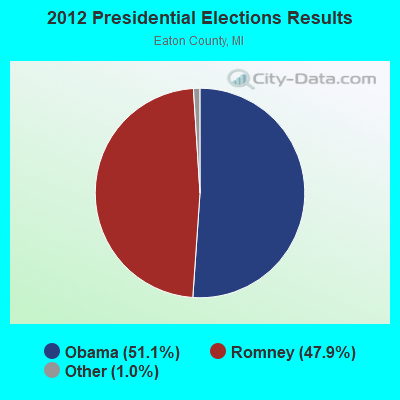
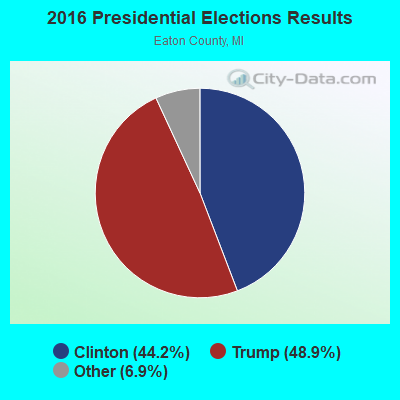
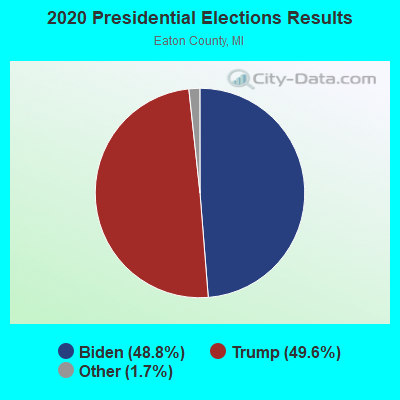
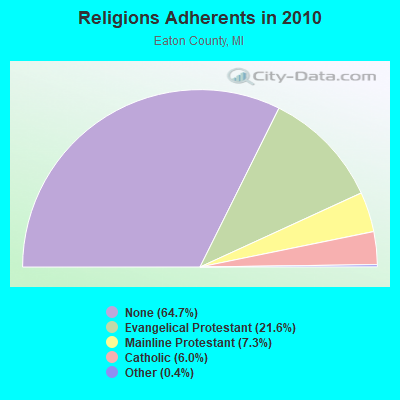
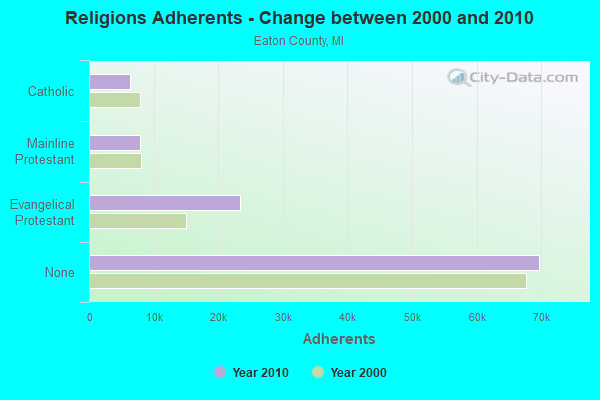
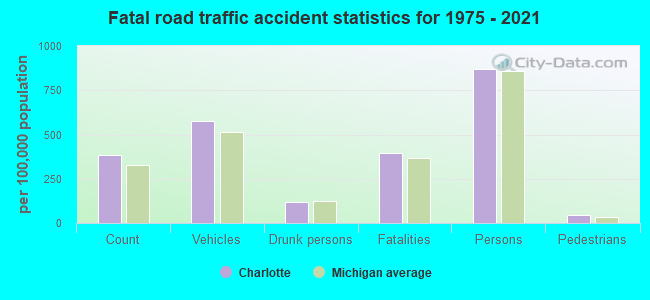
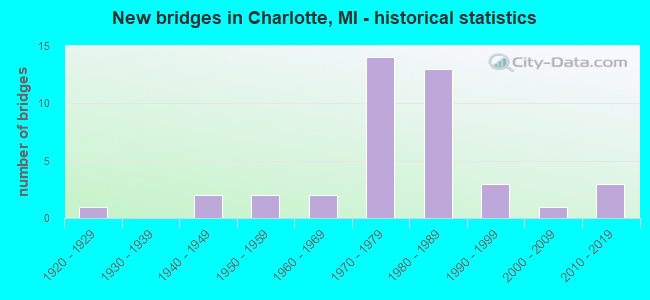
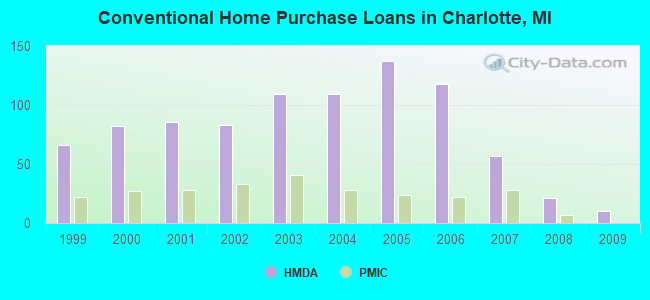
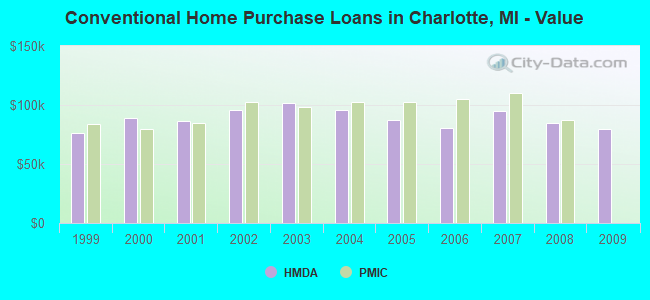
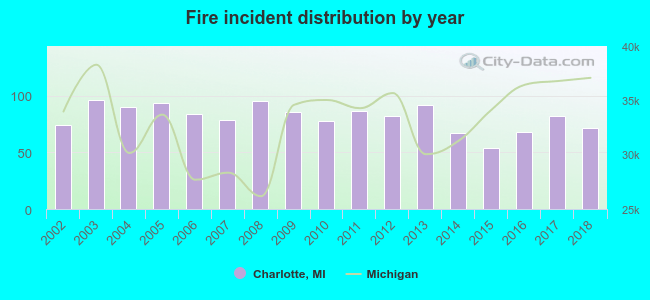 Based on the data from the years 2002 - 2018 the average number of fire incidents per year is 81. The highest number of reported fires - 96 took place in 2003, and the least - 54 in 2015. The data has a declining trend.
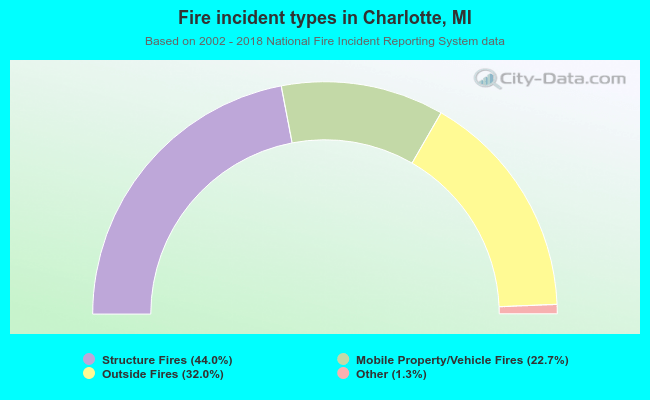 When looking into fire subcategories, the most reports belonged to: Structure Fires (44.0%), and Outside Fires (32.0%).