Cumberland, Maryland Submit your own pictures of this city and show them to the world
OSM Map
General Map
Google Map
MSN Map
OSM Map
General Map
Google Map
MSN Map
OSM Map
General Map
Google Map
MSN Map
OSM Map
General Map
Google Map
MSN Map
Please wait while loading the map...
Population in 2022: 18,769 (100% urban, 0% rural). Population change since 2000: -12.8%Males: 9,382 Females: 9,387
March 2022 cost of living index in Cumberland: 83.9 (less than average, U.S. average is 100) Percentage of residents living in poverty in 2022: 21.8%for White Non-Hispanic residents , 41.6% for Black residents , 46.9% for Hispanic or Latino residents , 81.2% for American Indian residents , 78.7% for other race residents , 26.2% for two or more races residents )
Profiles of local businesses
Business Search - 14 Million verified businesses
Data:
Median household income ($)
Median household income (% change since 2000)
Household income diversity
Ratio of average income to average house value (%)
Ratio of average income to average rent
Median household income ($) - White
Median household income ($) - Black or African American
Median household income ($) - Asian
Median household income ($) - Hispanic or Latino
Median household income ($) - American Indian and Alaska Native
Median household income ($) - Multirace
Median household income ($) - Other Race
Median household income for houses/condos with a mortgage ($)
Median household income for apartments without a mortgage ($)
Races - White alone (%)
Races - White alone (% change since 2000)
Races - Black alone (%)
Races - Black alone (% change since 2000)
Races - American Indian alone (%)
Races - American Indian alone (% change since 2000)
Races - Asian alone (%)
Races - Asian alone (% change since 2000)
Races - Hispanic (%)
Races - Hispanic (% change since 2000)
Races - Native Hawaiian and Other Pacific Islander alone (%)
Races - Native Hawaiian and Other Pacific Islander alone (% change since 2000)
Races - Two or more races (%)
Races - Two or more races (% change since 2000)
Races - Other race alone (%)
Races - Other race alone (% change since 2000)
Racial diversity
Unemployment (%)
Unemployment (% change since 2000)
Unemployment (%) - White
Unemployment (%) - Black or African American
Unemployment (%) - Asian
Unemployment (%) - Hispanic or Latino
Unemployment (%) - American Indian and Alaska Native
Unemployment (%) - Multirace
Unemployment (%) - Other Race
Population density (people per square mile)
Population - Males (%)
Population - Females (%)
Population - Males (%) - White
Population - Males (%) - Black or African American
Population - Males (%) - Asian
Population - Males (%) - Hispanic or Latino
Population - Males (%) - American Indian and Alaska Native
Population - Males (%) - Multirace
Population - Males (%) - Other Race
Population - Females (%) - White
Population - Females (%) - Black or African American
Population - Females (%) - Asian
Population - Females (%) - Hispanic or Latino
Population - Females (%) - American Indian and Alaska Native
Population - Females (%) - Multirace
Population - Females (%) - Other Race
Coronavirus confirmed cases (Apr 27, 2024)
Deaths caused by coronavirus (Apr 27, 2024)
Coronavirus confirmed cases (per 100k population) (Apr 27, 2024)
Deaths caused by coronavirus (per 100k population) (Apr 27, 2024)
Daily increase in number of cases (Apr 27, 2024)
Weekly increase in number of cases (Apr 27, 2024)
Cases doubled (in days) (Apr 27, 2024)
Hospitalized patients (Apr 18, 2022)
Negative test results (Apr 18, 2022)
Total test results (Apr 18, 2022)
COVID Vaccine doses distributed (per 100k population) (Sep 19, 2023)
COVID Vaccine doses administered (per 100k population) (Sep 19, 2023)
COVID Vaccine doses distributed (Sep 19, 2023)
COVID Vaccine doses administered (Sep 19, 2023)
Likely homosexual households (%)
Likely homosexual households (% change since 2000)
Likely homosexual households - Lesbian couples (%)
Likely homosexual households - Lesbian couples (% change since 2000)
Likely homosexual households - Gay men (%)
Likely homosexual households - Gay men (% change since 2000)
Cost of living index
Median gross rent ($)
Median contract rent ($)
Median monthly housing costs ($)
Median house or condo value ($)
Median house or condo value ($ change since 2000)
Mean house or condo value by units in structure - 1, detached ($)
Mean house or condo value by units in structure - 1, attached ($)
Mean house or condo value by units in structure - 2 ($)
Mean house or condo value by units in structure by units in structure - 3 or 4 ($)
Mean house or condo value by units in structure - 5 or more ($)
Mean house or condo value by units in structure - Boat, RV, van, etc. ($)
Mean house or condo value by units in structure - Mobile home ($)
Median house or condo value ($) - White
Median house or condo value ($) - Black or African American
Median house or condo value ($) - Asian
Median house or condo value ($) - Hispanic or Latino
Median house or condo value ($) - American Indian and Alaska Native
Median house or condo value ($) - Multirace
Median house or condo value ($) - Other Race
Median resident age
Resident age diversity
Median resident age - Males
Median resident age - Females
Median resident age - White
Median resident age - Black or African American
Median resident age - Asian
Median resident age - Hispanic or Latino
Median resident age - American Indian and Alaska Native
Median resident age - Multirace
Median resident age - Other Race
Median resident age - Males - White
Median resident age - Males - Black or African American
Median resident age - Males - Asian
Median resident age - Males - Hispanic or Latino
Median resident age - Males - American Indian and Alaska Native
Median resident age - Males - Multirace
Median resident age - Males - Other Race
Median resident age - Females - White
Median resident age - Females - Black or African American
Median resident age - Females - Asian
Median resident age - Females - Hispanic or Latino
Median resident age - Females - American Indian and Alaska Native
Median resident age - Females - Multirace
Median resident age - Females - Other Race
Commute - mean travel time to work (minutes)
Travel time to work - Less than 5 minutes (%)
Travel time to work - Less than 5 minutes (% change since 2000)
Travel time to work - 5 to 9 minutes (%)
Travel time to work - 5 to 9 minutes (% change since 2000)
Travel time to work - 10 to 19 minutes (%)
Travel time to work - 10 to 19 minutes (% change since 2000)
Travel time to work - 20 to 29 minutes (%)
Travel time to work - 20 to 29 minutes (% change since 2000)
Travel time to work - 30 to 39 minutes (%)
Travel time to work - 30 to 39 minutes (% change since 2000)
Travel time to work - 40 to 59 minutes (%)
Travel time to work - 40 to 59 minutes (% change since 2000)
Travel time to work - 60 to 89 minutes (%)
Travel time to work - 60 to 89 minutes (% change since 2000)
Travel time to work - 90 or more minutes (%)
Travel time to work - 90 or more minutes (% change since 2000)
Marital status - Never married (%)
Marital status - Now married (%)
Marital status - Separated (%)
Marital status - Widowed (%)
Marital status - Divorced (%)
Median family income ($)
Median family income (% change since 2000)
Median non-family income ($)
Median non-family income (% change since 2000)
Median per capita income ($)
Median per capita income (% change since 2000)
Median family income ($) - White
Median family income ($) - Black or African American
Median family income ($) - Asian
Median family income ($) - Hispanic or Latino
Median family income ($) - American Indian and Alaska Native
Median family income ($) - Multirace
Median family income ($) - Other Race
Median year house/condo built
Median year apartment built
Year house built - Built 2005 or later (%)
Year house built - Built 2000 to 2004 (%)
Year house built - Built 1990 to 1999 (%)
Year house built - Built 1980 to 1989 (%)
Year house built - Built 1970 to 1979 (%)
Year house built - Built 1960 to 1969 (%)
Year house built - Built 1950 to 1959 (%)
Year house built - Built 1940 to 1949 (%)
Year house built - Built 1939 or earlier (%)
Average household size
Household density (households per square mile)
Average household size - White
Average household size - Black or African American
Average household size - Asian
Average household size - Hispanic or Latino
Average household size - American Indian and Alaska Native
Average household size - Multirace
Average household size - Other Race
Occupied housing units (%)
Vacant housing units (%)
Owner occupied housing units (%)
Renter occupied housing units (%)
Vacancy status - For rent (%)
Vacancy status - For sale only (%)
Vacancy status - Rented or sold, not occupied (%)
Vacancy status - For seasonal, recreational, or occasional use (%)
Vacancy status - For migrant workers (%)
Vacancy status - Other vacant (%)
Residents with income below the poverty level (%)
Residents with income below 50% of the poverty level (%)
Children below poverty level (%)
Poor families by family type - Married-couple family (%)
Poor families by family type - Male, no wife present (%)
Poor families by family type - Female, no husband present (%)
Poverty status for native-born residents (%)
Poverty status for foreign-born residents (%)
Poverty among high school graduates not in families (%)
Poverty among people who did not graduate high school not in families (%)
Residents with income below the poverty level (%) - White
Residents with income below the poverty level (%) - Black or African American
Residents with income below the poverty level (%) - Asian
Residents with income below the poverty level (%) - Hispanic or Latino
Residents with income below the poverty level (%) - American Indian and Alaska Native
Residents with income below the poverty level (%) - Multirace
Residents with income below the poverty level (%) - Other Race
Air pollution - Air Quality Index (AQI)
Air pollution - CO
Air pollution - NO2
Air pollution - SO2
Air pollution - Ozone
Air pollution - PM10
Air pollution - PM25
Air pollution - Pb
Crime - Murders per 100,000 population
Crime - Rapes per 100,000 population
Crime - Robberies per 100,000 population
Crime - Assaults per 100,000 population
Crime - Burglaries per 100,000 population
Crime - Thefts per 100,000 population
Crime - Auto thefts per 100,000 population
Crime - Arson per 100,000 population
Crime - City-data.com crime index
Crime - Violent crime index
Crime - Property crime index
Crime - Murders per 100,000 population (5 year average)
Crime - Rapes per 100,000 population (5 year average)
Crime - Robberies per 100,000 population (5 year average)
Crime - Assaults per 100,000 population (5 year average)
Crime - Burglaries per 100,000 population (5 year average)
Crime - Thefts per 100,000 population (5 year average)
Crime - Auto thefts per 100,000 population (5 year average)
Crime - Arson per 100,000 population (5 year average)
Crime - City-data.com crime index (5 year average)
Crime - Violent crime index (5 year average)
Crime - Property crime index (5 year average)
1996 Presidential Elections Results (%) - Democratic Party (Clinton)
1996 Presidential Elections Results (%) - Republican Party (Dole)
1996 Presidential Elections Results (%) - Other
2000 Presidential Elections Results (%) - Democratic Party (Gore)
2000 Presidential Elections Results (%) - Republican Party (Bush)
2000 Presidential Elections Results (%) - Other
2004 Presidential Elections Results (%) - Democratic Party (Kerry)
2004 Presidential Elections Results (%) - Republican Party (Bush)
2004 Presidential Elections Results (%) - Other
2008 Presidential Elections Results (%) - Democratic Party (Obama)
2008 Presidential Elections Results (%) - Republican Party (McCain)
2008 Presidential Elections Results (%) - Other
2012 Presidential Elections Results (%) - Democratic Party (Obama)
2012 Presidential Elections Results (%) - Republican Party (Romney)
2012 Presidential Elections Results (%) - Other
2016 Presidential Elections Results (%) - Democratic Party (Clinton)
2016 Presidential Elections Results (%) - Republican Party (Trump)
2016 Presidential Elections Results (%) - Other
2020 Presidential Elections Results (%) - Democratic Party (Biden)
2020 Presidential Elections Results (%) - Republican Party (Trump)
2020 Presidential Elections Results (%) - Other
Ancestries Reported - Arab (%)
Ancestries Reported - Czech (%)
Ancestries Reported - Danish (%)
Ancestries Reported - Dutch (%)
Ancestries Reported - English (%)
Ancestries Reported - French (%)
Ancestries Reported - French Canadian (%)
Ancestries Reported - German (%)
Ancestries Reported - Greek (%)
Ancestries Reported - Hungarian (%)
Ancestries Reported - Irish (%)
Ancestries Reported - Italian (%)
Ancestries Reported - Lithuanian (%)
Ancestries Reported - Norwegian (%)
Ancestries Reported - Polish (%)
Ancestries Reported - Portuguese (%)
Ancestries Reported - Russian (%)
Ancestries Reported - Scotch-Irish (%)
Ancestries Reported - Scottish (%)
Ancestries Reported - Slovak (%)
Ancestries Reported - Subsaharan African (%)
Ancestries Reported - Swedish (%)
Ancestries Reported - Swiss (%)
Ancestries Reported - Ukrainian (%)
Ancestries Reported - United States (%)
Ancestries Reported - Welsh (%)
Ancestries Reported - West Indian (%)
Ancestries Reported - Other (%)
Educational Attainment - No schooling completed (%)
Educational Attainment - Less than high school (%)
Educational Attainment - High school or equivalent (%)
Educational Attainment - Less than 1 year of college (%)
Educational Attainment - 1 or more years of college (%)
Educational Attainment - Associate degree (%)
Educational Attainment - Bachelor's degree (%)
Educational Attainment - Master's degree (%)
Educational Attainment - Professional school degree (%)
Educational Attainment - Doctorate degree (%)
School Enrollment - Nursery, preschool (%)
School Enrollment - Kindergarten (%)
School Enrollment - Grade 1 to 4 (%)
School Enrollment - Grade 5 to 8 (%)
School Enrollment - Grade 9 to 12 (%)
School Enrollment - College undergrad (%)
School Enrollment - Graduate or professional (%)
School Enrollment - Not enrolled in school (%)
School enrollment - Public schools (%)
School enrollment - Private schools (%)
School enrollment - Not enrolled (%)
Median number of rooms in houses and condos
Median number of rooms in apartments
Housing units lacking complete plumbing facilities (%)
Housing units lacking complete kitchen facilities (%)
Density of houses
Urban houses (%)
Rural houses (%)
Households with people 60 years and over (%)
Households with people 65 years and over (%)
Households with people 75 years and over (%)
Households with one or more nonrelatives (%)
Households with no nonrelatives (%)
Population in households (%)
Family households (%)
Nonfamily households (%)
Population in families (%)
Family households with own children (%)
Median number of bedrooms in owner occupied houses
Mean number of bedrooms in owner occupied houses
Median number of bedrooms in renter occupied houses
Mean number of bedrooms in renter occupied houses
Median number of vehichles in owner occupied houses
Mean number of vehichles in owner occupied houses
Median number of vehichles in renter occupied houses
Mean number of vehichles in renter occupied houses
Mortgage status - with mortgage (%)
Mortgage status - with second mortgage (%)
Mortgage status - with home equity loan (%)
Mortgage status - with both second mortgage and home equity loan (%)
Mortgage status - without a mortgage (%)
Average family size
Average family size - White
Average family size - Black or African American
Average family size - Asian
Average family size - Hispanic or Latino
Average family size - American Indian and Alaska Native
Average family size - Multirace
Average family size - Other Race
Geographical mobility - Same house 1 year ago (%)
Geographical mobility - Moved within same county (%)
Geographical mobility - Moved from different county within same state (%)
Geographical mobility - Moved from different state (%)
Geographical mobility - Moved from abroad (%)
Place of birth - Born in state of residence (%)
Place of birth - Born in other state (%)
Place of birth - Native, outside of US (%)
Place of birth - Foreign born (%)
Housing units in structures - 1, detached (%)
Housing units in structures - 1, attached (%)
Housing units in structures - 2 (%)
Housing units in structures - 3 or 4 (%)
Housing units in structures - 5 to 9 (%)
Housing units in structures - 10 to 19 (%)
Housing units in structures - 20 to 49 (%)
Housing units in structures - 50 or more (%)
Housing units in structures - Mobile home (%)
Housing units in structures - Boat, RV, van, etc. (%)
House/condo owner moved in on average (years ago)
Renter moved in on average (years ago)
Year householder moved into unit - Moved in 1999 to March 2000 (%)
Year householder moved into unit - Moved in 1995 to 1998 (%)
Year householder moved into unit - Moved in 1990 to 1994 (%)
Year householder moved into unit - Moved in 1980 to 1989 (%)
Year householder moved into unit - Moved in 1970 to 1979 (%)
Year householder moved into unit - Moved in 1969 or earlier (%)
Means of transportation to work - Drove car alone (%)
Means of transportation to work - Carpooled (%)
Means of transportation to work - Public transportation (%)
Means of transportation to work - Bus or trolley bus (%)
Means of transportation to work - Streetcar or trolley car (%)
Means of transportation to work - Subway or elevated (%)
Means of transportation to work - Railroad (%)
Means of transportation to work - Ferryboat (%)
Means of transportation to work - Taxicab (%)
Means of transportation to work - Motorcycle (%)
Means of transportation to work - Bicycle (%)
Means of transportation to work - Walked (%)
Means of transportation to work - Other means (%)
Working at home (%)
Industry diversity
Most Common Industries - Agriculture, forestry, fishing and hunting, and mining (%)
Most Common Industries - Agriculture, forestry, fishing and hunting (%)
Most Common Industries - Mining, quarrying, and oil and gas extraction (%)
Most Common Industries - Construction (%)
Most Common Industries - Manufacturing (%)
Most Common Industries - Wholesale trade (%)
Most Common Industries - Retail trade (%)
Most Common Industries - Transportation and warehousing, and utilities (%)
Most Common Industries - Transportation and warehousing (%)
Most Common Industries - Utilities (%)
Most Common Industries - Information (%)
Most Common Industries - Finance and insurance, and real estate and rental and leasing (%)
Most Common Industries - Finance and insurance (%)
Most Common Industries - Real estate and rental and leasing (%)
Most Common Industries - Professional, scientific, and management, and administrative and waste management services (%)
Most Common Industries - Professional, scientific, and technical services (%)
Most Common Industries - Management of companies and enterprises (%)
Most Common Industries - Administrative and support and waste management services (%)
Most Common Industries - Educational services, and health care and social assistance (%)
Most Common Industries - Educational services (%)
Most Common Industries - Health care and social assistance (%)
Most Common Industries - Arts, entertainment, and recreation, and accommodation and food services (%)
Most Common Industries - Arts, entertainment, and recreation (%)
Most Common Industries - Accommodation and food services (%)
Most Common Industries - Other services, except public administration (%)
Most Common Industries - Public administration (%)
Occupation diversity
Most Common Occupations - Management, business, science, and arts occupations (%)
Most Common Occupations - Management, business, and financial occupations (%)
Most Common Occupations - Management occupations (%)
Most Common Occupations - Business and financial operations occupations (%)
Most Common Occupations - Computer, engineering, and science occupations (%)
Most Common Occupations - Computer and mathematical occupations (%)
Most Common Occupations - Architecture and engineering occupations (%)
Most Common Occupations - Life, physical, and social science occupations (%)
Most Common Occupations - Education, legal, community service, arts, and media occupations (%)
Most Common Occupations - Community and social service occupations (%)
Most Common Occupations - Legal occupations (%)
Most Common Occupations - Education, training, and library occupations (%)
Most Common Occupations - Arts, design, entertainment, sports, and media occupations (%)
Most Common Occupations - Healthcare practitioners and technical occupations (%)
Most Common Occupations - Health diagnosing and treating practitioners and other technical occupations (%)
Most Common Occupations - Health technologists and technicians (%)
Most Common Occupations - Service occupations (%)
Most Common Occupations - Healthcare support occupations (%)
Most Common Occupations - Protective service occupations (%)
Most Common Occupations - Fire fighting and prevention, and other protective service workers including supervisors (%)
Most Common Occupations - Law enforcement workers including supervisors (%)
Most Common Occupations - Food preparation and serving related occupations (%)
Most Common Occupations - Building and grounds cleaning and maintenance occupations (%)
Most Common Occupations - Personal care and service occupations (%)
Most Common Occupations - Sales and office occupations (%)
Most Common Occupations - Sales and related occupations (%)
Most Common Occupations - Office and administrative support occupations (%)
Most Common Occupations - Natural resources, construction, and maintenance occupations (%)
Most Common Occupations - Farming, fishing, and forestry occupations (%)
Most Common Occupations - Construction and extraction occupations (%)
Most Common Occupations - Installation, maintenance, and repair occupations (%)
Most Common Occupations - Production, transportation, and material moving occupations (%)
Most Common Occupations - Production occupations (%)
Most Common Occupations - Transportation occupations (%)
Most Common Occupations - Material moving occupations (%)
People in Group quarters - Institutionalized population (%)
People in Group quarters - Correctional institutions (%)
People in Group quarters - Federal prisons and detention centers (%)
People in Group quarters - Halfway houses (%)
People in Group quarters - Local jails and other confinement facilities (including police lockups) (%)
People in Group quarters - Military disciplinary barracks (%)
People in Group quarters - State prisons (%)
People in Group quarters - Other types of correctional institutions (%)
People in Group quarters - Nursing homes (%)
People in Group quarters - Hospitals/wards, hospices, and schools for the handicapped (%)
People in Group quarters - Hospitals/wards and hospices for chronically ill (%)
People in Group quarters - Hospices or homes for chronically ill (%)
People in Group quarters - Military hospitals or wards for chronically ill (%)
People in Group quarters - Other hospitals or wards for chronically ill (%)
People in Group quarters - Hospitals or wards for drug/alcohol abuse (%)
People in Group quarters - Mental (Psychiatric) hospitals or wards (%)
People in Group quarters - Schools, hospitals, or wards for the mentally retarded (%)
People in Group quarters - Schools, hospitals, or wards for the physically handicapped (%)
People in Group quarters - Institutions for the deaf (%)
People in Group quarters - Institutions for the blind (%)
People in Group quarters - Orthopedic wards and institutions for the physically handicapped (%)
People in Group quarters - Wards in general hospitals for patients who have no usual home elsewhere (%)
People in Group quarters - Wards in military hospitals for patients who have no usual home elsewhere (%)
People in Group quarters - Juvenile institutions (%)
People in Group quarters - Long-term care (%)
People in Group quarters - Homes for abused, dependent, and neglected children (%)
People in Group quarters - Residential treatment centers for emotionally disturbed children (%)
People in Group quarters - Training schools for juvenile delinquents (%)
People in Group quarters - Short-term care, detention or diagnostic centers for delinquent children (%)
People in Group quarters - Type of juvenile institution unknown (%)
People in Group quarters - Noninstitutionalized population (%)
People in Group quarters - College dormitories (includes college quarters off campus) (%)
People in Group quarters - Military quarters (%)
People in Group quarters - On base (%)
People in Group quarters - Barracks, unaccompanied personnel housing (UPH), (Enlisted/Officer), ;and similar group living quarters for military personnel (%)
People in Group quarters - Transient quarters for temporary residents (%)
People in Group quarters - Military ships (%)
People in Group quarters - Group homes (%)
People in Group quarters - Homes or halfway houses for drug/alcohol abuse (%)
People in Group quarters - Homes for the mentally ill (%)
People in Group quarters - Homes for the mentally retarded (%)
People in Group quarters - Homes for the physically handicapped (%)
People in Group quarters - Other group homes (%)
People in Group quarters - Religious group quarters (%)
People in Group quarters - Dormitories (%)
People in Group quarters - Agriculture workers' dormitories on farms (%)
People in Group quarters - Job Corps and vocational training facilities (%)
People in Group quarters - Other workers' dormitories (%)
People in Group quarters - Crews of maritime vessels (%)
People in Group quarters - Other nonhousehold living situations (%)
People in Group quarters - Other noninstitutional group quarters (%)
Residents speaking English at home (%)
Residents speaking English at home - Born in the United States (%)
Residents speaking English at home - Native, born elsewhere (%)
Residents speaking English at home - Foreign born (%)
Residents speaking Spanish at home (%)
Residents speaking Spanish at home - Born in the United States (%)
Residents speaking Spanish at home - Native, born elsewhere (%)
Residents speaking Spanish at home - Foreign born (%)
Residents speaking other language at home (%)
Residents speaking other language at home - Born in the United States (%)
Residents speaking other language at home - Native, born elsewhere (%)
Residents speaking other language at home - Foreign born (%)
Class of Workers - Employee of private company (%)
Class of Workers - Self-employed in own incorporated business (%)
Class of Workers - Private not-for-profit wage and salary workers (%)
Class of Workers - Local government workers (%)
Class of Workers - State government workers (%)
Class of Workers - Federal government workers (%)
Class of Workers - Self-employed workers in own not incorporated business and Unpaid family workers (%)
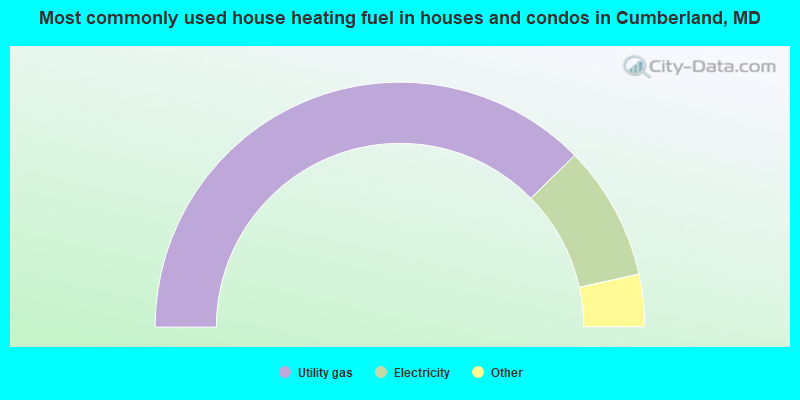
House heating fuel used in houses and condos - Utility gas (%)
House heating fuel used in houses and condos - Bottled, tank, or LP gas (%)
House heating fuel used in houses and condos - Electricity (%)
House heating fuel used in houses and condos - Fuel oil, kerosene, etc. (%)
House heating fuel used in houses and condos - Coal or coke (%)
House heating fuel used in houses and condos - Wood (%)
House heating fuel used in houses and condos - Solar energy (%)
House heating fuel used in houses and condos - Other fuel (%)
House heating fuel used in houses and condos - No fuel used (%)
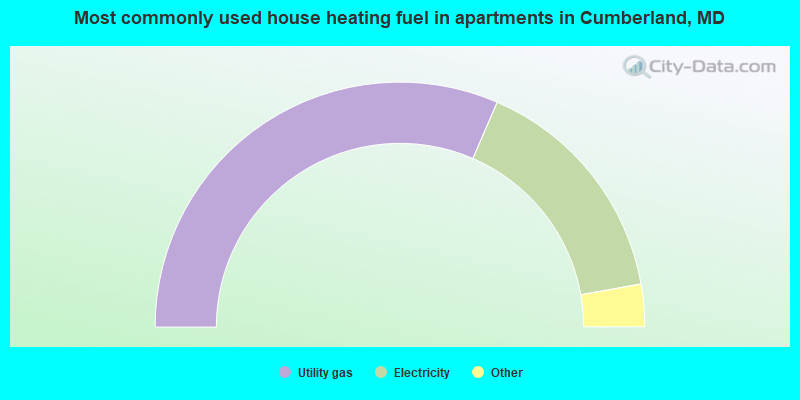
House heating fuel used in apartments - Utility gas (%)
House heating fuel used in apartments - Bottled, tank, or LP gas (%)
House heating fuel used in apartments - Electricity (%)
House heating fuel used in apartments - Fuel oil, kerosene, etc. (%)
House heating fuel used in apartments - Coal or coke (%)
House heating fuel used in apartments - Wood (%)
House heating fuel used in apartments - Solar energy (%)
House heating fuel used in apartments - Other fuel (%)
House heating fuel used in apartments - No fuel used (%)
Armed forces status - In Armed Forces (%)
Armed forces status - Civilian (%)
Armed forces status - Civilian - Veteran (%)
Armed forces status - Civilian - Nonveteran (%)
Fatal accidents locations in years 2005-2021
Fatal accidents locations in 2005
Fatal accidents locations in 2006
Fatal accidents locations in 2007
Fatal accidents locations in 2008
Fatal accidents locations in 2009
Fatal accidents locations in 2010
Fatal accidents locations in 2011
Fatal accidents locations in 2012
Fatal accidents locations in 2013
Fatal accidents locations in 2014
Fatal accidents locations in 2015
Fatal accidents locations in 2016
Fatal accidents locations in 2017
Fatal accidents locations in 2018
Fatal accidents locations in 2019
Fatal accidents locations in 2020
Fatal accidents locations in 2021
Alcohol use - People drinking some alcohol every month (%)
Alcohol use - People not drinking at all (%)
Alcohol use - Average days/month drinking alcohol
Alcohol use - Average drinks/week
Alcohol use - Average days/year people drink much
Audiometry - Average condition of hearing (%)
Audiometry - People that can hear a whisper from across a quiet room (%)
Audiometry - People that can hear normal voice from across a quiet room (%)
Audiometry - Ears ringing, roaring, buzzing (%)
Audiometry - Had a job exposure to loud noise (%)
Audiometry - Had off-work exposure to loud noise (%)
Blood Pressure & Cholesterol - Has high blood pressure (%)
Blood Pressure & Cholesterol - Checking blood pressure at home (%)
Blood Pressure & Cholesterol - Frequently checking blood cholesterol (%)
Blood Pressure & Cholesterol - Has high cholesterol level (%)
Consumer Behavior - Money monthly spent on food at supermarket/grocery store
Consumer Behavior - Money monthly spent on food at other stores
Consumer Behavior - Money monthly spent on eating out
Consumer Behavior - Money monthly spent on carryout/delivered foods
Consumer Behavior - Income spent on food at supermarket/grocery store (%)
Consumer Behavior - Income spent on food at other stores (%)
Consumer Behavior - Income spent on eating out (%)
Consumer Behavior - Income spent on carryout/delivered foods (%)
Current Health Status - General health condition (%)
Current Health Status - Blood donors (%)
Current Health Status - Has blood ever tested for HIV virus (%)
Current Health Status - Left-handed people (%)
Dermatology - People using sunscreen (%)
Diabetes - Diabetics (%)
Diabetes - Had a blood test for high blood sugar (%)
Diabetes - People taking insulin (%)
Diet Behavior & Nutrition - Diet health (%)
Diet Behavior & Nutrition - Milk product consumption (# of products/month)
Diet Behavior & Nutrition - Meals not home prepared (#/week)
Diet Behavior & Nutrition - Meals from fast food or pizza place (#/week)
Diet Behavior & Nutrition - Ready-to-eat foods (#/month)
Diet Behavior & Nutrition - Frozen meals/pizza (#/month)
Drug Use - People that ever used marijuana or hashish (%)
Drug Use - Ever used hard drugs (%)
Drug Use - Ever used any form of cocaine (%)
Drug Use - Ever used heroin (%)
Drug Use - Ever used methamphetamine (%)
Health Insurance - People covered by health insurance (%)
Kidney Conditions-Urology - Avg. # of times urinating at night
Medical Conditions - People with asthma (%)
Medical Conditions - People with anemia (%)
Medical Conditions - People with psoriasis (%)
Medical Conditions - People with overweight (%)
Medical Conditions - Elderly people having difficulties in thinking or remembering (%)
Medical Conditions - People who ever received blood transfusion (%)
Medical Conditions - People having trouble seeing even with glass/contacts (%)
Medical Conditions - People with arthritis (%)
Medical Conditions - People with gout (%)
Medical Conditions - People with congestive heart failure (%)
Medical Conditions - People with coronary heart disease (%)
Medical Conditions - People with angina pectoris (%)
Medical Conditions - People who ever had heart attack (%)
Medical Conditions - People who ever had stroke (%)
Medical Conditions - People with emphysema (%)
Medical Conditions - People with thyroid problem (%)
Medical Conditions - People with chronic bronchitis (%)
Medical Conditions - People with any liver condition (%)
Medical Conditions - People who ever had cancer or malignancy (%)
Mental Health - People who have little interest in doing things (%)
Mental Health - People feeling down, depressed, or hopeless (%)
Mental Health - People who have trouble sleeping or sleeping too much (%)
Mental Health - People feeling tired or having little energy (%)
Mental Health - People with poor appetite or overeating (%)
Mental Health - People feeling bad about themself (%)
Mental Health - People who have trouble concentrating on things (%)
Mental Health - People moving or speaking slowly or too fast (%)
Mental Health - People having thoughts they would be better off dead (%)
Oral Health - Average years since last visit a dentist
Oral Health - People embarrassed because of mouth (%)
Oral Health - People with gum disease (%)
Oral Health - General health of teeth and gums (%)
Oral Health - Average days a week using dental floss/device
Oral Health - Average days a week using mouthwash for dental problem
Oral Health - Average number of teeth
Pesticide Use - Households using pesticides to control insects (%)
Pesticide Use - Households using pesticides to kill weeds (%)
Physical Activity - People doing vigorous-intensity work activities (%)
Physical Activity - People doing moderate-intensity work activities (%)
Physical Activity - People walking or bicycling (%)
Physical Activity - People doing vigorous-intensity recreational activities (%)
Physical Activity - People doing moderate-intensity recreational activities (%)
Physical Activity - Average hours a day doing sedentary activities
Physical Activity - Average hours a day watching TV or videos
Physical Activity - Average hours a day using computer
Physical Functioning - People having limitations keeping them from working (%)
Physical Functioning - People limited in amount of work they can do (%)
Physical Functioning - People that need special equipment to walk (%)
Physical Functioning - People experiencing confusion/memory problems (%)
Physical Functioning - People requiring special healthcare equipment (%)
Prescription Medications - Average number of prescription medicines taking
Preventive Aspirin Use - Adults 40+ taking low-dose aspirin (%)
Reproductive Health - Vaginal deliveries (%)
Reproductive Health - Cesarean deliveries (%)
Reproductive Health - Deliveries resulted in a live birth (%)
Reproductive Health - Pregnancies resulted in a delivery (%)
Reproductive Health - Women breastfeeding newborns (%)
Reproductive Health - Women that had a hysterectomy (%)
Reproductive Health - Women that had both ovaries removed (%)
Reproductive Health - Women that have ever taken birth control pills (%)
Reproductive Health - Women taking birth control pills (%)
Reproductive Health - Women that have ever used Depo-Provera or injectables (%)
Reproductive Health - Women that have ever used female hormones (%)
Sexual Behavior - People 18+ that ever had sex (vaginal, anal, or oral) (%)
Sexual Behavior - Males 18+ that ever had vaginal sex with a woman (%)
Sexual Behavior - Males 18+ that ever performed oral sex on a woman (%)
Sexual Behavior - Males 18+ that ever had anal sex with a woman (%)
Sexual Behavior - Males 18+ that ever had any sex with a man (%)
Sexual Behavior - Females 18+ that ever had vaginal sex with a man (%)
Sexual Behavior - Females 18+ that ever performed oral sex on a man (%)
Sexual Behavior - Females 18+ that ever had anal sex with a man (%)
Sexual Behavior - Females 18+ that ever had any kind of sex with a woman (%)
Sexual Behavior - Average age people first had sex
Sexual Behavior - Average number of female sex partners in lifetime (males 18+)
Sexual Behavior - Average number of female vaginal sex partners in lifetime (males 18+)
Sexual Behavior - Average age people first performed oral sex on a woman (18+)
Sexual Behavior - Average number of woman performed oral sex on in lifetime (18+)
Sexual Behavior - Average number of male sex partners in lifetime (males 18+)
Sexual Behavior - Average number of male anal sex partners in lifetime (males 18+)
Sexual Behavior - Average age people first performed oral sex on a man (18+)
Sexual Behavior - Average number of male oral sex partners in lifetime (18+)
Sexual Behavior - People using protection when performing oral sex (%)
Sexual Behavior - Average number of times people have vaginal or anal sex a year
Sexual Behavior - People having sex without condom (%)
Sexual Behavior - Average number of male sex partners in lifetime (females 18+)
Sexual Behavior - Average number of male vaginal sex partners in lifetime (females 18+)
Sexual Behavior - Average number of female sex partners in lifetime (females 18+)
Sexual Behavior - Circumcised males 18+ (%)
Sleep Disorders - Average hours sleeping at night
Sleep Disorders - People that has trouble sleeping (%)
Smoking-Cigarette Use - People smoking cigarettes (%)
Taste & Smell - People 40+ having problems with smell (%)
Taste & Smell - People 40+ having problems with taste (%)
Taste & Smell - People 40+ that ever had wisdom teeth removed (%)
Taste & Smell - People 40+ that ever had tonsils teeth removed (%)
Taste & Smell - People 40+ that ever had a loss of consciousness because of a head injury (%)
Taste & Smell - People 40+ that ever had a broken nose or other serious injury to face or skull (%)
Taste & Smell - People 40+ that ever had two or more sinus infections (%)
Weight - Average height (inches)
Weight - Average weight (pounds)
Weight - Average BMI
Weight - People that are obese (%)
Weight - People that ever were obese (%)
Weight - People trying to lose weight (%)
Officers per 1,000 residents here:
2.58Maryland average:
2.47
Latest news from Cumberland, MD collected exclusively by city-data.com from local newspapers, TV, and radio stations
Ancestries: German (21.8%), American (15.2%), Italian (9.4%), English (8.9%), Irish (8.8%), Scottish (2.2%).
Current Local Time:
Land area: 9.07 square miles.
Population density: 2,070 people per square mile (low).
403 residents are foreign born (0.8% Asia , 0.7% Europe , 0.4% Latin America ).
This city:
2.1%Maryland:
15.7%
Median real estate property taxes paid for housing units with mortgages in 2022: $1,784 (1.5%)Median real estate property taxes paid for housing units with no mortgage in 2022: $1,645 (1.4%)
Nearest city with pop. 50,000+: Frederick, MD
Nearest city with pop. 200,000+: Pittsburgh, PA
Nearest city with pop. 1,000,000+: Philadelphia, PA
Nearest cities:
Latitude: 39.65 N, Longitude: 78.76 W
Daytime population change due to commuting: +4,745 (+25.3%)Workers who live and work in this city: 4,764 (68.5%)
Cumberland tourist attractions:
Single-family new house construction building permits:
2022: 2 buildings , average cost: $337,5002021: 5 buildings , average cost: $249,0002018: 2 buildings , average cost: $342,6002017: 1 building , cost: $165,0002016: 3 buildings , average cost: $250,3002014: 3 buildings , average cost: $151,7002013: 5 buildings , average cost: $165,6002012: 6 buildings , average cost: $155,8002011: 25 buildings , average cost: $172,9002010: 18 buildings , average cost: $302,1002009: 5 buildings , average cost: $192,0002008: 5 buildings , average cost: $164,6002007: 33 buildings , average cost: $129,8002006: 10 buildings , average cost: $166,3002005: 10 buildings , average cost: $166,3002004: 6 buildings , average cost: $206,2002003: 7 buildings , average cost: $200,8002002: 6 buildings , average cost: $200,8002001: 3 buildings , average cost: $116,7002000: 8 buildings , average cost: $114,6001999: 8 buildings , average cost: $114,6001998: 7 buildings , average cost: $114,6001997: 7 buildings , average cost: $114,600Unemployment in December 2023:
Most common occupations in Cumberland, MD (%)
Both Males Females
Cashiers (4.6%)
Building and grounds cleaning and maintenance occupations (4.4%)
Secretaries and administrative assistants (4.4%)
Other sales and related occupations, including supervisors (4.3%)
Driver/sales workers and truck drivers (4.2%)
Other office and administrative support workers, including supervisors (3.6%)
Nursing, psychiatric, and home health aides (3.4%)
Driver/sales workers and truck drivers (8.2%)
Law enforcement workers, including supervisors (5.9%)
Building and grounds cleaning and maintenance occupations (5.2%)
Other sales and related occupations, including supervisors (4.7%)
Other production occupations, including supervisors (4.5%)
Laborers and material movers, hand (3.8%)
Electrical equipment mechanics and other installation, maintenance, and repair workers, including supervisors (3.3%)
Secretaries and administrative assistants (8.4%)
Cashiers (7.9%)
Nursing, psychiatric, and home health aides (5.5%)
Other office and administrative support workers, including supervisors (5.2%)
Registered nurses (4.8%)
Other sales and related occupations, including supervisors (3.9%)
Building and grounds cleaning and maintenance occupations (3.6%)
Tornado activity:
Cumberland-area historical tornado activity is below Maryland state average. It is 42% smaller than the overall U.S. average.
On 6/2/1998, a category F4 (max. wind speeds 207-260 mph) tornado 3.8 miles away from the Cumberland city center injured 5 people and caused $6 million in damages.
On 5/31/1998, a category F3 (max. wind speeds 158-206 mph) tornado 12.4 miles away from the city center killed one person and injured 15 people and caused $4 million in damages.
Earthquake activity:
Cumberland-area historical earthquake activity is significantly above Maryland state average. It is 51% smaller than the overall U.S. average. On 8/23/2011 at 17:51:04, a magnitude 5.8 (5.8 MW, Depth: 3.7 mi, Class: Moderate, Intensity: VI - VII) earthquake occurred 128.2 miles away from the city center On 9/25/1998 at 19:52:52, a magnitude 5.2 (4.8 MB, 4.3 MS, 5.2 LG, 4.5 MW, Depth: 3.1 mi) earthquake occurred 153.7 miles away from Cumberland center On 1/31/1986 at 16:46:43, a magnitude 5.0 (5.0 MB) earthquake occurred 184.7 miles away from the city center On 8/25/2011 at 05:07:52, a magnitude 4.5 (4.5 ML, Depth: 4.2 mi, Class: Light, Intensity: IV - V) earthquake occurred 125.2 miles away from Cumberland center On 1/16/1994 at 01:49:16, a magnitude 4.6 (4.6 MB, 4.6 LG, Depth: 3.1 mi) earthquake occurred 152.0 miles away from Cumberland center On 12/9/2003 at 20:59:18, a magnitude 4.5 (4.5 ML, Depth: 6.2 mi) earthquake occurred 134.4 miles away from Cumberland center Magnitude types: regional Lg-wave magnitude (LG), body-wave magnitude (MB), local magnitude (ML), surface-wave magnitude (MS), moment magnitude (MW) Natural disasters: The number of natural disasters in Allegany County (15) is near the US average (15).Major Disasters (Presidential) Declared: 10Emergencies Declared: 5Hurricanes: 6, Snowstorms: 3, Winter Storms: 3, Floods: 2, Blizzard: 1, Snowfall: 1, Storm: 1, Tropical Storm: 1, Other: 1 (Note: some incidents may be assigned to more than one category). Hospitals in Cumberland: HOSPICE MEM HOSP AND MED CNTR CUMBERLAND (900 SETON DRIVE) JOSEPH P BRANDENBURG CENTER (10100 COUNTRY CLUB RD PO BOX 1722) MEMORIAL HOSPITAL AND MEDICAL CENTER OF CUMBERLAND (600 MEMORIAL AVE) THOMAS B FINAN CENTER (COUNTRY CLUB ROAD PO BOX 1722) WESTERN MARYLAND REGIONAL MEDICAL CENTER (Voluntary non-profit - Private, 12500 WILLOWBROOK ROAD) Nursing Homes in Cumberland: ALLEGANY CO INFIRMARY (FURNACE ST PO BOX 599) DEVLIN MANOR NURSING HOME (10301 NORTH EAST CHRISTIE ROAD) GOLDEN LIVINGCENTER-CUMBERLAND (512 WINIFRED ROAD) MID-ATLANTIC OF CUMBERLAND, LLC (730 FURNACE STREET) SACRED HEART HOSPITAL ECU (900 SETON DRIVE) THE LIONS CENTER FOR REHAB AND EXT CARE (901 SETON DRIVE EXTENSION) Dialysis Facilities in Cumberland: IDF - ALLEGANY CENTER (939 FREDRICK ST) WESTERN MARYLAND REGIONAL DIALYSIS CENTER (12502 WILLOWBROOK RD STE 250) Home Health Centers in Cumberland: SACRED HEART HOSPITAL HOME HEALTH (300 OLDTOWN RD) WESTERN MARYLAND HEALTH SYSTEM HOME CARE (1050 INDUSTRIAL BLVD) Amtrak station: CUMBERLAND (E. HARRISON ST. & QUEEN CITY DR.)
.
Services: fully wheelchair accessible, enclosed waiting area, public restrooms, public payphones, free short-term parking, free long-term parking, call for taxi service, intercity bus service.
Operable nuclear power plant near Cumberland:
13 miles: Three Mile Island 1 in Londonderry Twp., PA.
Colleges/Universities in Cumberland: Allegany College of Maryland Full-time enrollment: 2,407; Location: 12401 Willowbrook Rd SE; Public; Website: www.allegany.edu)
International Beauty School Full-time enrollment: 206; Location: 119 North Centere Street; Private, for-profit; Website: www.ibscosmetology.com)
Other colleges/universities with over 2000 students near Cumberland:
Frostburg State University (about 10 miles; Frostburg, MD ; Full-time enrollment: 4,944)
University of Pittsburgh-Johnstown (about 44 miles; Johnstown, PA ; FT enrollment: 2,815)
Shenandoah University (about 47 miles; Winchester, VA ; FT enrollment: 3,010)
Lord Fairfax Community College (about 50 miles; Middletown, VA ; FT enrollment: 4,144)
Shepherd University (about 54 miles; Shepherdstown, WV ; FT enrollment: 3,745)
American Public University System (about 55 miles; Charles Town, WV ; FT enrollment: 43,829)
Hagerstown Community College (about 59 miles; Hagerstown, MD ; FT enrollment: 3,220)
Public high schools in Cumberland:
Private high schools in Cumberland: BISHOP WALSH SCHOOL Students: 419, Location: 700 BISHOP WALSH RD, Grades: PK-12)
LIGHTHOUSE CHRISTIAN ACADEMY Students: 149, Location: 2020 BEDFORD ST, Grades: UG-12)
THE JEFFERSON SCHOOL AT FINAN CENTER Students: 45, Location: 10102 COUNTRY CLUB RD SE COTTAGE A, Grades: UG-12)
Public elementary/middle schools in Cumberland:
See full list of schools located in Cumberland Library in Cumberland: ALLEGANY COUNTY LIBRARY SYSTEM Operating income: $2,210,701; Location: 31 WASHINGTON ST; 216,357 books ; 22 e-books ; 7,180 audio materials ; 5,154 video materials ; 18 state licensed databases ; 20 other licensed databases ; 531 print serial subscriptions )
User-submitted facts and corrections:
Bishop Walsh School now K to 12
Bishop Walsh School now K to 12
Notable locations in Cumberland: (A) , Maryland Forestry Service Cumberland (B) , City of Cumberland South End Fire Station 2 (C) , City of Cumberland East Side Fire Station 3 (D) , City of Cumberland Central Fire Station 1 (E) , West Side Fire Station (F) , East Side Fire Station Number 4 (G) , Cumberland Visitor Center (H) , Allegany County Public Library (I) , South Side Fire Station Number 2 (J) , Cumberland City Hall (K) , Central Fire Station (L) , Allegany County Courthouse (M) . Display/hide their locations on the map
Shopping Centers: (1) , Cumberland Shopping Center (2) , Hills Plaza Shopping Center (3) . Display/hide their locations on the map
Churches in Cumberland include: (A) , Bethel United Methodist Church (B) , Centre Street United Methodist Church (C) , Chapel Hill Temple Church (D) , Church of God (E) , Church of the Nazarene (F) , Emmanuel United Methodist Church (G) , First Assembly of God Church (H) , First Brethren Church (I) . Display/hide their locations on the map
Cemeteries: (1) , Saints Peter and Paul Cemetery (2) , Rose Hill Cemetery (3) . Display/hide their locations on the map
Reservoir: (A) . Display/hide its location on the map
Streams, rivers, and creeks: (A) , Evitts Creek (B) , Dry Run (C) , Willis Creek (D) . Display/hide their locations on the map
Parks in Cumberland include: (1) , South End Playground (2) , Riverside Park (3) , Washington Street Historic District (4) , Downtown Cumberland Historic District (5) . Display/hide their locations on the map
Tourist attractions:
Hotels:
Courts:
Birthplace of: Earle Bruce - Football player and coach, Eddie Deezen - Comedian, Drew Hankinson - Professional wrestler, Aaron Laffey - Baseball player, Kevin Kelly (politician) - Politician, Brent Gallaher - Jazz saxophonist, Bruce Price - Architect, Casper R. Taylor, Jr. - Politician, Kia Corthron - Television writer, Robert B. Lawton - Jesuit.
Allegany County has a predicted average indoor radon screening level between 2 and 4 pCi/L (pico curies per liter) - Moderate Potential Drinking water stations with addresses in Cumberland and their reported violations in the past:
CITY OF CUMBERLAND (Address: 57 NORTH LIBERTY STREET Population served: 23,600, Surface water):
Past monitoring violations:
One routine major monitoring violation
Address: 701 KELLY ROAD, SUITE 300 Population served: 5,425, Purch surface water):
Past monitoring violations:
One routine major monitoring violation
Address: 701 KELLY ROAD, SUITE 300 Population served: 4,955, Purch surface water):
Past monitoring violations:
One minor monitoring violation
Address: 701 KELLY ROAD, SUITE 300 Population served: 865, Purch surface water):
Past monitoring violations:
One minor monitoring violation
Population served: 240, Groundwater under infl of surface water):
Past monitoring violations:
Follow-up Or Routine LCR Tap M/R - In OCT-01-2013, Contaminant: Lead and Copper Rule. Follow-up actions: St Compliance achieved (OCT-31-2013)
One routine major monitoring violation
Address: 15720 BRICE HOLLOW ROAD S.E. Population served: 78, Groundwater):
Past health violations:
MCL, Monthly (TCR) - In OCT-2008, Contaminant: Coliform. Follow-up actions: St Violation/Reminder Notice (OCT-20-2008), St Public Notif requested (NOV-20-2008), St Compliance achieved (FEB-28-2009), St Public Notif received (2 times from JUN-30-2009 to JUN-30-2009)
MCL, Monthly (TCR) - In JUN-2008, Contaminant: Coliform. Follow-up actions: St Violation/Reminder Notice (JUL-01-2008), St Public Notif requested (JUL-02-2008), St Compliance achieved (NOV-13-2008), St Public Notif received (JUN-30-2009)
MCL, Monthly (TCR) - In NOV-2007, Contaminant: Coliform. Follow-up actions: St Violation/Reminder Notice (DEC-10-2007), St Public Notif requested (JAN-11-2008), St Public Notif received (APR-01-2008), St Compliance achieved (MAY-29-2008)
MCL, Monthly (TCR) - In AUG-2007, Contaminant: Coliform. Follow-up actions: St Violation/Reminder Notice (SEP-10-2007), St Compliance achieved (SEP-22-2007), St Public Notif requested (DEC-12-2007)
Past monitoring violations:
Follow-up Or Routine LCR Tap M/R - In OCT-01-2012, Contaminant: Lead and Copper Rule. Follow-up actions: St Violation/Reminder Notice (2 times from JUL-13-2012 to SEP-10-2013)
Monitoring, Source Water (GWR) - In FEB-2010, Contaminant: E. COLI
Monitoring, Repeat Major (TCR) - In JUN-2008, Contaminant: Coliform (TCR). Follow-up actions: St Violation/Reminder Notice (JUL-01-2008), St Public Notif requested (JUL-02-2008), St Compliance achieved (NOV-13-2008), St Public Notif received (JUN-30-2009)
Monitoring, Repeat Major (TCR) - In NOV-2007, Contaminant: Coliform (TCR). Follow-up actions: St Violation/Reminder Notice (DEC-10-2007), St Public Notif requested (JAN-11-2008), St Public Notif received (2 times from APR-01-2008 to APR-01-2008), St Compliance achieved (2 times from MAY-29-2008 to MAY-29-2008)
Follow-up Or Routine LCR Tap M/R - In OCT-01-2007, Contaminant: Lead and Copper Rule. Follow-up actions: St Violation/Reminder Notice (2 times from SEP-11-2008 to SEP-08-2009), St Public Notif requested (OCT-27-2009), St Violation/Reminder Notice (OCT-27-2009), St Compliance achieved (NOV-05-2009)
68 routine major monitoring violations
3 minor monitoring violations
3 regular monitoring violations
Address: 701 KELLY ROAD - SUITE 300 Population served: 47, Purch surface water):
Past monitoring violations:
One minor monitoring violation
Average household size: This city:
2.2 peopleMaryland:
2.6 people
Percentage of family households: This city:
54.0%Whole state:
67.1%
Percentage of households with unmarried partners: This city:
8.2%Whole state:
6.4%
Likely homosexual households (counted as self-reported same-sex unmarried-partner households)
Lesbian couples: 0.3% of all households Gay men: 0.3% of all households
People in group quarters in Cumberland in 2010:
343 people in nursing facilities/skilled-nursing facilities
126 people in college/university student housing
110 people in emergency and transitional shelters (with sleeping facilities) for people experiencing homelessness
28 people in other noninstitutional facilities
12 people in group homes intended for adults
7 people in group homes for juveniles (non-correctional)
People in group quarters in Cumberland in 2000:
229 people in nursing homes
122 people in local jails and other confinement facilities (including police lockups)
89 people in other noninstitutional group quarters
33 people in homes for abused, dependent, and neglected children
33 people in homes for the mentally ill
21 people in homes or halfway houses for drug/alcohol abuse
14 people in religious group quarters
9 people in training schools for juvenile delinquents
Banks with branches in Cumberland (2011 data):
First United Bank & Trust: Bel Air Branch, Center City Branch, White Oaks Branch. Info updated 2010/09/21: Bank assets: $1,383.1 mil, Deposits: $1,034.0 mil, headquarters in Oakland, MD, positive income , Commercial Lending Specialization, 28 total offices , Holding Company: First United Corporation
Manufacturers and Traders Trust Company: Downtown Cumberland Drive-Up, Cumberland Mall Branch, South Cumberland Branch. Info updated 2011/08/08: Bank assets: $76,887.1 mil, Deposits: $60,064.2 mil, headquarters in Buffalo, NY, positive income , Commercial Lending Specialization, 808 total offices , Holding Company: M&T Bank Corporation
Susquehanna Bank: Industrial Boulevard Branch at 600 West Industrial Boulevard, branch established on 1998/01/20; Cumberland Branch at 71 Baltimore Street, branch established on 1811/01/01. Info updated 2012/02/28: Bank assets: $14,849.0 mil, Deposits: $10,294.4 mil, headquarters in Lititz, PA, positive income , Commercial Lending Specialization, 308 total offices , Holding Company: Susquehanna Bancshares, Inc.
Standard Bank, PaSB: Cumberland Branch at 200 North Mechanic Street, branch established on 2003/01/02. Info updated 2006/11/03: Bank assets: $436.8 mil, Deposits: $325.5 mil, headquarters in Murrysville, PA, positive income , Mortgage Lending Specialization, 12 total offices , Holding Company: Standard Financial Corporation
PNC Bank, National Association: N. Mechanic Street Branch at 100 North Mechanic Street, branch established on 2003/05/05. Info updated 2012/03/20: Bank assets: $263,309.6 mil, Deposits: $197,343.0 mil, headquarters in Wilmington, DE, positive income , Commercial Lending Specialization, 3085 total offices , Holding Company: Pnc Financial Services Group, Inc., The
For population 15 years and over in Cumberland:
Never married: 31.0%Now married: 36.2%Separated: 1.9%Widowed: 10.4%Divorced: 20.4% For population 25 years and over in Cumberland:
High school or higher: 90.3%Bachelor's degree or higher: 22.3%Graduate or professional degree: 10.0%Unemployed: 7.3%Mean travel time to work (commute): 14.3 minutes
Education Gini index (Inequality in education) Here:
11.1Maryland average:
12.7
Religion statistics for Cumberland, MD (based on Allegany County data)
Religion Adherents Congregations Mainline Protestant 13,964 66 Evangelical Protestant 11,015 74 Catholic 8,838 10 Other 1,200 7 Black Protestant 289 2 None 39,781 -
Source: Clifford Grammich, Kirk Hadaway, Richard Houseal, Dale E.Jones, Alexei Krindatch, Richie Stanley and Richard H.Taylor. 2012. 2010 U.S.Religion Census: Religious Congregations & Membership Study. Association of Statisticians of American Religious Bodies. Jones, Dale E., et al. 2002. Congregations and Membership in the United States 2000. Nashville, TN: Glenmary Research Center. Graphs represent county-level data
Food Environment Statistics: Number of grocery stores : 19Here :
2.62 / 10,000 pop.State :
1.96 / 10,000 pop.
Number of convenience stores (no gas) : 5This county :
0.69 / 10,000 pop.Maryland :
1.22 / 10,000 pop.
Number of convenience stores (with gas) : 17This county :
2.34 / 10,000 pop.State :
2.05 / 10,000 pop.
Number of full-service restaurants : 52Allegany County :
7.16 / 10,000 pop.Maryland :
5.40 / 10,000 pop.
Adult diabetes rate : Allegany County :
12.5%State :
9.1%
Adult obesity rate : Allegany County :
28.9%Maryland :
26.7%
Low-income preschool obesity rate : Allegany County :
13.0%Maryland :
15.5%
Health and Nutrition: Healthy diet rate : Cumberland:
53.0%Maryland:
50.1%
Average overall health of teeth and gums : Cumberland:
50.9%Maryland:
47.6%
People feeling badly about themselves : Cumberland:
18.9%Maryland:
20.0%
People not drinking alcohol at all : Cumberland:
10.5%Maryland:
11.3%
Average hours sleeping at night : Cumberland:
6.9Maryland:
6.8
Overweight people : This city:
35.6%Maryland:
34.1%
General health condition : Cumberland:
58.9%State:
56.5%
Average condition of hearing : More about Health and Nutrition of Cumberland, MD Residents
Local government employment and payroll (March 2022)
Function
Full-time employees
Monthly full-time payroll
Average yearly full-time wage
Part-time employees
Monthly part-time payroll
Firefighters
47 $218,603 $55,814 0 $0 Police Protection - Officers
40 $221,229 $66,369 0 $0 Water Supply
32 $136,424 $51,159 0 $0 Sewerage
26 $110,043 $50,789 0 $0 Streets and Highways
22 $95,002 $51,819 0 $0 Financial Administration
16 $76,258 $57,194 0 $0 Housing and Community Development (Local)
11 $48,298 $52,689 5 $272 Other and Unallocable
9 $39,018 $52,024 0 $0 Police - Other
9 $48,185 $64,247 12 $26,543 Other Government Administration
6 $38,022 $76,044 7 $4,721 Parks and Recreation
4 $10,663 $31,989 2 $2,462 Fire - Other
3 $17,424 $69,696 0 $0 Natural Resources
3 $11,654 $46,616 0 $0 Solid Waste Management
1 $4,263 $51,156 0 $0
Totals for Government
229 $1,075,086 $56,336 26 $33,998
Cumberland government finances - Expenditure in 2021 (per resident):
Current Operations - Sewerage: $8,768,000 ($467.15)
Water Utilities: $6,420,000 ($342.05)Police Protection: $6,189,000 ($329.75)Local Fire Protection: $5,564,000 ($296.45)Housing and Community Development: $4,297,000 ($228.94)Regular Highways: $2,235,000 ($119.08)Solid Waste Management: $1,802,000 ($96.01)General - Other: $1,762,000 ($93.88)Parks and Recreation: $821,000 ($43.74)Financial Administration: $706,000 ($37.62)Parking Facilities: $447,000 ($23.82)Central Staff Services: $375,000 ($19.98)General Public Buildings: $147,000 ($7.83)Protective Inspection and Regulation - Other: $145,000 ($7.73)Judicial and Legal Services: $111,000 ($5.91)General - Interest on Debt: $2,503,000 ($133.36)
Other Capital Outlay - Police Protection: $409,000 ($21.79)
Regular Highways: $258,000 ($13.75)Local Fire Protection: $237,000 ($12.63)Parks and Recreation: $81,000 ($4.32)General Public Building: $24,000 ($1.28)General - Other: $20,000 ($1.07)Financial Administration: $3,000 ($0.16)Total Salaries and Wages: $20,907,000 ($1113.91)
Cumberland government finances - Revenue in 2021 (per resident):
Charges - Sewerage: $9,027,000 ($480.95)
Solid Waste Management: $1,733,000 ($92.33)Other: $1,597,000 ($85.09)Parking Facilities: $319,000 ($17.00)Regular Highways: $73,000 ($3.89)Parks and Recreation: $71,000 ($3.78)Federal Intergovernmental - Housing and Community Development: $2,878,000 ($153.34)
Other: $2,143,000 ($114.18)Highways: $20,000 ($1.07)Local Intergovernmental - Other: $316,000 ($16.84)
Miscellaneous - General Revenue - Other: $1,545,000 ($82.32)
Rents: $291,000 ($15.50)Sale of Property: $146,000 ($7.78)Interest Earnings: $71,000 ($3.78)Donations From Private Sources: $35,000 ($1.86)Fines and Forfeits: $5,000 ($0.27)Revenue - Water Utilities: $6,967,000 ($371.20)
State Intergovernmental - Sewerage: $1,564,000 ($83.33)
Highways: $1,145,000 ($61.00)Other: $1,095,000 ($58.34)Housing and Community Development: $292,000 ($15.56)Tax - Property: $13,353,000 ($711.44)
Individual Income: $1,421,000 ($75.71)Other Selective Sales: $344,000 ($18.33)Public Utility License: $269,000 ($14.33)Other License: $134,000 ($7.14)Occupation and Business License - Other: $48,000 ($2.56)Motor Vehicle License: $25,000 ($1.33)Alcoholic Beverage License: $15,000 ($0.80)Amusements Sales: $4,000 ($0.21)
Cumberland government finances - Debt in 2021 (per resident):
Long Term Debt - Beginning Outstanding - Unspecified Public Purpose: $62,575,000 ($3333.95)
Outstanding Unspecified Public Purpose: $61,282,000 ($3265.06)Retired Unspecified Public Purpose: $21,582,000 ($1149.87)Issue, Unspecified Public Purpose: $20,289,000 ($1080.98)
Cumberland government finances - Cash and Securities in 2021 (per resident):
Bond Funds - Cash and Securities: $150,000 ($7.99)
Other Funds - Cash and Securities: $32,877,000 ($1751.66)
Businesses in Cumberland, MD
Name Count Name Count
AT&T 3 Little Caesars Pizza 1 Ace Hardware 1 Long John Silver's 1 Advance Auto Parts 2 Marriott 1 American Eagle Outfitters 1 MasterBrand Cabinets 2 Applebee's 1 McDonald's 2 AutoZone 1 Nike 1 Bath & Body Works 1 Nissan 1 Blockbuster 1 Papa John's Pizza 1 Burger King 1 Payless 1 CVS 1 Penske 1 Chevrolet 1 Pizza Hut 2 Chick-Fil-A 2 Quiznos 1 Circle K 2 Rite Aid 1 Curves 1 Sears 2 Dairy Queen 1 Sprint Nextel 1 FedEx 6 Subaru 1 Finish Line 1 Subway 2 Ford 1 Taco Bell 1 GNC 1 True Value 1 GameStop 1 U-Haul 6 H&R Block 1 U.S. Cellular 1 Holiday Inn 1 UPS 8 Hyundai 1 Wendy's 1 KFC 2 YMCA 3 Lane Furniture 1
Strongest AM radio stations in Cumberland:
WTBO (1450 AM; 1 kW; CUMBERLAND, MD; Owner: WTBO-WKGO CORPORATION, L.L.C.)
WCBC (1270 AM; 5 kW; CUMBERLAND, MD; Owner: CUMBERLAND BROADCASTING COMPANY)
WNTR (1230 AM; 1 kW; CUMBERLAND, MD; Owner: TSCHUDY RADIO, INC)
WFRB (560 AM; 5 kW; FROSTBURG, MD; Owner: WTBO-WKGO CORPORATION, L.L.C.)
WVSC (990 AM; 10 kW; SOMERSET, PA; Owner: FOREVER OF JOHNSTOWN, INC.)
WZSK (1040 AM; daytime; 10 kW; EVERETT, PA; Owner: NEW MILLENNIUM COMMUNICATIONS GROUP, INC.)
WLYE (850 AM; 10 kW; JOHNSTOWN, PA; Owner: FOREVER OF JOHNSTOWN, INC.)
WCBM (680 AM; 50 kW; BALTIMORE, MD; Owner: WCBM MARYLAND, INC.)
KDKA (1020 AM; 50 kW; PITTSBURGH, PA; Owner: INFINITY BROADCASTING OPERATIONS, INC.)
WMET (1150 AM; 50 kW; GAITHERSBURG, MD; Owner: BELTWAY ACQUISITION CORPORATION)
WKCW (1420 AM; 50 kW; WARRENTON, VA; Owner: WAY BROADCASTING, INC.)
WTEM (980 AM; 50 kW; WASHINGTON, DC; Owner: AMFM RADIO LICENSES, L.L.C.)
WYSN (1330 AM; 5 kW; SOMERSET, PA; Owner: DAME BROADCASTING, LLC)
Strongest FM radio stations in Cumberland:
WROG (102.9 FM; CUMBERLAND, MD; Owner: TSCHUDY RADIO, INC)
WKGO (106.1 FM; CUMBERLAND, MD; Owner: WTBO-WKGO CORPORATION, L.L.C.)
WLIC (97.1 FM; FROSTBURG, MD; Owner: HE'S ALIVE, INC.)
WFWM (91.9 FM; FROSTBURG, MD; Owner: FROSTBURG STATE UNIVERSITY)
WFRB-FM (105.3 FM; FROSTBURG, MD; Owner: WTBO-WKGO CORPORATION, L.L.C.)
WCBC-FM (107.1 FM; KEYSER, WV; Owner: PROSPERITAS BROADCASTING SYSTEM, L P)
WDZN (100.1 FM; ROMNEY, WV; Owner: CHARTER EQUITIES, INC.)
WWPN (101.1 FM; WESTERNPORT, MD; Owner: ERNEST F. SANTMYIRE)
W263AJ (100.5 FM; CUMBERLAND, MD; Owner: CHARTER EQUITIES, INC.)
W280CF (103.9 FM; CUMBERLAND, ETC., MD; Owner: CEDAR RIDGE CHILDREN'S HOME & SCHOOL, INC)
WQZK-FM (94.1 FM; KEYSER, WV; Owner: STARCAST SYSTEMS, INC.)
WBVE (107.5 FM; BEDFORD, PA; Owner: CESSNA COMMUNICATIONS, INC.)
W253AB (98.5 FM; CUMBERLAND, MD; Owner: WTBO-WKGO CORPORATION, L.L.C.)
WQZS (93.3 FM; MEYERSDALE, PA; Owner: ROGER WAHL)
WAYC (100.9 FM; BEDFORD, PA; Owner: CESSNA COMMUNICATIONS, INC.)
WAIJ (90.3 FM; GRANTSVILLE, MD; Owner: HE'S ALIVE, INC.)
WVSB (104.1 FM; ROMNEY, WV; Owner: WEST VA. SCHS. FOR DEAF AND BLIND)
WTRM (91.3 FM; WINCHESTER, VA; Owner: TIMBER RIDGE MINISTRIES, INC.)
WSKE (104.3 FM; EVERETT, PA; Owner: NEW MILLENNIUM COMMUNICATIONS GROUP, INC.)
WEEO-FM (103.7 FM; MCCONNELLSBURG, PA; Owner: ALLEGHENY MOUNTAIN NETWORK)
TV broadcast stations around Cumberland:
W43BP (Channel 43; CRESAPTOWN, MD; Owner: TRINITY BROADCASTING NETWORK)
Medal of Honor Recipients
Medal of Honor Recipients born in Cumberland: Robert W. Hartsock, William E., Jr. Shuck.
National Bridge Inventory (NBI) Statistics 48 Number of bridges1,135ft / 346m Total length $88,862,000 Total costs682,277 Total average daily traffic59,935 Total average daily truck traffic
New bridges - historical statistics
1 Before 1900 1 1910-1919 2 1920-1929 5 1930-1939 4 1950-1959 22 1960-1969 3 1970-1979 9 1990-1999 1 2010-2019
See full National Bridge Inventory statistics for Cumberland, MD
Home Mortgage Disclosure Act Aggregated Statistics For Year 2009(Based on 4 full and 5 partial tracts) A) FHA, FSA/RHS & VA B) Conventional C) Refinancings D) Home Improvement Loans E) Loans on Dwellings For 5+ Families F) Non-occupant Loans on G) Loans On Manufactured Number Average Value Number Average Value Number Average Value Number Average Value Number Average Value Number Average Value Number Average Value
LOANS ORIGINATED 38 $100,748 56 $88,117 215 $109,251 38 $28,342 5 $188,688 24 $111,807 1 $93,920 APPLICATIONS APPROVED, NOT ACCEPTED 1 $45,020 3 $52,870 11 $146,048 1 $22,760 0 $0 4 $78,470 1 $18,420 APPLICATIONS DENIED 6 $146,673 9 $61,143 73 $116,347 8 $36,712 1 $779,040 6 $47,558 0 $0 APPLICATIONS WITHDRAWN 6 $110,048 7 $125,216 50 $118,246 2 $80,015 0 $0 3 $68,900 0 $0 FILES CLOSED FOR INCOMPLETENESS 0 $0 1 $268,700 11 $114,948 0 $0 0 $0 0 $0 0 $0
Aggregated Statistics For Year 2008(Based on 4 full and 5 partial tracts) A) FHA, FSA/RHS & VA B) Conventional C) Refinancings D) Home Improvement Loans E) Loans on Dwellings For 5+ Families F) Non-occupant Loans on Number Average Value Number Average Value Number Average Value Number Average Value Number Average Value Number Average Value
LOANS ORIGINATED 34 $83,205 77 $83,933 170 $94,921 51 $35,067 5 $173,734 29 $64,732 APPLICATIONS APPROVED, NOT ACCEPTED 1 $119,220 7 $51,074 11 $89,677 4 $35,708 0 $0 3 $56,450 APPLICATIONS DENIED 4 $90,730 13 $69,905 131 $100,725 30 $48,997 0 $0 22 $70,912 APPLICATIONS WITHDRAWN 7 $108,231 11 $124,505 67 $99,155 8 $50,901 1 $400,000 8 $93,626 FILES CLOSED FOR INCOMPLETENESS 1 $303,180 2 $77,745 10 $128,543 2 $62,370 0 $0 3 $61,567
Aggregated Statistics For Year 2007(Based on 4 full and 5 partial tracts) A) FHA, FSA/RHS & VA B) Conventional C) Refinancings D) Home Improvement Loans E) Loans on Dwellings For 5+ Families F) Non-occupant Loans on G) Loans On Manufactured Number Average Value Number Average Value Number Average Value Number Average Value Number Average Value Number Average Value Number Average Value
LOANS ORIGINATED 14 $102,340 160 $96,331 232 $90,235 78 $38,867 2 $138,350 92 $87,836 1 $27,720 APPLICATIONS APPROVED, NOT ACCEPTED 0 $0 17 $78,686 29 $102,172 5 $27,850 0 $0 10 $68,290 0 $0 APPLICATIONS DENIED 1 $70,570 38 $103,201 232 $91,073 62 $51,147 0 $0 36 $96,844 0 $0 APPLICATIONS WITHDRAWN 0 $0 19 $99,563 119 $95,669 11 $47,750 0 $0 13 $56,421 0 $0 FILES CLOSED FOR INCOMPLETENESS 0 $0 5 $80,102 15 $96,989 1 $36,040 0 $0 3 $72,720 0 $0
Aggregated Statistics For Year 2006(Based on 4 full and 5 partial tracts) A) FHA, FSA/RHS & VA B) Conventional C) Refinancings D) Home Improvement Loans E) Loans on Dwellings For 5+ Families F) Non-occupant Loans on G) Loans On Manufactured Number Average Value Number Average Value Number Average Value Number Average Value Number Average Value Number Average Value Number Average Value
LOANS ORIGINATED 19 $95,933 224 $75,260 234 $83,782 73 $35,720 3 $279,090 120 $58,508 1 $57,960 APPLICATIONS APPROVED, NOT ACCEPTED 2 $71,990 31 $72,865 34 $70,031 7 $35,120 0 $0 21 $68,472 0 $0 APPLICATIONS DENIED 3 $156,043 61 $77,489 256 $84,135 56 $35,526 0 $0 27 $58,221 1 $65,370 APPLICATIONS WITHDRAWN 3 $77,330 27 $66,009 137 $89,989 10 $36,084 0 $0 12 $56,571 2 $49,120 FILES CLOSED FOR INCOMPLETENESS 1 $68,280 6 $113,728 39 $100,905 0 $0 0 $0 5 $80,140 0 $0
Aggregated Statistics For Year 2005(Based on 4 full and 5 partial tracts) A) FHA, FSA/RHS & VA B) Conventional C) Refinancings D) Home Improvement Loans F) Non-occupant Loans on G) Loans On Manufactured Number Average Value Number Average Value Number Average Value Number Average Value Number Average Value Number Average Value
LOANS ORIGINATED 20 $83,039 241 $71,504 216 $85,463 68 $43,830 112 $60,953 0 $0 APPLICATIONS APPROVED, NOT ACCEPTED 0 $0 14 $69,737 61 $64,840 6 $38,045 9 $68,526 0 $0 APPLICATIONS DENIED 2 $74,275 45 $76,421 257 $76,107 59 $36,869 40 $53,988 1 $51,590 APPLICATIONS WITHDRAWN 1 $141,900 31 $92,556 192 $88,254 17 $89,333 9 $46,433 2 $94,665 FILES CLOSED FOR INCOMPLETENESS 0 $0 7 $87,126 58 $88,301 3 $68,893 2 $47,995 0 $0
Aggregated Statistics For Year 2004(Based on 4 full and 5 partial tracts) A) FHA, FSA/RHS & VA B) Conventional C) Refinancings D) Home Improvement Loans E) Loans on Dwellings For 5+ Families F) Non-occupant Loans on G) Loans On Manufactured Number Average Value Number Average Value Number Average Value Number Average Value Number Average Value Number Average Value Number Average Value
LOANS ORIGINATED 21 $72,009 173 $71,435 254 $72,586 54 $32,501 6 $73,300 64 $62,568 2 $40,095 APPLICATIONS APPROVED, NOT ACCEPTED 2 $38,080 13 $94,457 46 $71,318 2 $26,485 0 $0 4 $43,375 1 $19,380 APPLICATIONS DENIED 5 $74,432 41 $74,128 246 $69,790 46 $20,996 0 $0 32 $57,318 5 $25,934 APPLICATIONS WITHDRAWN 2 $87,110 18 $65,778 155 $83,985 14 $53,726 0 $0 11 $49,859 0 $0 FILES CLOSED FOR INCOMPLETENESS 0 $0 8 $94,865 15 $107,525 1 $11,350 0 $0 2 $48,655 0 $0
Aggregated Statistics For Year 2003(Based on 4 full and 5 partial tracts) A) FHA, FSA/RHS & VA B) Conventional C) Refinancings D) Home Improvement Loans E) Loans on Dwellings For 5+ Families F) Non-occupant Loans on Number Average Value Number Average Value Number Average Value Number Average Value Number Average Value Number Average Value
LOANS ORIGINATED 30 $64,605 160 $72,408 375 $77,516 32 $13,050 7 $69,717 45 $58,173 APPLICATIONS APPROVED, NOT ACCEPTED 3 $66,057 11 $73,782 69 $79,562 3 $12,283 1 $148,580 5 $119,594 APPLICATIONS DENIED 2 $40,240 32 $56,908 218 $74,463 35 $10,968 0 $0 17 $41,516 APPLICATIONS WITHDRAWN 1 $59,470 18 $69,306 117 $77,153 4 $12,270 0 $0 9 $57,821 FILES CLOSED FOR INCOMPLETENESS 0 $0 2 $99,680 17 $84,858 3 $29,170 0 $0 3 $47,877
Aggregated Statistics For Year 2002(Based on 4 full and 4 partial tracts) A) FHA, FSA/RHS & VA B) Conventional C) Refinancings D) Home Improvement Loans E) Loans on Dwellings For 5+ Families F) Non-occupant Loans on Number Average Value Number Average Value Number Average Value Number Average Value Number Average Value Number Average Value
LOANS ORIGINATED 32 $67,779 110 $67,716 259 $73,859 51 $17,685 6 $56,058 39 $46,620 APPLICATIONS APPROVED, NOT ACCEPTED 0 $0 9 $64,472 40 $67,733 3 $27,280 0 $0 0 $0 APPLICATIONS DENIED 3 $42,737 24 $38,807 146 $62,868 20 $14,639 0 $0 12 $41,338 APPLICATIONS WITHDRAWN 2 $57,085 6 $65,170 96 $68,715 5 $20,404 0 $0 1 $39,370 FILES CLOSED FOR INCOMPLETENESS 0 $0 5 $91,310 13 $78,519 0 $0 0 $0 1 $38,730
Aggregated Statistics For Year 2001(Based on 4 full and 4 partial tracts) A) FHA, FSA/RHS & VA B) Conventional C) Refinancings D) Home Improvement Loans F) Non-occupant Loans on Number Average Value Number Average Value Number Average Value Number Average Value Number Average Value
LOANS ORIGINATED 18 $62,352 113 $73,931 179 $66,860 43 $15,847 31 $52,327 APPLICATIONS APPROVED, NOT ACCEPTED 0 $0 6 $47,195 33 $63,528 4 $14,895 3 $43,543 APPLICATIONS DENIED 3 $59,693 34 $52,436 146 $57,347 24 $12,582 7 $47,553 APPLICATIONS WITHDRAWN 4 $55,960 12 $64,091 103 $63,425 9 $16,099 2 $65,905 FILES CLOSED FOR INCOMPLETENESS 1 $71,830 4 $65,985 25 $61,697 0 $0 2 $25,750
Aggregated Statistics For Year 2000(Based on 4 full and 4 partial tracts) A) FHA, FSA/RHS & VA B) Conventional C) Refinancings D) Home Improvement Loans E) Loans on Dwellings For 5+ Families F) Non-occupant Loans on Number Average Value Number Average Value Number Average Value Number Average Value Number Average Value Number Average Value
LOANS ORIGINATED 22 $63,536 112 $53,082 194 $52,628 80 $14,262 1 $34,900 40 $37,179 APPLICATIONS APPROVED, NOT ACCEPTED 1 $90,640 9 $86,347 18 $48,310 6 $21,473 0 $0 1 $32,910 APPLICATIONS DENIED 1 $39,820 31 $42,864 108 $48,582 38 $13,963 0 $0 12 $53,209 APPLICATIONS WITHDRAWN 4 $39,335 10 $43,487 55 $46,077 4 $28,800 0 $0 2 $34,840 FILES CLOSED FOR INCOMPLETENESS 3 $39,987 3 $38,377 10 $48,248 2 $44,795 0 $0 1 $20,450
Aggregated Statistics For Year 1999(Based on 5 full and 5 partial tracts) A) FHA, FSA/RHS & VA B) Conventional C) Refinancings D) Home Improvement Loans E) Loans on Dwellings For 5+ Families F) Non-occupant Loans on Number Average Value Number Average Value Number Average Value Number Average Value Number Average Value Number Average Value
LOANS ORIGINATED 39 $50,458 120 $69,175 224 $53,517 80 $18,047 2 $80,000 38 $44,159 APPLICATIONS APPROVED, NOT ACCEPTED 1 $41,300 12 $58,318 33 $44,158 10 $15,056 0 $0 3 $32,777 APPLICATIONS DENIED 6 $58,275 37 $46,439 102 $51,354 27 $22,841 0 $0 11 $38,646 APPLICATIONS WITHDRAWN 5 $52,494 14 $41,698 82 $46,931 11 $38,824 2 $5,075,500 8 $43,386 FILES CLOSED FOR INCOMPLETENESS 0 $0 2 $57,320 9 $53,249 0 $0 0 $0 0 $0
Detailed mortgage data for all 9 tracts in Cumberland, MD
Private Mortgage Insurance Companies Aggregated Statistics For Year 2009(Based on 4 full and 5 partial tracts) A) Conventional B) Refinancings Number Average Value Number Average Value
LOANS ORIGINATED 11 $102,745 5 $97,046 APPLICATIONS APPROVED, NOT ACCEPTED 2 $111,270 2 $156,385 APPLICATIONS DENIED 1 $180,930 1 $238,850 APPLICATIONS WITHDRAWN 0 $0 0 $0 FILES CLOSED FOR INCOMPLETENESS 0 $0 0 $0
Aggregated Statistics For Year 2008(Based on 4 full and 5 partial tracts) A) Conventional B) Refinancings C) Non-occupant Loans on Number Average Value Number Average Value Number Average Value
LOANS ORIGINATED 26 $87,242 11 $110,935 6 $57,157 APPLICATIONS APPROVED, NOT ACCEPTED 6 $89,420 4 $92,578 3 $53,380 APPLICATIONS DENIED 2 $129,020 0 $0 0 $0 APPLICATIONS WITHDRAWN 2 $33,860 0 $0 0 $0 FILES CLOSED FOR INCOMPLETENESS 0 $0 0 $0 0 $0
Aggregated Statistics For Year 2007(Based on 4 full and 5 partial tracts) A) Conventional B) Refinancings C) Non-occupant Loans on Number Average Value Number Average Value Number Average Value
LOANS ORIGINATED 53 $85,232 18 $113,271 11 $52,484 APPLICATIONS APPROVED, NOT ACCEPTED 9 $90,691 1 $81,850 1 $108,190 APPLICATIONS DENIED 8 $72,869 0 $0 0 $0 APPLICATIONS WITHDRAWN 2 $67,695 2 $175,040 1 $83,500 FILES CLOSED FOR INCOMPLETENESS 0 $0 0 $0 0 $0
Aggregated Statistics For Year 2006(Based on 4 full and 5 partial tracts) A) Conventional B) Refinancings C) Non-occupant Loans on Number Average Value Number Average Value Number Average Value
LOANS ORIGINATED 63 $75,230 12 $91,137 16 $67,266 APPLICATIONS APPROVED, NOT ACCEPTED 3 $107,243 8 $65,936 0 $0 APPLICATIONS DENIED 1 $36,470 0 $0 1 $36,470 APPLICATIONS WITHDRAWN 1 $44,910 1 $74,980 0 $0 FILES CLOSED FOR INCOMPLETENESS 0 $0 0 $0 0 $0
Aggregated Statistics For Year 2005(Based on 4 full and 5 partial tracts) A) Conventional B) Refinancings C) Non-occupant Loans on Number Average Value Number Average Value Number Average Value
LOANS ORIGINATED 70 $66,631 15 $118,271 18 $74,176 APPLICATIONS APPROVED, NOT ACCEPTED 3 $137,303 4 $90,652 0 $0 APPLICATIONS DENIED 2 $53,315 0 $0 1 $32,910 APPLICATIONS WITHDRAWN 0 $0 3 $92,020 0 $0 FILES CLOSED FOR INCOMPLETENESS 0 $0 0 $0 0 $0
Aggregated Statistics For Year 2004(Based on 4 full and 5 partial tracts) A) Conventional B) Refinancings C) Non-occupant Loans on Number Average Value Number Average Value Number Average Value
LOANS ORIGINATED 66 $69,188 22 $93,759 11 $53,261 APPLICATIONS APPROVED, NOT ACCEPTED 7 $53,573 3 $118,477 1 $40,900 APPLICATIONS DENIED 4 $52,720 0 $0 2 $57,275 APPLICATIONS WITHDRAWN 8 $92,016 0 $0 3 $81,540 FILES CLOSED FOR INCOMPLETENESS 0 $0 0 $0 0 $0
Aggregated Statistics For Year 2003(Based on 4 full and 5 partial tracts) A) Conventional B) Refinancings C) Non-occupant Loans on Number Average Value Number Average Value Number Average Value
LOANS ORIGINATED 47 $69,831 34 $90,453 7 $62,456 APPLICATIONS APPROVED, NOT ACCEPTED 2 $74,555 7 $84,327 1 $61,350 APPLICATIONS DENIED 1 $45,790 4 $200,162 0 $0 APPLICATIONS WITHDRAWN 2 $53,800 4 $112,750 1 $51,130 FILES CLOSED FOR INCOMPLETENESS 0 $0 0 $0 0 $0
Aggregated Statistics For Year 2002(Based on 4 full and 4 partial tracts) A) Conventional B) Refinancings C) Non-occupant Loans on Number Average Value Number Average Value Number Average Value
LOANS ORIGINATED 42 $64,183 25 $74,384 6 $55,147 APPLICATIONS APPROVED, NOT ACCEPTED 3 $81,977 11 $86,713 0 $0 APPLICATIONS DENIED 3 $145,787 0 $0 0 $0 APPLICATIONS WITHDRAWN 1 $108,960 2 $124,255 0 $0 FILES CLOSED FOR INCOMPLETENESS 0 $0 0 $0 0 $0
Aggregated Statistics For Year 2001(Based on 4 full and 4 partial tracts) A) Conventional B) Refinancings C) Non-occupant Loans on Number Average Value Number Average Value Number Average Value
LOANS ORIGINATED 38 $74,907 20 $81,088 5 $42,174 APPLICATIONS APPROVED, NOT ACCEPTED 5 $98,586 4 $79,095 1 $70,000 APPLICATIONS DENIED 5 $58,624 3 $65,527 0 $0 APPLICATIONS WITHDRAWN 0 $0 0 $0 0 $0 FILES CLOSED FOR INCOMPLETENESS 0 $0 2 $69,305 0 $0
Aggregated Statistics For Year 2000(Based on 4 full and 4 partial tracts) A) Conventional B) Refinancings C) Non-occupant Loans on Number Average Value Number Average Value Number Average Value
LOANS ORIGINATED 28 $63,625 8 $67,340 5 $40,322 APPLICATIONS APPROVED, NOT ACCEPTED 4 $38,952 3 $73,220 1 $53,560 APPLICATIONS DENIED 0 $0 2 $58,250 0 $0 APPLICATIONS WITHDRAWN 0 $0 0 $0 0 $0 FILES CLOSED FOR INCOMPLETENESS 1 $62,320 0 $0 0 $0
Aggregated Statistics For Year 1999(Based on 3 full and 5 partial tracts) A) Conventional B) Refinancings C) Non-occupant Loans on Number Average Value Number Average Value Number Average Value
LOANS ORIGINATED 15 $82,029 9 $61,302 2 $42,395 APPLICATIONS APPROVED, NOT ACCEPTED 2 $39,015 4 $53,698 0 $0 APPLICATIONS DENIED 3 $40,970 1 $124,490 1 $56,000 APPLICATIONS WITHDRAWN 0 $0 0 $0 0 $0 FILES CLOSED FOR INCOMPLETENESS 0 $0 0 $0 0 $0
Fire-safe hotels and motels in Cumberland, Maryland:
Ramada Inn Cumberland, 100 S George St, Cumberland, Maryland 21502 Phone: (301) 724-8800, Fax: (301) 724-4001
Fairfield Inn & Suites, 21 N Wineow St, Cumberland, Maryland 21502 Phone: (301) 722-0340, Fax: (301) 722-0341
Holiday Inn Express & Suites, 1076 National Hwy, Cumberland, Maryland 21502 Phone: (301) 729-4800, Fax: (301) 729-4801
Sleep Inn & Suites Cumberland, MD, 13320 Ali Gan Rd NE, Cumberland, Maryland 21502 Phone: (301) 759-0270, Fax: (301) 759-0271
Hampton Inn Cumberland, 109 Welton Dr, Cumberland, Maryland 21502 Phone: (301) 729-4028, Fax: (301) 759-0245
All 5 fire-safe hotels and motels in Cumberland, Maryland
Most common first names in Cumberland, MD among deceased individuals Name Count Lived (average)
Mary 734 79.2 years John 594 74.2 years William 580 73.8 years James 451 72.3 years Charles 428 73.7 years Robert 375 70.7 years George 317 75.4 years Margaret 309 79.8 years Joseph 227 74.6 years Anna 207 82.1 years
Most common last names in Cumberland, MD among deceased individuals Last name Count Lived (average)
Smith 283 75.6 years Miller 186 77.4 years Twigg 143 76.6 years Wilson 142 79.0 years Davis 115 74.4 years Johnson 86 73.6 years Brown 82 73.7 years Martin 78 77.7 years Rice 76 76.7 years Mckenzie 74 76.1 years
Cumberland compared to Maryland state average:
Median household income significantly below state average. Median house value significantly below state average. Unemployed percentage below state average. Black race population percentage significantly below state average. Hispanic race population percentage significantly below state average. Median age above state average. Foreign-born population percentage significantly below state average. Length of stay since moving in above state average. House age significantly above state average.
Top Patent Applicants
Matthew J. Allaway (4)
Charles Russell King (3)
Scott V. Watkins (3)
Sharath Bellary (3)
Sean Christopher Lockard (2)
Andrew D. Lowery (2)
Talbot P. Thrasher (2)
Charles King (2)
Alan Z. Glasser (2)
Prabhakar Pandey (1)
Total of 32 patent applications in 2008-2024.


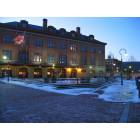
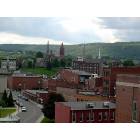
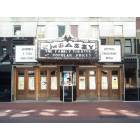
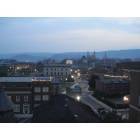

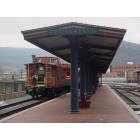
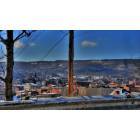
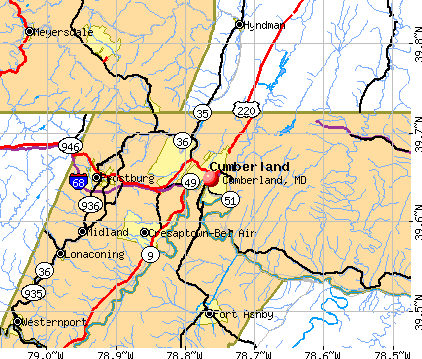


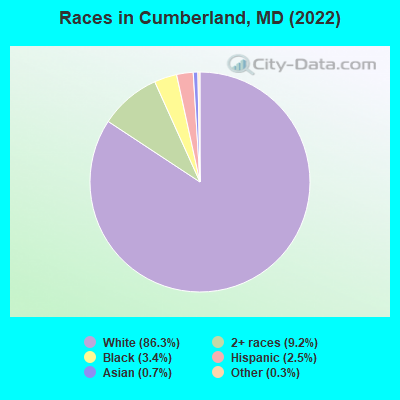
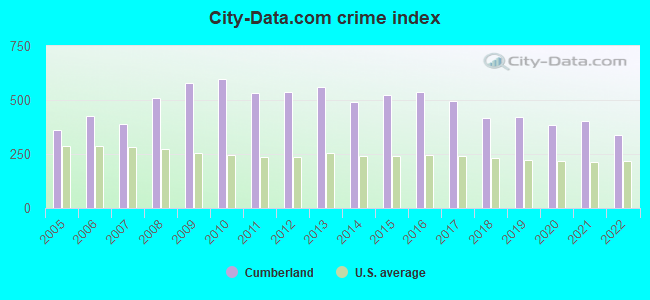
 Recent articles from our blog. Our writers, many of them Ph.D. graduates or candidates, create easy-to-read articles on a wide variety of topics.

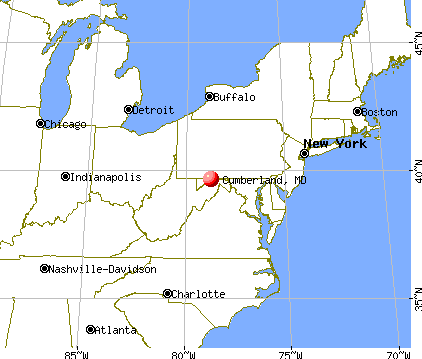
 (73.2 miles
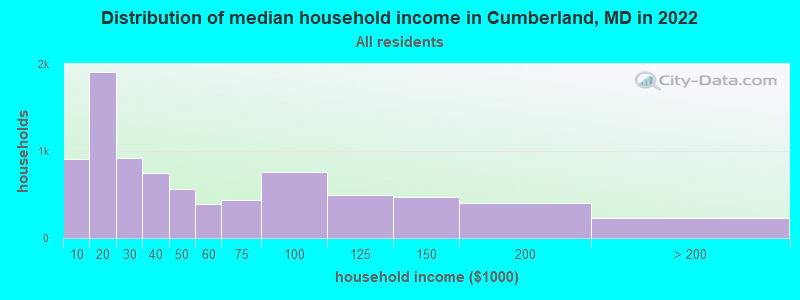
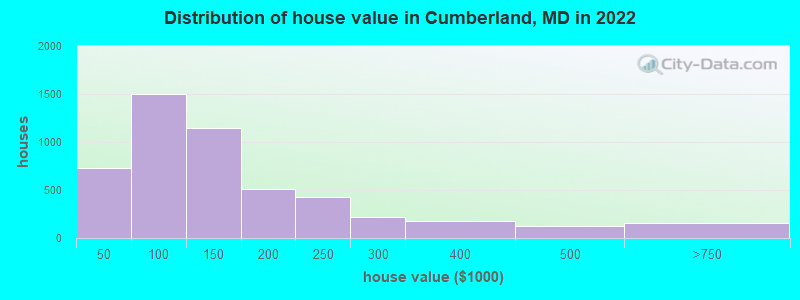
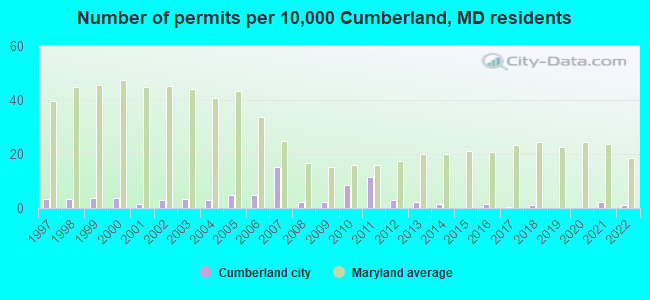
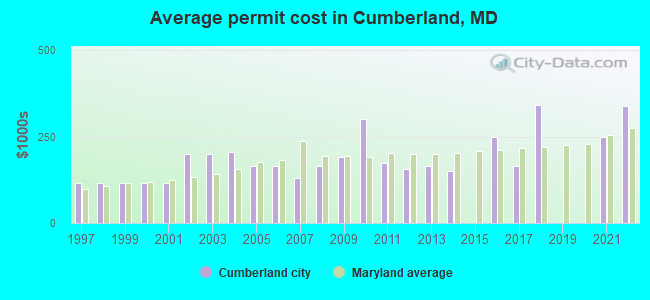
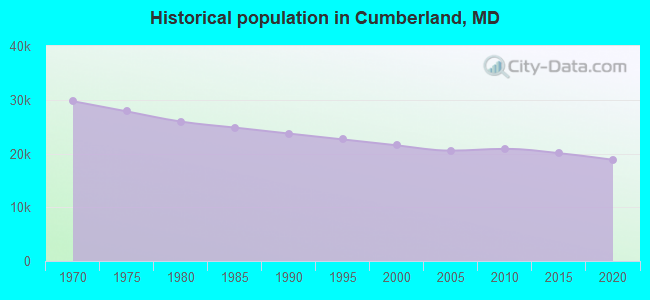
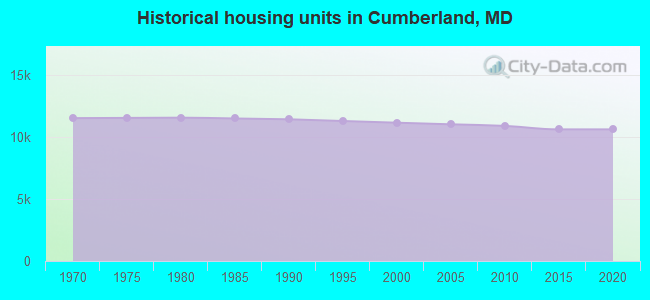
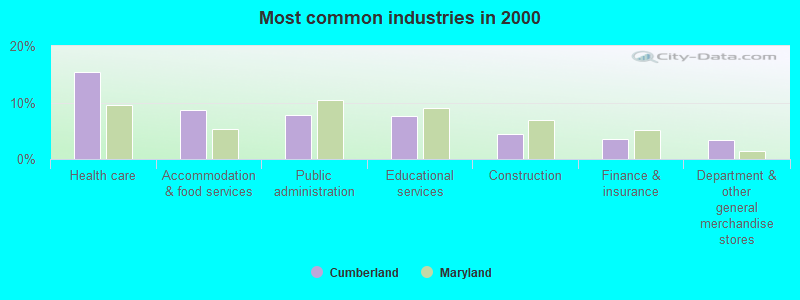
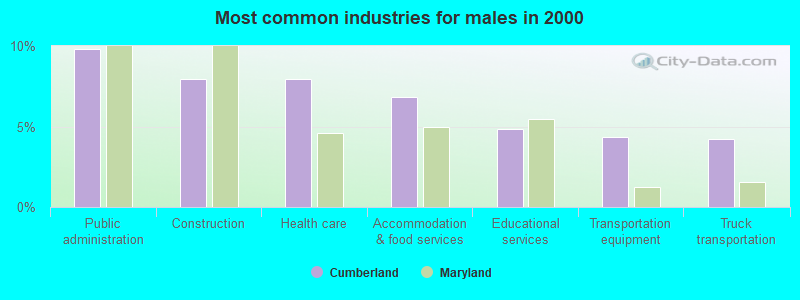
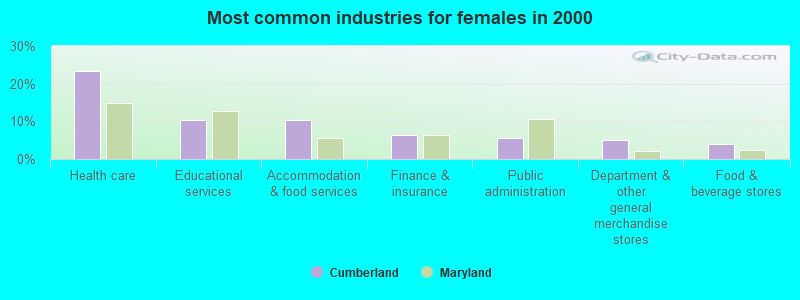
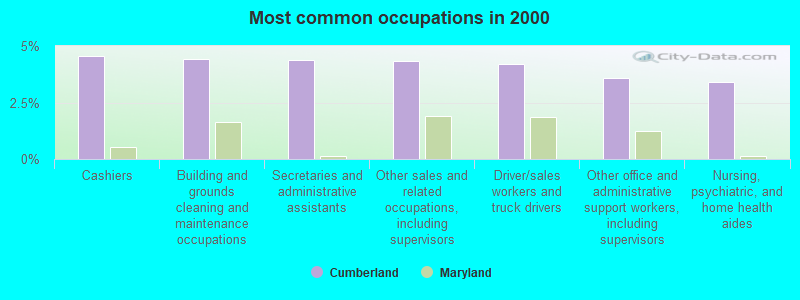

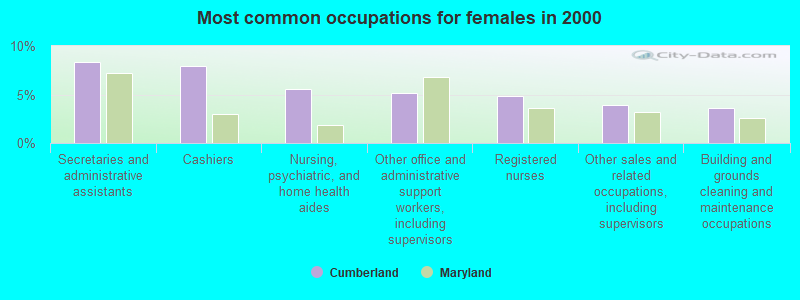
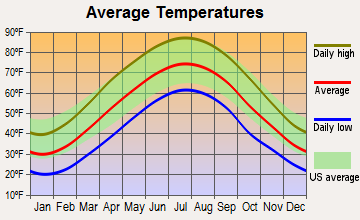
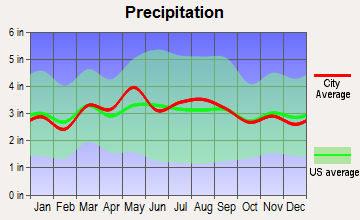
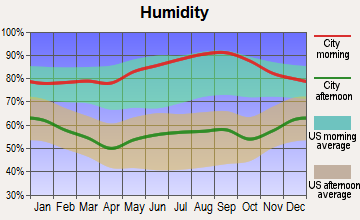
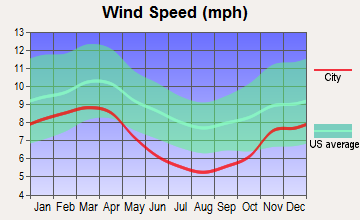
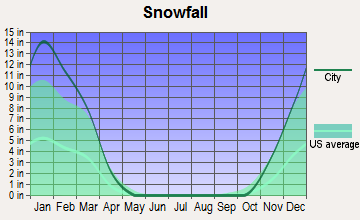
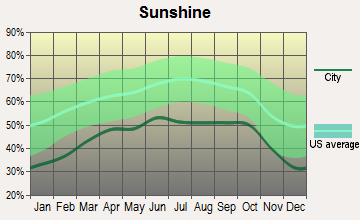
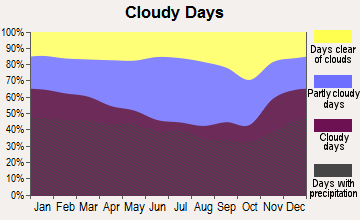
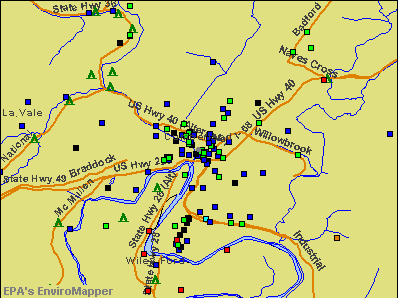

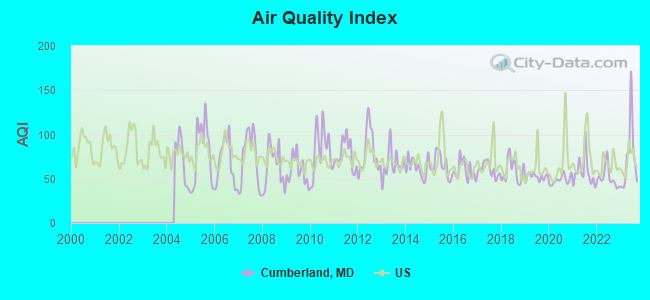
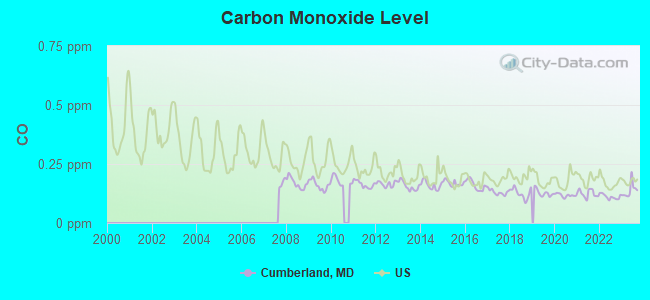
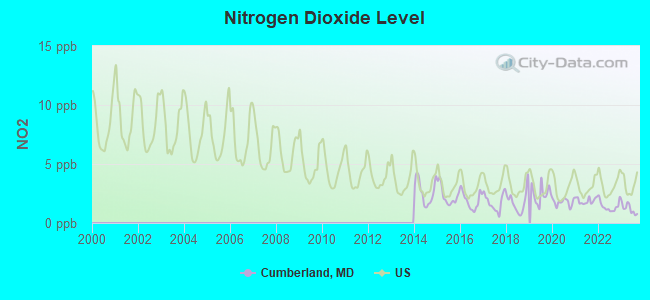
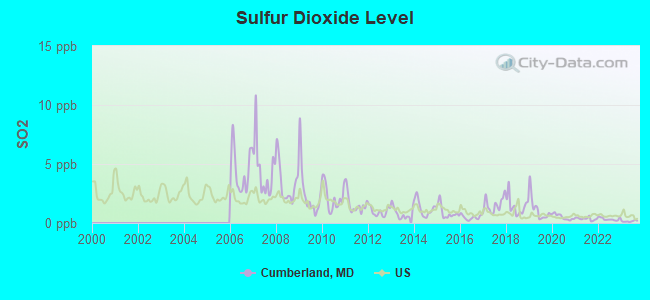
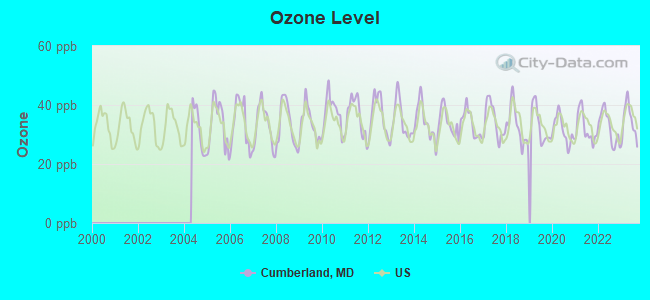
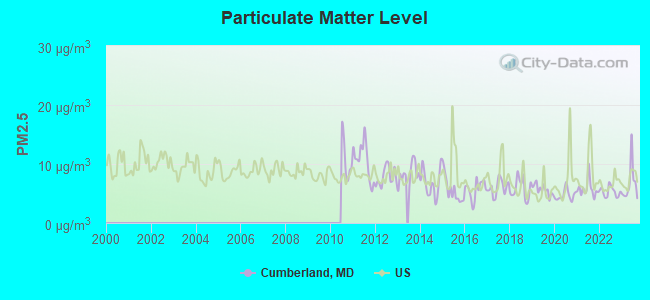

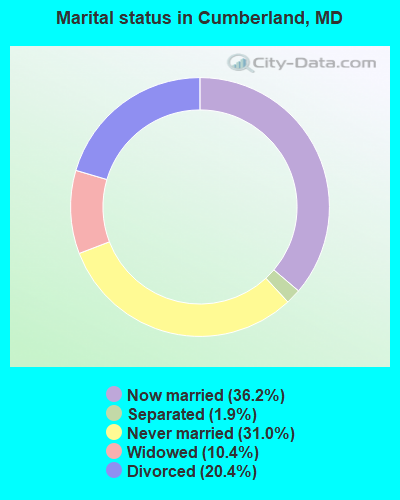
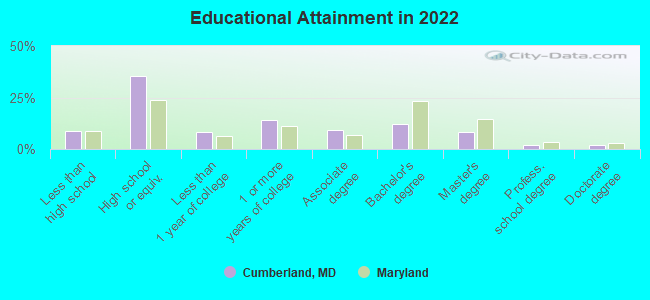
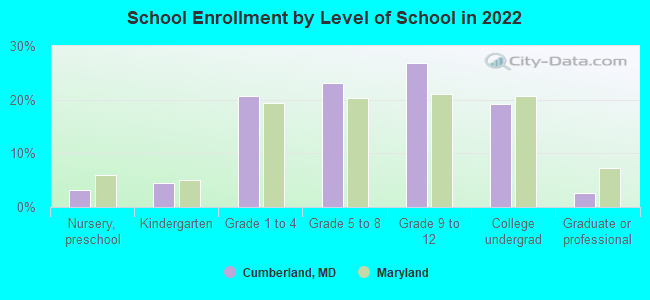
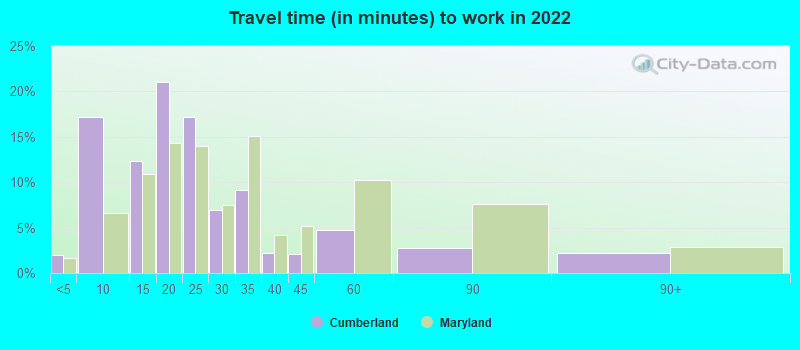
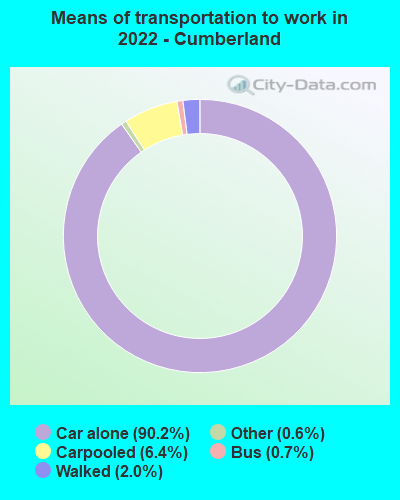
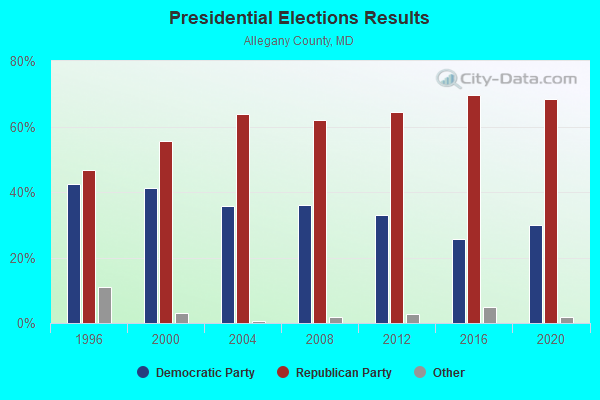
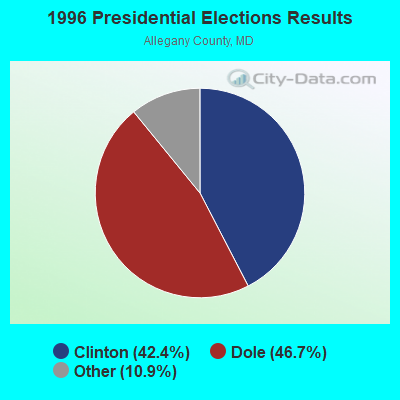
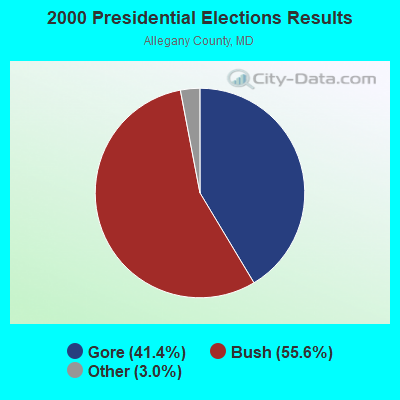
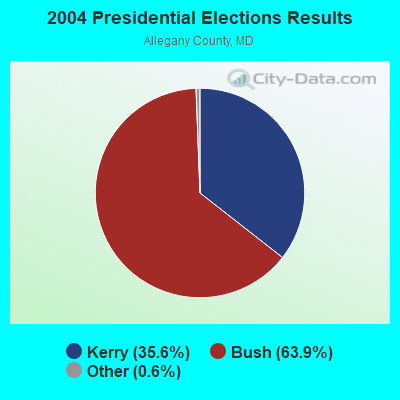
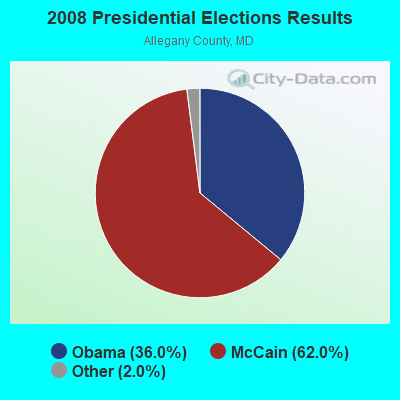
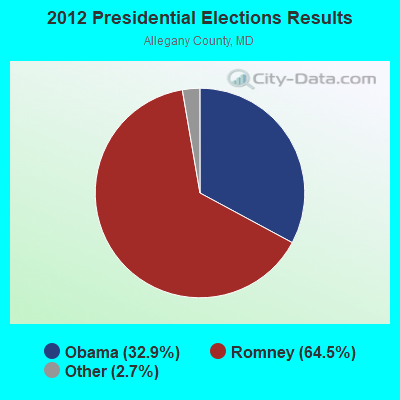
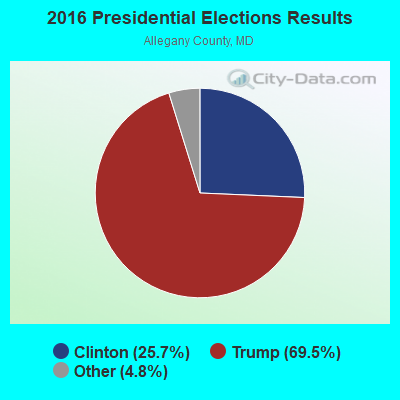
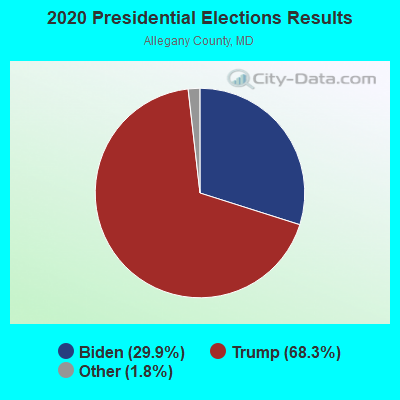
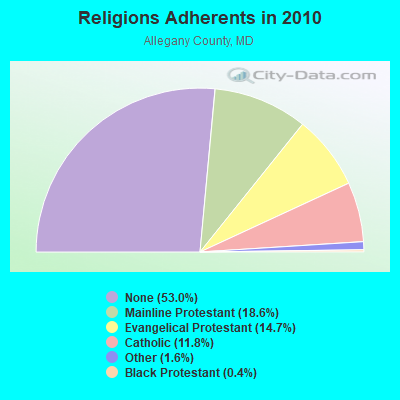
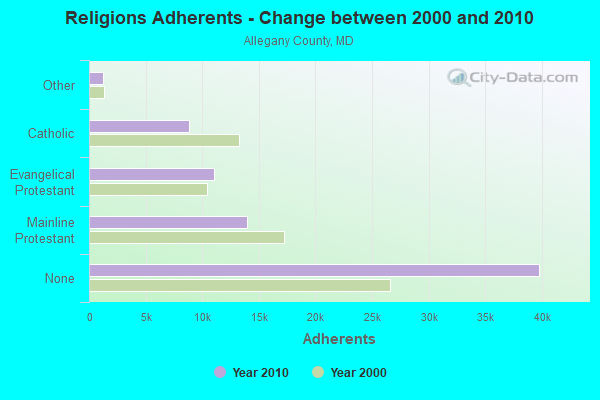
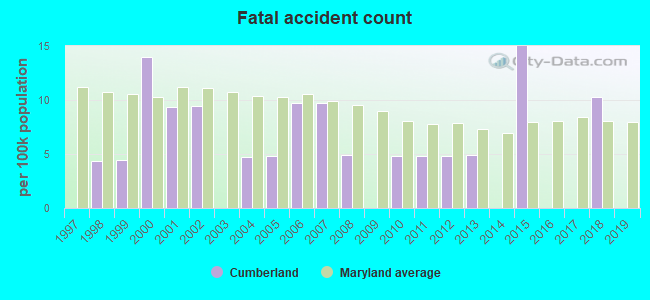
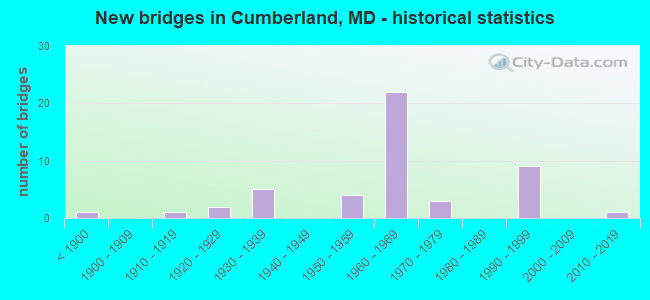
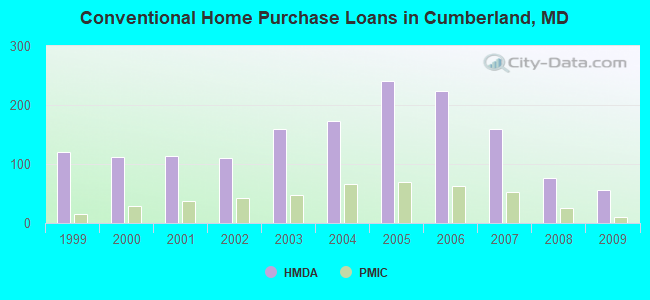
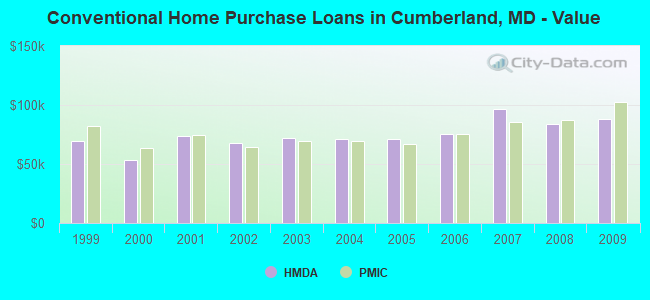
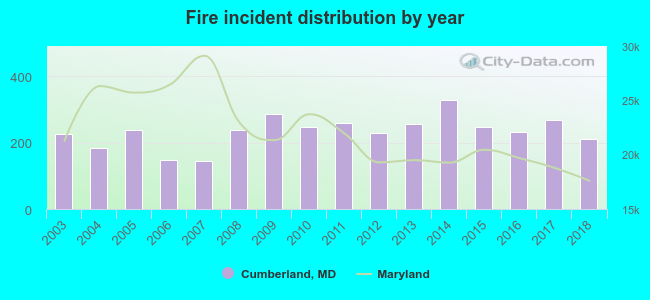 According to the data from the years 2003 - 2018 the average number of fires per year is 234. The highest number of reported fire incidents - 328 took place in 2014, and the least - 145 in 2007. The data has a decreasing trend.
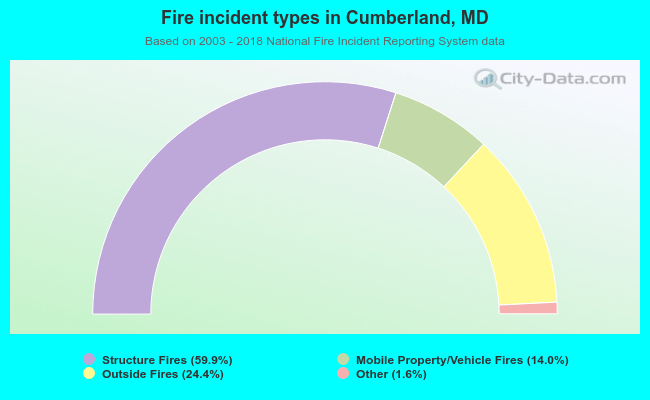 When looking into fire subcategories, the most reports belonged to: Structure Fires (59.9%), and Outside Fires (24.4%).