Fairview, New York Submit your own pictures of this place and show them to the world
OSM Map
General Map
Google Map
MSN Map
OSM Map
General Map
Google Map
MSN Map
OSM Map
General Map
Google Map
MSN Map
OSM Map
General Map
Google Map
MSN Map
Please wait while loading the map...
Population in 2010: 5,515. Population change since 2000: +1.7%Males: 2,990 Females: 2,525
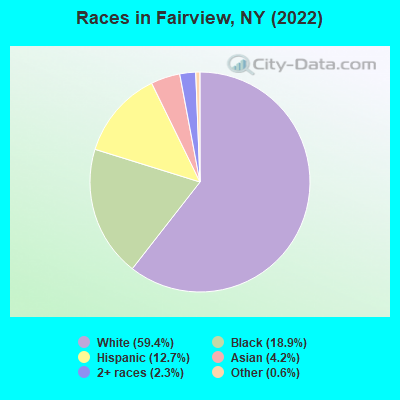
March 2022 cost of living index in Fairview: 133.6 (high, U.S. average is 100) Percentage of residents living in poverty in 2022: 15.3%for White Non-Hispanic residents , 5.5% for Black residents , 5.7% for Hispanic or Latino residents , 2.9% for other race residents , 11.0% for two or more races residents )Business Search - 14 Million verified businesses
Data:
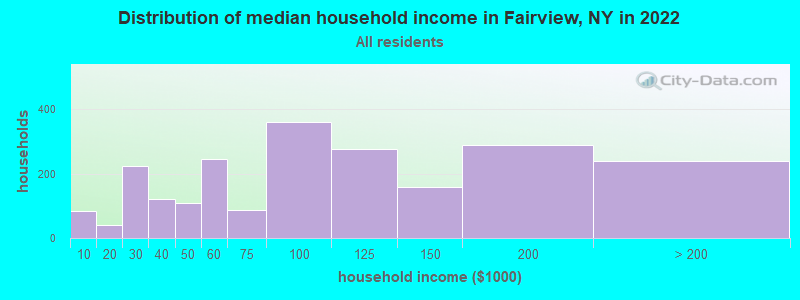
Median household income ($)
Median household income (% change since 2000)
Household income diversity
Ratio of average income to average house value (%)
Ratio of average income to average rent
Median household income ($) - White
Median household income ($) - Black or African American
Median household income ($) - Asian
Median household income ($) - Hispanic or Latino
Median household income ($) - American Indian and Alaska Native
Median household income ($) - Multirace
Median household income ($) - Other Race
Median household income for houses/condos with a mortgage ($)
Median household income for apartments without a mortgage ($)
Races - White alone (%)
Races - White alone (% change since 2000)
Races - Black alone (%)
Races - Black alone (% change since 2000)
Races - American Indian alone (%)
Races - American Indian alone (% change since 2000)
Races - Asian alone (%)
Races - Asian alone (% change since 2000)
Races - Hispanic (%)
Races - Hispanic (% change since 2000)
Races - Native Hawaiian and Other Pacific Islander alone (%)
Races - Native Hawaiian and Other Pacific Islander alone (% change since 2000)
Races - Two or more races (%)
Races - Two or more races (% change since 2000)
Races - Other race alone (%)
Races - Other race alone (% change since 2000)
Racial diversity
Unemployment (%)
Unemployment (% change since 2000)
Unemployment (%) - White
Unemployment (%) - Black or African American
Unemployment (%) - Asian
Unemployment (%) - Hispanic or Latino
Unemployment (%) - American Indian and Alaska Native
Unemployment (%) - Multirace
Unemployment (%) - Other Race
Population density (people per square mile)
Population - Males (%)
Population - Females (%)
Population - Males (%) - White
Population - Males (%) - Black or African American
Population - Males (%) - Asian
Population - Males (%) - Hispanic or Latino
Population - Males (%) - American Indian and Alaska Native
Population - Males (%) - Multirace
Population - Males (%) - Other Race
Population - Females (%) - White
Population - Females (%) - Black or African American
Population - Females (%) - Asian
Population - Females (%) - Hispanic or Latino
Population - Females (%) - American Indian and Alaska Native
Population - Females (%) - Multirace
Population - Females (%) - Other Race
Coronavirus confirmed cases (Apr 25, 2024)
Deaths caused by coronavirus (Apr 25, 2024)
Coronavirus confirmed cases (per 100k population) (Apr 25, 2024)
Deaths caused by coronavirus (per 100k population) (Apr 25, 2024)
Daily increase in number of cases (Apr 25, 2024)
Weekly increase in number of cases (Apr 25, 2024)
Cases doubled (in days) (Apr 25, 2024)
Hospitalized patients (Apr 18, 2022)
Negative test results (Apr 18, 2022)
Total test results (Apr 18, 2022)
COVID Vaccine doses distributed (per 100k population) (Sep 19, 2023)
COVID Vaccine doses administered (per 100k population) (Sep 19, 2023)
COVID Vaccine doses distributed (Sep 19, 2023)
COVID Vaccine doses administered (Sep 19, 2023)
Likely homosexual households (%)
Likely homosexual households (% change since 2000)
Likely homosexual households - Lesbian couples (%)
Likely homosexual households - Lesbian couples (% change since 2000)
Likely homosexual households - Gay men (%)
Likely homosexual households - Gay men (% change since 2000)
Cost of living index
Median gross rent ($)
Median contract rent ($)
Median monthly housing costs ($)
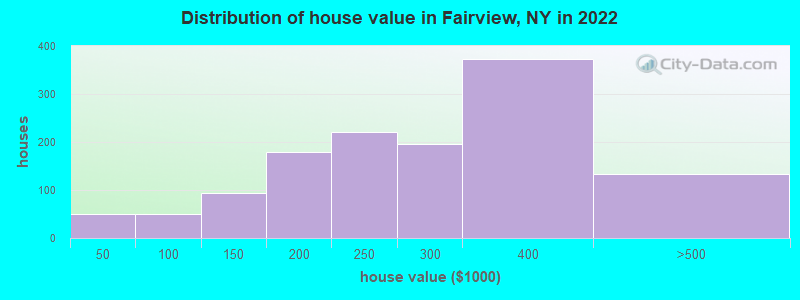
Median house or condo value ($)
Median house or condo value ($ change since 2000)
Mean house or condo value by units in structure - 1, detached ($)
Mean house or condo value by units in structure - 1, attached ($)
Mean house or condo value by units in structure - 2 ($)
Mean house or condo value by units in structure by units in structure - 3 or 4 ($)
Mean house or condo value by units in structure - 5 or more ($)
Mean house or condo value by units in structure - Boat, RV, van, etc. ($)
Mean house or condo value by units in structure - Mobile home ($)
Median house or condo value ($) - White
Median house or condo value ($) - Black or African American
Median house or condo value ($) - Asian
Median house or condo value ($) - Hispanic or Latino
Median house or condo value ($) - American Indian and Alaska Native
Median house or condo value ($) - Multirace
Median house or condo value ($) - Other Race
Median resident age
Resident age diversity
Median resident age - Males
Median resident age - Females
Median resident age - White
Median resident age - Black or African American
Median resident age - Asian
Median resident age - Hispanic or Latino
Median resident age - American Indian and Alaska Native
Median resident age - Multirace
Median resident age - Other Race
Median resident age - Males - White
Median resident age - Males - Black or African American
Median resident age - Males - Asian
Median resident age - Males - Hispanic or Latino
Median resident age - Males - American Indian and Alaska Native
Median resident age - Males - Multirace
Median resident age - Males - Other Race
Median resident age - Females - White
Median resident age - Females - Black or African American
Median resident age - Females - Asian
Median resident age - Females - Hispanic or Latino
Median resident age - Females - American Indian and Alaska Native
Median resident age - Females - Multirace
Median resident age - Females - Other Race
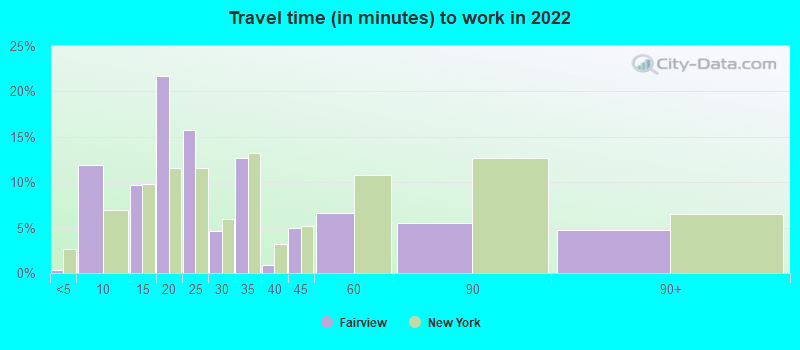
Commute - mean travel time to work (minutes)
Travel time to work - Less than 5 minutes (%)
Travel time to work - Less than 5 minutes (% change since 2000)
Travel time to work - 5 to 9 minutes (%)
Travel time to work - 5 to 9 minutes (% change since 2000)
Travel time to work - 10 to 19 minutes (%)
Travel time to work - 10 to 19 minutes (% change since 2000)
Travel time to work - 20 to 29 minutes (%)
Travel time to work - 20 to 29 minutes (% change since 2000)
Travel time to work - 30 to 39 minutes (%)
Travel time to work - 30 to 39 minutes (% change since 2000)
Travel time to work - 40 to 59 minutes (%)
Travel time to work - 40 to 59 minutes (% change since 2000)
Travel time to work - 60 to 89 minutes (%)
Travel time to work - 60 to 89 minutes (% change since 2000)
Travel time to work - 90 or more minutes (%)
Travel time to work - 90 or more minutes (% change since 2000)
Marital status - Never married (%)
Marital status - Now married (%)
Marital status - Separated (%)
Marital status - Widowed (%)
Marital status - Divorced (%)
Median family income ($)
Median family income (% change since 2000)
Median non-family income ($)
Median non-family income (% change since 2000)
Median per capita income ($)
Median per capita income (% change since 2000)
Median family income ($) - White
Median family income ($) - Black or African American
Median family income ($) - Asian
Median family income ($) - Hispanic or Latino
Median family income ($) - American Indian and Alaska Native
Median family income ($) - Multirace
Median family income ($) - Other Race
Median year house/condo built
Median year apartment built
Year house built - Built 2005 or later (%)
Year house built - Built 2000 to 2004 (%)
Year house built - Built 1990 to 1999 (%)
Year house built - Built 1980 to 1989 (%)
Year house built - Built 1970 to 1979 (%)
Year house built - Built 1960 to 1969 (%)
Year house built - Built 1950 to 1959 (%)
Year house built - Built 1940 to 1949 (%)
Year house built - Built 1939 or earlier (%)
Average household size
Household density (households per square mile)
Average household size - White
Average household size - Black or African American
Average household size - Asian
Average household size - Hispanic or Latino
Average household size - American Indian and Alaska Native
Average household size - Multirace
Average household size - Other Race
Occupied housing units (%)
Vacant housing units (%)
Owner occupied housing units (%)
Renter occupied housing units (%)
Vacancy status - For rent (%)
Vacancy status - For sale only (%)
Vacancy status - Rented or sold, not occupied (%)
Vacancy status - For seasonal, recreational, or occasional use (%)
Vacancy status - For migrant workers (%)
Vacancy status - Other vacant (%)
Residents with income below the poverty level (%)
Residents with income below 50% of the poverty level (%)
Children below poverty level (%)
Poor families by family type - Married-couple family (%)
Poor families by family type - Male, no wife present (%)
Poor families by family type - Female, no husband present (%)
Poverty status for native-born residents (%)
Poverty status for foreign-born residents (%)
Poverty among high school graduates not in families (%)
Poverty among people who did not graduate high school not in families (%)
Residents with income below the poverty level (%) - White
Residents with income below the poverty level (%) - Black or African American
Residents with income below the poverty level (%) - Asian
Residents with income below the poverty level (%) - Hispanic or Latino
Residents with income below the poverty level (%) - American Indian and Alaska Native
Residents with income below the poverty level (%) - Multirace
Residents with income below the poverty level (%) - Other Race
Air pollution - Air Quality Index (AQI)
Air pollution - CO
Air pollution - NO2
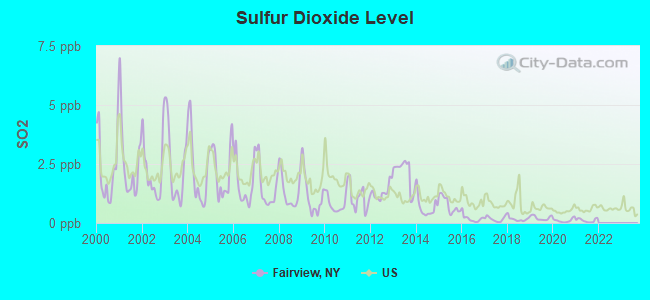
Air pollution - SO2
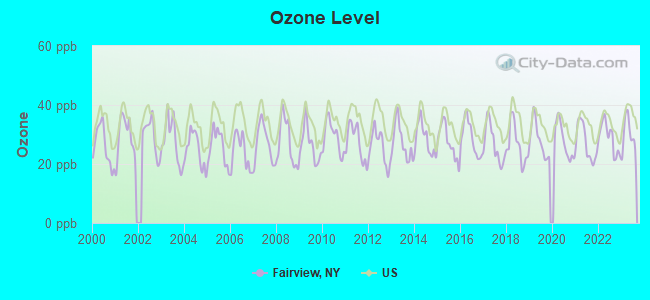
Air pollution - Ozone
Air pollution - PM10
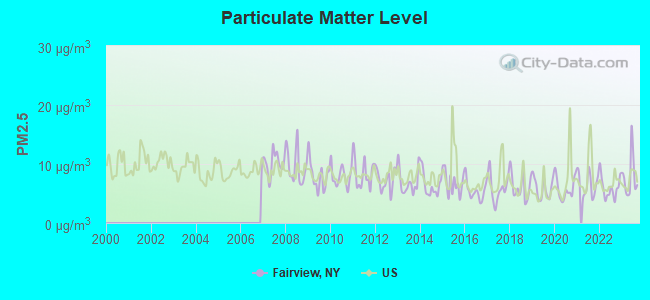
Air pollution - PM25
Air pollution - Pb
Crime - Murders per 100,000 population
Crime - Rapes per 100,000 population
Crime - Robberies per 100,000 population
Crime - Assaults per 100,000 population
Crime - Burglaries per 100,000 population
Crime - Thefts per 100,000 population
Crime - Auto thefts per 100,000 population
Crime - Arson per 100,000 population
Crime - City-data.com crime index
Crime - Violent crime index
Crime - Property crime index
Crime - Murders per 100,000 population (5 year average)
Crime - Rapes per 100,000 population (5 year average)
Crime - Robberies per 100,000 population (5 year average)
Crime - Assaults per 100,000 population (5 year average)
Crime - Burglaries per 100,000 population (5 year average)
Crime - Thefts per 100,000 population (5 year average)
Crime - Auto thefts per 100,000 population (5 year average)
Crime - Arson per 100,000 population (5 year average)
Crime - City-data.com crime index (5 year average)
Crime - Violent crime index (5 year average)
Crime - Property crime index (5 year average)
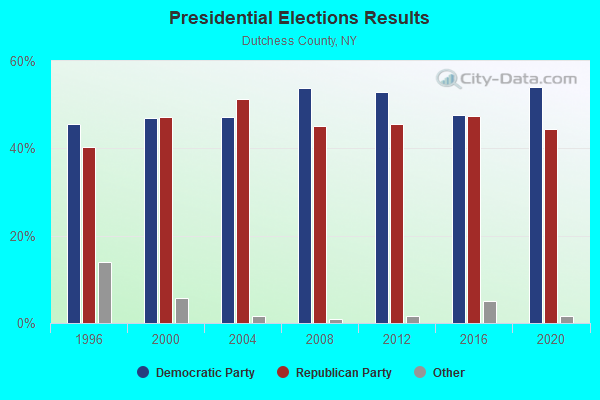
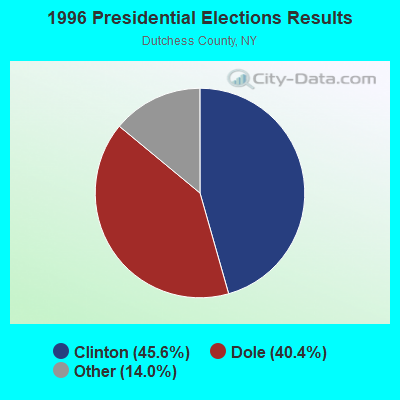
1996 Presidential Elections Results (%) - Democratic Party (Clinton)
1996 Presidential Elections Results (%) - Republican Party (Dole)
1996 Presidential Elections Results (%) - Other
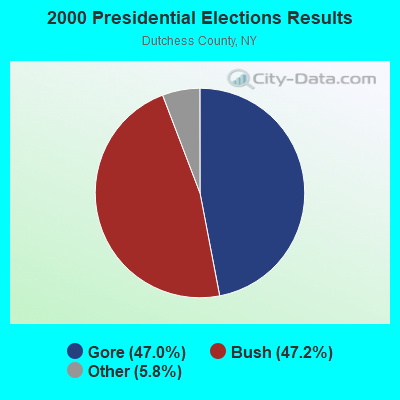
2000 Presidential Elections Results (%) - Democratic Party (Gore)
2000 Presidential Elections Results (%) - Republican Party (Bush)
2000 Presidential Elections Results (%) - Other
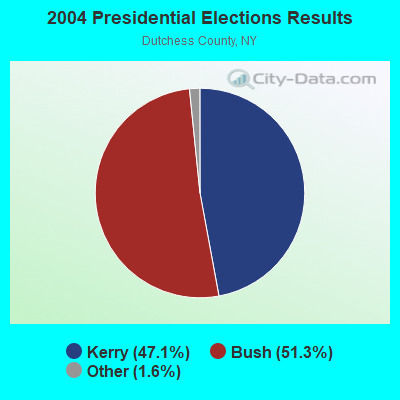
2004 Presidential Elections Results (%) - Democratic Party (Kerry)
2004 Presidential Elections Results (%) - Republican Party (Bush)
2004 Presidential Elections Results (%) - Other
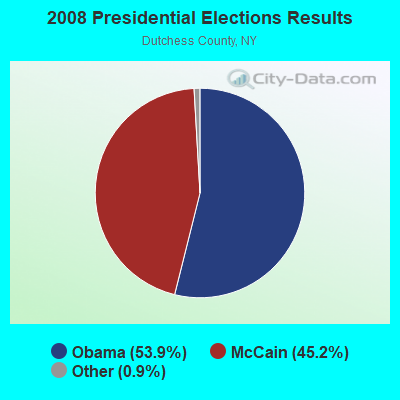
2008 Presidential Elections Results (%) - Democratic Party (Obama)
2008 Presidential Elections Results (%) - Republican Party (McCain)
2008 Presidential Elections Results (%) - Other
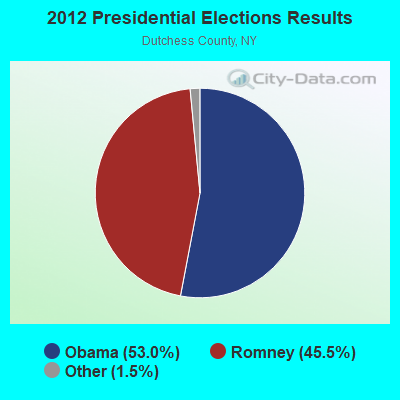
2012 Presidential Elections Results (%) - Democratic Party (Obama)
2012 Presidential Elections Results (%) - Republican Party (Romney)
2012 Presidential Elections Results (%) - Other
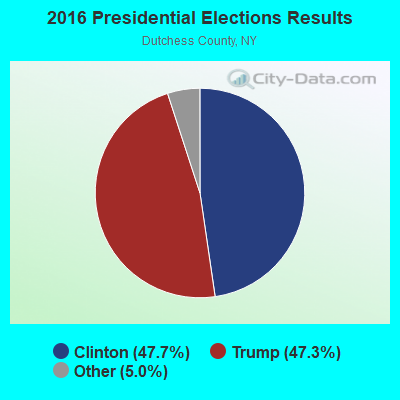
2016 Presidential Elections Results (%) - Democratic Party (Clinton)
2016 Presidential Elections Results (%) - Republican Party (Trump)
2016 Presidential Elections Results (%) - Other
2020 Presidential Elections Results (%) - Democratic Party (Biden)
2020 Presidential Elections Results (%) - Republican Party (Trump)
2020 Presidential Elections Results (%) - Other
Ancestries Reported - Arab (%)
Ancestries Reported - Czech (%)
Ancestries Reported - Danish (%)
Ancestries Reported - Dutch (%)
Ancestries Reported - English (%)
Ancestries Reported - French (%)
Ancestries Reported - French Canadian (%)
Ancestries Reported - German (%)
Ancestries Reported - Greek (%)
Ancestries Reported - Hungarian (%)
Ancestries Reported - Irish (%)
Ancestries Reported - Italian (%)
Ancestries Reported - Lithuanian (%)
Ancestries Reported - Norwegian (%)
Ancestries Reported - Polish (%)
Ancestries Reported - Portuguese (%)
Ancestries Reported - Russian (%)
Ancestries Reported - Scotch-Irish (%)
Ancestries Reported - Scottish (%)
Ancestries Reported - Slovak (%)
Ancestries Reported - Subsaharan African (%)
Ancestries Reported - Swedish (%)
Ancestries Reported - Swiss (%)
Ancestries Reported - Ukrainian (%)
Ancestries Reported - United States (%)
Ancestries Reported - Welsh (%)
Ancestries Reported - West Indian (%)
Ancestries Reported - Other (%)
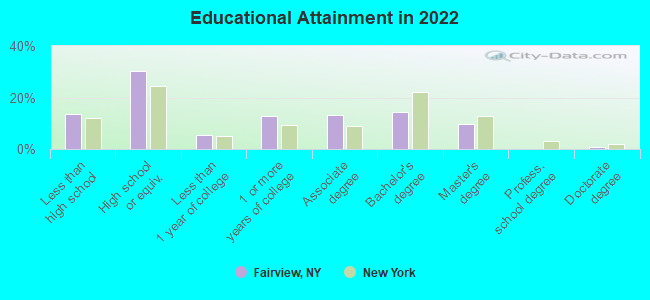
Educational Attainment - No schooling completed (%)
Educational Attainment - Less than high school (%)
Educational Attainment - High school or equivalent (%)
Educational Attainment - Less than 1 year of college (%)
Educational Attainment - 1 or more years of college (%)
Educational Attainment - Associate degree (%)
Educational Attainment - Bachelor's degree (%)
Educational Attainment - Master's degree (%)
Educational Attainment - Professional school degree (%)
Educational Attainment - Doctorate degree (%)
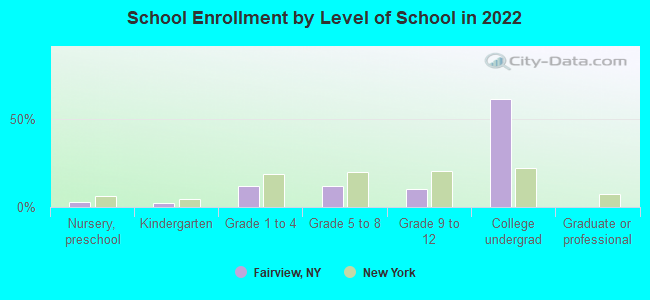
School Enrollment - Nursery, preschool (%)
School Enrollment - Kindergarten (%)
School Enrollment - Grade 1 to 4 (%)
School Enrollment - Grade 5 to 8 (%)
School Enrollment - Grade 9 to 12 (%)
School Enrollment - College undergrad (%)
School Enrollment - Graduate or professional (%)
School Enrollment - Not enrolled in school (%)
School enrollment - Public schools (%)
School enrollment - Private schools (%)
School enrollment - Not enrolled (%)
Median number of rooms in houses and condos
Median number of rooms in apartments
Housing units lacking complete plumbing facilities (%)
Housing units lacking complete kitchen facilities (%)
Density of houses
Urban houses (%)
Rural houses (%)
Households with people 60 years and over (%)
Households with people 65 years and over (%)
Households with people 75 years and over (%)
Households with one or more nonrelatives (%)
Households with no nonrelatives (%)
Population in households (%)
Family households (%)
Nonfamily households (%)
Population in families (%)
Family households with own children (%)
Median number of bedrooms in owner occupied houses
Mean number of bedrooms in owner occupied houses
Median number of bedrooms in renter occupied houses
Mean number of bedrooms in renter occupied houses
Median number of vehichles in owner occupied houses
Mean number of vehichles in owner occupied houses
Median number of vehichles in renter occupied houses
Mean number of vehichles in renter occupied houses
Mortgage status - with mortgage (%)
Mortgage status - with second mortgage (%)
Mortgage status - with home equity loan (%)
Mortgage status - with both second mortgage and home equity loan (%)
Mortgage status - without a mortgage (%)
Average family size
Average family size - White
Average family size - Black or African American
Average family size - Asian
Average family size - Hispanic or Latino
Average family size - American Indian and Alaska Native
Average family size - Multirace
Average family size - Other Race
Geographical mobility - Same house 1 year ago (%)
Geographical mobility - Moved within same county (%)
Geographical mobility - Moved from different county within same state (%)
Geographical mobility - Moved from different state (%)
Geographical mobility - Moved from abroad (%)
Place of birth - Born in state of residence (%)
Place of birth - Born in other state (%)
Place of birth - Native, outside of US (%)
Place of birth - Foreign born (%)
Housing units in structures - 1, detached (%)
Housing units in structures - 1, attached (%)
Housing units in structures - 2 (%)
Housing units in structures - 3 or 4 (%)
Housing units in structures - 5 to 9 (%)
Housing units in structures - 10 to 19 (%)
Housing units in structures - 20 to 49 (%)
Housing units in structures - 50 or more (%)
Housing units in structures - Mobile home (%)
Housing units in structures - Boat, RV, van, etc. (%)
House/condo owner moved in on average (years ago)
Renter moved in on average (years ago)
Year householder moved into unit - Moved in 1999 to March 2000 (%)
Year householder moved into unit - Moved in 1995 to 1998 (%)
Year householder moved into unit - Moved in 1990 to 1994 (%)
Year householder moved into unit - Moved in 1980 to 1989 (%)
Year householder moved into unit - Moved in 1970 to 1979 (%)
Year householder moved into unit - Moved in 1969 or earlier (%)
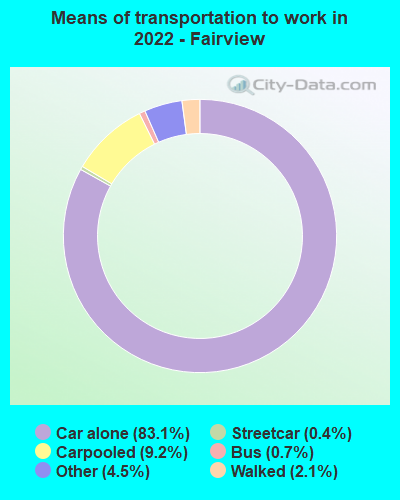
Means of transportation to work - Drove car alone (%)
Means of transportation to work - Carpooled (%)
Means of transportation to work - Public transportation (%)
Means of transportation to work - Bus or trolley bus (%)
Means of transportation to work - Streetcar or trolley car (%)
Means of transportation to work - Subway or elevated (%)
Means of transportation to work - Railroad (%)
Means of transportation to work - Ferryboat (%)
Means of transportation to work - Taxicab (%)
Means of transportation to work - Motorcycle (%)
Means of transportation to work - Bicycle (%)
Means of transportation to work - Walked (%)
Means of transportation to work - Other means (%)
Working at home (%)
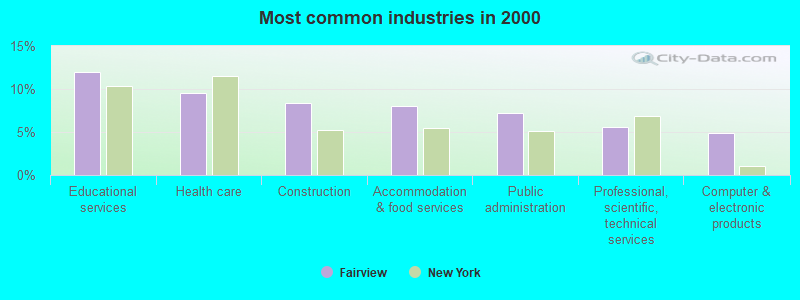
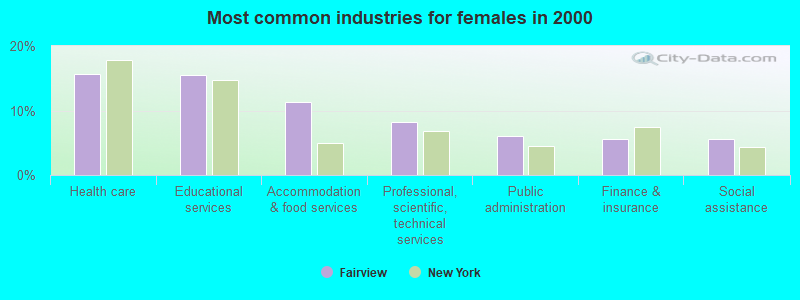
Industry diversity
Most Common Industries - Agriculture, forestry, fishing and hunting, and mining (%)
Most Common Industries - Agriculture, forestry, fishing and hunting (%)
Most Common Industries - Mining, quarrying, and oil and gas extraction (%)
Most Common Industries - Construction (%)
Most Common Industries - Manufacturing (%)
Most Common Industries - Wholesale trade (%)
Most Common Industries - Retail trade (%)
Most Common Industries - Transportation and warehousing, and utilities (%)
Most Common Industries - Transportation and warehousing (%)
Most Common Industries - Utilities (%)
Most Common Industries - Information (%)
Most Common Industries - Finance and insurance, and real estate and rental and leasing (%)
Most Common Industries - Finance and insurance (%)
Most Common Industries - Real estate and rental and leasing (%)
Most Common Industries - Professional, scientific, and management, and administrative and waste management services (%)
Most Common Industries - Professional, scientific, and technical services (%)
Most Common Industries - Management of companies and enterprises (%)
Most Common Industries - Administrative and support and waste management services (%)
Most Common Industries - Educational services, and health care and social assistance (%)
Most Common Industries - Educational services (%)
Most Common Industries - Health care and social assistance (%)
Most Common Industries - Arts, entertainment, and recreation, and accommodation and food services (%)
Most Common Industries - Arts, entertainment, and recreation (%)
Most Common Industries - Accommodation and food services (%)
Most Common Industries - Other services, except public administration (%)
Most Common Industries - Public administration (%)
Occupation diversity
Most Common Occupations - Management, business, science, and arts occupations (%)
Most Common Occupations - Management, business, and financial occupations (%)
Most Common Occupations - Management occupations (%)
Most Common Occupations - Business and financial operations occupations (%)
Most Common Occupations - Computer, engineering, and science occupations (%)
Most Common Occupations - Computer and mathematical occupations (%)
Most Common Occupations - Architecture and engineering occupations (%)
Most Common Occupations - Life, physical, and social science occupations (%)
Most Common Occupations - Education, legal, community service, arts, and media occupations (%)
Most Common Occupations - Community and social service occupations (%)
Most Common Occupations - Legal occupations (%)
Most Common Occupations - Education, training, and library occupations (%)
Most Common Occupations - Arts, design, entertainment, sports, and media occupations (%)
Most Common Occupations - Healthcare practitioners and technical occupations (%)
Most Common Occupations - Health diagnosing and treating practitioners and other technical occupations (%)
Most Common Occupations - Health technologists and technicians (%)
Most Common Occupations - Service occupations (%)
Most Common Occupations - Healthcare support occupations (%)
Most Common Occupations - Protective service occupations (%)
Most Common Occupations - Fire fighting and prevention, and other protective service workers including supervisors (%)
Most Common Occupations - Law enforcement workers including supervisors (%)
Most Common Occupations - Food preparation and serving related occupations (%)
Most Common Occupations - Building and grounds cleaning and maintenance occupations (%)
Most Common Occupations - Personal care and service occupations (%)
Most Common Occupations - Sales and office occupations (%)
Most Common Occupations - Sales and related occupations (%)
Most Common Occupations - Office and administrative support occupations (%)
Most Common Occupations - Natural resources, construction, and maintenance occupations (%)
Most Common Occupations - Farming, fishing, and forestry occupations (%)
Most Common Occupations - Construction and extraction occupations (%)
Most Common Occupations - Installation, maintenance, and repair occupations (%)
Most Common Occupations - Production, transportation, and material moving occupations (%)
Most Common Occupations - Production occupations (%)
Most Common Occupations - Transportation occupations (%)
Most Common Occupations - Material moving occupations (%)
People in Group quarters - Institutionalized population (%)
People in Group quarters - Correctional institutions (%)
People in Group quarters - Federal prisons and detention centers (%)
People in Group quarters - Halfway houses (%)
People in Group quarters - Local jails and other confinement facilities (including police lockups) (%)
People in Group quarters - Military disciplinary barracks (%)
People in Group quarters - State prisons (%)
People in Group quarters - Other types of correctional institutions (%)
People in Group quarters - Nursing homes (%)
People in Group quarters - Hospitals/wards, hospices, and schools for the handicapped (%)
People in Group quarters - Hospitals/wards and hospices for chronically ill (%)
People in Group quarters - Hospices or homes for chronically ill (%)
People in Group quarters - Military hospitals or wards for chronically ill (%)
People in Group quarters - Other hospitals or wards for chronically ill (%)
People in Group quarters - Hospitals or wards for drug/alcohol abuse (%)
People in Group quarters - Mental (Psychiatric) hospitals or wards (%)
People in Group quarters - Schools, hospitals, or wards for the mentally retarded (%)
People in Group quarters - Schools, hospitals, or wards for the physically handicapped (%)
People in Group quarters - Institutions for the deaf (%)
People in Group quarters - Institutions for the blind (%)
People in Group quarters - Orthopedic wards and institutions for the physically handicapped (%)
People in Group quarters - Wards in general hospitals for patients who have no usual home elsewhere (%)
People in Group quarters - Wards in military hospitals for patients who have no usual home elsewhere (%)
People in Group quarters - Juvenile institutions (%)
People in Group quarters - Long-term care (%)
People in Group quarters - Homes for abused, dependent, and neglected children (%)
People in Group quarters - Residential treatment centers for emotionally disturbed children (%)
People in Group quarters - Training schools for juvenile delinquents (%)
People in Group quarters - Short-term care, detention or diagnostic centers for delinquent children (%)
People in Group quarters - Type of juvenile institution unknown (%)
People in Group quarters - Noninstitutionalized population (%)
People in Group quarters - College dormitories (includes college quarters off campus) (%)
People in Group quarters - Military quarters (%)
People in Group quarters - On base (%)
People in Group quarters - Barracks, unaccompanied personnel housing (UPH), (Enlisted/Officer), ;and similar group living quarters for military personnel (%)
People in Group quarters - Transient quarters for temporary residents (%)
People in Group quarters - Military ships (%)
People in Group quarters - Group homes (%)
People in Group quarters - Homes or halfway houses for drug/alcohol abuse (%)
People in Group quarters - Homes for the mentally ill (%)
People in Group quarters - Homes for the mentally retarded (%)
People in Group quarters - Homes for the physically handicapped (%)
People in Group quarters - Other group homes (%)
People in Group quarters - Religious group quarters (%)
People in Group quarters - Dormitories (%)
People in Group quarters - Agriculture workers' dormitories on farms (%)
People in Group quarters - Job Corps and vocational training facilities (%)
People in Group quarters - Other workers' dormitories (%)
People in Group quarters - Crews of maritime vessels (%)
People in Group quarters - Other nonhousehold living situations (%)
People in Group quarters - Other noninstitutional group quarters (%)
Residents speaking English at home (%)
Residents speaking English at home - Born in the United States (%)
Residents speaking English at home - Native, born elsewhere (%)
Residents speaking English at home - Foreign born (%)
Residents speaking Spanish at home (%)
Residents speaking Spanish at home - Born in the United States (%)
Residents speaking Spanish at home - Native, born elsewhere (%)
Residents speaking Spanish at home - Foreign born (%)
Residents speaking other language at home (%)
Residents speaking other language at home - Born in the United States (%)
Residents speaking other language at home - Native, born elsewhere (%)
Residents speaking other language at home - Foreign born (%)
Class of Workers - Employee of private company (%)
Class of Workers - Self-employed in own incorporated business (%)
Class of Workers - Private not-for-profit wage and salary workers (%)
Class of Workers - Local government workers (%)
Class of Workers - State government workers (%)
Class of Workers - Federal government workers (%)
Class of Workers - Self-employed workers in own not incorporated business and Unpaid family workers (%)
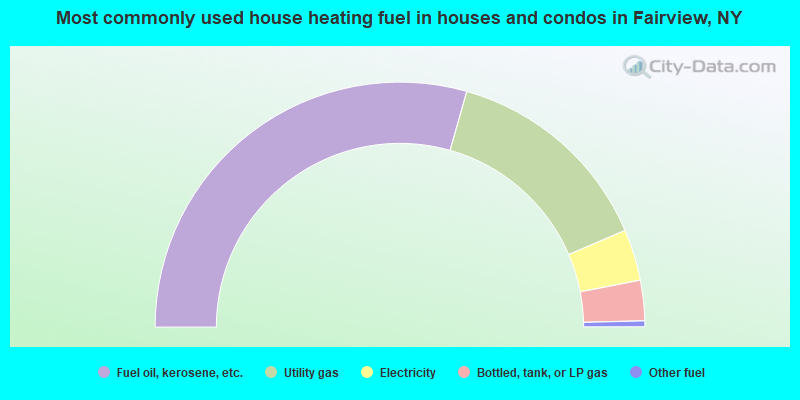
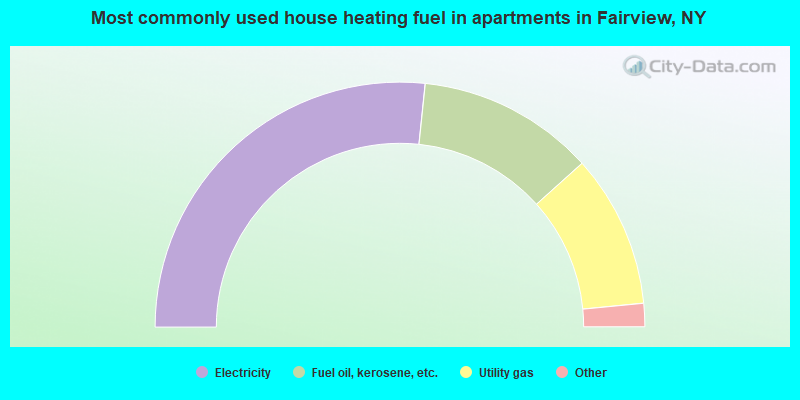
House heating fuel used in houses and condos - Utility gas (%)
House heating fuel used in houses and condos - Bottled, tank, or LP gas (%)
House heating fuel used in houses and condos - Electricity (%)
House heating fuel used in houses and condos - Fuel oil, kerosene, etc. (%)
House heating fuel used in houses and condos - Coal or coke (%)
House heating fuel used in houses and condos - Wood (%)
House heating fuel used in houses and condos - Solar energy (%)
House heating fuel used in houses and condos - Other fuel (%)
House heating fuel used in houses and condos - No fuel used (%)
House heating fuel used in apartments - Utility gas (%)
House heating fuel used in apartments - Bottled, tank, or LP gas (%)
House heating fuel used in apartments - Electricity (%)
House heating fuel used in apartments - Fuel oil, kerosene, etc. (%)
House heating fuel used in apartments - Coal or coke (%)
House heating fuel used in apartments - Wood (%)
House heating fuel used in apartments - Solar energy (%)
House heating fuel used in apartments - Other fuel (%)
House heating fuel used in apartments - No fuel used (%)
Armed forces status - In Armed Forces (%)
Armed forces status - Civilian (%)
Armed forces status - Civilian - Veteran (%)
Armed forces status - Civilian - Nonveteran (%)
Fatal accidents locations in years 2005-2021
Fatal accidents locations in 2005
Fatal accidents locations in 2006
Fatal accidents locations in 2007
Fatal accidents locations in 2008
Fatal accidents locations in 2009
Fatal accidents locations in 2010
Fatal accidents locations in 2011
Fatal accidents locations in 2012
Fatal accidents locations in 2013
Fatal accidents locations in 2014
Fatal accidents locations in 2015
Fatal accidents locations in 2016
Fatal accidents locations in 2017
Fatal accidents locations in 2018
Fatal accidents locations in 2019
Fatal accidents locations in 2020
Fatal accidents locations in 2021
Alcohol use - People drinking some alcohol every month (%)
Alcohol use - People not drinking at all (%)
Alcohol use - Average days/month drinking alcohol
Alcohol use - Average drinks/week
Alcohol use - Average days/year people drink much
Audiometry - Average condition of hearing (%)
Audiometry - People that can hear a whisper from across a quiet room (%)
Audiometry - People that can hear normal voice from across a quiet room (%)
Audiometry - Ears ringing, roaring, buzzing (%)
Audiometry - Had a job exposure to loud noise (%)
Audiometry - Had off-work exposure to loud noise (%)
Blood Pressure & Cholesterol - Has high blood pressure (%)
Blood Pressure & Cholesterol - Checking blood pressure at home (%)
Blood Pressure & Cholesterol - Frequently checking blood cholesterol (%)
Blood Pressure & Cholesterol - Has high cholesterol level (%)
Consumer Behavior - Money monthly spent on food at supermarket/grocery store
Consumer Behavior - Money monthly spent on food at other stores
Consumer Behavior - Money monthly spent on eating out
Consumer Behavior - Money monthly spent on carryout/delivered foods
Consumer Behavior - Income spent on food at supermarket/grocery store (%)
Consumer Behavior - Income spent on food at other stores (%)
Consumer Behavior - Income spent on eating out (%)
Consumer Behavior - Income spent on carryout/delivered foods (%)
Current Health Status - General health condition (%)
Current Health Status - Blood donors (%)
Current Health Status - Has blood ever tested for HIV virus (%)
Current Health Status - Left-handed people (%)
Dermatology - People using sunscreen (%)
Diabetes - Diabetics (%)
Diabetes - Had a blood test for high blood sugar (%)
Diabetes - People taking insulin (%)
Diet Behavior & Nutrition - Diet health (%)
Diet Behavior & Nutrition - Milk product consumption (# of products/month)
Diet Behavior & Nutrition - Meals not home prepared (#/week)
Diet Behavior & Nutrition - Meals from fast food or pizza place (#/week)
Diet Behavior & Nutrition - Ready-to-eat foods (#/month)
Diet Behavior & Nutrition - Frozen meals/pizza (#/month)
Drug Use - People that ever used marijuana or hashish (%)
Drug Use - Ever used hard drugs (%)
Drug Use - Ever used any form of cocaine (%)
Drug Use - Ever used heroin (%)
Drug Use - Ever used methamphetamine (%)
Health Insurance - People covered by health insurance (%)
Kidney Conditions-Urology - Avg. # of times urinating at night
Medical Conditions - People with asthma (%)
Medical Conditions - People with anemia (%)
Medical Conditions - People with psoriasis (%)
Medical Conditions - People with overweight (%)
Medical Conditions - Elderly people having difficulties in thinking or remembering (%)
Medical Conditions - People who ever received blood transfusion (%)
Medical Conditions - People having trouble seeing even with glass/contacts (%)
Medical Conditions - People with arthritis (%)
Medical Conditions - People with gout (%)
Medical Conditions - People with congestive heart failure (%)
Medical Conditions - People with coronary heart disease (%)
Medical Conditions - People with angina pectoris (%)
Medical Conditions - People who ever had heart attack (%)
Medical Conditions - People who ever had stroke (%)
Medical Conditions - People with emphysema (%)
Medical Conditions - People with thyroid problem (%)
Medical Conditions - People with chronic bronchitis (%)
Medical Conditions - People with any liver condition (%)
Medical Conditions - People who ever had cancer or malignancy (%)
Mental Health - People who have little interest in doing things (%)
Mental Health - People feeling down, depressed, or hopeless (%)
Mental Health - People who have trouble sleeping or sleeping too much (%)
Mental Health - People feeling tired or having little energy (%)
Mental Health - People with poor appetite or overeating (%)
Mental Health - People feeling bad about themself (%)
Mental Health - People who have trouble concentrating on things (%)
Mental Health - People moving or speaking slowly or too fast (%)
Mental Health - People having thoughts they would be better off dead (%)
Oral Health - Average years since last visit a dentist
Oral Health - People embarrassed because of mouth (%)
Oral Health - People with gum disease (%)
Oral Health - General health of teeth and gums (%)
Oral Health - Average days a week using dental floss/device
Oral Health - Average days a week using mouthwash for dental problem
Oral Health - Average number of teeth
Pesticide Use - Households using pesticides to control insects (%)
Pesticide Use - Households using pesticides to kill weeds (%)
Physical Activity - People doing vigorous-intensity work activities (%)
Physical Activity - People doing moderate-intensity work activities (%)
Physical Activity - People walking or bicycling (%)
Physical Activity - People doing vigorous-intensity recreational activities (%)
Physical Activity - People doing moderate-intensity recreational activities (%)
Physical Activity - Average hours a day doing sedentary activities
Physical Activity - Average hours a day watching TV or videos
Physical Activity - Average hours a day using computer
Physical Functioning - People having limitations keeping them from working (%)
Physical Functioning - People limited in amount of work they can do (%)
Physical Functioning - People that need special equipment to walk (%)
Physical Functioning - People experiencing confusion/memory problems (%)
Physical Functioning - People requiring special healthcare equipment (%)
Prescription Medications - Average number of prescription medicines taking
Preventive Aspirin Use - Adults 40+ taking low-dose aspirin (%)
Reproductive Health - Vaginal deliveries (%)
Reproductive Health - Cesarean deliveries (%)
Reproductive Health - Deliveries resulted in a live birth (%)
Reproductive Health - Pregnancies resulted in a delivery (%)
Reproductive Health - Women breastfeeding newborns (%)
Reproductive Health - Women that had a hysterectomy (%)
Reproductive Health - Women that had both ovaries removed (%)
Reproductive Health - Women that have ever taken birth control pills (%)
Reproductive Health - Women taking birth control pills (%)
Reproductive Health - Women that have ever used Depo-Provera or injectables (%)
Reproductive Health - Women that have ever used female hormones (%)
Sexual Behavior - People 18+ that ever had sex (vaginal, anal, or oral) (%)
Sexual Behavior - Males 18+ that ever had vaginal sex with a woman (%)
Sexual Behavior - Males 18+ that ever performed oral sex on a woman (%)
Sexual Behavior - Males 18+ that ever had anal sex with a woman (%)
Sexual Behavior - Males 18+ that ever had any sex with a man (%)
Sexual Behavior - Females 18+ that ever had vaginal sex with a man (%)
Sexual Behavior - Females 18+ that ever performed oral sex on a man (%)
Sexual Behavior - Females 18+ that ever had anal sex with a man (%)
Sexual Behavior - Females 18+ that ever had any kind of sex with a woman (%)
Sexual Behavior - Average age people first had sex
Sexual Behavior - Average number of female sex partners in lifetime (males 18+)
Sexual Behavior - Average number of female vaginal sex partners in lifetime (males 18+)
Sexual Behavior - Average age people first performed oral sex on a woman (18+)
Sexual Behavior - Average number of woman performed oral sex on in lifetime (18+)
Sexual Behavior - Average number of male sex partners in lifetime (males 18+)
Sexual Behavior - Average number of male anal sex partners in lifetime (males 18+)
Sexual Behavior - Average age people first performed oral sex on a man (18+)
Sexual Behavior - Average number of male oral sex partners in lifetime (18+)
Sexual Behavior - People using protection when performing oral sex (%)
Sexual Behavior - Average number of times people have vaginal or anal sex a year
Sexual Behavior - People having sex without condom (%)
Sexual Behavior - Average number of male sex partners in lifetime (females 18+)
Sexual Behavior - Average number of male vaginal sex partners in lifetime (females 18+)
Sexual Behavior - Average number of female sex partners in lifetime (females 18+)
Sexual Behavior - Circumcised males 18+ (%)
Sleep Disorders - Average hours sleeping at night
Sleep Disorders - People that has trouble sleeping (%)
Smoking-Cigarette Use - People smoking cigarettes (%)
Taste & Smell - People 40+ having problems with smell (%)
Taste & Smell - People 40+ having problems with taste (%)
Taste & Smell - People 40+ that ever had wisdom teeth removed (%)
Taste & Smell - People 40+ that ever had tonsils teeth removed (%)
Taste & Smell - People 40+ that ever had a loss of consciousness because of a head injury (%)
Taste & Smell - People 40+ that ever had a broken nose or other serious injury to face or skull (%)
Taste & Smell - People 40+ that ever had two or more sinus infections (%)
Weight - Average height (inches)
Weight - Average weight (pounds)
Weight - Average BMI
Weight - People that are obese (%)
Weight - People that ever were obese (%)
Weight - People trying to lose weight (%)
Latest news from Fairview, NY collected exclusively by city-data.com from local newspapers, TV, and radio stations
Ancestries: Italian (15.0%), Jamaican (10.8%), Irish (8.9%), American (7.7%), Guyanese (4.1%), German (3.2%).
Current Local Time:
Land area: 3.48 square miles.
Population density: 1,584 people per square mile (low).
1,027 residents are foreign born (9.6% Latin America , 4.3% Asia ).
This place:
15.3%New York:
22.6%
Median real estate property taxes paid for housing units with mortgages in 2022: $6,895 (2.4%)Median real estate property taxes paid for housing units with no mortgage in 2022: $5,614 (2.5%)
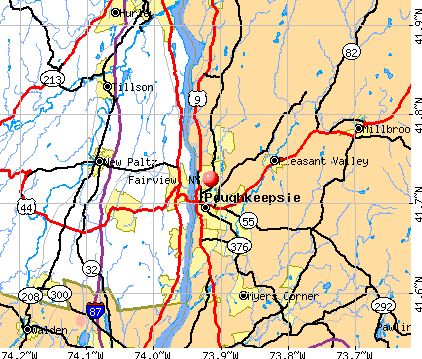
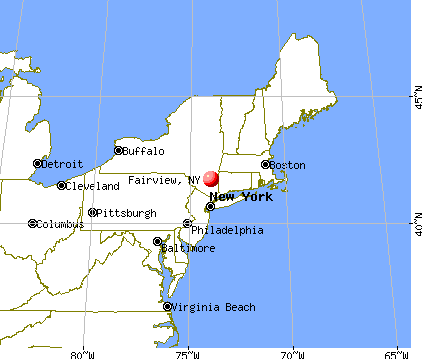
Nearest city with pop. 50,000+: Danbury, CT
Nearest city with pop. 200,000+: Bronx, NY
Nearest cities:
Latitude: 41.73 N, Longitude: 73.91 W
Daytime population change due to commuting: -933 (-13.9%)Workers who live and work in this place: 838 (22.5%)
Area code commonly used in this area: 845
Unemployment in December 2023:
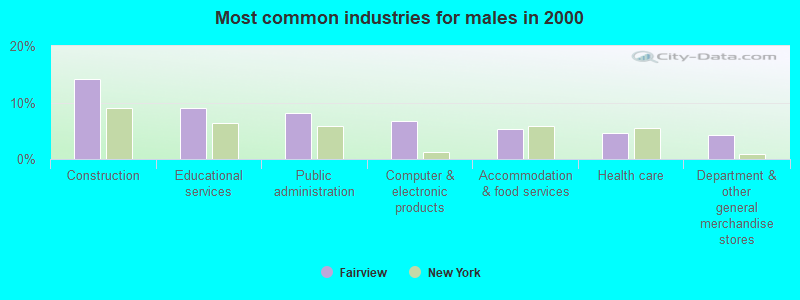
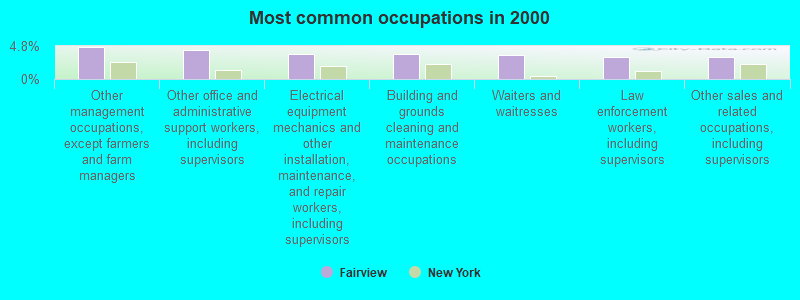
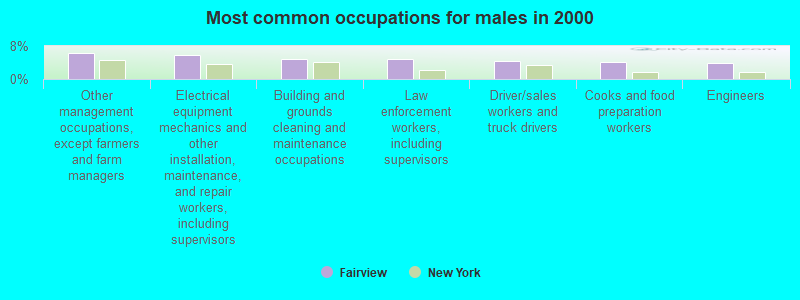
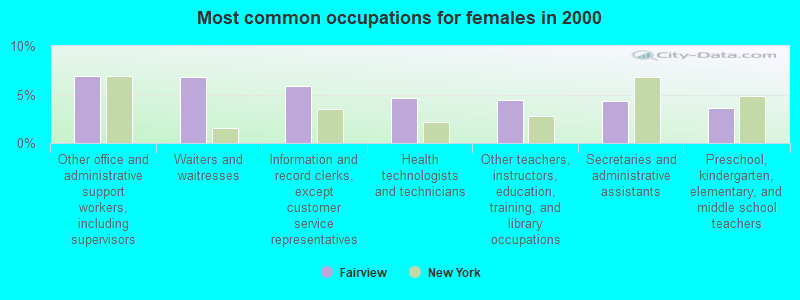
Most common occupations in Fairview, NY (%)
Both Males Females
Other management occupations, except farmers and farm managers (4.6%)
Other office and administrative support workers, including supervisors (4.3%)
Electrical equipment mechanics and other installation, maintenance, and repair workers, including supervisors (3.6%)
Building and grounds cleaning and maintenance occupations (3.6%)
Waiters and waitresses (3.4%)
Law enforcement workers, including supervisors (3.2%)
Other sales and related occupations, including supervisors (3.1%)
Other management occupations, except farmers and farm managers (6.4%)
Electrical equipment mechanics and other installation, maintenance, and repair workers, including supervisors (5.8%)
Building and grounds cleaning and maintenance occupations (4.9%)
Law enforcement workers, including supervisors (4.8%)
Driver/sales workers and truck drivers (4.5%)
Cooks and food preparation workers (4.1%)
Engineers (3.9%)
Other office and administrative support workers, including supervisors (6.9%)
Waiters and waitresses (6.8%)
Information and record clerks, except customer service representatives (5.9%)
Health technologists and technicians (4.6%)
Other teachers, instructors, education, training, and library occupations (4.4%)
Secretaries and administrative assistants (4.3%)
Preschool, kindergarten, elementary, and middle school teachers (3.6%)
Tornado activity:
Fairview-area historical tornado activity is above New York state average. It is 31% smaller than the overall U.S. average.
On 5/29/1995, a category F4 (max. wind speeds 207-260 mph) tornado 41.1 miles away from the Fairview place center killed 3 people and injured 24 people and caused between $5,000,000 and $50,000,000 in damages.
On 7/10/1989, a category F4 tornado 45.5 miles away from the place center injured 20 people and caused between $5,000,000 and $50,000,000 in damages.
Earthquake activity:
Fairview-area historical earthquake activity is significantly above New York state average. It is 68% smaller than the overall U.S. average. On 10/7/1983 at 10:18:46, a magnitude 5.3 (5.1 MB, 5.3 LG, 5.1 ML, Class: Moderate, Intensity: VI - VII) earthquake occurred 155.5 miles away from Fairview center On 4/20/2002 at 10:50:47, a magnitude 5.3 (5.3 ML, Depth: 3.0 mi) earthquake occurred 192.9 miles away from Fairview center On 4/20/2002 at 10:50:47, a magnitude 5.2 (5.2 MB, 4.2 MS, 5.2 MW, 5.0 MW) earthquake occurred 191.1 miles away from the city center On 8/23/2011 at 17:51:04, a magnitude 5.8 (5.8 MW, Depth: 3.7 mi) earthquake occurred 339.6 miles away from the city center On 1/16/1994 at 01:49:16, a magnitude 4.6 (4.6 MB, 4.6 LG, Depth: 3.1 mi, Class: Light, Intensity: IV - V) earthquake occurred 147.0 miles away from Fairview center On 1/19/1982 at 00:14:42, a magnitude 4.7 (4.5 MB, 4.7 MD, 4.5 LG) earthquake occurred 170.0 miles away from the city center Magnitude types: regional Lg-wave magnitude (LG), body-wave magnitude (MB), duration magnitude (MD), local magnitude (ML), surface-wave magnitude (MS), moment magnitude (MW) Natural disasters: The number of natural disasters in Dutchess County (19) is greater than the US average (15).Major Disasters (Presidential) Declared: 12Emergencies Declared: 6Storms: 5, Floods: 4, Hurricanes: 4, Blizzards: 2, Snowstorms: 2, Winter Storms: 2, Power Outage: 1, Water Shortage: 1, Other: 3 (Note: some incidents may be assigned to more than one category). Hospitals and medical centers near Fairview: HOSPICE OF DUTCHESS CNTY HOSPICE OF ULSTER CNTY (Hospital, about 1 miles away; POUGHKEEPSIE, NY)
ST FRANCIS HOSPITAL (about 1 miles away; POUGHKEEPSIE, NY)
HUDSON VALLEY HOME CARE CHHA (Home Health Center, about 2 miles away; POUGHKEEPSIE, NY)
DUTCHESS CO DEPT HEALTH CHHA (Home Health Center, about 2 miles away; POUGHKEEPSIE, NY)
RIVER VALLEY CARE CENTER INC (Nursing Home, about 2 miles away; POUGHKEEPSIE, NY)
GREYSTONE PROGRAMS, INC (Hospital, about 3 miles away; HYDE PARK, NY)
EDEN PARK NH HRF (Nursing Home, about 3 miles away; POUGHKEEPSIE, NY)
Amtrak stations near Fairview: 2 miles: POUGHKEEPSIE (41 MAIN ST.) Services: partially wheelchair accessible, enclosed waiting area, public restrooms, public payphones, snack bar, paid short-term parking, paid long-term parking, call for car rental service, taxi stand, public transit connection.
14 miles: RHINECLIFF-KINGSTON (RHINECLIFF, HUTTON & CHARLES STS.) Services: ticket office, partially wheelchair accessible, enclosed waiting area, public restrooms, public payphones, vending machines, free short-term parking, free long-term parking, call for car rental service, taxi stand.
Colleges/universities with over 2000 students nearest to Fairview:
Dutchess Community College (about 1 miles; Poughkeepsie, NY ; Full-time enrollment: 6,554)
Marist College (about 2 miles; Poughkeepsie, NY ; FT enrollment: 5,536)
Culinary Institute of America (about 2 miles; Hyde Park, NY ; FT enrollment: 3,869)
Vassar College (about 4 miles; Poughkeepsie, NY ; FT enrollment: 2,469)
State University of New York at New Paltz (about 9 miles; New Paltz, NY ; FT enrollment: 7,319)
Ulster County Community College (about 15 miles; Stone Ridge, NY ; FT enrollment: 2,207)
Mount Saint Mary College (about 16 miles; Newburgh, NY ; FT enrollment: 2,166)
Notable locations in Fairview: (A) , Center For Business And Industry (B) , Allyn J Washington Center For Science And Art (C) , Drumlin Hall (D) , Dutchess Hall (E) , Bowne Hall (F) , Hudson Hall (G) , Orcutt Student Services Center (H) , Taconic Hall (I) , Greenspan Day Care Center (J) , Roosevelt Building (K) , Sadlier Nurses Home (L) , Steel Plant Art Studios (M) , Crosswest Office Center (N) , Fairview Fire Department (O) , Pawling Fire District Armenia Fire Company (P) , Dutchess County Emergency Response (Q) , Fairview Fire District (R) . Display/hide their locations on the map
Churches in Fairview include: (A) , Union Baptist Church (B) . Display/hide their locations on the map
Lake: (A) . Display/hide its location on the map
Parks in Fairview include: (1) , Yosemite Park (2) , Fallkill Park (3) . Display/hide their locations on the map
Dutchess County has a predicted average indoor radon screening level greater than 4 pCi/L (pico curies per liter) - Highest Potential Average household size: This place:
2.6 peopleNew York:
2.6 people
Percentage of family households: This place:
61.3%Whole state:
63.5%
Percentage of households with unmarried partners: This place:
8.0%Whole state:
6.8%
Likely homosexual households (counted as self-reported same-sex unmarried-partner households)
Lesbian couples: 0.1% of all households Gay men: 0.4% of all households
People in group quarters in Fairview in 2010:
224 people in state prisons
120 people in mental (psychiatric) hospitals and psychiatric units in other hospitals
120 people in emergency and transitional shelters (with sleeping facilities) for people experiencing homelessness
50 people in group homes intended for adults
46 people in residential treatment centers for juveniles (non-correctional)
41 people in residential treatment centers for adults
15 people in college/university student housing
10 people in other noninstitutional facilities
8 people in group homes for juveniles (non-correctional)
People in group quarters in Fairview in 2000:
277 people in mental (psychiatric) hospitals or wards
50 people in other noninstitutional group quarters
38 people in homes for the mentally ill
36 people in hospitals or wards for drug/alcohol abuse
14 people in religious group quarters
13 people in homes or halfway houses for drug/alcohol abuse
5 people in homes for the mentally retarded
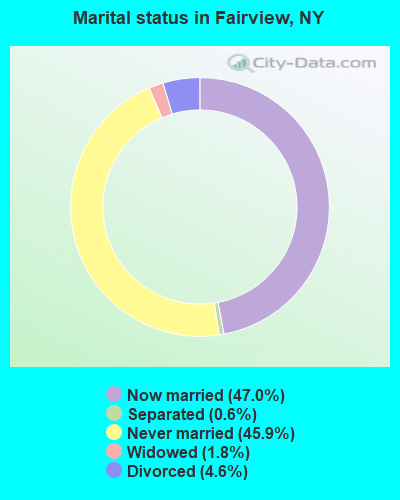
For population 15 years and over in Fairview:
Never married: 45.9%Now married: 47.0%Separated: 0.6%Widowed: 1.8%Divorced: 4.6% For population 25 years and over in Fairview:
High school or higher: 86.6%Bachelor's degree or higher: 22.9%Graduate or professional degree: 9.7%Unemployed: 4.8%Mean travel time to work (commute): 18.8 minutes
Education Gini index (Inequality in education) Here:
11.6New York average:
13.9
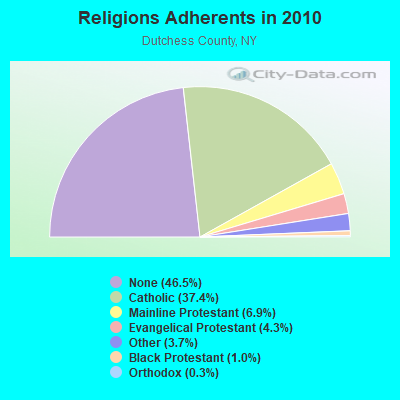
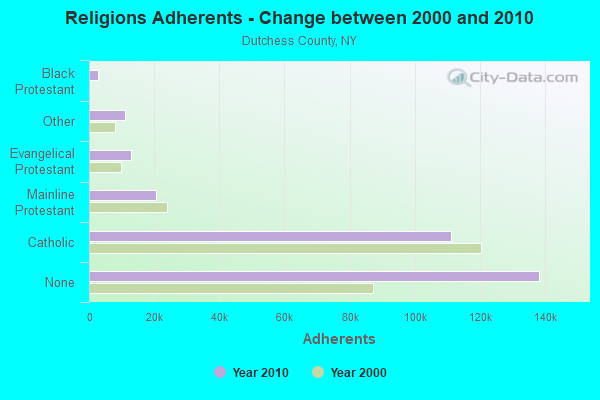
Religion statistics for Fairview, NY (based on Dutchess County data)
Religion Adherents Congregations Catholic 111,112 22 Mainline Protestant 20,556 87 Evangelical Protestant 12,799 69 Other 10,970 28 Black Protestant 2,898 11 Orthodox 854 5 None 138,299 -
Source: Clifford Grammich, Kirk Hadaway, Richard Houseal, Dale E.Jones, Alexei Krindatch, Richie Stanley and Richard H.Taylor. 2012. 2010 U.S.Religion Census: Religious Congregations & Membership Study. Association of Statisticians of American Religious Bodies. Jones, Dale E., et al. 2002. Congregations and Membership in the United States 2000. Nashville, TN: Glenmary Research Center. Graphs represent county-level data
Food Environment Statistics: Number of grocery stores : 100Here :
3.42 / 10,000 pop.State :
4.13 / 10,000 pop.
Number of supercenters and club stores : 3Dutchess County :
0.10 / 10,000 pop.New York :
0.06 / 10,000 pop.
Number of convenience stores (no gas) : 34This county :
1.16 / 10,000 pop.New York :
0.92 / 10,000 pop.
Number of convenience stores (with gas) : 77Here :
2.63 / 10,000 pop.New York :
1.68 / 10,000 pop.
Number of full-service restaurants : 302Dutchess County :
10.33 / 10,000 pop.New York :
8.82 / 10,000 pop.
Adult diabetes rate : This county :
8.1%New York :
8.2%
Low-income preschool obesity rate : Dutchess County :
13.4%State :
15.6%
Health and Nutrition:
Average overall health of teeth and gums : Fairview:
48.9%New York:
48.1%
Average BMI : Fairview:
28.8New York:
28.5
People feeling badly about themselves : People not drinking alcohol at all : This city:
10.2%New York:
11.1%
Average hours sleeping at night : General health condition : This city:
57.5%New York:
56.5%
Average condition of hearing : Fairview:
79.8%State:
80.2%
More about Health and Nutrition of Fairview, NY Residents Strongest AM radio stations in Fairview:
WEOK (1390 AM; 5 kW; POUGHKEEPSIE, NY)
WHVW (950 AM; 0 kW; HYDE PARK, NY; Owner: JOSEPH-PAUL FERRARO)
WKIP (1450 AM; 1 kW; POUGHKEEPSIE, NY; Owner: CLEAR CHANNEL BROADCASTING LICENSES, INC.)
WGHQ (920 AM; 5 kW; KINGSTON, NY; Owner: CLEVELAND RADIO LICENSES, LLC)
WGNY (1220 AM; 10 kW; NEWBURGH, NY; Owner: SUNRISE BROADCASTING LLC)
WFAN (660 AM; 50 kW; NEW YORK, NY; Owner: INFINITY BROADCASTING OPERATIONS, INC.)
WABC (770 AM; 50 kW; NEW YORK, NY; Owner: WABC-AM RADIO, INC.)
WMCA (570 AM; 50 kW; NEW YORK, NY; Owner: SALEM MEDIA OF NEW YORK, LLC)
WNNZ (640 AM; 50 kW; WESTFIELD, MA; Owner: CLEAR CHANNEL BROADCASTING LICENSES, INC.)
WOR (710 AM; 50 kW; NEW YORK, NY; Owner: BUCKLEY BROADCASTING CORPORATION)
WCBS (880 AM; 50 kW; NEW YORK, NY; Owner: INFINITY BROADCASTING OPERATIONS, INC.)
WTIC (1080 AM; 50 kW; HARTFORD, CT; Owner: INFINITY RADIO OPERATIONS INC.)
WINS (1010 AM; 50 kW; NEW YORK, NY; Owner: INFINITY BROADCASTING OPERATIONS, INC.)
Strongest FM radio stations in Fairview:
WPDH (101.5 FM; POUGHKEEPSIE, NY; Owner: CUMULUS LICENSING CORP.)
WFNP (88.7 FM; ROSENDALE, NY; Owner: STATE UNIVERSITY OF NEW YORK)
WRHV (88.7 FM; POUGHKEEPSIE, NY; Owner: WMHT EDUCATIONAL TELECOMMUNICATIONS)
WRRB (96.9 FM; ARLINGTON, NY; Owner: CUMULUS LICENSING CORP.)
WCZX (97.7 FM; HYDE PARK, NY; Owner: CUMULUS LICENSING CORP.)
WPKF (96.1 FM; POUGHKEEPSIE, NY; Owner: CLEAR CHANNEL BROADCASTING LICENSES, INC.)
W292CM (106.3 FM; POUGHKEEPSIE, NY; Owner: JOHN KATONAH)
WBWZ (93.3 FM; NEW PALTZ, NY; Owner: CLEVELAND RADIO LICENSES, LLC)
WRWD-FM (107.3 FM; HIGHLAND, NY; Owner: CLEVELAND RADIO LICENSES, LLC)
WRNQ (92.1 FM; POUGHKEEPSIE, NY; Owner: CLEAR CHANNEL BROADCASTING LICENSES, INC.)
WSPK (104.7 FM; POUGHKEEPSIE, NY; Owner: 6 JOHNSON ROAD LICENSES, INC.)
WFKP (99.3 FM; ELLENVILLE, NY; Owner: CLEAR CHANNEL BROADCASTING LICENSES, INC.)
WBPM (94.3 FM; KINGSTON, NY; Owner: CONCORD MEDIA GROUP, INC.)
WAMK (90.9 FM; KINGSTON, NY; Owner: W A M C)
WFGB (89.7 FM; KINGSTON, NY; Owner: SOUND OF LIFE, INC.)
W206AW (89.1 FM; PAWLING, NY; Owner: SOUND OF LIFE, INC.)
WLJP (89.3 FM; MONROE, NY; Owner: SOUND OF LIFE, INC.)
WQQQ (103.3 FM; SHARON, CT; Owner: THE RIDGEFIELD BROADCASTING CORPORATION)
WDBY (105.5 FM; PATTERSON, NY; Owner: CUMULUS LICENSING CORP.)
WKZE-FM (98.1 FM; SALISBURY, CT; Owner: JOHNSON DEVELOPMENT, INC.)
TV broadcast stations around Fairview:
WTBY (Channel 54; POUGHKEEPSIE, NY; Owner: TRINITY BROADCASTING OF NEW YORK, INC.)
W42AE (Channel 42; POUGHKEEPSIE, NY; Owner: DUTCHESS COMMUNITY COLLEGE)
WTIC-TV (Channel 61; HARTFORD, CT; Owner: TRIBUNE TELEVISION COMPANY)
WRNN-TV (Channel 62; KINGSTON, NY; Owner: WRNN-TV ASSOCIATES LIMITED PARTNERSHIP)
National Bridge Inventory (NBI) Statistics 5 Number of bridges20ft / 6.3m Total length $48,883,000 Total costs71,615 Total average daily traffic1,882 Total average daily truck traffic
FCC Registered Microwave Towers: 5
AL33XC424, 59 Ryan Dr. (Lat: 41.737861 Lon: -73.904944), Type: Mtower, Structure height: 45.7 m, Overall height: 46.6 m, Call Sign: WQQP544, Assigned Frequencies: 11345.0 MHz, 11385.0 MHz, 11345.0 MHz, 11385.0 MHz, 11345.0 MHz, 11385.0 MHz, Grant Date: 04/03/2023, Expiration Date: 02/07/2033, Cancellation Date: 05/15/2023, Certifier: David Werblow, Registrant: T-Mobile Usa, Inc., 12920 Se 38th Street, Bellevue, WA 98006, Phone: (425) 383-8401, Email:
POUGHKPS 911, 392 Creek Rd (Lat: 41.746417 Lon: -73.898278), Type: Ltower, Structure height: 48.8 m, Call Sign: WQYX633, Licensee ID: L00002942, Assigned Frequencies: 10915.0 MHz, 6063.80 MHz, 6093.45 MHz, Grant Date: 02/22/2017, Expiration Date: 02/22/2027, Certifier: Russell Whittaker, Registrant: Dutchess County Emergency Response, 392 Creek Road, Poughkeepsie, NY 12601, Phone: (845) 486-6575, Fax: (845) 486-3998, Email:
GREENBURGH P, 188 Tarrytown Road (Lat: 41.041278 Lon: -73.788611), Type: Building, Structure height: 9.2 m, Overall height: 15.2 m, Call Sign: WRCW397, Assigned Frequencies: 19560.0 MHz, 19560.0 MHz, 19560.0 MHz, 19560.0 MHz, 19560.0 MHz, 19560.0 MHz, Grant Date: 02/12/2019, Expiration Date: 02/12/2029, Certifier: Michael Grieco, Registrant: Ess, Inc, 141 River Rd #6, Nutley, NJ 07007, Phone: (856) 764-3809, Email:
FAIRVIEW FIR, 19 Rosemont Blvd (Lat: 41.042444 Lon: -73.792583), Type: Mtower, Structure height: 35.1 m, Overall height: 38.1 m, Call Sign: WRCW399, Assigned Frequencies: 18000.0 MHz, 17840.0 MHz, 18000.0 MHz, 17840.0 MHz, 18000.0 MHz, 17840.0 MHz, 18000.0 MHz, 17840.0 MHz, 18000.0 MHz, 17840.0 MHz, 18000.0 MHz, 17840.0 MHz, Grant Date: 02/12/2019, Expiration Date: 02/12/2029, Certifier: Michael Grieco, Registrant: Ess, Inc, 141 River Rd #6, Nutley, NJ 07007, Phone: (856) 764-3809, Email:
INWOOD AVE, 65 Inwood Ave (Lat: 41.728500 Lon: -73.917972), Type: Mast, Structure height: 29.6 m, Call Sign: WRED381, Licensee ID: L00090286, Assigned Frequencies: 6019.32 MHz, 6019.32 MHz, 6019.32 MHz, 6019.32 MHz, 6019.32 MHz, 6212.06 MHz, 6212.06 MHz, 6212.06 MHz, 6212.06 MHz, 6212.06 MHz, Grant Date: 09/24/2019, Expiration Date: 09/24/2029, Certifier: Tera L Stoner, Registrant: Central Hudson Gas & Electric Corp., 284 South Avenue, Poughkeepsie, NY 12601, Phone: (845) 486-5464, Email:
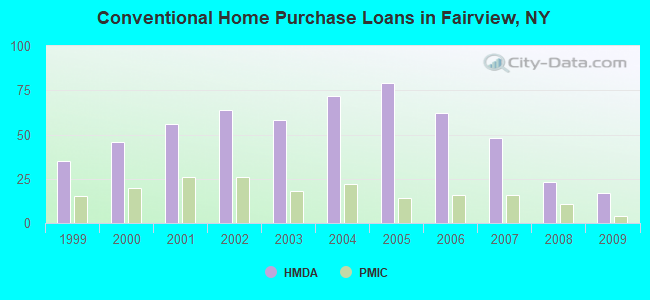
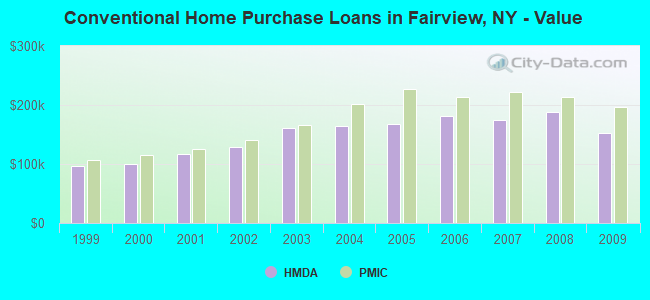
Home Mortgage Disclosure Act Aggregated Statistics For Year 2009(Based on 2 partial tracts) A) FHA, FSA/RHS & VA B) Conventional C) Refinancings D) Home Improvement Loans F) Non-occupant Loans on G) Loans On Manufactured Number Average Value Number Average Value Number Average Value Number Average Value Number Average Value Number Average Value
LOANS ORIGINATED 13 $183,949 17 $152,569 48 $167,676 6 $42,687 5 $172,784 1 $26,430 APPLICATIONS APPROVED, NOT ACCEPTED 0 $0 2 $158,775 3 $184,090 0 $0 1 $303,530 0 $0 APPLICATIONS DENIED 3 $164,477 3 $109,503 26 $186,979 4 $54,372 4 $157,498 1 $30,180 APPLICATIONS WITHDRAWN 0 $0 4 $86,560 20 $174,420 0 $0 2 $159,540 1 $13,590 FILES CLOSED FOR INCOMPLETENESS 0 $0 0 $0 3 $212,537 0 $0 2 $208,940 0 $0
Aggregated Statistics For Year 2008(Based on 2 partial tracts) A) FHA, FSA/RHS & VA B) Conventional C) Refinancings D) Home Improvement Loans F) Non-occupant Loans on G) Loans On Manufactured Number Average Value Number Average Value Number Average Value Number Average Value Number Average Value Number Average Value
LOANS ORIGINATED 4 $225,250 23 $188,387 38 $165,293 9 $65,173 6 $206,705 0 $0 APPLICATIONS APPROVED, NOT ACCEPTED 1 $305,510 2 $124,025 7 $199,930 1 $19,630 0 $0 0 $0 APPLICATIONS DENIED 0 $0 3 $190,813 32 $199,799 9 $63,164 4 $165,315 2 $65,960 APPLICATIONS WITHDRAWN 2 $136,355 3 $251,270 15 $173,395 3 $64,457 2 $175,250 0 $0 FILES CLOSED FOR INCOMPLETENESS 2 $228,795 1 $149,510 4 $153,692 0 $0 0 $0 0 $0
Aggregated Statistics For Year 2007(Based on 2 partial tracts) A) FHA, FSA/RHS & VA B) Conventional C) Refinancings D) Home Improvement Loans F) Non-occupant Loans on G) Loans On Manufactured Number Average Value Number Average Value Number Average Value Number Average Value Number Average Value Number Average Value
LOANS ORIGINATED 3 $185,217 48 $173,786 69 $166,165 18 $47,258 7 $177,673 1 $47,850 APPLICATIONS APPROVED, NOT ACCEPTED 1 $156,310 16 $168,784 11 $208,887 3 $27,270 5 $133,392 1 $83,060 APPLICATIONS DENIED 1 $277,480 17 $163,086 69 $211,270 9 $57,067 5 $211,966 1 $25,600 APPLICATIONS WITHDRAWN 1 $199,350 18 $204,669 30 $191,024 4 $94,228 2 $226,430 0 $0 FILES CLOSED FOR INCOMPLETENESS 0 $0 1 $75,510 14 $242,157 0 $0 0 $0 0 $0
Aggregated Statistics For Year 2006(Based on 2 partial tracts) A) FHA, FSA/RHS & VA B) Conventional C) Refinancings D) Home Improvement Loans E) Loans on Dwellings For 5+ Families F) Non-occupant Loans on G) Loans On Manufactured Number Average Value Number Average Value Number Average Value Number Average Value Number Average Value Number Average Value Number Average Value
LOANS ORIGINATED 1 $228,300 62 $181,325 88 $164,461 32 $57,997 1 $605,190 12 $186,742 0 $0 APPLICATIONS APPROVED, NOT ACCEPTED 0 $0 11 $149,859 15 $160,291 2 $113,295 0 $0 1 $135,160 0 $0 APPLICATIONS DENIED 0 $0 18 $173,967 74 $196,564 14 $44,120 0 $0 3 $192,327 2 $57,385 APPLICATIONS WITHDRAWN 2 $163,855 11 $188,515 38 $194,899 8 $80,211 0 $0 4 $253,752 1 $30,200 FILES CLOSED FOR INCOMPLETENESS 0 $0 4 $120,995 11 $246,095 0 $0 0 $0 0 $0 0 $0
Aggregated Statistics For Year 2005(Based on 2 partial tracts) A) FHA, FSA/RHS & VA B) Conventional C) Refinancings D) Home Improvement Loans F) Non-occupant Loans on G) Loans On Manufactured Number Average Value Number Average Value Number Average Value Number Average Value Number Average Value Number Average Value
LOANS ORIGINATED 1 $145,730 79 $167,946 111 $172,111 35 $51,072 13 $186,108 0 $0 APPLICATIONS APPROVED, NOT ACCEPTED 0 $0 12 $158,388 21 $158,801 3 $70,987 1 $56,080 0 $0 APPLICATIONS DENIED 1 $181,220 20 $142,722 68 $173,597 19 $84,351 9 $154,090 1 $118,550 APPLICATIONS WITHDRAWN 0 $0 11 $182,449 56 $160,978 15 $101,407 4 $163,715 0 $0 FILES CLOSED FOR INCOMPLETENESS 0 $0 5 $150,770 30 $173,167 0 $0 2 $140,825 0 $0
Aggregated Statistics For Year 2004(Based on 2 partial tracts) A) FHA, FSA/RHS & VA B) Conventional C) Refinancings D) Home Improvement Loans E) Loans on Dwellings For 5+ Families F) Non-occupant Loans on G) Loans On Manufactured Number Average Value Number Average Value Number Average Value Number Average Value Number Average Value Number Average Value Number Average Value
LOANS ORIGINATED 6 $215,017 72 $164,296 120 $144,640 33 $52,086 1 $302,040 13 $153,153 3 $75,087 APPLICATIONS APPROVED, NOT ACCEPTED 0 $0 15 $154,055 23 $137,468 7 $44,281 0 $0 3 $127,227 2 $35,110 APPLICATIONS DENIED 1 $212,500 19 $161,553 73 $150,251 28 $55,087 0 $0 2 $180,040 5 $44,332 APPLICATIONS WITHDRAWN 1 $155,550 10 $201,052 59 $133,408 11 $69,539 0 $0 3 $113,583 2 $68,920 FILES CLOSED FOR INCOMPLETENESS 0 $0 5 $149,686 33 $164,174 1 $76,200 0 $0 1 $96,860 0 $0
Aggregated Statistics For Year 2003(Based on 2 partial tracts) A) FHA, FSA/RHS & VA B) Conventional C) Refinancings D) Home Improvement Loans F) Non-occupant Loans on Number Average Value Number Average Value Number Average Value Number Average Value Number Average Value
LOANS ORIGINATED 4 $179,908 58 $161,640 262 $115,595 22 $29,410 15 $115,001 APPLICATIONS APPROVED, NOT ACCEPTED 1 $172,160 8 $178,556 54 $125,403 3 $35,297 5 $157,664 APPLICATIONS DENIED 1 $160,080 16 $136,831 96 $122,804 18 $29,418 5 $125,554 APPLICATIONS WITHDRAWN 0 $0 11 $174,960 59 $121,418 7 $68,663 2 $86,610 FILES CLOSED FOR INCOMPLETENESS 0 $0 3 $181,810 8 $139,431 2 $32,090 1 $80,470
Aggregated Statistics For Year 2002(Based on 2 partial tracts) A) FHA, FSA/RHS & VA B) Conventional C) Refinancings D) Home Improvement Loans E) Loans on Dwellings For 5+ Families F) Non-occupant Loans on Number Average Value Number Average Value Number Average Value Number Average Value Number Average Value Number Average Value
LOANS ORIGINATED 8 $126,339 64 $128,799 169 $100,274 9 $23,450 0 $0 5 $85,928 APPLICATIONS APPROVED, NOT ACCEPTED 2 $101,940 12 $110,348 35 $94,848 4 $21,710 0 $0 2 $88,675 APPLICATIONS DENIED 0 $0 15 $93,166 76 $97,146 7 $15,471 1 $324,000 2 $141,760 APPLICATIONS WITHDRAWN 1 $157,590 12 $134,748 61 $113,199 5 $32,930 0 $0 2 $103,680 FILES CLOSED FOR INCOMPLETENESS 0 $0 3 $130,633 16 $106,538 2 $37,445 0 $0 0 $0
Aggregated Statistics For Year 2001(Based on 2 partial tracts) A) FHA, FSA/RHS & VA B) Conventional C) Refinancings D) Home Improvement Loans F) Non-occupant Loans on Number Average Value Number Average Value Number Average Value Number Average Value Number Average Value
LOANS ORIGINATED 10 $133,361 56 $117,097 85 $88,115 18 $24,132 5 $101,414 APPLICATIONS APPROVED, NOT ACCEPTED 1 $81,990 5 $88,326 12 $74,663 2 $29,165 0 $0 APPLICATIONS DENIED 2 $113,705 13 $114,032 40 $78,688 10 $15,192 3 $92,440 APPLICATIONS WITHDRAWN 1 $73,760 8 $128,891 42 $101,849 5 $20,498 0 $0 FILES CLOSED FOR INCOMPLETENESS 1 $98,920 1 $133,260 11 $128,855 0 $0 0 $0
Aggregated Statistics For Year 2000(Based on 2 partial tracts) A) FHA, FSA/RHS & VA B) Conventional C) Refinancings D) Home Improvement Loans F) Non-occupant Loans on Number Average Value Number Average Value Number Average Value Number Average Value Number Average Value
LOANS ORIGINATED 13 $116,873 46 $99,461 28 $62,624 9 $14,932 5 $78,448 APPLICATIONS APPROVED, NOT ACCEPTED 2 $94,170 8 $95,214 5 $76,880 6 $28,138 0 $0 APPLICATIONS DENIED 2 $110,325 15 $97,001 19 $67,594 15 $29,492 0 $0 APPLICATIONS WITHDRAWN 3 $136,073 3 $146,433 16 $57,178 0 $0 0 $0 FILES CLOSED FOR INCOMPLETENESS 0 $0 1 $255,000 11 $105,516 0 $0 2 $56,635
Aggregated Statistics For Year 1999(Based on 3 partial tracts) A) FHA, FSA/RHS & VA B) Conventional C) Refinancings D) Home Improvement Loans F) Non-occupant Loans on Number Average Value Number Average Value Number Average Value Number Average Value Number Average Value
LOANS ORIGINATED 17 $97,071 35 $96,755 31 $84,902 9 $27,431 3 $145,767 APPLICATIONS APPROVED, NOT ACCEPTED 1 $131,930 7 $105,730 10 $56,884 3 $11,953 2 $48,635 APPLICATIONS DENIED 0 $0 10 $75,918 26 $64,369 11 $12,734 0 $0 APPLICATIONS WITHDRAWN 2 $118,035 5 $101,096 23 $77,477 1 $128,420 1 $126,180 FILES CLOSED FOR INCOMPLETENESS 0 $0 2 $56,010 9 $104,688 0 $0 1 $78,860
Detailed HMDA statistics for the following Tracts:
0704.00
, 1401.00
Private Mortgage Insurance Companies Aggregated Statistics For Year 2009(Based on 2 partial tracts) A) Conventional B) Refinancings Number Average Value Number Average Value
LOANS ORIGINATED 4 $196,525 3 $240,323 APPLICATIONS APPROVED, NOT ACCEPTED 0 $0 3 $231,530 APPLICATIONS DENIED 1 $180,750 1 $258,240 APPLICATIONS WITHDRAWN 1 $82,600 0 $0 FILES CLOSED FOR INCOMPLETENESS 0 $0 0 $0
Aggregated Statistics For Year 2008(Based on 2 partial tracts) A) Conventional B) Refinancings C) Non-occupant Loans on Number Average Value Number Average Value Number Average Value
LOANS ORIGINATED 11 $213,167 5 $232,008 1 $166,880 APPLICATIONS APPROVED, NOT ACCEPTED 2 $232,725 3 $281,193 0 $0 APPLICATIONS DENIED 1 $177,520 0 $0 0 $0 APPLICATIONS WITHDRAWN 2 $252,290 0 $0 0 $0 FILES CLOSED FOR INCOMPLETENESS 0 $0 0 $0 0 $0
Aggregated Statistics For Year 2007(Based on 2 partial tracts) A) Conventional B) Refinancings C) Non-occupant Loans on Number Average Value Number Average Value Number Average Value
LOANS ORIGINATED 16 $221,661 8 $219,628 1 $160,080 APPLICATIONS APPROVED, NOT ACCEPTED 5 $217,318 3 $272,843 2 $203,875 APPLICATIONS DENIED 0 $0 2 $268,815 1 $152,530 APPLICATIONS WITHDRAWN 3 $196,977 1 $152,530 0 $0 FILES CLOSED FOR INCOMPLETENESS 0 $0 0 $0 0 $0
Aggregated Statistics For Year 2006(Based on 2 partial tracts) A) Conventional B) Refinancings C) Non-occupant Loans on Number Average Value Number Average Value Number Average Value
LOANS ORIGINATED 16 $213,178 3 $244,227 1 $72,540 APPLICATIONS APPROVED, NOT ACCEPTED 2 $223,340 3 $229,397 0 $0 APPLICATIONS DENIED 1 $261,860 1 $188,020 0 $0 APPLICATIONS WITHDRAWN 0 $0 0 $0 0 $0 FILES CLOSED FOR INCOMPLETENESS 0 $0 0 $0 0 $0
Aggregated Statistics For Year 2005(Based on 2 partial tracts) A) Conventional B) Refinancings C) Non-occupant Loans on Number Average Value Number Average Value Number Average Value
LOANS ORIGINATED 14 $226,492 4 $258,650 3 $220,237 APPLICATIONS APPROVED, NOT ACCEPTED 2 $243,500 1 $190,170 0 $0 APPLICATIONS DENIED 0 $0 0 $0 0 $0 APPLICATIONS WITHDRAWN 1 $106,680 1 $234,730 0 $0 FILES CLOSED FOR INCOMPLETENESS 0 $0 0 $0 0 $0
Aggregated Statistics For Year 2004(Based on 2 partial tracts) A) Conventional B) Refinancings C) Non-occupant Loans on Number Average Value Number Average Value Number Average Value
LOANS ORIGINATED 22 $201,040 7 $198,306 2 $237,480 APPLICATIONS APPROVED, NOT ACCEPTED 6 $181,223 1 $184,990 1 $178,310 APPLICATIONS DENIED 0 $0 0 $0 0 $0 APPLICATIONS WITHDRAWN 0 $0 0 $0 0 $0 FILES CLOSED FOR INCOMPLETENESS 0 $0 0 $0 0 $0
Aggregated Statistics For Year 2003(Based on 2 partial tracts) A) Conventional B) Refinancings C) Non-occupant Loans on Number Average Value Number Average Value Number Average Value
LOANS ORIGINATED 18 $166,647 13 $140,749 1 $236,400 APPLICATIONS APPROVED, NOT ACCEPTED 3 $132,663 4 $169,655 0 $0 APPLICATIONS DENIED 0 $0 0 $0 0 $0 APPLICATIONS WITHDRAWN 2 $209,050 0 $0 0 $0 FILES CLOSED FOR INCOMPLETENESS 0 $0 0 $0 0 $0
Aggregated Statistics For Year 2002(Based on 2 partial tracts) A) Conventional B) Refinancings C) Non-occupant Loans on Number Average Value Number Average Value Number Average Value
LOANS ORIGINATED 26 $141,189 10 $141,457 0 $0 APPLICATIONS APPROVED, NOT ACCEPTED 6 $113,830 2 $175,035 0 $0 APPLICATIONS DENIED 0 $0 1 $120,820 0 $0 APPLICATIONS WITHDRAWN 1 $105,710 0 $0 1 $105,710 FILES CLOSED FOR INCOMPLETENESS 0 $0 0 $0 0 $0
Aggregated Statistics For Year 2001(Based on 2 partial tracts) A) Conventional B) Refinancings C) Non-occupant Loans on Number Average Value Number Average Value Number Average Value
LOANS ORIGINATED 26 $124,858 7 $138,026 1 $75,900 APPLICATIONS APPROVED, NOT ACCEPTED 5 $115,426 3 $140,433 0 $0 APPLICATIONS DENIED 0 $0 0 $0 0 $0 APPLICATIONS WITHDRAWN 1 $101,940 0 $0 0 $0 FILES CLOSED FOR INCOMPLETENESS 0 $0 0 $0 0 $0
Aggregated Statistics For Year 2000(Based on 2 partial tracts) A) Conventional B) Refinancings C) Non-occupant Loans on Number Average Value Number Average Value Number Average Value
LOANS ORIGINATED 20 $114,921 1 $179,620 2 $81,135 APPLICATIONS APPROVED, NOT ACCEPTED 3 $117,340 0 $0 0 $0 APPLICATIONS DENIED 2 $93,865 0 $0 0 $0 APPLICATIONS WITHDRAWN 0 $0 0 $0 0 $0 FILES CLOSED FOR INCOMPLETENESS 1 $78,530 0 $0 0 $0
Aggregated Statistics For Year 1999(Based on 3 partial tracts) A) Conventional B) Refinancings C) Non-occupant Loans on Number Average Value Number Average Value Number Average Value
LOANS ORIGINATED 15 $106,053 2 $102,770 1 $26,290 APPLICATIONS APPROVED, NOT ACCEPTED 2 $125,900 0 $0 0 $0 APPLICATIONS DENIED 1 $68,350 0 $0 0 $0 APPLICATIONS WITHDRAWN 0 $0 0 $0 0 $0 FILES CLOSED FOR INCOMPLETENESS 0 $0 0 $0 0 $0
Detailed PMIC statistics for the following Tracts:
0704.00
, 1401.00 Fairview compared to New York state average:
Unemployed percentage significantly below state average. Black race population percentage above state average. Median age below state average. Renting percentage below state average. Length of stay since moving in above state average. Institutionalized population percentage significantly above state average. Number of college students above state average.
#9 on the list of "Top 101 cities with the largest percentage of people in mental (psychiatric) hospitals or wards (population 1,000+)"
#13 on the list of "Top 101 cities with the most residents born in Jordan (population 500+)"
#33 on the list of "Top 101 cities with the largest percentage of people in hospitals or wards for drug/alcohol abuse (population 1,000+)"
#47 on the list of "Top 101 cities with the most people taking a taxi to work (population 5,000+)"
#90 on the list of "Top 101 cities with the largest percentage of people in homes for the mentally ill (population 1,000+)"
#3 on the list of "Top 101 counties with the largest decrease in the number of infant deaths per 1000 residents 2000-2006 to 2007-2013 (pop. 50,000+)"
#4 on the list of "Top 101 counties with the lowest number of infant deaths per 1000 residents 2007-2013 (pop. 50,000+)"
#28 on the list of "Top 101 counties with the lowest number of births per 1000 residents 2007-2013"
#49 on the list of "Top 101 counties with the largest decrease in the number of births per 1000 residents 2000-2006 to 2007-2013 (pop 50,000+)"


 Recent articles from our blog. Our writers, many of them Ph.D. graduates or candidates, create easy-to-read articles on a wide variety of topics.

 (32.5 miles