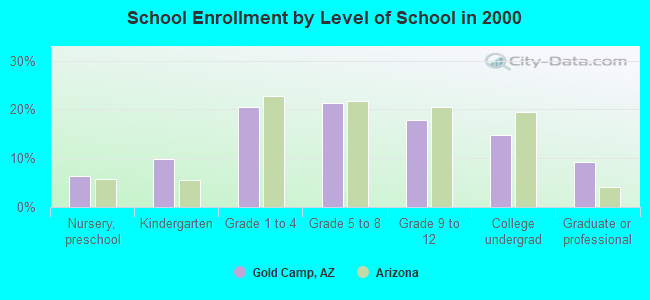
Gold Camp, Arizona
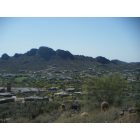
Submit your own pictures of this place and show them to the world
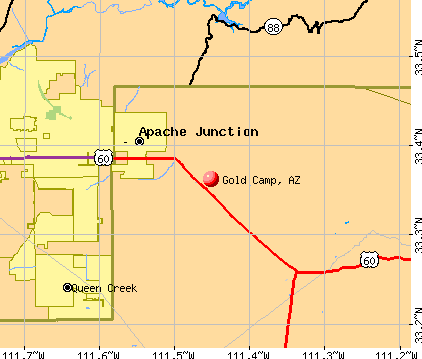
- OSM Map
- General Map
- Google Map
- MSN Map
Population change since 2000: +68.5%
| Males: 4,886 | |
| Females: 5,273 |
| Median resident age: | 60.9 years |
| Arizona median age: | 33.8 years |
Zip codes: 85219.
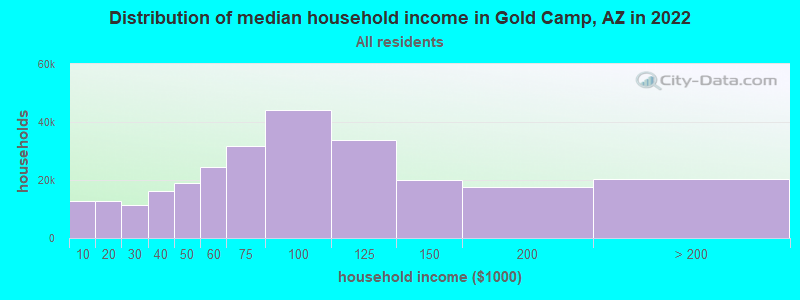
| Gold Camp: | $122,918 |
| AZ: | $74,568 |
Estimated per capita income in 2022: $77,594 (it was $35,010 in 2000)
Gold Camp CDP income, earnings, and wages data
Estimated median house or condo value in 2022: $752,312 (it was $158,000 in 2000)
| Gold Camp: | $752,312 |
| AZ: | $402,800 |
Mean prices in 2022: all housing units: $359,674; detached houses: $401,295; townhouses or other attached units: $377,545; in 3-to-4-unit structures: $156,793; in 5-or-more-unit structures: $149,086; mobile homes: $148,281; occupied boats, rvs, vans, etc.: $144,602
Detailed information about poverty and poor residents in Gold Camp, AZ


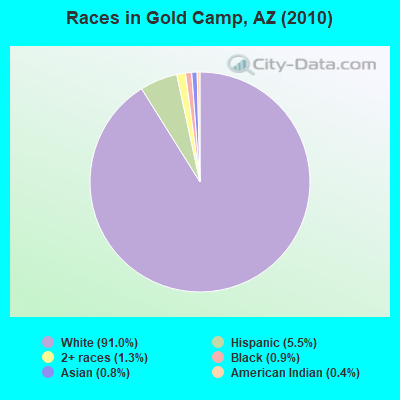
- 9,24391.0%White alone
- 5605.5%Hispanic
- 1281.3%Two or more races
- 940.9%Black alone
- 820.8%Asian alone
- 380.4%American Indian alone
- 70.07%Native Hawaiian and Other
Pacific Islander alone - 70.07%Other race alone
 Recent articles from our blog. Our writers, many of them Ph.D. graduates or candidates, create easy-to-read articles on a wide variety of topics.

 | Where EXACTLY is Gold camp? (1 reply) |
| Best boat trip in the Apache trail lakes? (17 replies) |
| One Day in Phoenix (18 replies) |
| relocate or not to apache junction? (4 replies) |
Latest news from Gold Camp, AZ collected exclusively by city-data.com from local newspapers, TV, and radio stations
Ancestries: German (23.2%), English (16.0%), Irish (10.7%), French (5.0%), Scottish (4.9%), United States (4.9%).
Current Local Time: MST (no DST) time zone
Elevation: 4898 feet
Land area: 22.3 square miles.
Population density: 455 people per square mile (low).
117 residents are foreign born
| This place: | 1.9% |
| Arizona: | 12.8% |
| Gold Camp CDP: | 0.9% ($1,460) |
| Arizona: | 0.9% ($962) |
Nearest city with pop. 50,000+: North Pinal, AZ (3.4 miles  , pop. 59,965).
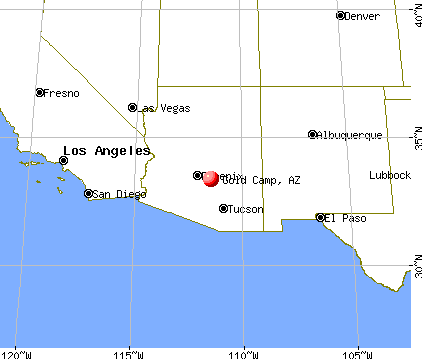
Nearest city with pop. 200,000+: Mesa, AZ (17.4 miles , pop. 396,375).
Nearest city with pop. 1,000,000+: Phoenix, AZ (37.8 miles , pop. 1,321,045).
Nearest cities:
), ), Latitude: 33.36 N, Longitude: 111.45 W
Area code commonly used in this area: 520
| Here: | 4.0% |
| Arizona: | 3.8% |
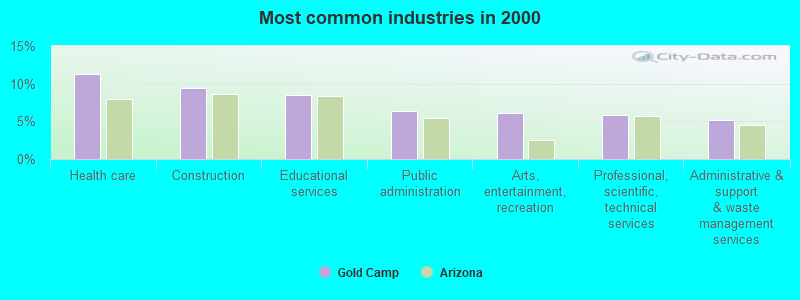
- Health care (11.3%)
- Construction (9.4%)
- Educational services (8.5%)
- Public administration (6.4%)
- Arts, entertainment, recreation (6.1%)
- Professional, scientific, technical services (5.9%)
- Administrative & support & waste management services (5.1%)
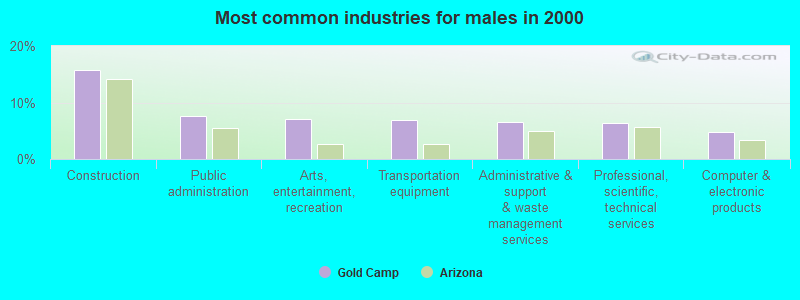
- Construction (15.8%)
- Public administration (7.7%)
- Arts, entertainment, recreation (7.1%)
- Transportation equipment (7.0%)
- Administrative & support & waste management services (6.6%)
- Professional, scientific, technical services (6.4%)
- Computer & electronic products (4.8%)
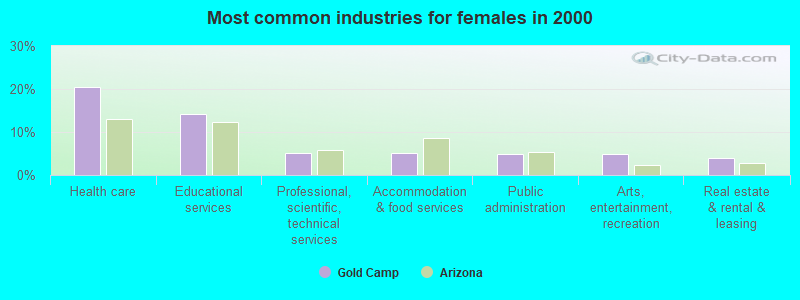
- Health care (20.5%)
- Educational services (14.1%)
- Professional, scientific, technical services (5.2%)
- Accommodation & food services (5.1%)
- Public administration (4.9%)
- Arts, entertainment, recreation (4.8%)
- Real estate & rental & leasing (3.9%)
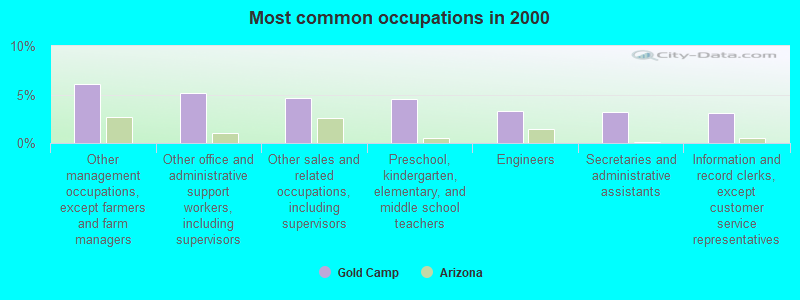
- Other management occupations, except farmers and farm managers (6.1%)
- Other office and administrative support workers, including supervisors (5.2%)
- Other sales and related occupations, including supervisors (4.7%)
- Preschool, kindergarten, elementary, and middle school teachers (4.5%)
- Engineers (3.3%)
- Secretaries and administrative assistants (3.2%)
- Information and record clerks, except customer service representatives (3.1%)
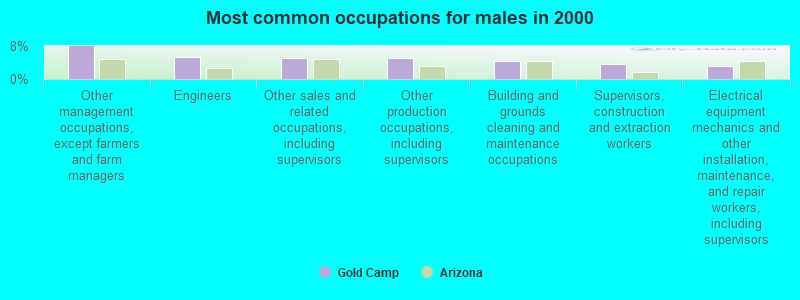
- Other management occupations, except farmers and farm managers (8.0%)
- Engineers (5.4%)
- Other sales and related occupations, including supervisors (5.1%)
- Other production occupations, including supervisors (5.0%)
- Building and grounds cleaning and maintenance occupations (4.3%)
- Supervisors, construction and extraction workers (3.6%)
- Electrical equipment mechanics and other installation, maintenance, and repair workers, including supervisors (3.2%)
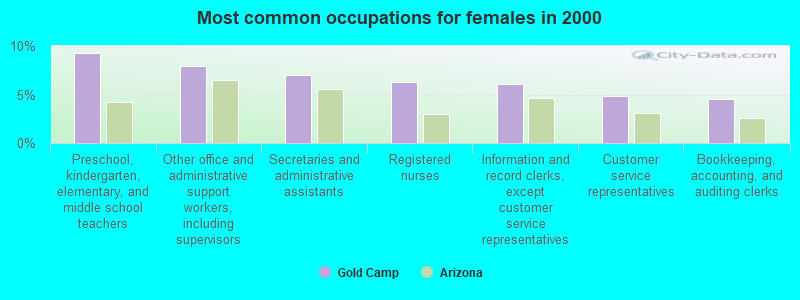
- Preschool, kindergarten, elementary, and middle school teachers (9.3%)
- Other office and administrative support workers, including supervisors (7.9%)
- Secretaries and administrative assistants (7.1%)
- Registered nurses (6.3%)
- Information and record clerks, except customer service representatives (6.1%)
- Customer service representatives (4.8%)
- Bookkeeping, accounting, and auditing clerks (4.5%)
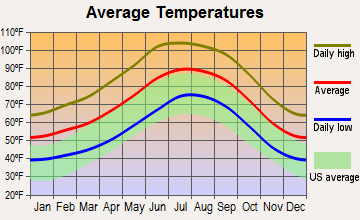
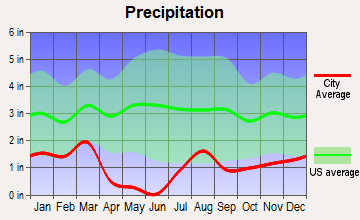
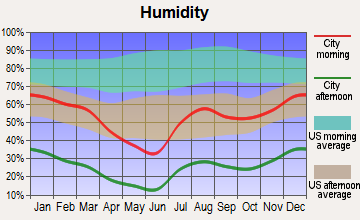
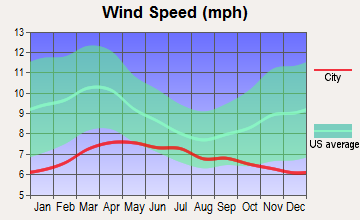
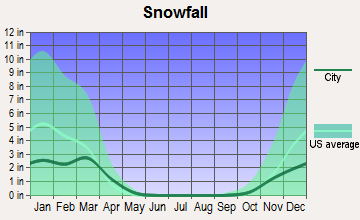
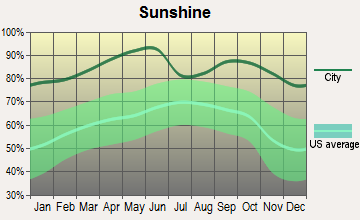
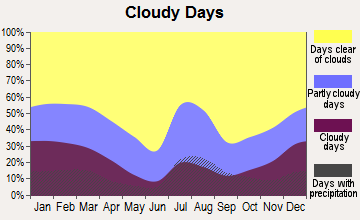
Average climate in Gold Camp, Arizona
Based on data reported by over 4,000 weather stations
(lower is better)
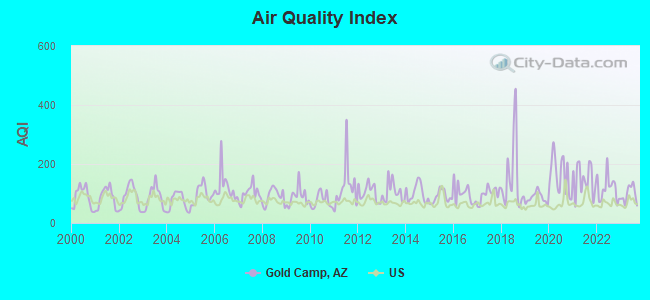
Air Quality Index (AQI) level in 2023 was 97.4. This is worse than average.
| City: | 97.4 |
| U.S.: | 72.6 |
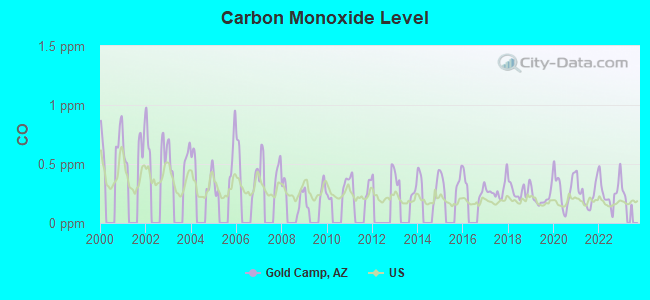
Carbon Monoxide (CO) [ppm] level in 2022 was 0.263. This is about average. Closest monitor was 18.4 miles away from the city center.
| City: | 0.263 |
| U.S.: | 0.251 |
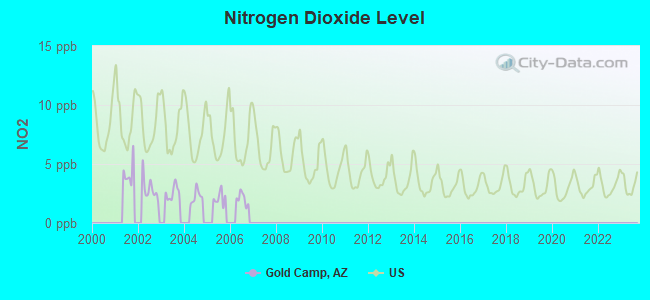
Nitrogen Dioxide (NO2) [ppb] level in 2006 was 2.06. This is significantly better than average. Closest monitor was 10.7 miles away from the city center.
| City: | 2.06 |
| U.S.: | 5.11 |
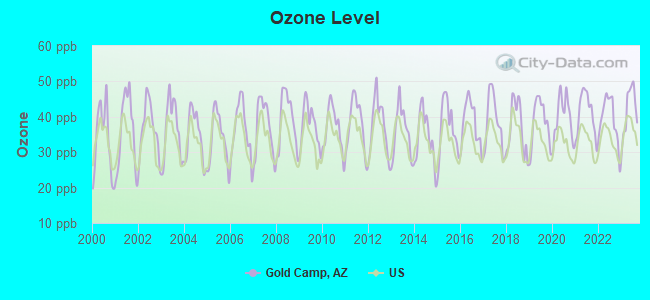
Ozone [ppb] level in 2023 was 41.8. This is worse than average. Closest monitor was 6.7 miles away from the city center.
| City: | 41.8 |
| U.S.: | 33.3 |
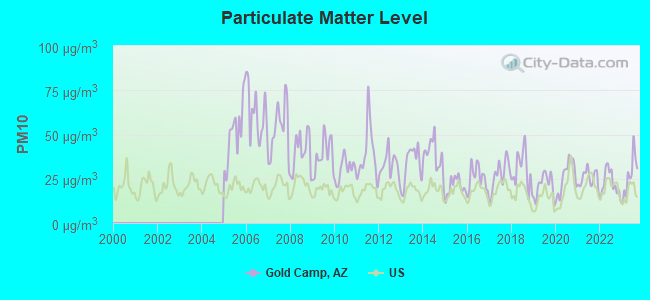
Particulate Matter (PM10) [µg/m3] level in 2023 was 26.9. This is significantly worse than average. Closest monitor was 5.1 miles away from the city center.
| City: | 26.9 |
| U.S.: | 19.2 |
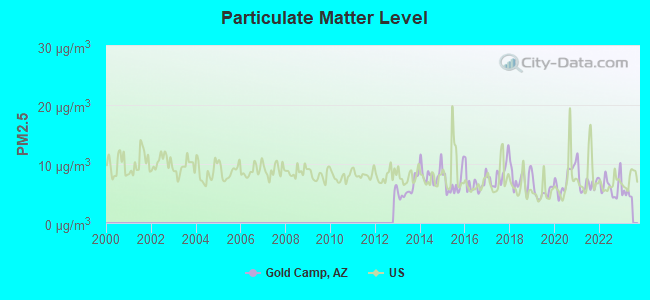
Particulate Matter (PM2.5) [µg/m3] level in 2022 was 6.38. This is better than average. Closest monitor was 5.1 miles away from the city center.
| City: | 6.38 |
| U.S.: | 8.11 |
Earthquake activity:
Gold Camp-area historical earthquake activity is significantly above Arizona state average. It is 2058% greater than the overall U.S. average.On 6/28/1992 at 11:57:34, a magnitude 7.6 (6.2 MB, 7.6 MS, 7.3 MW, Depth: 0.7 mi, Class: Major, Intensity: VIII - XII) earthquake occurred 297.5 miles away from Gold Camp center, causing 3 deaths (1 shaking deaths, 2 other deaths) and 400 injuries, causing $100,000,000 total damage and $40,000,000 insured losses
On 5/19/1940 at 04:36:40, a magnitude 7.2 (7.2 UK) earthquake occurred 245.6 miles away from Gold Camp center, causing $33,000,000 total damage
On 10/16/1999 at 09:46:44, a magnitude 7.4 (6.3 MB, 7.4 MS, 7.2 MW, 7.3 ML) earthquake occurred 296.8 miles away from the city center
On 12/31/1934 at 18:45:56, a magnitude 7.1 (7.1 UK) earthquake occurred 254.2 miles away from Gold Camp center
On 10/15/1979 at 23:16:54, a magnitude 7.0 (5.7 MB, 6.9 MS, 7.0 ML, 6.4 MW) earthquake occurred 245.6 miles away from the city center
On 7/21/1952 at 11:52:14, a magnitude 7.7 (7.7 UK) earthquake occurred 446.4 miles away from Gold Camp center, causing $50,000,000 total damage
Magnitude types: body-wave magnitude (MB), local magnitude (ML), surface-wave magnitude (MS), moment magnitude (MW)
Natural disasters:
The number of natural disasters in Pinal County (15) is near the US average (15).Major Disasters (Presidential) Declared: 9
Emergencies Declared: 2
Causes of natural disasters: Floods: 9, Storms: 8, Fires: 3, Drought: 1, Hurricane: 1, Tornado: 1, Other: 1 (Note: some incidents may be assigned to more than one category).
Hospitals and medical centers near Gold Camp:
- APACHE JUNCTION HLTH CENTER (Nursing Home, about 8 miles away; APACHE JUNCTION, AZ)
- APACHE JUNCTION DIALYSIS (FMC) (Dialysis Facility, about 9 miles away; APACHE JUNCTION, AZ)
- MOUNTAIN VISTA MEDICAL CENTER, LP Acute Care Hospitals (about 10 miles away; MESA, AZ)
- SUN VALLEY HOME CARE II, LLC (Home Health Center, about 13 miles away; MESA, AZ)
- SPRINGDALE VILLAGE HEALTH CARE (Nursing Home, about 14 miles away; MESA, AZ)
- SOUTHEAST VALLEY DIALYSIS (FMC) (Dialysis Facility, about 14 miles away; QUEEN CREEK, AZ)
- RESTORA HOSPITAL OF MESA (Nursing Home, about 14 miles away; MESA, AZ)
Colleges/universities with over 2000 students nearest to Gold Camp:
- Arizona State University-Polytechnic (about 14 miles; Mesa, AZ; Full-time enrollment: 3,311)
- Chandler-Gilbert Community College (about 21 miles; Chandler, AZ; FT enrollment: 8,047)
- Mesa Community College (about 25 miles; Mesa, AZ; FT enrollment: 14,726)
- Scottsdale Community College (about 28 miles; Scottsdale, AZ; FT enrollment: 6,030)
- Le Cordon Bleu College of Culinary Arts-Scottsdale (about 28 miles; Scottsdale, AZ; FT enrollment: 2,123)
- Arizona State University-Skysong (about 29 miles; Scottsdale, AZ; FT enrollment: 5,445)
- Arizona State University-Tempe (about 29 miles; Tempe, AZ; FT enrollment: 45,951)
Points of interest:
Notable locations in Gold Camp: Kings Ranch (A), RRR Ranch (B), Gold Canyon Ranch (C), Apache Junction Fire District Station 264 (D). Display/hide their locations on the map
Churches in Gold Camp include: Gold Canyon United Methodist Church (A), Superstition Foothills Baptist Church (B). Display/hide their locations on the map
| This place: | 2.1 people |
| Arizona: | 2.6 people |
| This place: | 73.5% |
| Whole state: | 66.2% |
| This place: | 4.9% |
| Whole state: | 7.8% |
Likely homosexual households (counted as self-reported same-sex unmarried-partner households)
- Lesbian couples: 0.5% of all households
- Gay men: 0.4% of all households
| This place: | 3.8% |
| Whole state: | 13.9% |
| This place: | 1.2% |
| Whole state: | 6.2% |
For population 15 years and over in Gold Camp:
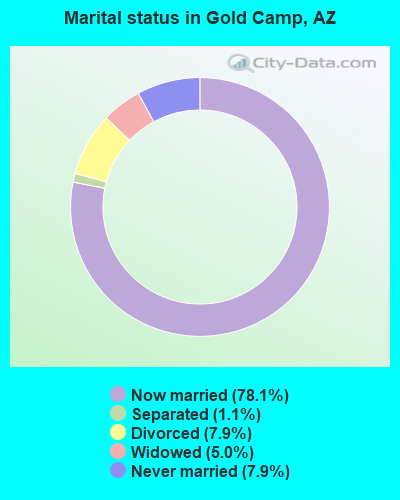
- Never married: 7.9%
- Now married: 78.1%
- Separated: 1.1%
- Widowed: 5.0%
- Divorced: 7.9%
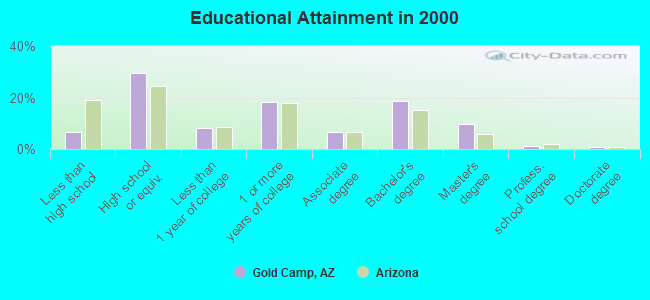
For population 25 years and over in Gold Camp:
- High school or higher: 93.6%
- Bachelor's degree or higher: 30.9%
- Graduate or professional degree: 12.1%
- Unemployed: 3.5%
- Mean travel time to work (commute): 31.9 minutes
| Here: | 9.5 |
| Arizona average: | 13.1 |
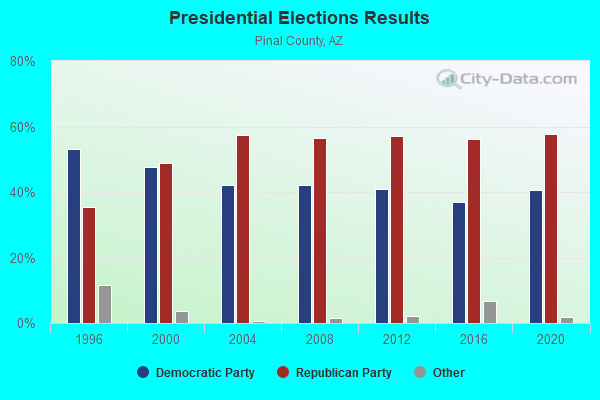
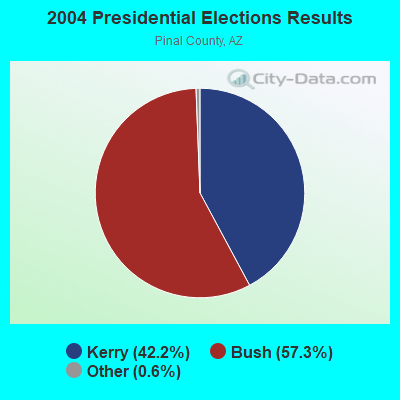
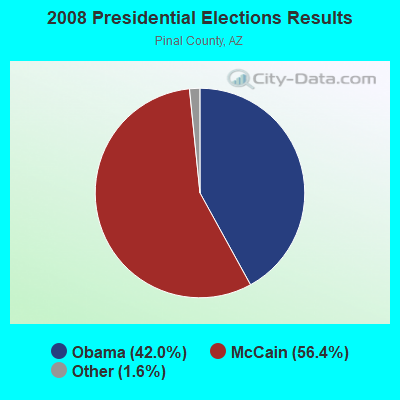
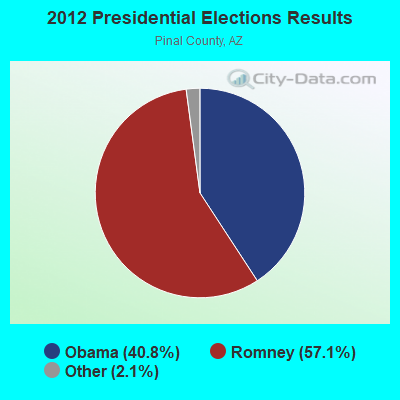
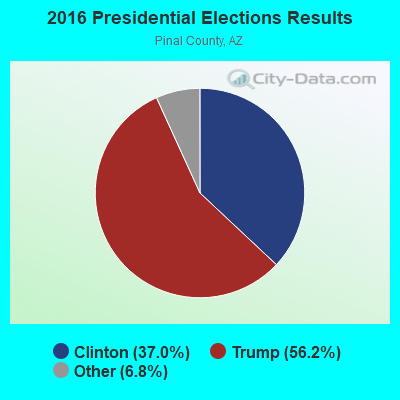
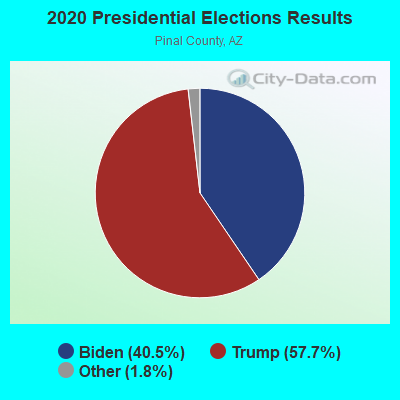
Graphs represent county-level data. Detailed 2008 Election Results
Religion statistics for Gold Camp, AZ (based on Pinal County data)
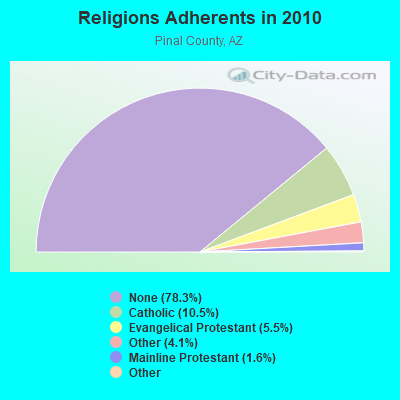
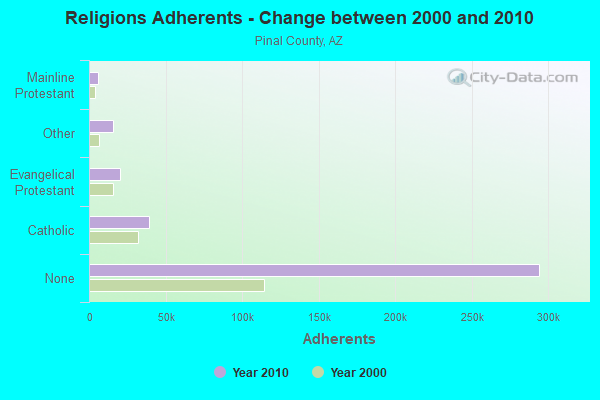
| Religion | Adherents | Congregations |
|---|---|---|
| Catholic | 39,268 | 20 |
| Evangelical Protestant | 20,514 | 155 |
| Other | 15,394 | 45 |
| Mainline Protestant | 5,869 | 21 |
| Black Protestant | 369 | 3 |
| Orthodox | 200 | 1 |
| None | 294,156 | - |
Food Environment Statistics:
| Pinal County: | 1.13 / 10,000 pop. |
| State: | 1.36 / 10,000 pop. |
| Pinal County: | 0.10 / 10,000 pop. |
| Arizona: | 0.14 / 10,000 pop. |
| Here: | 0.37 / 10,000 pop. |
| State: | 0.55 / 10,000 pop. |
| Pinal County: | 1.99 / 10,000 pop. |
| Arizona: | 2.47 / 10,000 pop. |
| Pinal County: | 3.56 / 10,000 pop. |
| Arizona: | 6.21 / 10,000 pop. |
| Here: | 8.0% |
| Arizona: | 8.0% |
| Here: | 28.1% |
| Arizona: | 22.8% |
| Here: | 12.4% |
| Arizona: | 14.2% |
14.18% of this county's 2021 resident taxpayers lived in other counties in 2020 ($62,767 average adjusted gross income)
| Here: | 14.18% |
| Arizona average: | 6.85% |
0.02% of residents moved from foreign countries ($82 average AGI)
Pinal County: 0.02% Arizona average: 0.03%
Top counties from which taxpayers relocated into this county between 2020 and 2021:
| from Maricopa County, AZ | |
| from Pima County, AZ | |
| from Los Angeles County, CA |
9.81% of this county's 2020 resident taxpayers moved to other counties in 2021 ($54,187 average adjusted gross income)
| Here: | 9.81% |
| Arizona average: | 5.72% |
0.02% of residents moved to foreign countries ($91 average AGI)
Pinal County: 0.02% Arizona average: 0.03%
Top counties to which taxpayers relocated from this county between 2020 and 2021:
| to Maricopa County, AZ | |
| to Pima County, AZ | |
| to Navajo County, AZ |
Strongest AM radio stations in Gold Camp:
- KMIK (1580 AM; 50 kW; TEMPE, AZ; Owner: ABC, INC.)
- KFNX (1100 AM; 50 kW; CAVE CREEK, AZ; Owner: NORTH AMERICAN BROADCASTING CO., INC.)
- KPXQ (1360 AM; 50 kW; GLENDALE, AZ; Owner: COMMON GROUND BROADCASTING, INC.)
- KMIA (710 AM; 50 kW; BLACK CANYON CITY, AZ; Owner: ENTRAVISION HOLDINGS, LLC)
- KFLT (830 AM; 50 kW; TUCSON, AZ; Owner: FAMILY LIFE B/CING SYSTEM, INC.)
- KFNN (1510 AM; 22 kW; MESA, AZ; Owner: CRC BROADCASTING COMPANY, INC.)
- KFYI (550 AM; 5 kW; PHOENIX, AZ; Owner: AMFM RADIO LICENSES, L.L.C.)
- KXEM (1010 AM; 15 kW; TOLLESON, AZ; Owner: JAMES CRYSTAL ENTERPRISES OF PHOENIX, INC.)
- KXAM (1310 AM; 5 kW; MESA, AZ; Owner: EMBEE BROADCASTING, INC.)
- KTAR (620 AM; 5 kW; PHOENIX, AZ; Owner: EMMIS RADIO LICENSE CORPORATION)
- KCKY (1150 AM; 5 kW; COOLIDGE, AZ; Owner: CORTARO BROADCASTING CORPORATION)
- KUAZ (1550 AM; daytime; 50 kW; TUCSON, AZ; Owner: ARIZONA BOARD OF REGENTS)
- KDUS (1060 AM; 5 kW; TEMPE, AZ; Owner: TEMPE RADIO, INC.)
Strongest FM radio stations in Gold Camp:
- KEDJ (103.9 FM; GILBERT, AZ; Owner: NPR PHOENIX, LLC)
- KMRR (100.3 FM; GLOBE, AZ; Owner: HBC LICENSE CORPORATION)
- KVJC (91.9 FM; GLOBE, AZ; Owner: CSN INTERNATIONAL)
- KLVK (89.1 FM; FOUNTAIN HILLS, AZ; Owner: EDUCATIONAL MEDIA FOUNDATION)
- KRXS-FM (97.3 FM; GLOBE, AZ; Owner: LINDA C. POTYKA)
- K210CP (89.9 FM; MESA, AZ; Owner: CALVARY CHAPEL OF TWIN FALLS, INC.)
- K220HH (91.9 FM; MESA, AZ; Owner: CALVARY CHAPEL OF TWIN FALLS, INC.)
- KCDX (103.1 FM; FLORENCE, AZ; Owner: DESERT WEST AIR RANCHERS CORPORATION)
- K206BL (89.1 FM; DREAMLAND, AZ; Owner: AMERICAN FAMILY ASSOCIATION)
- KSLX-FM (100.7 FM; SCOTTSDALE, AZ; Owner: CACTUS RADIO, INC.)
- KKLT (98.7 FM; PHOENIX, AZ; Owner: EMMIS RADIO LICENSE CORPORATION)
- KZON (101.5 FM; PHOENIX, AZ; Owner: INFINITY RADIO OPERATIONS INC.)
- KKFR (92.3 FM; GLENDALE, AZ; Owner: EMMIS RADIO LICENSE CORPORATION)
- KESZ (99.9 FM; PHOENIX, AZ; Owner: CLEAR CHANNEL BROADCASTING LICENSES, INC.)
- KOOL-FM (94.5 FM; PHOENIX, AZ; Owner: INFINITY RADIO OPERATIONS INC.)
- KNIX-FM (102.5 FM; PHOENIX, AZ; Owner: CLEAR CHANNEL BROADCASTING LICENSES, INC.)
- KUPD (97.9 FM; TEMPE, AZ; Owner: TEMPE RADIO, INC.)
- KJZZ (91.5 FM; PHOENIX, AZ; Owner: MARICOPA COUNTY COMM. COLLEGE DIST.)
- KFLR-FM (90.3 FM; PHOENIX, AZ; Owner: FAMILY LIFE BROADCASTING, INC.)
- KYOT-FM (95.5 FM; PHOENIX, AZ; Owner: AMFM RADIO LICENSES, L.L.C.)
TV broadcast stations around Gold Camp:
- KAET (Channel 8; PHOENIX, AZ; Owner: ARIZONA BOARD OF REGENTS)
- K57HX (Channel 57; MESA, AZ; Owner: KAZT, L.L.C.)
- KCOS-LP (Channel 28; PHOENIX, AZ; Owner: ARACELIS ORTIZ, EXECUTRIX OF THE ESTATE OF CARLOS ORTIZ)
- KPHE-LP (Channel 19; PHOENIX, AZ; Owner: U.S. INTERACTIVE, L.L.C.)
- K42FD (Channel 42; PHOENIX, AZ; Owner: KDMA CHANNEL 25, INC.)
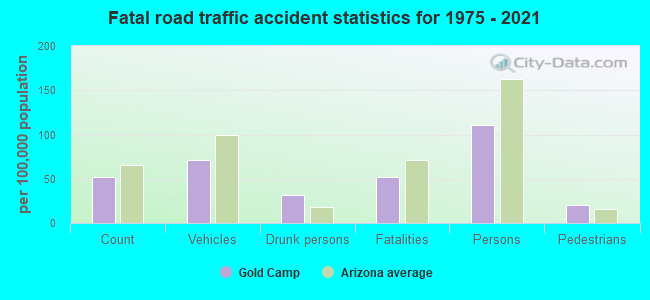
Gold Camp fatal accident list:
Mar 11, 2015 00:06 AM, Kings Ranch Rd, Lat: 33.353028, Lon: -111.456447, Vehicles: 1, Persons: 2, Pedestrians: 1, Fatalities: 1, Drunk persons involved: 1
Aug 26, 2014 08:51 PM, Us-60, Lat: 33.352997, Lon: -111.460419, Vehicles: 2, Persons: 2, Pedestrians: 1, Fatalities: 1
May 17, 2011 05:32 PM, Kings Ranch Rd, Desert Dawn Dr, Lat: 33.365992, Lon: -111.432892, Vehicles: 2, Persons: 5, Fatalities: 1
Dec 27, 2005 04:18 PM, Don Donnelly Trail, Lat: 33.374830, Lon: -111.442070, Vehicles: 1, Persons: 1, Fatalities: 1, Drunk persons involved: 1
- National Bridge Inventory (NBI) Statistics
- 36Number of bridges
- 384ft / 117mTotal length
- $2,000Total costs
- 468,514Total average daily traffic
- 43,395Total average daily truck traffic
- 468,858Total future (year 2037) average daily traffic
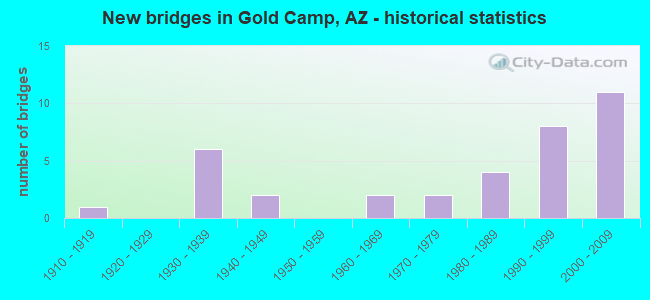
- New bridges - historical statistics
- 11910-1919
- 61930-1939
- 21940-1949
- 21960-1969
- 21970-1979
- 41980-1989
- 81990-1999
- 112000-2009
FCC Registered Microwave Towers:
2- PH54XC020, E. Of Kings Ranch Rd. 1/2 Mi N Of Hwy 60 (Lat: 33.353917 Lon: -111.452500), Type: Upole, Structure height: 24.7 m, Overall height: 25.6 m, Call Sign: WQTI401,
Assigned Frequencies: 11465.0 MHz, 11505.0 MHz, 11465.0 MHz, 11505.0 MHz, 11465.0 MHz, 11505.0 MHz, 11465.0 MHz, 11505.0 MHz, 11465.0 MHz, 11505.0 MHz... (+10 more), Grant Date: 02/10/2014, Expiration Date: 02/10/2024, Cancellation Date: 05/10/2023, Certifier: David Werblow, Registrant: T-Mobile Usa, Inc., 12920 Se 38th Street, Bellevue, WA 98006, Phone: (425) 383-8401, Email:
- GOLD CANYON, 7151 E Us Hwy 60 (Lat: 33.354778 Lon: -111.472306), Type: Building, Structure height: 9.1 m, Overall height: 13 m, Call Sign: WREN530, Licensee ID: L02029303,
Assigned Frequencies: 19380.0 MHz, 19460.0 MHz, 19380.0 MHz, 19460.0 MHz, 19380.0 MHz, 19460.0 MHz, 19380.0 MHz, 19460.0 MHz, 19380.0 MHz, 19460.0 MHz... (+8 more), Grant Date: 11/13/2019, Expiration Date: 11/13/2029, Certifier: Stephen Hon, Registrant: Xiber, LLC, 3500 Depaux Blvd, Suite 1042, Indianapolis, IN 46268, Phone: (317) 408-4349, Email:
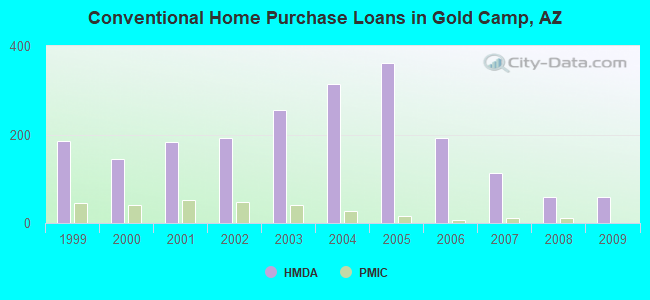
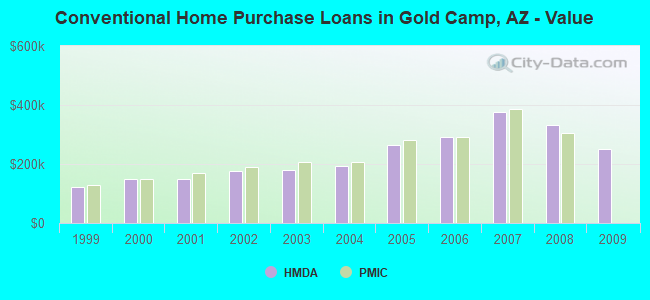
| Home Mortgage Disclosure Act Aggregated Statistics For Year 2009 (Based on 1 partial tract) | ||||||||||||
| A) FHA, FSA/RHS & VA Home Purchase Loans | B) Conventional Home Purchase Loans | C) Refinancings | D) Home Improvement Loans | F) Non-occupant Loans on < 5 Family Dwellings (A B C & D) | G) Loans On Manufactured Home Dwelling (A B C & D) | |||||||
|---|---|---|---|---|---|---|---|---|---|---|---|---|
| Number | Average Value | Number | Average Value | Number | Average Value | Number | Average Value | Number | Average Value | Number | Average Value | |
| LOANS ORIGINATED | 10 | $208,204 | 59 | $250,368 | 197 | $225,874 | 2 | $101,445 | 68 | $245,754 | 1 | $196,540 |
| APPLICATIONS APPROVED, NOT ACCEPTED | 0 | $0 | 5 | $294,490 | 22 | $250,120 | 1 | $12,260 | 5 | $236,664 | 0 | $0 |
| APPLICATIONS DENIED | 3 | $242,687 | 14 | $409,515 | 78 | $279,189 | 4 | $157,390 | 19 | $302,632 | 0 | $0 |
| APPLICATIONS WITHDRAWN | 2 | $174,070 | 9 | $230,027 | 51 | $227,831 | 0 | $0 | 14 | $224,226 | 0 | $0 |
| FILES CLOSED FOR INCOMPLETENESS | 0 | $0 | 1 | $267,800 | 9 | $286,108 | 1 | $43,120 | 3 | $200,623 | 0 | $0 |
Detailed HMDA statistics for the following Tracts: 0003.03
| Private Mortgage Insurance Companies Aggregated Statistics For Year 2009 (Based on 1 partial tract) | ||
| B) Refinancings | ||
|---|---|---|
| Number | Average Value | |
| LOANS ORIGINATED | 2 | $240,115 |
| APPLICATIONS APPROVED, NOT ACCEPTED | 1 | $355,400 |
| APPLICATIONS DENIED | 0 | $0 |
| APPLICATIONS WITHDRAWN | 0 | $0 |
| FILES CLOSED FOR INCOMPLETENESS | 0 | $0 |
Detailed PMIC statistics for the following Tracts: 0003.03
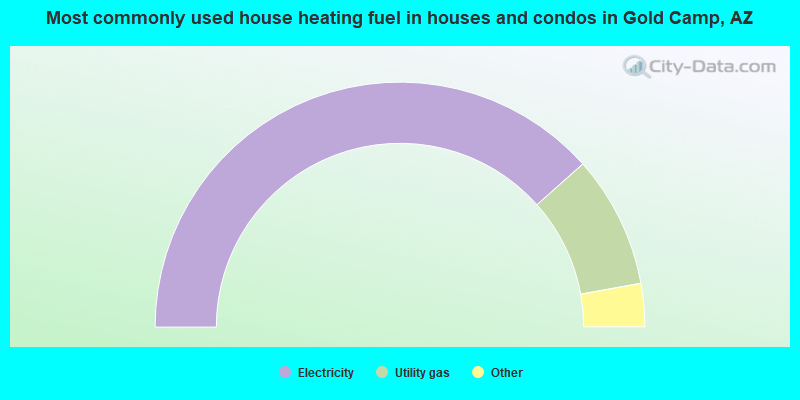
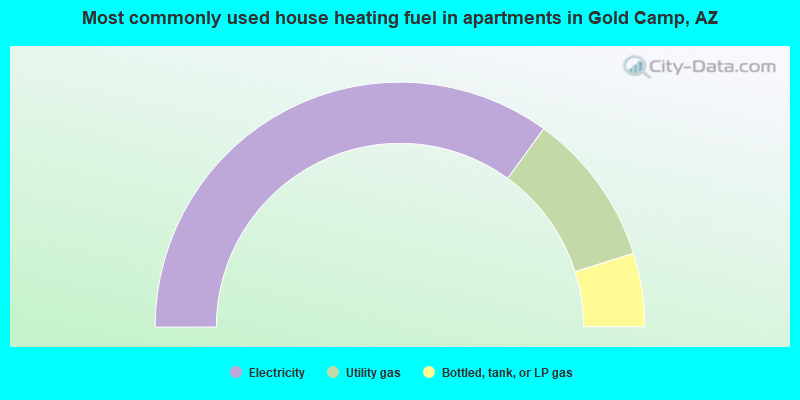
- 76.9%Electricity
- 17.5%Utility gas
- 3.1%Bottled, tank, or LP gas
- 1.0%Fuel oil, kerosene, etc.
- 0.8%Wood
- 0.5%Other fuel
- 0.3%No fuel used
- 69.9%Electricity
- 20.3%Utility gas
- 9.7%Bottled, tank, or LP gas
Gold Camp compared to Arizona state average:
- Median household income above state average.
- Median house value above state average.
- Unemployed percentage significantly below state average.
- Black race population percentage below state average.
- Hispanic race population percentage significantly below state average.
- Median age significantly above state average.
- Foreign-born population percentage significantly below state average.
- Renting percentage significantly below state average.
- Length of stay since moving in significantly above state average.
- Number of rooms per house significantly below state average.
- House age significantly below state average.
- Number of college students below state average.
Gold Camp on our top lists:
- #11 on the list of "Top 101 cities with largest percentage of males in occupations: judges, magistrates, and other judicial workers (population 5,000+)"
- #12 on the list of "Top 101 cities with largest percentage of males in occupations: architects, surveyors, and cartographers (population 5,000+)"
- #19 on the list of "Top 101 cities with largest percentage of females in occupations: entertainers and performers, sports, and related workers (population 5,000+)"
- #22 on the list of "Top 101 cities with largest percentage of females in occupations: supervisors of construction and extraction workers (population 5,000+)"
- #25 on the list of "Top 101 cities with largest percentage of males in occupations: nursing, psychiatric, and home health aides (population 5,000+)"
- #27 on the list of "Top 101 cities with largest percentage of males in occupations: supervisors and other personal care and service workers except personal appearance, transportation, and child care workers (population 5,000+)"
- #41 on the list of "Top 101 cities with largest percentage of females in industries: electronic shopping and mail-order houses (population 5,000+)"
- #41 on the list of "Top 101 cities with largest percentage of males in industries: used merchandise, gift, novelty, and souvenir, and other miscellaneous stores (population 5,000+)"
- #47 on the list of "Top 101 cities with largest percentage of males in industries: sporting goods, camera, and hobby and toy stores (population 5,000+)"
- #49 on the list of "Top 100 cities with oldest residents (pop. 5,000+)"
- #55 on the list of "Top 101 cities with largest percentage of females in industries: furniture and home furnishings, and household appliance stores (population 5,000+)"
- #64 on the list of "Top 101 cities with largest percentage of males in industries: other direct selling establishments (population 5,000+)"
- #90 on the list of "Top 101 cities with largest percentage of females in industries: transportation equipment (population 5,000+)"
- #2 on the list of "Top 101 counties with the largest decrease in the number of deaths per 1000 residents 2000-2006 to 2007-2013 (pop. 50,000+)"
- #3 on the list of "Top 101 counties with the highest Particulate Matter (PM10) Annual air pollution readings in 2012 (µg/m3)"
- #15 on the list of "Top 101 counties with the lowest percentage of residents that visited a dentist within the past year"
- #28 on the list of "Top 101 counties with the highest percentage of residents relocating to other counties in 2011 (pop. 50,000+)"
- #31 on the list of "Top 101 counties with the highest Ozone (1-hour) air pollution readings in 2012 (ppm)"