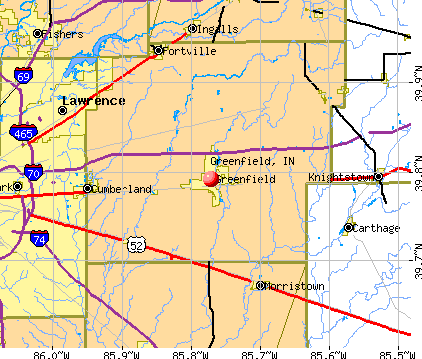
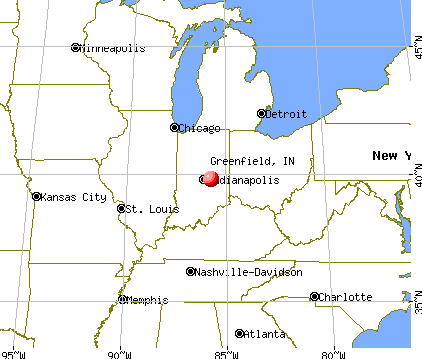
Greenfield, Indiana
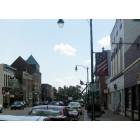
Greenfield: downtown
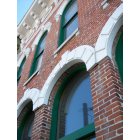
Greenfield: old downtown

Greenfield: sunset in greenfield

Greenfield: Hancock County Courthouse
- add
your
Submit your own pictures of this city and show them to the world
- OSM Map
- General Map
- Google Map
- MSN Map
Population change since 2000: +69.8%
| Males: 12,056 | |
| Females: 12,729 |
| Median resident age: | 37.8 years |
| Indiana median age: | 38.2 years |
Zip codes: 46140.
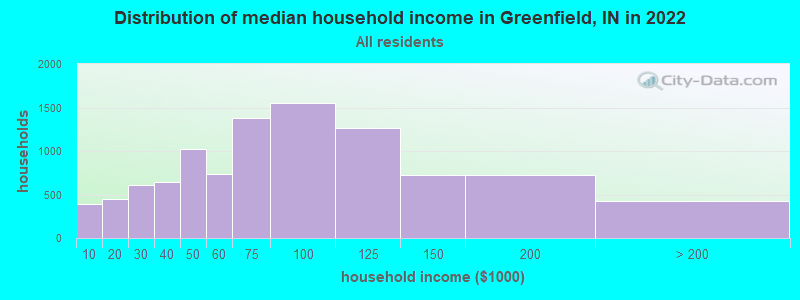
| Greenfield: | $70,584 |
| IN: | $66,785 |
Estimated per capita income in 2022: $36,739 (it was $22,509 in 2000)
Greenfield city income, earnings, and wages data
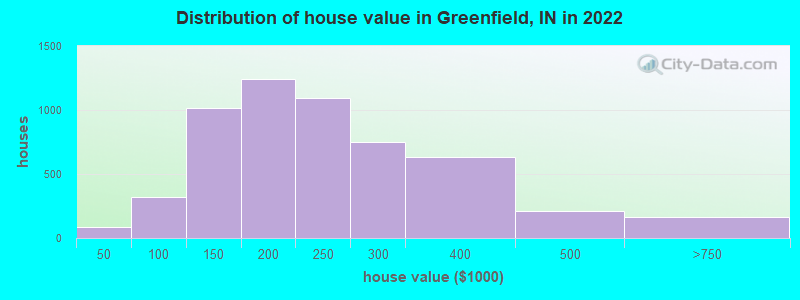
Estimated median house or condo value in 2022: $211,095 (it was $105,500 in 2000)
| Greenfield: | $211,095 |
| IN: | $208,700 |
Mean prices in 2022: all housing units: $224,354; detached houses: $228,020; townhouses or other attached units: $177,824; in 2-unit structures: $315,905; mobile homes: $73,565
Median gross rent in 2022: $1,174.
(5.7% for White Non-Hispanic residents, 12.0% for Black residents, 1.5% for Hispanic or Latino residents, 6.9% for two or more races residents)
Detailed information about poverty and poor residents in Greenfield, IN


Compare current foreclosures in Greenfield, IN:
| Photo | Address | Area | Beds / Baths | Price | Details |
|---|---|---|---|---|---|

|
#1
N Windswept Rd
Greenfield, IN 46140
|
1,936 sq. feet
|
2 baths 4 beds |
show details | |

|
#2
N Spring St
Greenfield, IN 46140
|
2,128 sq. feet
|
2 baths 4 beds |
show details | |

|
#3
N 350 W
Greenfield, IN 46140
|
1,656 sq. feet
|
2 baths 3 beds |
show details | |

|
#4
Streamside Dr
Greenfield, IN 46140
|
2,852 sq. feet
|
2 baths 4 beds |
show details | |

|
#5
Independence Rd
Greenfield, IN 46140
|
1,577 sq. feet
|
2 baths 3 beds |
show details | |

|
#6
S Meridian Rd
Greenfield, IN 46140
|
1,470 sq. feet
|
1 baths 3 beds |
show details | |

|
#7
Chapman Blvd
Greenfield, IN 46140
|
3,926 sq. feet
|
3 baths 4 beds |
show details | |

|
#8
W Sixth St
Greenfield, IN 46140
|
1,043 sq. feet
|
1 baths 3 beds |
show details | |

|
#9
N 400 E
Greenfield, IN 46140
|
1,476 sq. feet
|
2 baths 6 beds |
show details | |

|
#10
E Fifth St
Greenfield, IN 46140
|
1,260 sq. feet
|
1 baths 3 beds |
show details |
| Photo | Address | Area | Beds / Baths | Price | Details |
|---|---|---|---|---|---|

|
#11
W Mckenzie Rd
Greenfield, IN 46140
|
1,800 sq. feet
|
2 baths 3 beds |
show details | |

|
#12
N 25 W
Greenfield, IN 46140
|
2,549 sq. feet
|
2 baths 4 beds |
show details | |

|
#13
E Mckenzie Rd
Greenfield, IN 46140
|
960 sq. feet
|
1 baths 2 beds |
show details | |

|
#14
Carlton Dr
Greenfield, IN 46140
|
1,696 sq. feet
|
2 baths 3 beds |
show details | |

|
#15
S Brandywine Ln
Greenfield, IN 46140
|
1,244 sq. feet
|
2 baths 3 beds |
show details | |

|
#16
N Fortville Pike
Greenfield, IN 46140
|
988 sq. feet
|
1 baths 2 beds |
show details | |

|
#17
S Morristown Pike
Greenfield, IN 46140
|
2,000 sq. feet
|
2 baths 3 beds |
show details | |

|
#18
Lavender Dr
Greenfield, IN 46140
|
1,504 sq. feet
|
2 baths 3 beds |
show details | |

|
#19
W 100 N
Greenfield, IN 46140
|
2,874 sq. feet
|
1 baths 4 beds |
show details | |

|
#20
S State St
Greenfield, IN 46140
|
2,815 sq. feet
|
1 baths 4 beds |
show details |
| Photo | Address | Area | Beds / Baths | Price | Details |
|---|---|---|---|---|---|

|
#21
Sweetheart Ct
Greenfield, IN 46140
|
1,304 sq. feet
|
2 baths 3 beds |
show details | |

|
#22
W 300 N
Greenfield, IN 46140
|
1,269 sq. feet
|
1 baths 3 beds |
show details | |

|
#23
Worcester Way
Greenfield, IN 46140
|
1,572 sq. feet
|
2 baths 3 beds |
show details | |

|
#24
W 300 N # 305
Greenfield, IN 46140
|
1,782 sq. feet
|
2 baths 9 beds |
show details | |

|
#25
W Weber Rd
Greenfield, IN 46140
|
1,647 sq. feet
|
1 baths 3 beds |
show details | |

|
#26
E 300 N
Greenfield, IN 46140
|
2,465 sq. feet
|
2 baths 4 beds |
show details | |

|
#27
W 200 N # 617
Greenfield, IN 46140
|
2,584 sq. feet
|
2 baths 3 beds |
show details | |

|
#28
Rosemary Ct
Greenfield, IN 46140
|
2,108 sq. feet
|
2 baths 3 beds |
show details | |

|
#29
N Meridian Rd
Greenfield, IN 46140
|
2,108 sq. feet
|
2 baths 3 beds |
show details | |

|
#30
W North St
Greenfield, IN 46140
|
1,594 sq. feet
|
1 baths 3 beds |
show details |
| Photo | Address | Area | Beds / Baths | Price | Details |
|---|---|---|---|---|---|

|
#31
S 750 E
Greenfield, IN 46140
|
2,010 sq. feet
|
2 baths 3 beds |
show details | |

|
#32
Founders Dr
Greenfield, IN 46140
|
2,333 sq. feet
|
2 baths 3 beds |
show details | |

|
#33
N 700 W
Greenfield, IN 46140
|
1,749 sq. feet
|
2 baths 3 beds |
show details | |

|
#34
Lake View Ct S
Greenfield, IN 46140
|
2,024 sq. feet
|
2 baths 3 beds |
show details | |

|
#35
Cortland Ct
Greenfield, IN 46140
|
1,514 sq. feet
|
2 baths 3 beds |
show details | |

|
#36
Madison Dr
Greenfield, IN 46140
|
1,613 sq. feet
|
1 baths 3 beds |
show details | |

|
#37
Brookview Cir
Greenfield, IN 46140
|
1,970 sq. feet
|
2 baths 4 beds |
show details | |

|
#38
Mimosa Ct
Greenfield, IN 46140
|
1,395 sq. feet
|
2 baths 3 beds |
show details | |

|
#39
N Winchester Dr
Greenfield, IN 46140
|
1,641 sq. feet
|
3 baths 3 beds |
show details | |

|
#40
Geronimo Dr
Greenfield, IN 46140
|
- sq. feet
|
- baths - beds |
show details |
| Photo | Address | Area | Beds / Baths | Price | Details |
|---|---|---|---|---|---|

|
#41
W Springhurst Blvd
Greenfield, IN 46140
|
- sq. feet
|
- baths - beds |
show details | |

|
#42
W Fifth St, Apt 4
Greenfield, IN 46140
|
- sq. feet
|
- baths - beds |
show details | |

|
#43
Prospector Dr
Greenfield, IN 46140
|
- sq. feet
|
- baths - beds |
show details | |

|
#44
Woodland East Dr
Greenfield, IN 46140
|
- sq. feet
|
- baths - beds |
show details | |

|
#45
Meek St
Greenfield, IN 46140
|
- sq. feet
|
- baths - beds |
show details | |

|
#46
Ginny Trce, Apt 302
Greenfield, IN 46140
|
- sq. feet
|
- baths - beds |
show details | |

|
#47
Streamside Dr
Greenfield, IN 46140
|
- sq. feet
|
- baths - beds |
show details | |

|
#48
Boots Trl
Greenfield, IN 46140
|
- sq. feet
|
- baths - beds |
show details | |

|
#49
W Harmony Trl
Greenfield, IN 46140
|
- sq. feet
|
- baths - beds |
show details | |

|
Check over 1 million property listings on Foreclosure.com!
|
browse all offers | |||


- 21,87489.2%White alone
- 9053.7%Two or more races
- 5112.1%Hispanic
- 3781.5%Black alone
- 3471.4%Asian alone
- 1420.6%Other race alone
- 320.1%American Indian alone
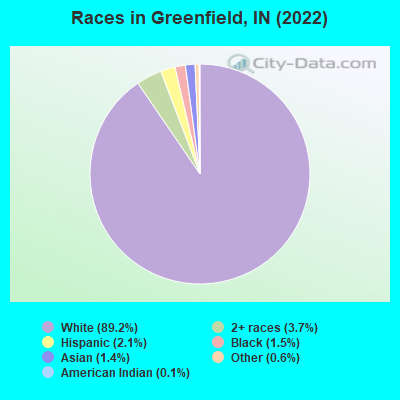
Races in Greenfield detailed stats: ancestries, foreign born residents, place of birth
According to our research of Indiana and other state lists, there were 2 registered sex offenders living in Greenfield, Indiana as of April 28, 2024.
The ratio of all residents to sex offenders in Greenfield is 10,761 to 1.
The ratio of registered sex offenders to all residents in this city is much lower than the state average.
Type |
2009 |
2010 |
2011 |
2012 |
2013 |
2014 |
2015 |
2016 |
2017 |
2018 |
2019 |
2020 |
2021 |
2022 |
|---|---|---|---|---|---|---|---|---|---|---|---|---|---|---|
| Murders (per 100,000) | 0 (0.0) | 0 (0.0) | 0 (0.0) | 1 (4.8) | 0 (0.0) | 0 (0.0) | 2 (9.3) | 2 (9.2) | 0 (0.0) | 0 (0.0) | 0 (0.0) | 0 (0.0) | 0 (0.0) | 0 (0.0) |
| Rapes (per 100,000) | 5 (26.0) | 1 (4.9) | 3 (14.5) | 0 (0.0) | 1 (4.7) | 6 (28.1) | 6 (27.8) | 6 (27.7) | 12 (54.9) | 12 (53.8) | 7 (30.7) | 12 (51.6) | 6 (25.4) | 12 (48.8) |
| Robberies (per 100,000) | 3 (15.6) | 4 (19.4) | 1 (4.8) | 10 (48.0) | 8 (37.8) | 2 (9.4) | 8 (37.1) | 4 (18.5) | 3 (13.7) | 1 (4.5) | 6 (26.3) | 5 (21.5) | 3 (12.7) | 1 (4.1) |
| Assaults (per 100,000) | 9 (46.7) | 10 (48.5) | 6 (29.0) | 8 (38.4) | 3 (14.2) | 21 (98.2) | 77 (356.9) | 45 (207.8) | 79 (361.2) | 42 (188.4) | 10 (43.9) | 19 (81.6) | 14 (59.2) | 23 (93.5) |
| Burglaries (per 100,000) | 42 (218.0) | 39 (189.3) | 68 (328.4) | 60 (288.2) | 40 (188.9) | 55 (257.2) | 56 (259.6) | 52 (240.2) | 63 (288.0) | 38 (170.5) | 32 (140.4) | 26 (111.7) | 18 (76.1) | 67 (272.4) |
| Thefts (per 100,000) | 330 (1,713) | 327 (1,587) | 293 (1,415) | 318 (1,527) | 350 (1,653) | 295 (1,380) | 383 (1,775) | 378 (1,746) | 315 (1,440) | 211 (946.5) | 275 (1,206) | 234 (1,005) | 172 (727.3) | 195 (792.8) |
| Auto thefts (per 100,000) | 26 (135.0) | 17 (82.5) | 20 (96.6) | 20 (96.1) | 17 (80.3) | 13 (60.8) | 32 (148.3) | 34 (157.0) | 35 (160.0) | 32 (143.5) | 26 (114.0) | 22 (94.5) | 33 (139.5) | 22 (89.4) |
| Arson (per 100,000) | 5 (26.0) | 0 (0.0) | 3 (14.5) | 0 (0.0) | 1 (4.7) | 0 (0.0) | 4 (18.5) | 3 (13.9) | 0 (0.0) | 2 (9.0) | 3 (13.2) | 2 (8.6) | 1 (4.2) | 0 (0.0) |
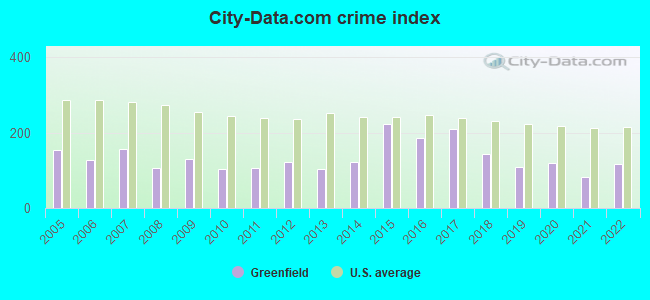
| City-Data.com crime index | 129.4 | 102.8 | 106.1 | 120.7 | 103.7 | 123.0 | 224.4 | 186.9 | 210.8 | 143.4 | 108.4 | 119.6 | 81.5 | 116.9 |
The City-Data.com crime index weighs serious crimes and violent crimes more heavily. Higher means more crime, U.S. average is 246.1. It adjusts for the number of visitors and daily workers commuting into cities.
Crime rate in Greenfield detailed stats: murders, rapes, robberies, assaults, burglaries, thefts, arson
Full-time law enforcement employees in 2020, including police officers: 45 (41 officers - 39 male; 2 female).
| Officers per 1,000 residents here: | 1.76 |
| Indiana average: | 2.12 |
 Recent articles from our blog. Our writers, many of them Ph.D. graduates or candidates, create easy-to-read articles on a wide variety of topics.

 | Packing up House Soon in Greenfield, IN (5 replies) |
| Elanco moving HQ to near downtown Indianapolis from Greenfield (5 replies) |
| Thoughts on Wabash, Indiana? (17 replies) |
| Greenfield or Avon area? (6 replies) |
| Best Small Towns (20 replies) |
| East side? New Palestine, Greenfield? (6 replies) |
Latest news from Greenfield, IN collected exclusively by city-data.com from local newspapers, TV, and radio stations
Ancestries: English (19.7%), German (16.6%), American (13.7%), Irish (5.7%), European (5.0%), Italian (4.2%).
Current Local Time: EST time zone
Incorporated in 1876
Elevation: 888 feet
Land area: 8.03 square miles.
Population density: 3,086 people per square mile (average).
818 residents are foreign born (1.6% Asia, 0.9% Africa, 0.5% Latin America).
| This city: | 3.3% |
| Indiana: | 5.6% |
Median real estate property taxes paid for housing units with mortgages in 2022: $1,324 (0.6%)
Median real estate property taxes paid for housing units with no mortgage in 2022: $1,338 (0.7%)
Nearest city with pop. 50,000+: Indianapolis, IN  (20.0 miles , pop. 781,870).
Nearest city with pop. 1,000,000+: Chicago, IL (173.4 miles , pop. 2,896,016).
Nearest cities:
), ), ), ), ), ), ), )Latitude: 39.79 N, Longitude: 85.77 W
Daytime population change due to commuting: +2,727 (+11.1%)
Workers who live and work in this city: 6,181 (49.3%)
Area code: 317

Greenfield, Indiana accommodation & food services, waste management - Economy and Business Data
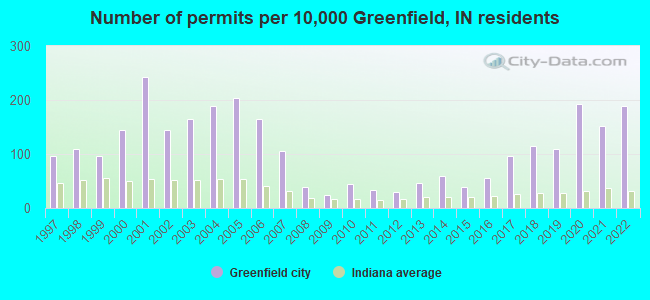
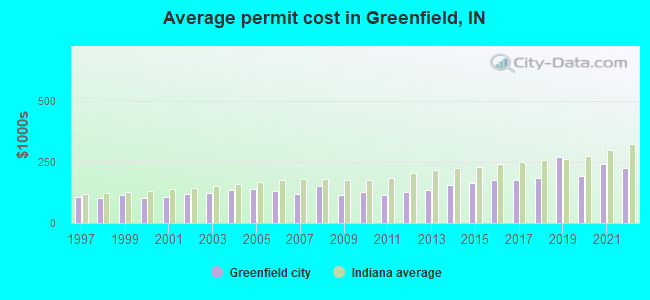
Single-family new house construction building permits:
- 2022: 276 buildings, average cost: $224,200
- 2021: 222 buildings, average cost: $244,000
- 2020: 280 buildings, average cost: $190,500
- 2019: 159 buildings, average cost: $269,600
- 2018: 168 buildings, average cost: $184,200
- 2017: 141 buildings, average cost: $175,100
- 2016: 81 buildings, average cost: $177,800
- 2015: 55 buildings, average cost: $162,700
- 2014: 86 buildings, average cost: $155,600
- 2013: 67 buildings, average cost: $135,300
- 2012: 42 buildings, average cost: $128,900
- 2011: 48 buildings, average cost: $114,200
- 2010: 64 buildings, average cost: $127,800
- 2009: 35 buildings, average cost: $114,300
- 2008: 57 buildings, average cost: $150,300
- 2007: 155 buildings, average cost: $120,500
- 2006: 241 buildings, average cost: $131,700
- 2005: 298 buildings, average cost: $138,600
- 2004: 275 buildings, average cost: $134,500
- 2003: 241 buildings, average cost: $125,200
- 2002: 210 buildings, average cost: $119,500
- 2001: 354 buildings, average cost: $106,100
- 2000: 212 buildings, average cost: $102,400
- 1999: 141 buildings, average cost: $113,200
- 1998: 161 buildings, average cost: $102,100
- 1997: 142 buildings, average cost: $107,700
| Here: | 2.4% |
| Indiana: | 2.8% |
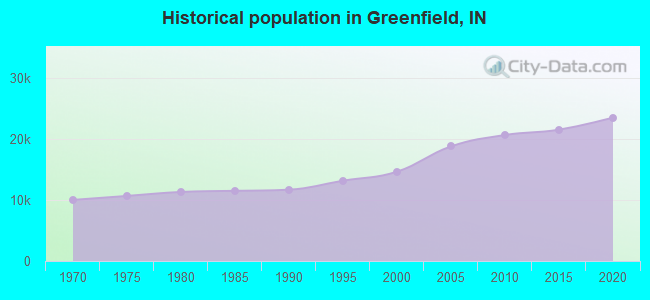
Population change in the 1990s: +2,387 (+19.5%).
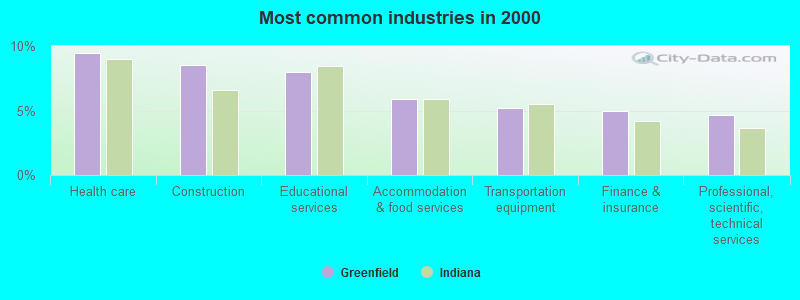
- Health care (9.5%)
- Construction (8.5%)
- Educational services (8.0%)
- Accommodation & food services (5.9%)
- Transportation equipment (5.2%)
- Finance & insurance (5.0%)
- Professional, scientific, technical services (4.6%)
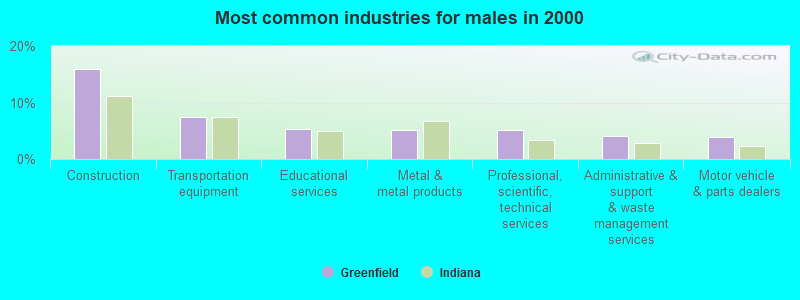
- Construction (15.9%)
- Transportation equipment (7.5%)
- Educational services (5.2%)
- Metal & metal products (5.2%)
- Professional, scientific, technical services (5.1%)
- Administrative & support & waste management services (4.1%)
- Motor vehicle & parts dealers (3.9%)
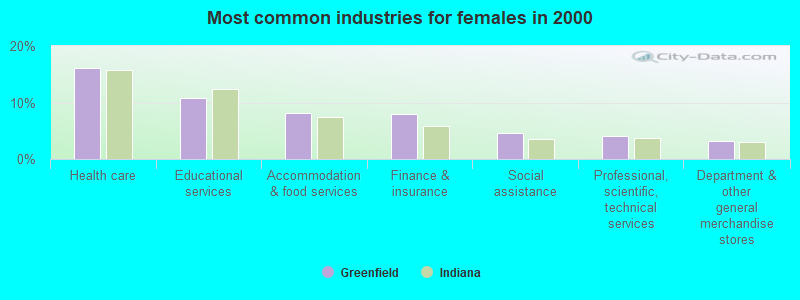
- Health care (16.1%)
- Educational services (10.8%)
- Accommodation & food services (8.1%)
- Finance & insurance (8.0%)
- Social assistance (4.6%)
- Professional, scientific, technical services (4.1%)
- Department & other general merchandise stores (3.1%)
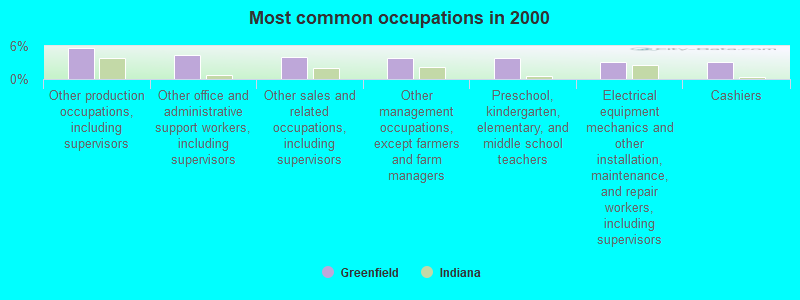
- Other production occupations, including supervisors (5.6%)
- Other office and administrative support workers, including supervisors (4.3%)
- Other sales and related occupations, including supervisors (3.9%)
- Other management occupations, except farmers and farm managers (3.8%)
- Preschool, kindergarten, elementary, and middle school teachers (3.7%)
- Electrical equipment mechanics and other installation, maintenance, and repair workers, including supervisors (3.1%)
- Cashiers (3.1%)
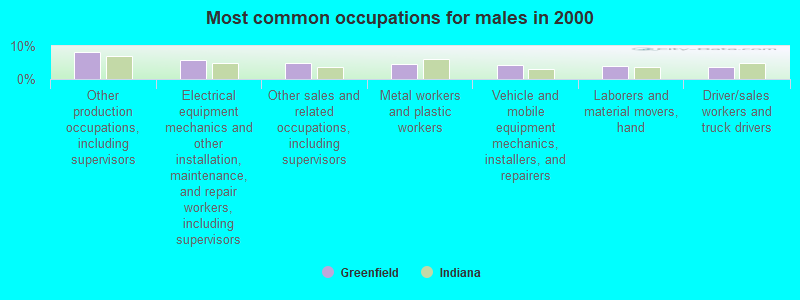
- Other production occupations, including supervisors (8.1%)
- Electrical equipment mechanics and other installation, maintenance, and repair workers, including supervisors (5.6%)
- Other sales and related occupations, including supervisors (4.8%)
- Metal workers and plastic workers (4.5%)
- Vehicle and mobile equipment mechanics, installers, and repairers (4.1%)
- Laborers and material movers, hand (4.0%)
- Driver/sales workers and truck drivers (3.7%)
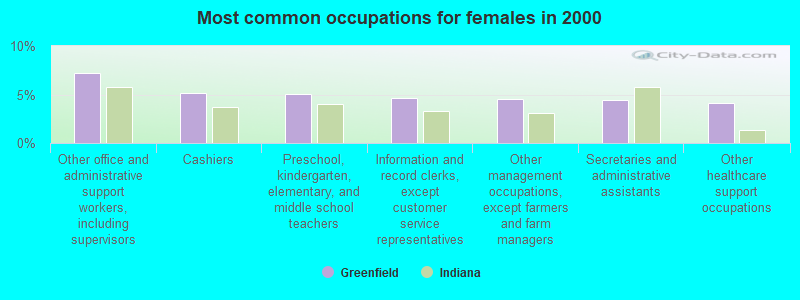
- Other office and administrative support workers, including supervisors (7.2%)
- Cashiers (5.1%)
- Preschool, kindergarten, elementary, and middle school teachers (5.1%)
- Information and record clerks, except customer service representatives (4.6%)
- Other management occupations, except farmers and farm managers (4.5%)
- Secretaries and administrative assistants (4.4%)
- Other healthcare support occupations (4.2%)
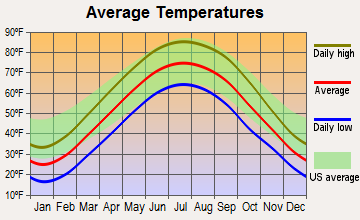
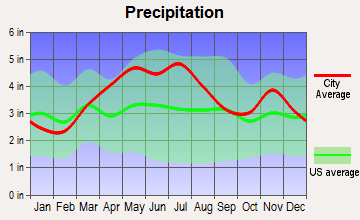
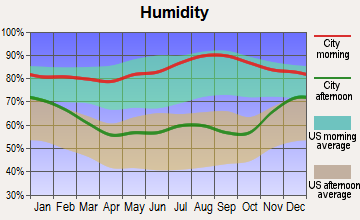
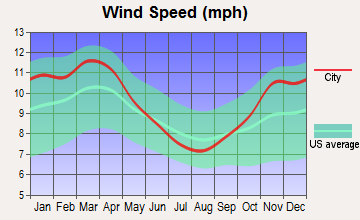
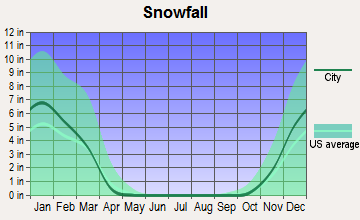
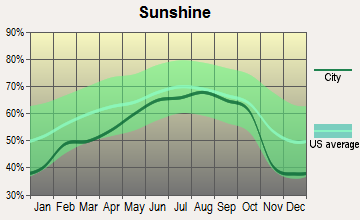
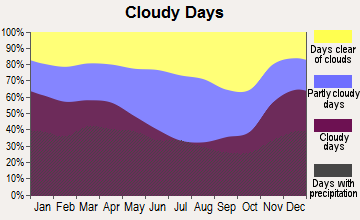
Average climate in Greenfield, Indiana
Based on data reported by over 4,000 weather stations
|
|


(lower is better)
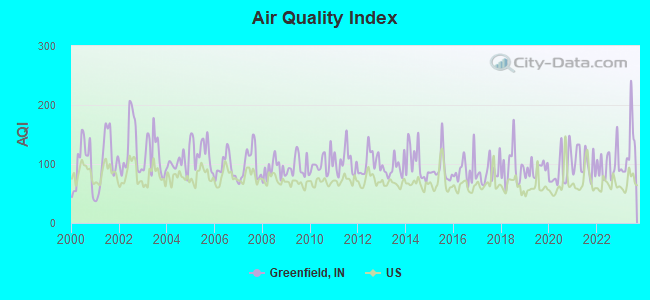
Air Quality Index (AQI) level in 2023 was 125. This is significantly worse than average.
| City: | 125 |
| U.S.: | 73 |
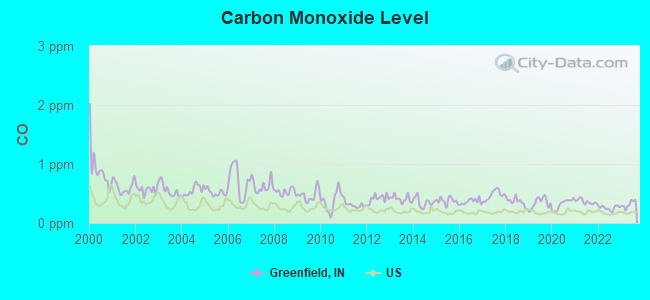
Carbon Monoxide (CO) [ppm] level in 2023 was 0.317. This is worse than average. Closest monitor was 15.4 miles away from the city center.
| City: | 0.317 |
| U.S.: | 0.251 |
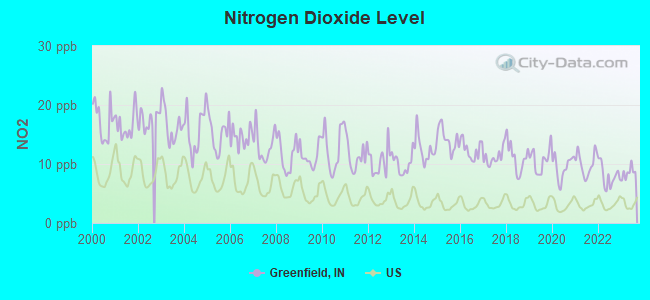
Nitrogen Dioxide (NO2) [ppb] level in 2023 was 8.52. This is significantly worse than average. Closest monitor was 14.0 miles away from the city center.
| City: | 8.52 |
| U.S.: | 5.11 |
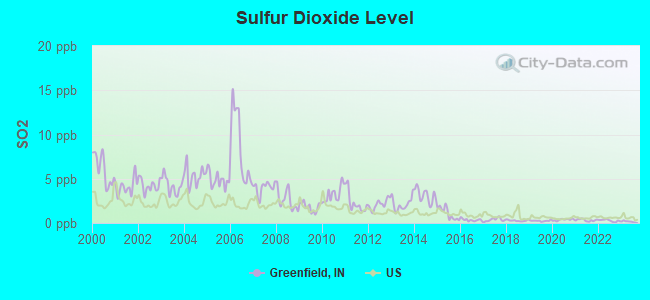
Sulfur Dioxide (SO2) [ppb] level in 2023 was 0.165. This is significantly better than average. Closest monitor was 14.0 miles away from the city center.
| City: | 0.165 |
| U.S.: | 1.515 |
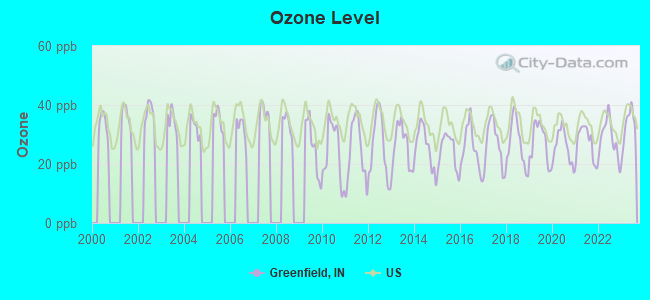
Ozone [ppb] level in 2023 was 32.8. This is about average. Closest monitor was 10.6 miles away from the city center.
| City: | 32.8 |
| U.S.: | 33.3 |
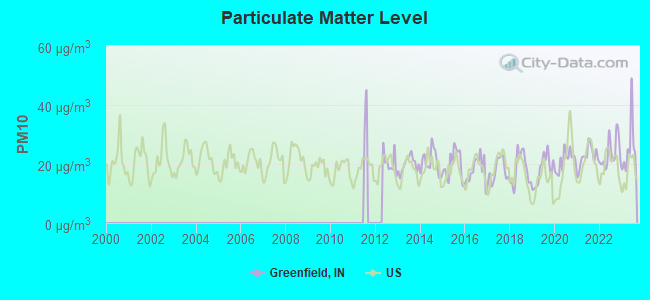
Particulate Matter (PM10) [µg/m3] level in 2023 was 25.4. This is worse than average. Closest monitor was 15.4 miles away from the city center.
| City: | 25.4 |
| U.S.: | 19.2 |
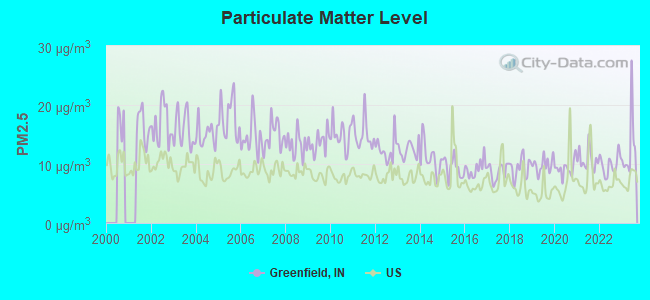
Particulate Matter (PM2.5) [µg/m3] level in 2023 was 12.7. This is significantly worse than average. Closest monitor was 14.7 miles away from the city center.
| City: | 12.7 |
| U.S.: | 8.1 |
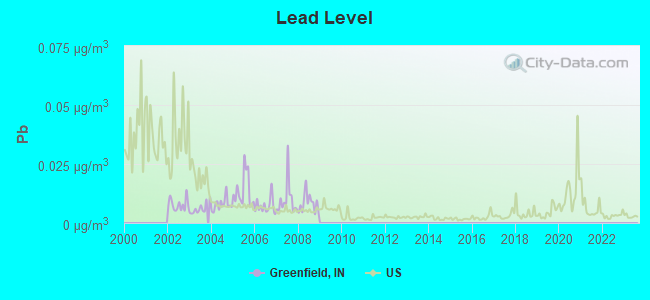
Lead (Pb) [µg/m3] level in 2008 was 0.00840. This is about average. Closest monitor was 15.4 miles away from the city center.
| City: | 0.00840 |
| U.S.: | 0.00931 |
Tornado activity:
Greenfield-area historical tornado activity is slightly above Indiana state average. It is 131% greater than the overall U.S. average.
On 6/11/1998, a category F4 (max. wind speeds 207-260 mph) tornado 3.0 miles away from the Greenfield city center injured 4 people and caused $2 million in damages.
On 4/3/1974, a category F4 tornado 7.1 miles away from the city center injured 17 people and caused between $5,000,000 and $50,000,000 in damages.
Earthquake activity:
Greenfield-area historical earthquake activity is significantly above Indiana state average. It is 68% greater than the overall U.S. average.On 4/18/2008 at 09:36:59, a magnitude 5.4 (5.1 MB, 4.8 MS, 5.4 MW, 5.2 MW, Class: Moderate, Intensity: VI - VII) earthquake occurred 146.5 miles away from the city center
On 4/18/2008 at 09:36:59, a magnitude 5.2 (5.2 MW, Depth: 8.9 mi) earthquake occurred 146.5 miles away from Greenfield center
On 7/27/1980 at 18:52:21, a magnitude 5.2 (5.1 MB, 4.7 MS, 5.0 UK, 5.2 UK) earthquake occurred 147.3 miles away from Greenfield center
On 6/10/1987 at 23:48:54, a magnitude 5.1 (4.9 MB, 4.4 MS, 4.6 MS, 5.1 LG) earthquake occurred 131.5 miles away from Greenfield center
On 6/18/2002 at 17:37:15, a magnitude 5.0 (4.3 MB, 4.6 MW, 5.0 LG) earthquake occurred 165.1 miles away from Greenfield center
On 4/18/2008 at 15:14:16, a magnitude 4.8 (4.5 MB, 4.8 MW, 4.6 MW, Class: Light, Intensity: IV - V) earthquake occurred 143.8 miles away from the city center
Magnitude types: regional Lg-wave magnitude (LG), body-wave magnitude (MB), surface-wave magnitude (MS), moment magnitude (MW)
Natural disasters:
The number of natural disasters in Hancock County (15) is near the US average (15).Major Disasters (Presidential) Declared: 10
Emergencies Declared: 4
Causes of natural disasters: Storms: 7, Floods: 6, Tornadoes: 5, Snows: 2, Winter Storms: 2, Blizzard: 1, Hurricane: 1, Ice Storm: 1, Other: 1 (Note: some incidents may be assigned to more than one category).

Hospitals in Greenfield:
- DEVELOPMENTAL SERVICE ALTERNAT (227 GASLITE LN)
- DEVELOPMENTAL SERVICE ALTERNAT (740 OAK BLVD)
- HANCOCK REGIONAL HOSPITAL (Government - Local, provides emergency services, 801 N STATE ST)
Nursing Homes in Greenfield:
- GOLDEN LIVING CENTER-BRANDYWINE (745 N SWOPE ST)
- HANCOCK MEMORIAL HOSPITAL TCU (801 N STATE)
- HICKORY CREEK AT GREENFIELD (1310 EAST MAIN STREET)
- KINDRED TRANSITIONAL CARE AND REHAB-GREENFIELD (200 GREEN MEADOWS DR)
- SPRINGHURST HEALTH CAMPUS (628 N MERIDIAN RD)
- SUGAR CREEK REHABILITATION AND CONVALESCENT CENTER (5430 W US 40)
Dialysis Facilities in Greenfield:
Home Health Centers in Greenfield:
Airports and heliports located in Greenfield:
- Pope Field Airport (GFD) (Runways: 1, Itinerant Ops: 1,815, Local Ops: 2,246, Military Ops: 50)
- Frost Field Airport (0II7) (Runways: 1)
- Sauer-Harter Airport (79II) (Runways: 1)
- Willis Airport (4II8) (Runways: 1)
- Willis Airport Site No 2 (6II2) (Runways: 1)
- Hancock Memorial Hospital Heliport (8IN4)
Colleges/universities with over 2000 students nearest to Greenfield:
- Harrison College-Indianapolis (about 21 miles; Indianapolis, IN; Full-time enrollment: 4,244)
- University of Indianapolis (about 21 miles; Indianapolis, IN; FT enrollment: 4,625)
- Ivy Tech Community College (about 21 miles; Indianapolis, IN; FT enrollment: 71,493)
- American College of Education (about 21 miles; Indianapolis, IN; FT enrollment: 2,718)
- Indiana University-Purdue University-Indianapolis (about 22 miles; Indianapolis, IN; FT enrollment: 22,751)
- Butler University (about 22 miles; Indianapolis, IN; FT enrollment: 4,388)
- Anderson University (about 23 miles; Anderson, IN; FT enrollment: 2,378)
Public high school in Greenfield:
- GREENFIELD-CENTRAL HIGH SCH (Students: 1,347, Location: 810 N BROADWAY, Grades: 9-12)
Public elementary/middle schools in Greenfield:
- J B STEPHENS ELEMENTARY SCHOOL (Students: 893, Location: 1331 N BLUE RD, Grades: PK-3)
- MT COMFORT ELEMENTARY SCHOOL (Students: 566, Location: 5694 W 300 N, Grades: PK-5)
- WESTON ELEMENTARY SCHOOL (Students: 522, Location: 140 POLK ST, Grades: KG-3)
- HARRIS ELEMENTARY SCHOOL (Students: 494, Location: 200 W PARK AVE, Grades: KG-3)
- EDEN ELEMENTARY SCHOOL (Students: 360, Location: 8185 N SR 9, Grades: KG-3)
- BRANDYWINE ELEMENTARY SCHOOL (Students: 277, Location: 413 E 400 S, Grades: KG-6)
- GREENFIELD INTERMEDIATE SCHOOL (Location: 204 W PARK AVE, Grades: 4-6)
- GREENFIELD CENTRAL JUNIOR HIGH SCH (Location: 1440 N FRANKLIN, Grades: 7-8)
Private elementary/middle school in Greenfield:
Library in Greenfield:
User-submitted facts and corrections:
- The HCPLibrary's New Address is 900 West McKenzie Rd.
Points of interest:
Notable locations in Greenfield: Greenfield Fire Department Station 1 Headquarters (A), Greenfield Fire Department Station 2 (B). Display/hide their locations on the map
Churches in Greenfield include: Trinity Park United Methodist Church (A), Greenfield Friends Church (B), Church of God (C), Saint Michaels Church (D), Bradley United Methodist Church (E), First Presbyterian Church (F), First Baptist Church (G), First Christian Church (H), Protestant Church of Greenfield (I). Display/hide their locations on the map
Cemetery: Park Cemetery (1). Display/hide its location on the map
Lake: Roberts Lake (A). Display/hide its location on the map
Parks in Greenfield include: Riley Memorial Park (1), Greenfield Courthouse Square Historic District (2). Display/hide their locations on the map
Tourist attractions: Hancock County Historical Society & Museums (28 North Apple), Riley Home Museum (Historical Places & Services; 250 West Main Street), Riley Festival (Amusement & Theme Parks; 312 East Main Street Suite C), Hancock County Visitors Bureau (1 Court House Plaza).
Hotels: Budget Motel (1310 West Main Street), Economy Motel (3638 West US Highway 40), Liberty Motel (1039 East Main Street), Dollar Inn (2180 North State Street), Comfort Inn Greenfield (178 East Martindale Drive), Lees Inn Greenfield (2270 North State Street).
Birthplace of: James Whitcomb Riley - Poet, Kevin "Yogi" Ferrell - Basketball player, Cassie Andrews - Figure skater.
Drinking water stations with addresses in Greenfield and their reported violations in the past:
PIPE CREEK SOUTH REST AREA (Population served: 600, Groundwater):Past health violations:S & H CAMPGROUND (Population served: 500, Groundwater):
- MCL, Monthly (TCR) - In SEP-2011, Contaminant: Coliform. Follow-up actions: St Public Notif requested (OCT-03-2011), St Violation/Reminder Notice (OCT-03-2011), St Boil Water Order (OCT-03-2011), St Compliance achieved (MAR-09-2012)
Past health violations:S & H CAMPGROUND (Population served: 500, Groundwater):Past monitoring violations:
- MCL, Monthly (TCR) - In SEP-2006, Contaminant: Coliform. Follow-up actions: St Violation/Reminder Notice (NOV-01-2006), St Public Notif requested (NOV-01-2006), St Boil Water Order (NOV-01-2006), Fed Violation/Reminder Notice (MAY-13-2008), St Compliance achieved (MAR-23-2010), Fed Intentional no-action (JUN-02-2011)
- Monitoring, Source Water (GWR) - In OCT-01-2011, Contaminant: E. COLI. Follow-up actions: St Public Notif requested (OCT-26-2011), St Violation/Reminder Notice (OCT-26-2011), St Compliance achieved (MAR-16-2012)
- 18 routine major monitoring violations
- 2 regular monitoring violations
Past health violations:REAL LIFE CHURCH (Population served: 250, Groundwater):Past monitoring violations:
- MCL, Monthly (TCR) - In SEP-2010, Contaminant: Coliform. Follow-up actions: St Violation/Reminder Notice (OCT-25-2010), St Public Notif requested (OCT-25-2010), St Formal NOV issued (2 times from DEC-15-2010 to JAN-14-2011), St Public Notif received (APR-26-2011), St AO (w/penalty) issued (MAY-12-2011), St Compliance achieved (2 times from JUN-15-2012 to MAY-22-2013)
- MCL, Monthly (TCR) - In JUN-2010, Contaminant: Coliform. Follow-up actions: St Formal NOV issued (2 times from DEC-15-2010 to JAN-14-2011), St Violation/Reminder Notice (FEB-24-2011), St Public Notif requested (FEB-24-2011), St Public Notif received (APR-26-2011), St AO (w/penalty) issued (MAY-12-2011), St Compliance achieved (2 times from JUN-15-2012 to MAY-22-2013)
- MCL, Monthly (TCR) - In SEP-2006, Contaminant: Coliform. Follow-up actions: St Public Notif requested (OCT-11-2006), St Violation/Reminder Notice (OCT-11-2006), St Compliance achieved (MAR-23-2010)
- Monitoring, Source Water (GWR) - In OCT-01-2011, Contaminant: E. COLI. Follow-up actions: St Public Notif requested (OCT-26-2011), St Violation/Reminder Notice (OCT-26-2011), St Compliance achieved (MAR-16-2012)
- Monitoring, Source Water (GWR) - In OCT-19-2010, Contaminant: E. COLI. Follow-up actions: St Violation/Reminder Notice (OCT-20-2010), St Public Notif requested (OCT-20-2010), St Formal NOV issued (2 times from DEC-15-2010 to JAN-14-2011), St Public Notif received (APR-26-2011), St AO (w/penalty) issued (MAY-12-2011), St Compliance achieved (2 times from JUN-15-2012 to MAY-22-2013)
- Monitoring, Repeat Major (TCR) - In SEP-2010, Contaminant: Coliform (TCR). Follow-up actions: St Violation/Reminder Notice (OCT-20-2010), St Public Notif requested (OCT-20-2010), St Formal NOV issued (2 times from DEC-15-2010 to JAN-14-2011), St Public Notif received (APR-26-2011), St AO (w/penalty) issued (MAY-12-2011), St Compliance achieved (2 times from JUN-15-2012 to MAY-22-2013)
- 9 routine major monitoring violations
- One minor monitoring violation
- 2 regular monitoring violations
Past health violations:PHILADELPHIA UNITED METHODIST (Population served: 60, Groundwater):Past monitoring violations:
- MCL, Monthly (TCR) - In APR-2009, Contaminant: Coliform. Follow-up actions: St Public Notif requested (MAY-07-2009), St Violation/Reminder Notice (MAY-07-2009), St Compliance achieved (2 times from MAR-23-2010 to DEC-29-2011)
- Monitoring, Repeat Major (TCR) - In APR-2009, Contaminant: Coliform (TCR). Follow-up actions: St Public Notif requested (MAY-07-2009), St Violation/Reminder Notice (MAY-07-2009), St Compliance achieved (2 times from MAR-23-2010 to DEC-29-2011)
- 7 routine major monitoring violations
- One regular monitoring violation
Past health violations:SHAMROCK MOTEL (Population served: 36, Groundwater):
- MCL, Monthly (TCR) - In JUL-2013, Contaminant: Coliform. Follow-up actions: St Boil Water Order (AUG-12-2013), St Violation/Reminder Notice (AUG-12-2013), St Public Notif requested (AUG-12-2013), St Public Notif received (SEP-05-2013), St Compliance achieved (OCT-11-2013)
- MCL, Monthly (TCR) - In JUL-2012, Contaminant: Coliform. Follow-up actions: St Boil Water Order (JUL-27-2012), St Public Notif requested (JUL-27-2012), St Violation/Reminder Notice (JUL-27-2012), St Public Notif received (AUG-22-2012), St Compliance achieved (DEC-12-2012)
- MCL, Monthly (TCR) - In JUL-2005, Contaminant: Coliform. Follow-up actions: St Violation/Reminder Notice (AUG-12-2005), St Public Notif received (AUG-12-2005), St Public Notif requested (AUG-12-2005), St Compliance achieved (MAR-23-2010)
Past monitoring violations:OTTERBEIN CHURCH (Population served: 25, Groundwater):
- 4 routine major monitoring violations
- One regular monitoring violation
Past health violations:Past monitoring violations:
- MCL, Monthly (TCR) - In MAY-2009, Contaminant: Coliform. Follow-up actions: St Boil Water Order (MAY-26-2009), St Violation/Reminder Notice (MAY-26-2009), St Public Notif requested (MAY-26-2009), St Public Notif received (JUN-01-2009), St Compliance achieved (MAR-23-2010)
- MCL, Monthly (TCR) - In FEB-2009, Contaminant: Coliform. Follow-up actions: St Public Notif requested (FEB-20-2009), St Violation/Reminder Notice (FEB-20-2009), St Public Notif received (FEB-21-2009), St Compliance achieved (MAR-23-2010)
- One routine major monitoring violation
Drinking water stations with addresses in Greenfield that have no violations reported:
- GREENFIELD WATER UTILITY (Population served: 20,602, Primary Water Source Type: Groundwater)
- PIPE CREEK NORTH REST AREA (Population served: 600, Primary Water Source Type: Groundwater)
| This city: | 2.5 people |
| Indiana: | 2.5 people |
| This city: | 67.4% |
| Whole state: | 66.9% |
| This city: | 7.7% |
| Whole state: | 6.9% |
Likely homosexual households (counted as self-reported same-sex unmarried-partner households)
- Lesbian couples: 0.3% of all households
- Gay men: 0.3% of all households
People in group quarters in Greenfield in 2010:
- 329 people in nursing facilities/skilled-nursing facilities
- 168 people in local jails and other municipal confinement facilities
- 22 people in group homes intended for adults
- 17 people in emergency and transitional shelters (with sleeping facilities) for people experiencing homelessness
- 12 people in other noninstitutional facilities
People in group quarters in Greenfield in 2000:
- 200 people in nursing homes
- 106 people in local jails and other confinement facilities (including police lockups)
- 16 people in homes for the mentally retarded
- 3 people in other noninstitutional group quarters
- 2 people in other nonhousehold living situations
Banks with most branches in Greenfield (2011 data):
- Greenfield Banking Company: at 1920 North State Street, Meridian Road Branch, East Main Street Branch. Info updated 2006/11/03: Bank assets: $397.1 mil, Deposits: $349.8 mil, local headquarters, positive income, 7 total offices, Holding Company: Greenfield Bancshares, Inc.
- Flagstar Bank, FSB: Greenfield Branch at 1965 North State Street, branch established on 2001/10/24. Info updated 2011/07/21: Bank assets: $13,623.5 mil, Deposits: $7,802.8 mil, headquarters in Troy, MI, negative income in the last year, Mortgage Lending Specialization, 135 total offices
- Ameriana Bank: 1810 N. State Street Branch at 1810 North State Street, branch established on 1883/01/01. Info updated 2009/08/07: Bank assets: $427.2 mil, Deposits: $341.0 mil, headquarters in New Castle, IN, positive income, Commercial Lending Specialization, 13 total offices, Holding Company: Ameriana Bancorp
- STAR Financial Bank: Greenfield Branch at 230 East New Road, branch established on 2004/09/13. Info updated 2006/11/03: Bank assets: $1,622.5 mil, Deposits: $1,346.4 mil, headquarters in Fort Wayne, IN, positive income, Commercial Lending Specialization, 48 total offices, Holding Company: Star Financial Group, Inc.
- Union Savings and Loan Association: Greenfield Branch at 1986 West Main Street, branch established on 1997/04/01. Info updated 2011/07/21: Bank assets: $128.3 mil, Deposits: $112.0 mil, headquarters in Connersville, IN, positive income, Mortgage Lending Specialization, 3 total offices
- PNC Bank, National Association: Greenfield Central Branch at 1503 North State Street, branch established on 2002/01/24. Info updated 2012/03/20: Bank assets: $263,309.6 mil, Deposits: $197,343.0 mil, headquarters in Wilmington, DE, positive income, Commercial Lending Specialization, 3085 total offices, Holding Company: Pnc Financial Services Group, Inc., The
- Old National Bank: Greenfield/Marsh Branch at 1240 North State Street, branch established on 2003/10/22. Info updated 2011/08/01: Bank assets: $8,467.9 mil, Deposits: $6,653.1 mil, headquarters in Evansville, IN, positive income, 195 total offices, Holding Company: Old National Bancorp
- Fifth Third Bank: Brandywine Plaza Branch at 1571 North State Street, branch established on 1994/12/11. Info updated 2009/10/05: Bank assets: $114,540.4 mil, Deposits: $89,689.1 mil, headquarters in Cincinnati, OH, positive income, Commercial Lending Specialization, 1378 total offices, Holding Company: Fifth Third Bancorp
- JPMorgan Chase Bank, National Association: Greenfield Banking Center Branch at 2057 North State Street, branch established on 2004/12/29. Info updated 2011/11/10: Bank assets: $1,811,678.0 mil, Deposits: $1,190,738.0 mil, headquarters in Columbus, OH, positive income, International Specialization, 5577 total offices, Holding Company: Jpmorgan Chase & Co.
For population 15 years and over in Greenfield:
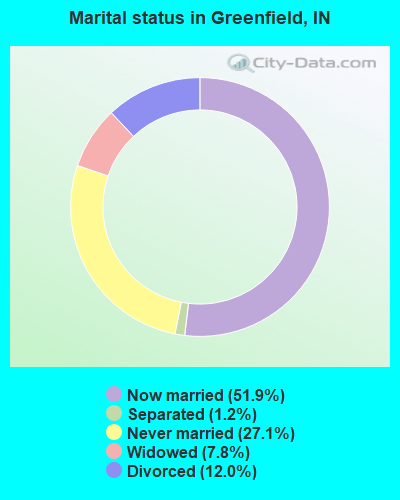
- Never married: 27.1%
- Now married: 51.9%
- Separated: 1.2%
- Widowed: 7.8%
- Divorced: 12.0%
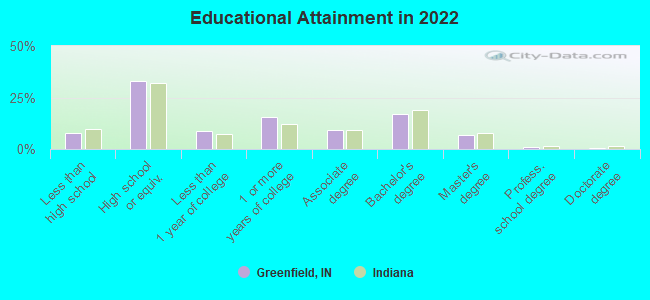
For population 25 years and over in Greenfield:
- High school or higher: 91.8%
- Bachelor's degree or higher: 23.7%
- Graduate or professional degree: 9.2%
- Unemployed: 3.0%
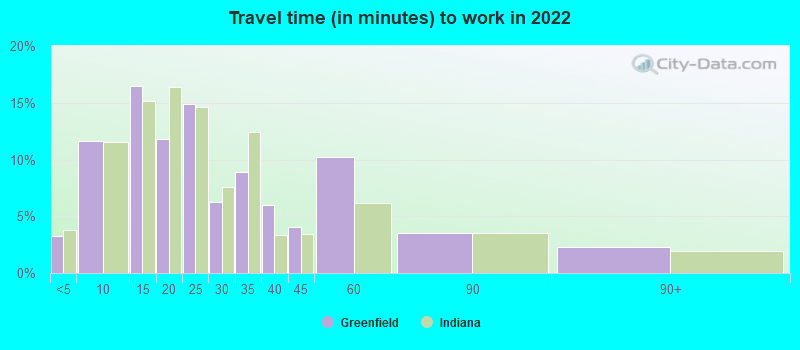
- Mean travel time to work (commute): 20.9 minutes
| Here: | 10.7 |
| Indiana average: | 11.3 |
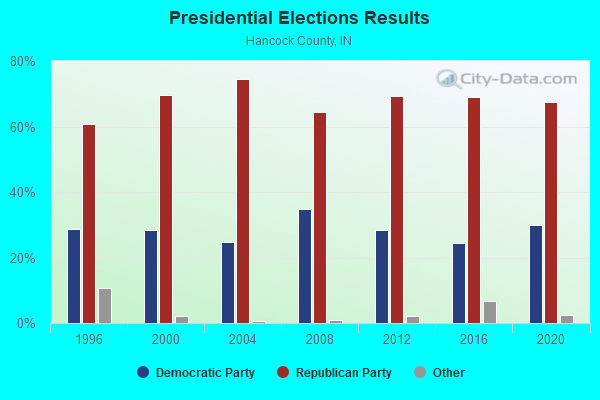
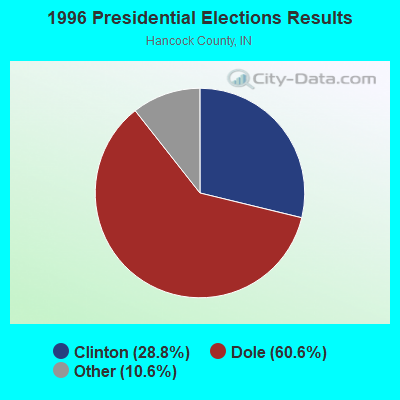
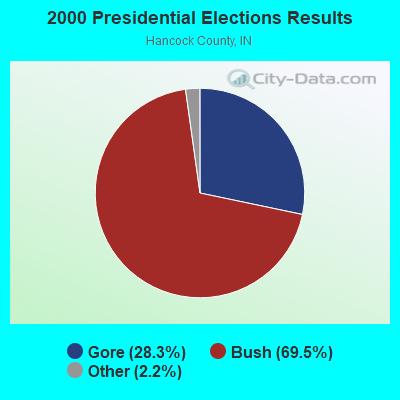
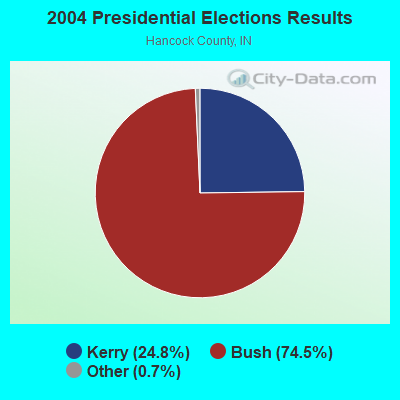
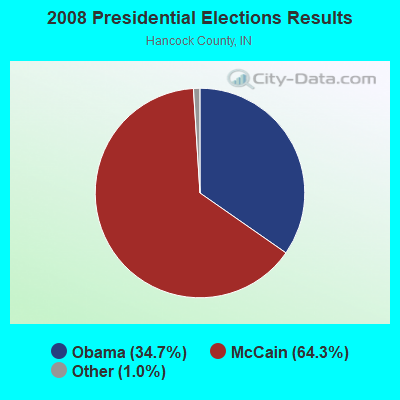


Graphs represent county-level data. Detailed 2008 Election Results
Religion statistics for Greenfield, IN (based on Hancock County data)
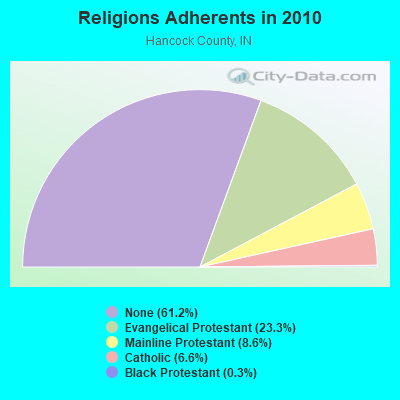
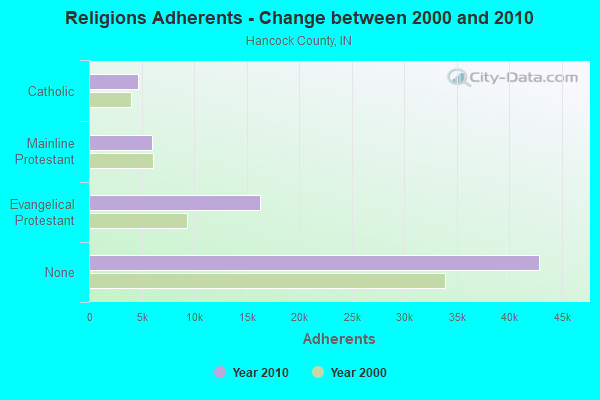
| Religion | Adherents | Congregations |
|---|---|---|
| Evangelical Protestant | 16,311 | 51 |
| Mainline Protestant | 5,998 | 25 |
| Catholic | 4,626 | 2 |
| Black Protestant | 188 | 1 |
| Other | 24 | 2 |
| None | 42,855 | - |
Food Environment Statistics:
| This county: | 0.61 / 10,000 pop. |
| Indiana: | 1.73 / 10,000 pop. |
| Hancock County: | 0.15 / 10,000 pop. |
| State: | 0.21 / 10,000 pop. |
| Hancock County: | 0.15 / 10,000 pop. |
| Indiana: | 0.50 / 10,000 pop. |
| Hancock County: | 2.87 / 10,000 pop. |
| Indiana: | 3.57 / 10,000 pop. |
| Hancock County: | 4.54 / 10,000 pop. |
| State: | 6.78 / 10,000 pop. |
| Hancock County: | 9.7% |
| Indiana: | 9.2% |
| Here: | 28.3% |
| State: | 29.0% |
| This county: | 22.7% |
| Indiana: | 14.3% |
Health and Nutrition:
| This city: | 49.3% |
| Indiana: | 49.3% |
| This city: | 46.6% |
| Indiana: | 46.2% |
| This city: | 29.1 |
| Indiana: | 28.7 |
| Here: | 21.1% |
| Indiana: | 21.3% |
| Greenfield: | 10.5% |
| Indiana: | 10.6% |
| Here: | 6.8 |
| State: | 6.8 |
| Greenfield: | 35.4% |
| Indiana: | 33.9% |
| This city: | 56.9% |
| State: | 56.1% |
| Here: | 78.2% |
| Indiana: | 78.7% |
More about Health and Nutrition of Greenfield, IN Residents
| Local government employment and payroll (March 2022) | |||||
| Function | Full-time employees | Monthly full-time payroll | Average yearly full-time wage | Part-time employees | Monthly part-time payroll |
|---|---|---|---|---|---|
| Firefighters | 49 | $324,331 | $79,428 | 6 | $1,824 |
| Police Protection - Officers | 40 | $235,263 | $70,579 | 0 | $0 |
| Other and Unallocable | 32 | $156,705 | $58,764 | 0 | $0 |
| Electric Power | 24 | $148,616 | $74,308 | 1 | $1,120 |
| Sewerage | 15 | $73,572 | $58,858 | 0 | $0 |
| Water Supply | 15 | $77,551 | $62,041 | 0 | $0 |
| Financial Administration | 14 | $71,207 | $61,035 | 0 | $0 |
| Parks and Recreation | 12 | $45,218 | $45,218 | 9 | $6,683 |
| Streets and Highways | 12 | $50,583 | $50,583 | 0 | $0 |
| Health | 7 | $28,212 | $48,363 | 0 | $0 |
| Police - Other | 4 | $15,967 | $47,901 | 3 | $868 |
| Other Government Administration | 2 | $14,986 | $89,916 | 0 | $0 |
| Solid Waste Management | 2 | $12,161 | $72,966 | 0 | $0 |
| Fire - Other | 2 | $8,419 | $50,514 | 1 | $1,275 |
| Transit | 2 | $7,513 | $45,078 | 0 | $0 |
| Totals for Government | 232 | $1,270,305 | $65,705 | 20 | $11,770 |
Greenfield government finances - Expenditure in 2021 (per resident):
- Construction - Parks and Recreation: $134,000 ($5.41)
Regular Highways: $32,000 ($1.29)
Local Fire Protection: $1,000 ($0.04)
- Current Operations - Electric Utilities: $30,251,000 ($1220.54)
Local Fire Protection: $5,192,000 ($209.48)
Central Staff Services: $4,124,000 ($166.39)
Police Protection: $3,289,000 ($132.70)
Sewerage: $3,205,000 ($129.31)
General - Other: $2,499,000 ($100.83)
Water Utilities: $2,159,000 ($87.11)
Parks and Recreation: $1,023,000 ($41.27)
Correctional Institutions: $988,000 ($39.86)
Regular Highways: $883,000 ($35.63)
Health - Other: $650,000 ($26.23)
Financial Administration: $361,000 ($14.57)
Miscellaneous Commercial Activities - Other: $196,000 ($7.91)
Judicial and Legal Services: $103,000 ($4.16)
- General - Interest on Debt: $611,000 ($24.65)
- Other Capital Outlay - Electric Utilities: $1,424,000 ($57.45)
General - Other: $1,407,000 ($56.77)
Water Utilities: $590,000 ($23.80)
Local Fire Protection: $344,000 ($13.88)
Sewerage: $253,000 ($10.21)
Parks and Recreation: $77,000 ($3.11)
Police Protection: $21,000 ($0.85)
Health - Other: $7,000 ($0.28)
Central Staff Services: $3,000 ($0.12)
Financial Administration: $1,000 ($0.04)
Greenfield government finances - Revenue in 2021 (per resident):
- Charges - Sewerage: $11,893,000 ($479.85)
Other: $1,716,000 ($69.24)
Parks and Recreation: $487,000 ($19.65)
Miscellaneous Commercial Activities: $181,000 ($7.30)
Parking Facilities: $1,000 ($0.04)
- Federal Intergovernmental - Other: $22,000 ($0.89)
- Local Intergovernmental - Highways: $392,000 ($15.82)
Other: $90,000 ($3.63)
- Miscellaneous - General Revenue - Other: $1,631,000 ($65.81)
Donations From Private Sources: $624,000 ($25.18)
Interest Earnings: $54,000 ($2.18)
Sale of Property: $27,000 ($1.09)
Rents: $13,000 ($0.52)
- Revenue - Electric Utilities: $39,041,000 ($1575.19)
Water Utilities: $7,851,000 ($316.76)
- State Intergovernmental - Other: $7,552,000 ($304.70)
General Local Government Support: $975,000 ($39.34)
Highways: $782,000 ($31.55)
- Tax - Property: $12,431,000 ($501.55)
Other License: $199,000 ($8.03)
Occupation and Business License - Other: $1,000 ($0.04)
Greenfield government finances - Debt in 2021 (per resident):
- Long Term Debt - Outstanding Unspecified Public Purpose: $21,045,000 ($849.10)
Beginning Outstanding - Unspecified Public Purpose: $21,045,000 ($849.10)
Greenfield government finances - Cash and Securities in 2021 (per resident):
- Bond Funds - Cash and Securities: $1,420,000 ($57.29)
- Other Funds - Cash and Securities: $46,083,000 ($1859.31)
- Sinking Funds - Cash and Securities: $1,322,000 ($53.34)
| Businesses in Greenfield, IN | ||||
| Name | Count | Name | Count | |
|---|---|---|---|---|
| AT&T | 1 | Kroger | 1 | |
| Advance Auto Parts | 1 | Little Caesars Pizza | 1 | |
| Applebee's | 1 | Long John Silver's | 1 | |
| Arby's | 1 | MasterBrand Cabinets | 3 | |
| AutoZone | 1 | Maurices | 1 | |
| Bath & Body Works | 1 | McDonald's | 2 | |
| Big O Tires | 1 | Nike | 1 | |
| Blockbuster | 1 | Papa John's Pizza | 1 | |
| Burger King | 2 | Payless | 1 | |
| CVS | 1 | Pizza Hut | 1 | |
| Chevrolet | 1 | Qdoba Mexican Grill | 1 | |
| Circle K | 2 | Quality | 1 | |
| Comfort Inn | 1 | Quiznos | 1 | |
| Cracker Barrel | 1 | RadioShack | 1 | |
| DHL | 1 | SAS Shoes | 1 | |
| Dairy Queen | 1 | Sears | 1 | |
| Dunkin Donuts | 1 | Starbucks | 1 | |
| Fashion Bug | 1 | Steak 'n Shake | 1 | |
| FedEx | 5 | Subway | 3 | |
| Ford | 1 | Super 8 | 1 | |
| GNC | 1 | T-Mobile | 1 | |
| GameStop | 1 | Taco Bell | 1 | |
| H&R Block | 1 | U-Haul | 2 | |
| Hardee's | 2 | UPS | 4 | |
| Hilton | 1 | Walgreens | 1 | |
| Holiday Inn | 1 | Walmart | 1 | |
| Home Depot | 1 | Wendy's | 2 | |
| KFC | 1 | White Castle | 1 | |
Strongest AM radio stations in Greenfield:
- WIBC (1070 AM; 50 kW; INDIANAPOLIS, IN; Owner: EMMIS RADIO LICENSE CORPORATION)
- WNDE (1260 AM; 5 kW; INDIANAPOLIS, IN; Owner: CAPSTAR TX LIMITED PARTNERSHIP)
- WBRI (1500 AM; daytime; 5 kW; INDIANAPOLIS, IN)
- WNTS (1590 AM; 5 kW; BEECH GROVE, IN; Owner: S + M BROADCASTING CO., INC.)
- WLW (700 AM; 50 kW; CINCINNATI, OH; Owner: JACOR BROADCASTING CORPORATION)
- WXLW (950 AM; 5 kW; INDIANAPOLIS, IN)
- WTLC (1310 AM; 5 kW; INDIANAPOLIS, IN; Owner: RADIO ONE OF INDIANA, LLC)
- WXNT (1430 AM; 5 kW; INDIANAPOLIS, IN; Owner: MYSTAR COMMUNICATIONS CORPORATION)
- WOWO (1190 AM; 50 kW; FORT WAYNE, IN; Owner: PATHFINDER COMMUNICATIONS CORPORATION)
- WSAI (1530 AM; 50 kW; CINCINNATI, OH; Owner: JACOR BROADCASTING CORPORATION)
- WHAS (840 AM; 50 kW; LOUISVILLE, KY; Owner: CLEAR CHANNEL BROADCASTING LICENSES, INC.)
- WTVN (610 AM; 50 kW; COLUMBUS, OH; Owner: CITICASTERS LICENSES, L.P.)
- WKWH (1520 AM; 1 kW; SHELBYVILLE, IN; Owner: RSE BROADCASTING, LLC)
Strongest FM radio stations in Greenfield:
- WNOU (93.1 FM; INDIANAPOLIS, IN; Owner: EMMIS RADIO LICENSE CORPORATION)
- WFMS (95.5 FM; INDIANAPOLIS, IN; Owner: WFMS LICO, INC)
- WYXB (105.7 FM; INDIANAPOLIS, IN; Owner: EMMIS RADIO LICENSE CORPORATION)
- WZPL (99.5 FM; GREENFIELD, IN; Owner: MYSTAR COMMUNICATIONS CORPORATION)
- WENS (97.1 FM; SHELBYVILLE, IN; Owner: EMMIS RADIO LICENSE CORPORATION)
- WRGF (89.7 FM; GREENFIELD, IN; Owner: GREENFIELD CENTRAL COMMUNITY SCHOOL CORP.)
- WKWH-FM (94.3 FM; RUSHVILLE, IN; Owner: RSE BROADCASTING, LLC)
- WFBQ (94.7 FM; INDIANAPOLIS, IN; Owner: CAPSTAR TX LIMITED PARTNERSHIP)
- WHHH (96.3 FM; INDIANAPOLIS, IN; Owner: RADIO ONE OF INDIANA, LLC)
- WGLD (104.5 FM; INDIANAPOLIS, IN; Owner: INDY LICO, INC)
- WRZX (103.3 FM; INDIANAPOLIS, IN; Owner: CAPSTAR TX LIMITED PARTNERSHIP)
- WTPI (107.9 FM; INDIANAPOLIS, IN; Owner: MYSTAR COMMUNICATIONS CORPORATION)
- WTTS (92.3 FM; BLOOMINGTON, IN; Owner: SARKES TARZIAN, INC.)
- WGNR-FM (97.9 FM; ANDERSON, IN; Owner: THE MOODY BIBLE INSTITUTE OF CHICAGO)
- WGRL (93.9 FM; NOBLESVILLE, IN; Owner: INDY LICO, INC.)
- WFYI-FM (90.1 FM; INDIANAPOLIS, IN; Owner: METROPOLITAN IN. PUBLIC B/CING, INC.)
- WEDM (91.1 FM; INDIANAPOLIS, IN; Owner: METROPOLITAN SCH. DIST. OF WARREN)
- WQME (98.7 FM; ANDERSON, IN; Owner: ANDERSON UNIVERSITY, INC.)
- WIJY (95.9 FM; FRANKLIN, IN; Owner: PILGRIM COMMUNICATIONS, LLC)
- WJLR (91.5 FM; SEYMOUR, IN; Owner: MIDWEST MINISTRIES, INC.)
TV broadcast stations around Greenfield:
- WXIN (Channel 59; INDIANAPOLIS, IN; Owner: TRIBUNE TELEVISION COMPANY)
- WKOG-LP (Channel 31; INDIANAPOLIS, IN; Owner: KINGDOM OF GOD MINISTRIES, INC.)
- WISH-TV (Channel 8; INDIANAPOLIS, IN; Owner: INDIANA BROADCASTING, LLC)
- WTHR (Channel 13; INDIANAPOLIS, IN; Owner: VIDEOINDIANA, INC.)
- WDNI-LP (Channel 65; INDIANAPOLIS, IN; Owner: RADIO ONE OF INDIANA, LLC)
- WRTV (Channel 6; INDIANAPOLIS, IN; Owner: MCGRAW-HILL BROADCASTING COMPANY, INC.)
- WHMB-TV (Channel 40; INDIANAPOLIS, IN; Owner: LESEA BROADCASTING CORPORATION)
- WIPX-LP (Channel 51; INDIANAPOLIS, IN; Owner: PAXSON COMMUNICATIONS LICENSE COMPANY, LLC)
- WBXI-CA (Channel 47; INDIANAPOLIS, IN; Owner: THE BOX WORLDWIDE LLC)
- WNDY-TV (Channel 23; MARION, IN; Owner: UPN STATIONS GROUP INC.)
- WALV-CA (Channel 50; INDIANAPOLIS, IN; Owner: VIDEOHIO, INC..)
- WFYI (Channel 20; INDIANAPOLIS, IN; Owner: METROPOLITAN INDIANAPOLIS PUBLIC BROADCASTING, INC.)
- WTBU-TV (Channel 69; INDIANAPOLIS, IN; Owner: BUTLER UNIVERSITY)
- WIIH-CA (Channel 11; INDIANAPOLIS, IN; Owner: INDIANA BROADCASTING, LLC)
- WTTV (Channel 4; BLOOMINGTON, IN; Owner: TRIBUNE BROADCAST HOLDINGS, INC.)
- WIPX (Channel 63; BLOOMINGTON, IN; Owner: PAXSON INDIANAPOLIS LICENSE, INC.)
- WCLJ (Channel 42; BLOOMINGTON, IN; Owner: TRINITY BROADCASTING OF INDIANA, INC.)
- WTTK (Channel 29; KOKOMO, IN; Owner: TRIBUNE BROADCAST HOLDINGS, INC.)
- National Bridge Inventory (NBI) Statistics
- 76Number of bridges
- 646ft / 197mTotal length
- $3,414,000Total costs
- 413,001Total average daily traffic
- 97,147Total average daily truck traffic
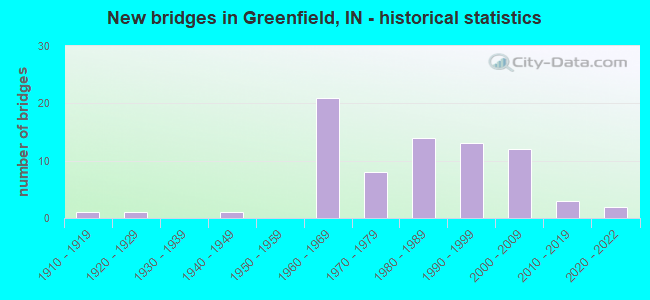
- New bridges - historical statistics
- 11910-1919
- 11920-1929
- 11940-1949
- 211960-1969
- 81970-1979
- 141980-1989
- 131990-1999
- 122000-2009
- 32010-2019
- 22020-2022
FCC Registered Antenna Towers: 164 (See the full list of FCC Registered Antenna Towers)
FCC Registered Commercial Land Mobile Towers: 1 (See the full list of FCC Registered Commercial Land Mobile Towers in Greenfield, IN)
FCC Registered Private Land Mobile Towers: 1 (See the full list of FCC Registered Private Land Mobile Towers)
FCC Registered Broadcast Land Mobile Towers: 38 (See the full list of FCC Registered Broadcast Land Mobile Towers)
FCC Registered Microwave Towers: 14 (See the full list of FCC Registered Microwave Towers in this town)
FCC Registered Paging Towers: 4 (See the full list of FCC Registered Paging Towers)
FCC Registered Maritime Coast & Aviation Ground Towers: 2 (See the full list of FCC Registered Maritime Coast & Aviation Ground Towers)
FCC Registered Amateur Radio Licenses: 296 (See the full list of FCC Registered Amateur Radio Licenses in Greenfield)
FAA Registered Aircraft Manufacturers and Dealers: 7 (See the full list of FAA Registered Manufacturers and Dealers in Greenfield)
FAA Registered Aircraft: 78 (See the full list of FAA Registered Aircraft)
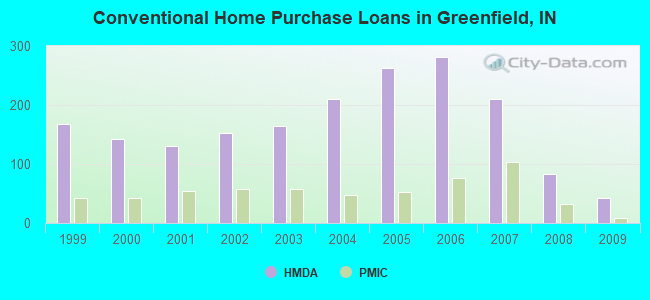
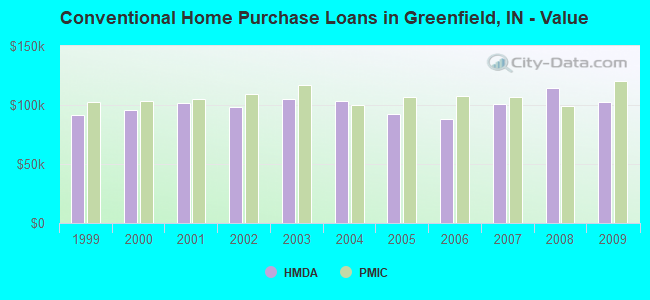
| Home Mortgage Disclosure Act Aggregated Statistics For Year 2009 (Based on 1 full and 2 partial tracts) | ||||||||||||
| A) FHA, FSA/RHS & VA Home Purchase Loans | B) Conventional Home Purchase Loans | C) Refinancings | D) Home Improvement Loans | F) Non-occupant Loans on < 5 Family Dwellings (A B C & D) | G) Loans On Manufactured Home Dwelling (A B C & D) | |||||||
|---|---|---|---|---|---|---|---|---|---|---|---|---|
| Number | Average Value | Number | Average Value | Number | Average Value | Number | Average Value | Number | Average Value | Number | Average Value | |
| LOANS ORIGINATED | 70 | $107,780 | 42 | $102,315 | 273 | $125,920 | 13 | $24,595 | 17 | $68,435 | 2 | $51,640 |
| APPLICATIONS APPROVED, NOT ACCEPTED | 3 | $108,073 | 7 | $126,234 | 23 | $140,398 | 2 | $6,645 | 2 | $63,840 | 0 | $0 |
| APPLICATIONS DENIED | 12 | $88,127 | 4 | $106,628 | 108 | $114,487 | 6 | $19,118 | 4 | $71,265 | 0 | $0 |
| APPLICATIONS WITHDRAWN | 11 | $105,996 | 10 | $100,205 | 70 | $121,617 | 0 | $0 | 7 | $83,680 | 1 | $44,990 |
| FILES CLOSED FOR INCOMPLETENESS | 2 | $135,470 | 1 | $69,990 | 6 | $126,313 | 0 | $0 | 0 | $0 | 0 | $0 |
Detailed HMDA statistics for the following Tracts: 4104.00 , 4105.00, 4106.00
| Private Mortgage Insurance Companies Aggregated Statistics For Year 2009 (Based on 1 full and 2 partial tracts) | ||||||
| A) Conventional Home Purchase Loans | B) Refinancings | C) Non-occupant Loans on < 5 Family Dwellings (A & B) | ||||
|---|---|---|---|---|---|---|
| Number | Average Value | Number | Average Value | Number | Average Value | |
| LOANS ORIGINATED | 9 | $120,128 | 21 | $136,201 | 0 | $0 |
| APPLICATIONS APPROVED, NOT ACCEPTED | 3 | $215,633 | 4 | $147,195 | 1 | $74,280 |
| APPLICATIONS DENIED | 2 | $382,645 | 5 | $135,298 | 0 | $0 |
| APPLICATIONS WITHDRAWN | 0 | $0 | 4 | $192,570 | 0 | $0 |
| FILES CLOSED FOR INCOMPLETENESS | 0 | $0 | 1 | $145,500 | 0 | $0 |
Detailed PMIC statistics for the following Tracts: 4104.00 , 4105.00, 4106.00
2002 - 2017 National Fire Incident Reporting System (NFIRS) incidents
- Fire incident types reported to NFIRS in Greenfield, IN
- 90945.3%Outside Fires
- 66733.3%Structure Fires
- 32216.1%Mobile Property/Vehicle Fires
- 1075.3%Other
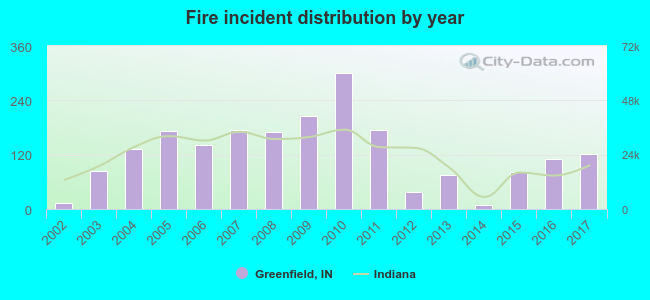 Based on the data from the years 2002 - 2017 the average number of fires per year is 125. The highest number of reported fire incidents - 301 took place in 2010, and the least - 8 in 2014. The data has an increasing trend.
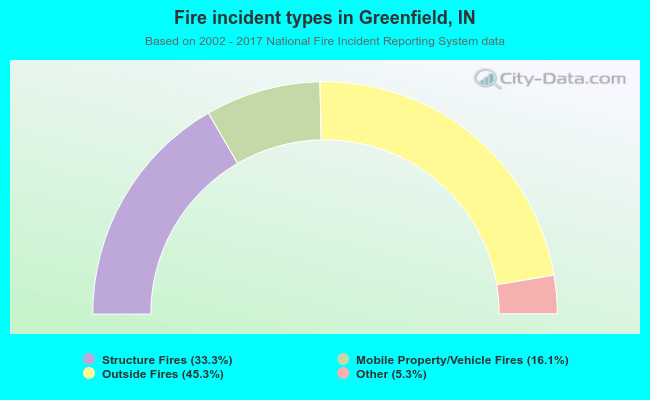 When looking into fire subcategories, the most reports belonged to: Outside Fires (45.3%), and Structure Fires (33.3%).
Fire-safe hotels and motels in Greenfield, Indiana:
- Quality Inn & Suites, 2270 N State St, Greenfield, Indiana 46140 , Phone: (317) 462-7112, Fax: (317) 462-9801
- Country Inn & Suites, 2070 N State St, Greenfield, Indiana 46140 , Phone: (317) 467-0999
- Comfort Inn Greenfield, 178 E Martindale Dr, Greenfield, Indiana 46140 , Phone: (317) 467-9999, Fax: (317) 467-9999
- Hampton Inn, 2271 William Way, Greenfield, Indiana 46140 , Phone: (317) 467-0700, Fax: (317) 467-0777
- Holiday Inn Express, 321 Barrett Dr, Greenfield, Indiana 46140 , Phone: (317) 318-9859
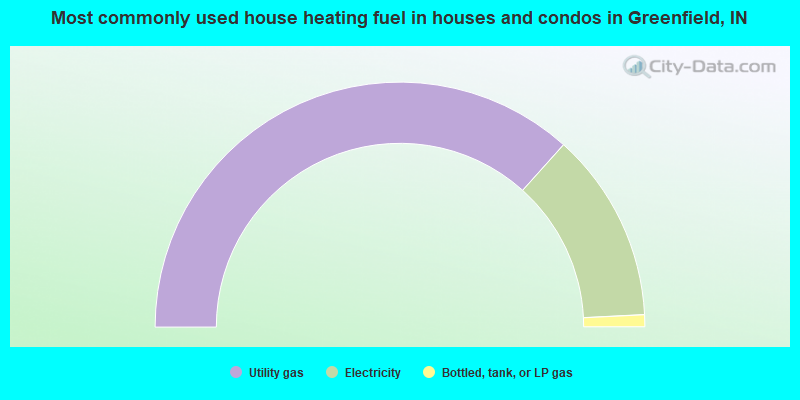
- 73.3%Utility gas
- 25.1%Electricity
- 1.6%Bottled, tank, or LP gas
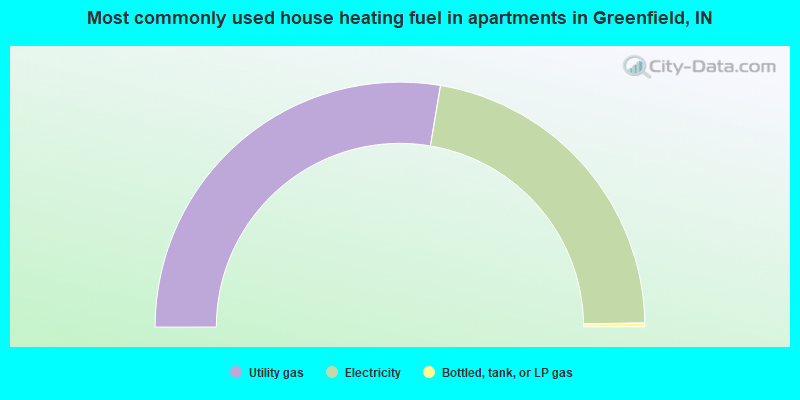
- 55.3%Utility gas
- 44.2%Electricity
- 0.5%Bottled, tank, or LP gas
Greenfield compared to Indiana state average:
- Unemployed percentage significantly below state average.
- Black race population percentage significantly below state average.
- Hispanic race population percentage below state average.
- Median age below state average.
- Length of stay since moving in above state average.
- House age below state average.
- Number of college students above state average.

|
|
Total of 268 patent applications in 2008-2024.