Hartford, Vermont
Submit your own pictures of this town and show them to the world
- OSM Map
- General Map
- Google Map
- MSN Map
Population change since 2000: -4.0%
 |
| Males: 4,733 | |
| Females: 5,219 |
| Median resident age: | 43.3 years |
| Vermont median age: | 45.8 years |
Zip codes: 05001.
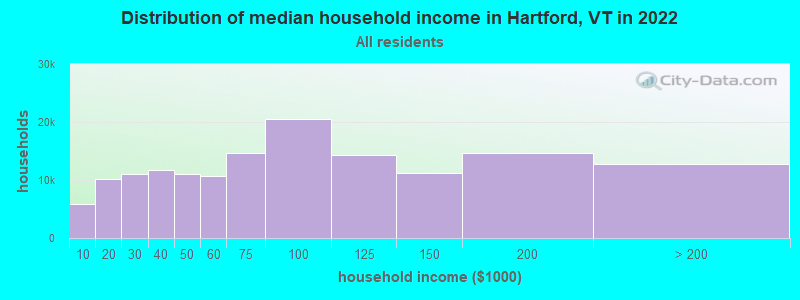
| Hartford: | $73,401 |
| VT: | $73,991 |
Estimated per capita income in 2022: $44,599 (it was $22,792 in 2000)
Hartford town income, earnings, and wages data
Estimated median house or condo value in 2022: $287,032 (it was $115,200 in 2000)
| Hartford: | $287,032 |
| VT: | $304,700 |
Mean prices in 2022: all housing units: $358,264; detached houses: $381,996; townhouses or other attached units: $340,107; in 2-unit structures: $283,645; in 3-to-4-unit structures: $498,076; in 5-or-more-unit structures: $190,965; mobile homes: $75,013
Detailed information about poverty and poor residents in Hartford, VT


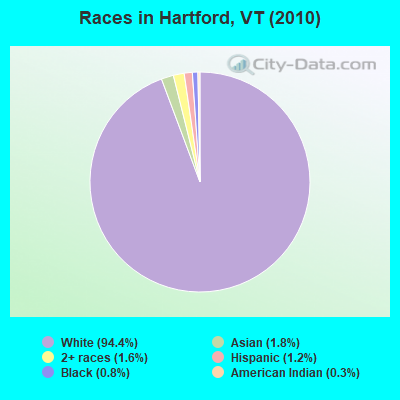
- 9,39094.4%White alone
- 1751.8%Asian alone
- 1591.6%Two or more races
- 1161.2%Hispanic
- 770.8%Black alone
- 280.3%American Indian alone
- 50.05%Other race alone
- 20.02%Native Hawaiian and Other
Pacific Islander alone
Races in Hartford detailed stats: ancestries, foreign born residents, place of birth
According to our research of Vermont and other state lists, there were 2 registered sex offenders living in Hartford, Vermont as of April 28, 2024.
The ratio of all residents to sex offenders in Hartford is 4,976 to 1.
The ratio of registered sex offenders to all residents in this city is much lower than the state average.
Type |
2009 |
2010 |
2011 |
2012 |
2013 |
2014 |
2015 |
2016 |
2017 |
2018 |
2019 |
2020 |
2021 |
2022 |
|---|---|---|---|---|---|---|---|---|---|---|---|---|---|---|
| Murders (per 100,000) | 0 (0.0) | 0 (0.0) | 1 (10.0) | 2 (20.1) | 2 (20.4) | 0 (0.0) | 0 (0.0) | 0 (0.0) | 0 (0.0) | 0 (0.0) | 0 (0.0) | 0 (0.0) | 0 (0.0) | 0 (0.0) |
| Rapes (per 100,000) | 0 (0.0) | 4 (40.2) | 2 (20.1) | 7 (70.4) | 6 (61.2) | 5 (51.1) | 4 (40.8) | 6 (61.6) | 7 (72.7) | 12 (125.4) | 12 (124.3) | 8 (84.1) | 6 (63.0) | 13 (119.7) |
| Robberies (per 100,000) | 0 (0.0) | 0 (0.0) | 3 (30.1) | 0 (0.0) | 3 (30.6) | 0 (0.0) | 0 (0.0) | 2 (20.5) | 5 (51.9) | 0 (0.0) | 4 (41.4) | 1 (10.5) | 2 (21.0) | 0 (0.0) |
| Assaults (per 100,000) | 5 (46.6) | 7 (70.3) | 7 (70.3) | 9 (90.5) | 11 (112.2) | 8 (81.8) | 4 (40.8) | 13 (133.4) | 10 (103.9) | 13 (135.9) | 22 (227.9) | 31 (325.8) | 32 (335.8) | 25 (230.1) |
| Burglaries (per 100,000) | 42 (391.4) | 29 (291.4) | 59 (592.2) | 47 (472.6) | 38 (387.6) | 26 (265.8) | 17 (173.4) | 23 (236.0) | 21 (218.1) | 25 (261.3) | 30 (310.8) | 21 (220.7) | 24 (251.8) | 15 (138.1) |
| Thefts (per 100,000) | 128 (1,193) | 112 (1,125) | 127 (1,275) | 141 (1,418) | 116 (1,183) | 119 (1,217) | 48 (489.7) | 100 (1,026) | 91 (945.2) | 93 (972.1) | 132 (1,367) | 98 (1,030) | 120 (1,259) | 133 (1,224) |
| Auto thefts (per 100,000) | 6 (55.9) | 4 (40.2) | 10 (100.4) | 7 (70.4) | 7 (71.4) | 3 (30.7) | 4 (40.8) | 4 (41.0) | 7 (72.7) | 11 (115.0) | 6 (62.2) | 14 (147.1) | 20 (209.9) | 15 (138.1) |
| Arson (per 100,000) | 0 (0.0) | 0 (0.0) | 0 (0.0) | 4 (40.2) | 0 (0.0) | 1 (10.2) | 0 (0.0) | 1 (10.3) | 1 (10.4) | 0 (0.0) | 0 (0.0) | 0 (0.0) | 0 (0.0) | 1 (9.2) |
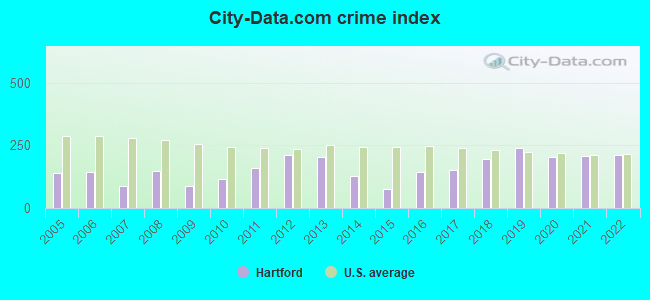
| City-Data.com crime index | 88.9 | 114.9 | 159.7 | 210.1 | 201.6 | 127.0 | 75.8 | 142.9 | 153.4 | 193.9 | 238.9 | 204.0 | 208.6 | 211.5 |
The City-Data.com crime index weighs serious crimes and violent crimes more heavily. Higher means more crime, U.S. average is 246.1. It adjusts for the number of visitors and daily workers commuting into cities.
Crime rate in Hartford detailed stats: murders, rapes, robberies, assaults, burglaries, thefts, arson
Full-time law enforcement employees in 2021, including police officers: 27 (17 officers - 15 male; 2 female).
| Officers per 1,000 residents here: | 1.78 |
| Vermont average: | 1.69 |
 Recent articles from our blog. Our writers, many of them Ph.D. graduates or candidates, create easy-to-read articles on a wide variety of topics.

 | Anyone move to VT from NC, or VT to NC? (107 replies) |
| Driving Thru Vermont-Mountain Recommendation(s) (12 replies) |
| Which larger towns have the most hikes nearby? (12 replies) |
| Best city in Vermont (35 replies) |
| Relocating for job in Springfield -- need school advice (19 replies) |
| Mad River Valley? Questions on possible relocation... (30 replies) |
Latest news from Hartford, VT collected exclusively by city-data.com from local newspapers, TV, and radio stations
Ancestries: English (19.4%), Irish (16.0%), French (11.4%), German (8.6%), Italian (7.1%), United States (6.9%).
Current Local Time: EST time zone
Elevation: 420 feet
Land area: 45.2 square miles.
Population density: 220 people per square mile (very low).
280 residents are foreign born (1.0% North America, 0.9% Europe, 0.6% Asia).
| This town: | 2.7% |
| Vermont: | 3.8% |
| Hartford town: | 2.3% ($2,622) |
| Vermont: | 2.0% ($2,196) |
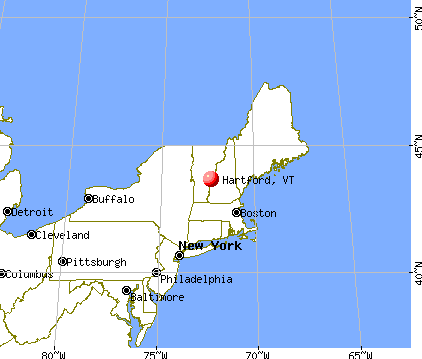
Nearest city with pop. 50,000+: Manchester, NH  (65.9 miles , pop. 107,006).
Nearest city with pop. 200,000+: Boston, MA (113.3 miles , pop. 589,141).
Nearest city with pop. 1,000,000+: Bronx, NY (209.5 miles , pop. 1,332,650).
Nearest cities:
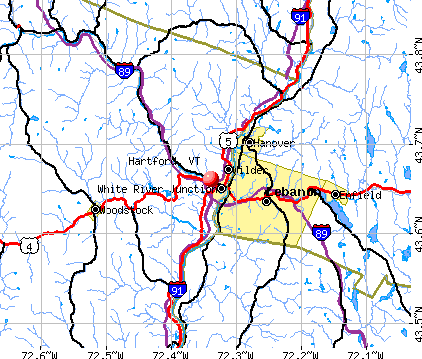
), ), ), ), )Latitude: 43.66 N, Longitude: 72.37 W
Area code commonly used in this area: 802

Hartford, Vermont accommodation & food services, waste management - Economy and Business Data
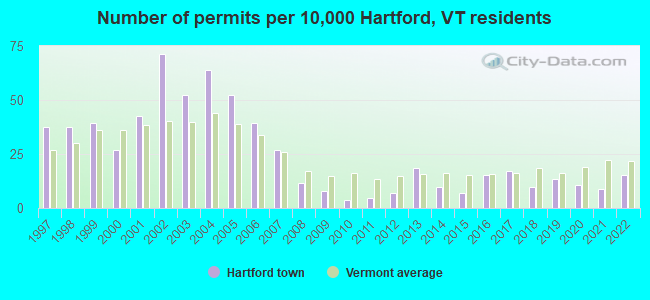
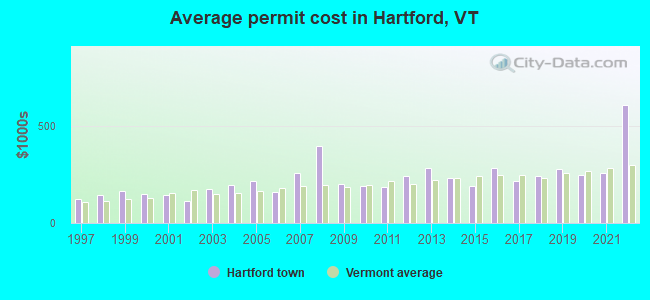
Single-family new house construction building permits:
- 2022: 16 buildings, average cost: $611,600
- 2021: 9 buildings, average cost: $259,200
- 2020: 11 buildings, average cost: $248,200
- 2019: 14 buildings, average cost: $282,200
- 2018: 10 buildings, average cost: $245,400
- 2017: 18 buildings, average cost: $215,800
- 2016: 16 buildings, average cost: $286,800
- 2015: 7 buildings, average cost: $188,600
- 2014: 10 buildings, average cost: $232,300
- 2013: 19 buildings, average cost: $283,700
- 2012: 7 buildings, average cost: $241,200
- 2011: 5 buildings, average cost: $185,400
- 2010: 4 buildings, average cost: $193,700
- 2009: 8 buildings, average cost: $201,000
- 2008: 12 buildings, average cost: $396,800
- 2007: 28 buildings, average cost: $256,500
- 2006: 41 buildings, average cost: $157,800
- 2005: 54 buildings, average cost: $214,700
- 2004: 66 buildings, average cost: $197,300
- 2003: 54 buildings, average cost: $178,100
- 2002: 74 buildings, average cost: $116,100
- 2001: 44 buildings, average cost: $143,300
- 2000: 28 buildings, average cost: $149,900
- 1999: 41 buildings, average cost: $165,100
- 1998: 39 buildings, average cost: $146,100
- 1997: 39 buildings, average cost: $125,400
| Here: | 1.7% |
| Vermont: | 2.0% |
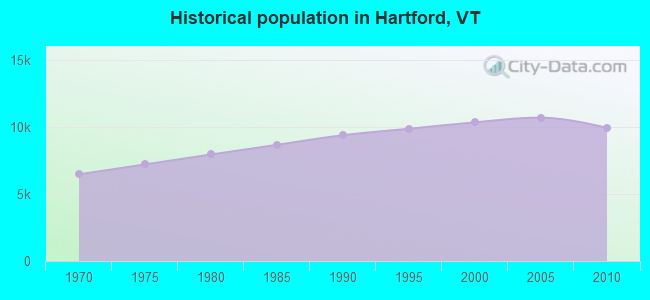
Population change in the 1990s: +943 (+10.0%).
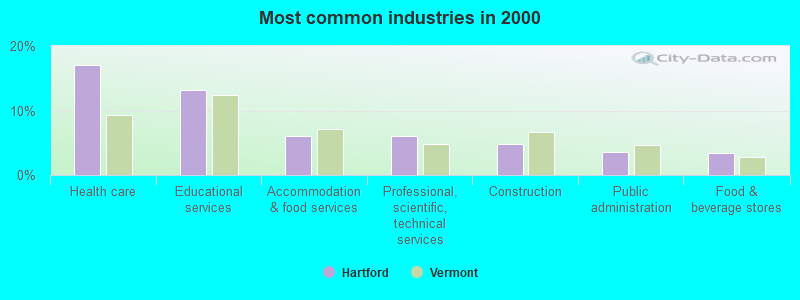
- Health care (17.1%)
- Educational services (13.1%)
- Accommodation & food services (6.1%)
- Professional, scientific, technical services (6.1%)
- Construction (4.9%)
- Public administration (3.6%)
- Food & beverage stores (3.4%)
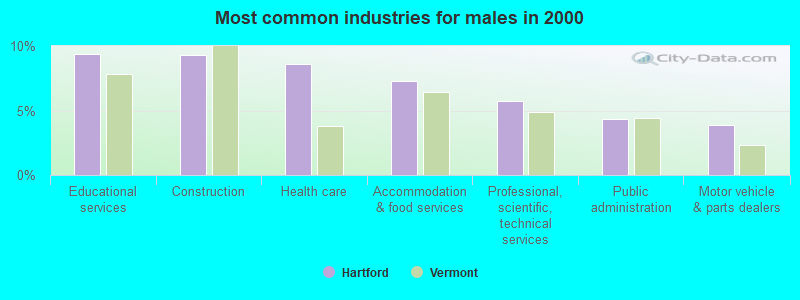
- Educational services (9.4%)
- Construction (9.3%)
- Health care (8.6%)
- Accommodation & food services (7.3%)
- Professional, scientific, technical services (5.7%)
- Public administration (4.3%)
- Motor vehicle & parts dealers (3.9%)
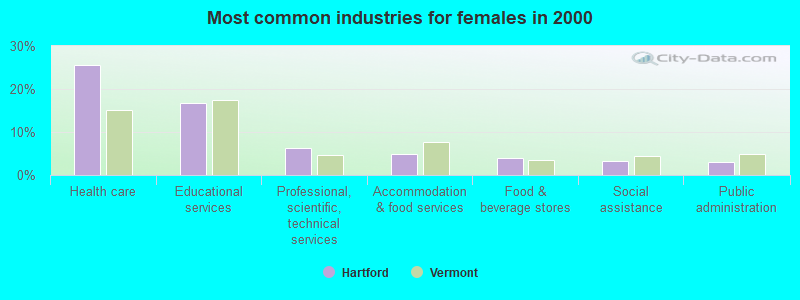
- Health care (25.5%)
- Educational services (16.8%)
- Professional, scientific, technical services (6.4%)
- Accommodation & food services (5.0%)
- Food & beverage stores (3.9%)
- Social assistance (3.3%)
- Public administration (3.0%)
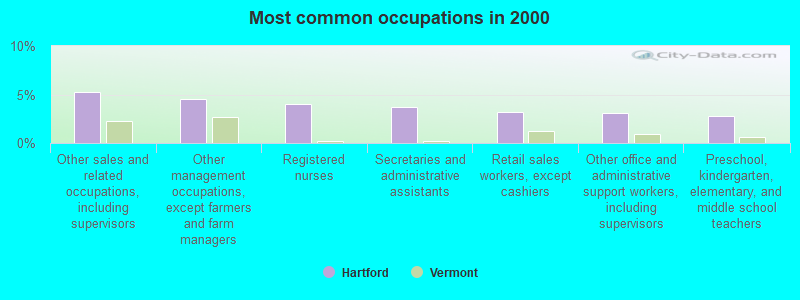
- Other sales and related occupations, including supervisors (5.3%)
- Other management occupations, except farmers and farm managers (4.5%)
- Registered nurses (4.1%)
- Secretaries and administrative assistants (3.7%)
- Retail sales workers, except cashiers (3.2%)
- Other office and administrative support workers, including supervisors (3.1%)
- Preschool, kindergarten, elementary, and middle school teachers (2.7%)
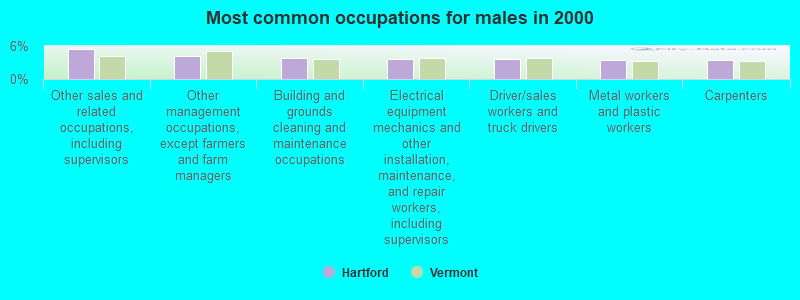
- Other sales and related occupations, including supervisors (5.4%)
- Other management occupations, except farmers and farm managers (4.3%)
- Building and grounds cleaning and maintenance occupations (3.7%)
- Electrical equipment mechanics and other installation, maintenance, and repair workers, including supervisors (3.7%)
- Driver/sales workers and truck drivers (3.6%)
- Metal workers and plastic workers (3.5%)
- Carpenters (3.4%)
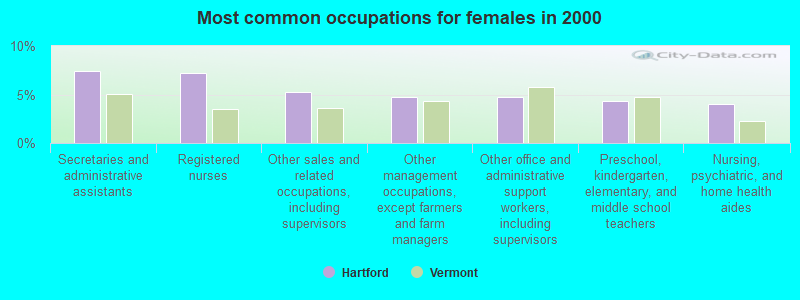
- Secretaries and administrative assistants (7.4%)
- Registered nurses (7.2%)
- Other sales and related occupations, including supervisors (5.2%)
- Other management occupations, except farmers and farm managers (4.8%)
- Other office and administrative support workers, including supervisors (4.7%)
- Preschool, kindergarten, elementary, and middle school teachers (4.3%)
- Nursing, psychiatric, and home health aides (4.0%)
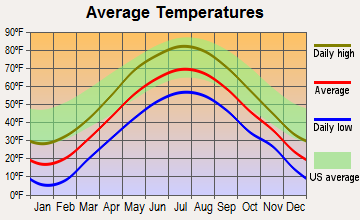
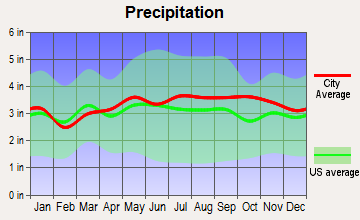
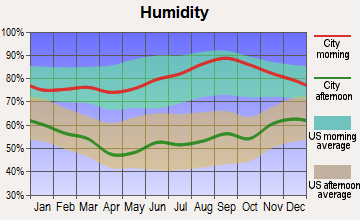
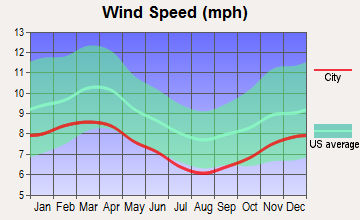
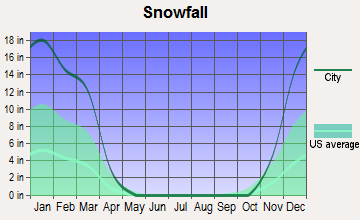
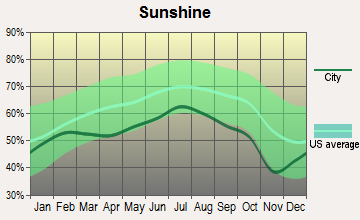
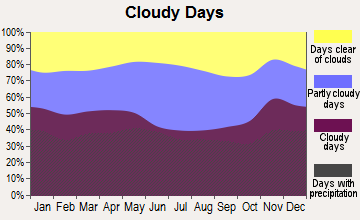
Average climate in Hartford, Vermont
Based on data reported by over 4,000 weather stations
(lower is better)
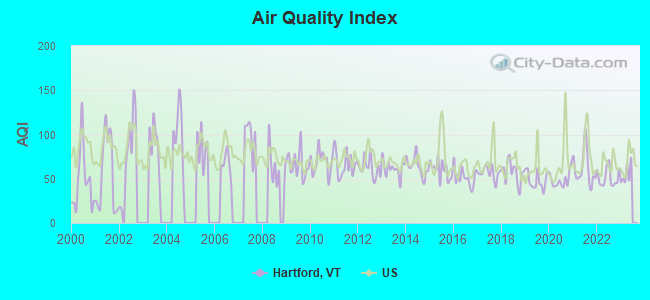
Air Quality Index (AQI) level in 2022 was 51.4. This is significantly better than average.
| City: | 51.4 |
| U.S.: | 72.6 |
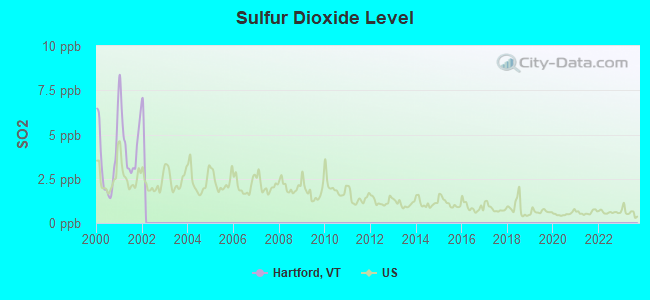
Sulfur Dioxide (SO2) [ppb] level in 2001 was 4.62. This is significantly worse than average. Closest monitor was 20.9 miles away from the city center.
| City: | 4.62 |
| U.S.: | 1.51 |
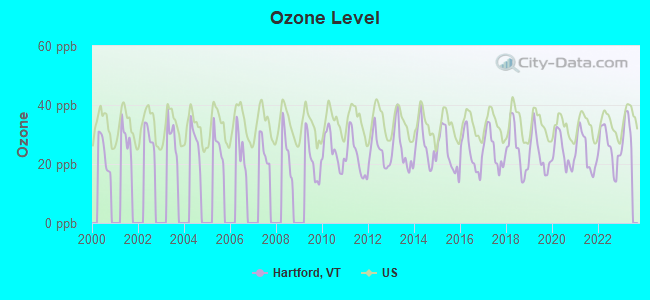
Ozone [ppb] level in 2022 was 25.3. This is better than average. Closest monitor was 2.9 miles away from the city center.
| City: | 25.3 |
| U.S.: | 33.3 |
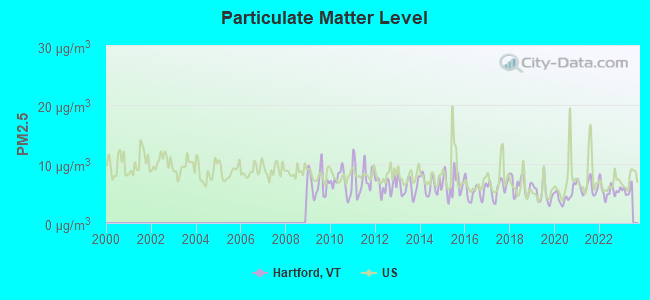
Particulate Matter (PM2.5) [µg/m3] level in 2022 was 5.54. This is significantly better than average. Closest monitor was 4.0 miles away from the city center.
| City: | 5.54 |
| U.S.: | 8.11 |
Tornado activity:
Hartford-area historical tornado activity is slightly above Vermont state average. It is 67% smaller than the overall U.S. average.
On 8/20/1968, a category F3 (max. wind speeds 158-206 mph) tornado 44.6 miles away from the Hartford town center injured one person and caused between $5000 and $50,000 in damages.
On 7/9/1962, a category F2 (max. wind speeds 113-157 mph) tornado 21.0 miles away from the town center caused between $5000 and $50,000 in damages.
Earthquake activity:
Hartford-area historical earthquake activity is significantly above Vermont state average. It is 70% smaller than the overall U.S. average.On 4/20/2002 at 10:50:47, a magnitude 5.3 (5.3 ML, Depth: 3.0 mi, Class: Moderate, Intensity: VI - VII) earthquake occurred 88.2 miles away from Hartford center
On 10/7/1983 at 10:18:46, a magnitude 5.3 (5.1 MB, 5.3 LG, 5.1 ML) earthquake occurred 100.3 miles away from Hartford center
On 4/20/2002 at 10:50:47, a magnitude 5.2 (5.2 MB, 4.2 MS, 5.2 MW, 5.0 MW) earthquake occurred 87.8 miles away from the city center
On 1/19/1982 at 00:14:42, a magnitude 4.7 (4.5 MB, 4.7 MD, 4.5 LG, Class: Light, Intensity: IV - V) earthquake occurred 40.3 miles away from Hartford center
On 10/16/2012 at 23:12:25, a magnitude 4.7 (4.7 ML, Depth: 10.0 mi) earthquake occurred 86.0 miles away from the city center
On 6/16/1995 at 12:13:11, a magnitude 3.8 (3.8 LG, Depth: 3.1 mi, Class: Light, Intensity: II - III) earthquake occurred 48.6 miles away from the city center
Magnitude types: regional Lg-wave magnitude (LG), body-wave magnitude (MB), duration magnitude (MD), local magnitude (ML), surface-wave magnitude (MS), moment magnitude (MW)
Natural disasters:
The number of natural disasters in Windsor County (20) is greater than the US average (15).Major Disasters (Presidential) Declared: 16
Emergencies Declared: 2
Causes of natural disasters: Floods: 14, Storms: 13, Tropical Storms: 2, Heavy Rain: 1, Hurricane: 1, Ice Storm: 1, Landslide: 1, Snowstorm: 1, Wind: 1, Winter Storm: 1 (Note: some incidents may be assigned to more than one category).

Hospitals and medical centers near Hartford:
- BROOKSIDE HEALTH AND REHABILITATION (Nursing Home, about 3 miles away; WHITE RIVER JUNCTION, VT)
- WHITE RIVER JCT VA MEDICAL CENTER (Hospital, Acute Care - Veterans Administration, about 3 miles away; WHITE RIVER JUNCTION, VT)
- VNA AND HOSPICE OF VERMONT AND NH (Hospital, about 4 miles away; WHITE RIVER JUNCTION, VT)
- HANOVER TERRACE HEALTHCARE (Nursing Home, about 7 miles away; HANOVER, NH)
- FRESENIUS MEDICAL CARE OF LEBANON (Dialysis Facility, about 7 miles away; LEBANON, NH)
- KENDAL AT HANOVER (Nursing Home, about 7 miles away; HANOVER, NH)
- MT ASCUTNEY HOSPITAL Critical Access Hospitals (about 13 miles away; WINDSOR, VT)
Amtrak stations near Hartford:
- 3 miles: WHITE RIVER JUNCTION (RAILROAD ROW) . Services: ticket office, fully wheelchair accessible, enclosed waiting area, public restrooms, public payphones, free short-term parking, paid long-term parking, call for car rental service, call for taxi service, public transit connection.
- 13 miles: WINDSOR-MOUNT ASCUTNEY (WINDSOR, DEPOT AVE.) . Services: public payphones, free short-term parking, free long-term parking, call for car rental service, intercity bus service.
Colleges/universities with over 2000 students nearest to Hartford:
- Dartmouth College (about 5 miles; Hanover, NH; Full-time enrollment: 6,030)
- Plymouth State University (about 35 miles; Plymouth, NH; FT enrollment: 4,838)
- Norwich University (about 36 miles; Northfield, VT; FT enrollment: 4,221)
- Castleton State College (about 41 miles; Castleton, VT; FT enrollment: 2,079)
- Middlebury College (about 47 miles; Middlebury, VT; FT enrollment: 3,077)
- Keene State College (about 52 miles; Keene, NH; FT enrollment: 5,098)
- NHTI-Concord's Community College (about 53 miles; Concord, NH; FT enrollment: 2,865)
Points of interest:
Notable locations in Hartford: Que-Chee Club (A), Highland Golf Course (B), Lakeland Golf Course (C), Maple Leaf Campground (D), Pine Valley Resort Campground (E), White River Junction Chamber of Commerce (F), Vermont District Courthouse (G), Veterans Adminstration Medical and Regional Office Center (H), River City Arts and White River Theater (I), Hartford Public Library (J), Hartford Municipal Building (K), Department of Veterans Affairs Medical Library (L), Bugbee Building Senior Center (M), Hartford Fire Department Station 2 (N), Hartford Fire Department Station 1 Headquarters (O). Display/hide their locations on the map
Shopping Center: Timber Village Shopping Center (1). Display/hide its location on the map
Churches in Hartford include: Quechee Community Church (A), Saint Pauls Episcopal Church (B), Upper Valley Assembly of God Church (C), Valley Bible Church (D), White River Junction Methodist Church (E), Greater Hartford United Church (F). Display/hide their locations on the map
Cemeteries: Hilltop Cemetery (1), Hartford Point Cemetery (2), Murphy Cemetery (3), Saint Anthonys Cemetery (4), Savage Cemetery (5), West Hartford Cemetery (6), Simonds Cemetery (7). Display/hide their locations on the map
Reservoirs: Lower Hurricane Reservoir (A), Wright Reservoir (B), Deweys Pond (C), Upper Hurricane Reservoir (D), Lake Pinneo (E), Simonds Reservoir (F). Display/hide their locations on the map
Streams, rivers, and creeks: Tigertown Brook (A), White River (B), Quechee Gorge (C), Podunk Brook (D), Jericho Brook (E), Dimick Brook (F), Whitman Brook (G). Display/hide their locations on the map
Parks in Hartford include: Frost Park (1), Memorial Park (2), White River Junction Historic District (3). Display/hide their locations on the map
Birthplace of: William Babcock Hazen - Union Army general.
| This town: | 2.2 people |
| Vermont: | 2.3 people |
| This town: | 58.9% |
| Whole state: | 62.5% |
| This town: | 8.0% |
| Whole state: | 9.2% |
Likely homosexual households (counted as self-reported same-sex unmarried-partner households)
- Lesbian couples: 0.7% of all households
- Gay men: 0.5% of all households
| This town: | 8.5% |
| Whole state: | 9.4% |
| This town: | 4.3% |
| Whole state: | 3.6% |
20 people in emergency and transitional shelters (with sleeping facilities) for people experiencing homelessness in 2010
60 people in nursing homes in 2000
12 people in other noninstitutional group quarters in 2000
For population 15 years and over in Hartford:
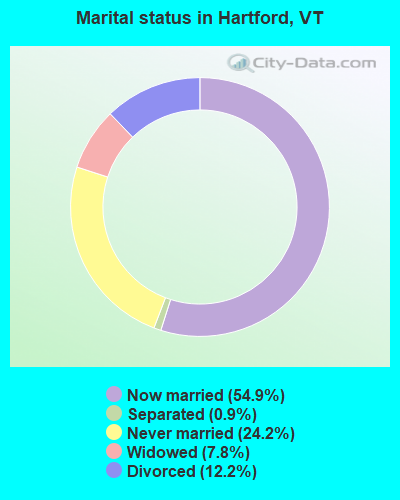
- Never married: 24.2%
- Now married: 54.9%
- Separated: 0.9%
- Widowed: 7.8%
- Divorced: 12.2%
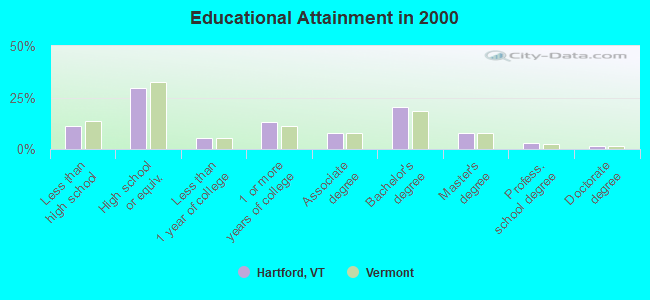
For population 25 years and over in Hartford:
- High school or higher: 88.7%
- Bachelor's degree or higher: 32.4%
- Graduate or professional degree: 11.9%
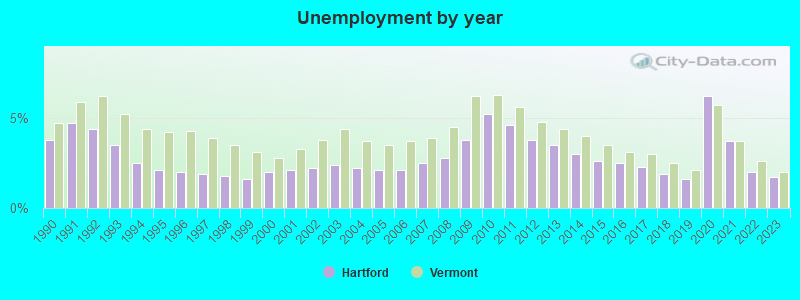
- Unemployed: 3.2%
- Mean travel time to work (commute): 19.3 minutes
| Here: | 11.0 |
| Vermont average: | 11.7 |
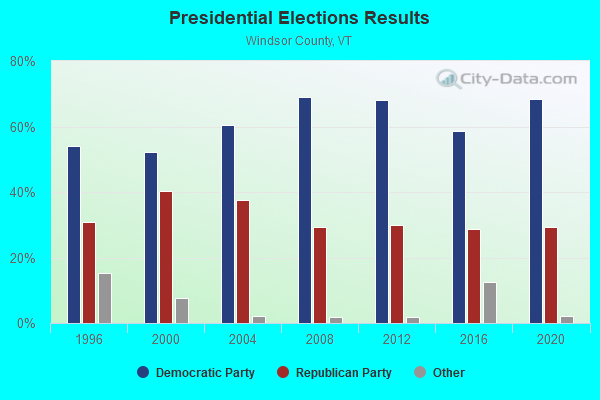
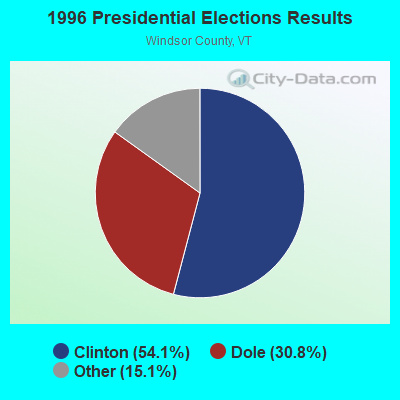
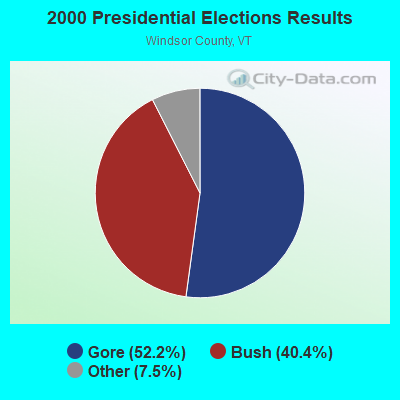
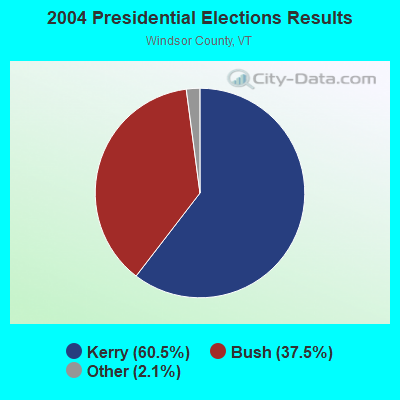
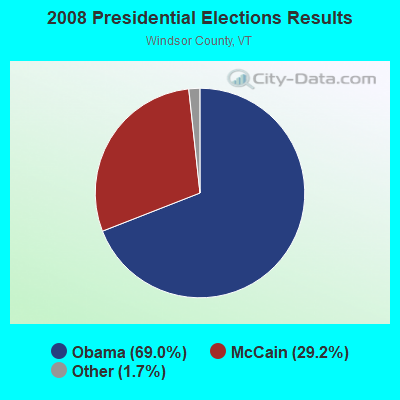
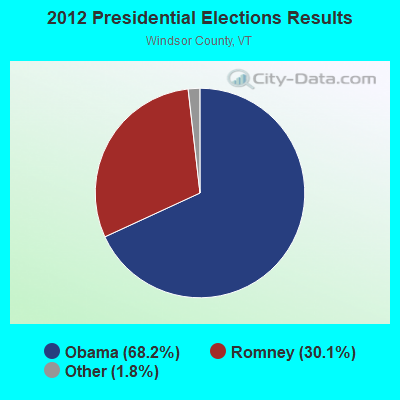
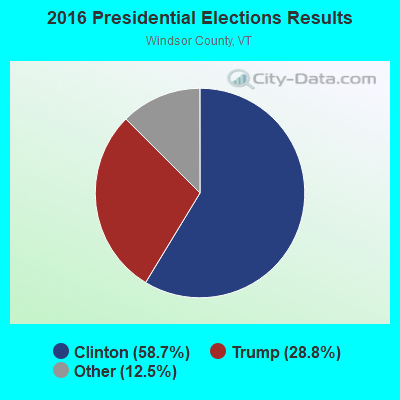
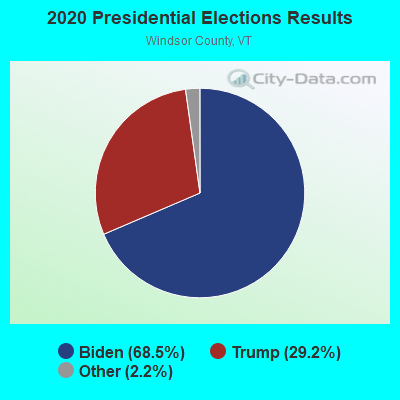
Graphs represent county-level data. Detailed 2008 Election Results
Religion statistics for Hartford, VT (based on Windsor County data)
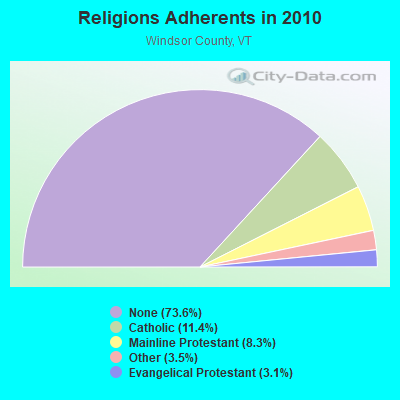
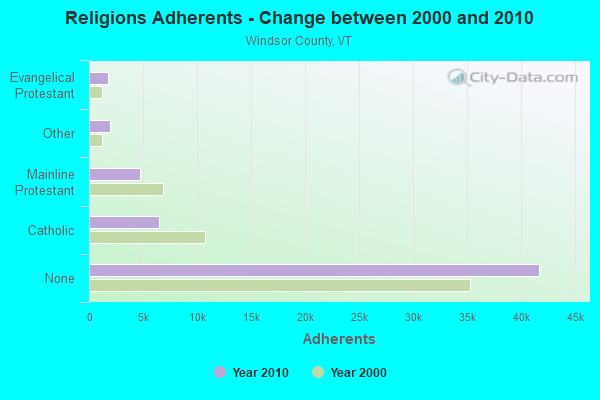
| Religion | Adherents | Congregations |
|---|---|---|
| Catholic | 6,485 | 10 |
| Mainline Protestant | 4,700 | 45 |
| Other | 1,964 | 17 |
| Evangelical Protestant | 1,750 | 21 |
| Orthodox | 55 | 1 |
| None | 41,716 | - |
Food Environment Statistics:
| Windsor County: | 4.93 / 10,000 pop. |
| Vermont: | 3.84 / 10,000 pop. |
| Windsor County: | 1.23 / 10,000 pop. |
| Vermont: | 1.95 / 10,000 pop. |
| Here: | 7.93 / 10,000 pop. |
| Vermont: | 6.40 / 10,000 pop. |
| This county: | 14.97 / 10,000 pop. |
| Vermont: | 11.52 / 10,000 pop. |
| Here: | 7.1% |
| State: | 6.8% |
| Windsor County: | 22.8% |
| State: | 22.3% |
| This county: | 9.7% |
| Vermont: | 13.3% |
Strongest AM radio stations in Hartford:
- WNHV (910 AM; 1 kW; WHITE RIVER JUNCTION, VT)
- WTSL (1400 AM; 1 kW; HANOVER, NH; Owner: CAPSTAR TX LIMITED PARTNERSHIP)
- WDCR (1340 AM; 1 kW; HANOVER, NH; Owner: TRUSTEES OF DARTMOUTH COLLEGE)
- WNTK (1020 AM; 10 kW; NEWPORT, NH; Owner: KOOR COMMUNICATIONS, INC.)
- WRKO (680 AM; 50 kW; BOSTON, MA; Owner: ENTERCOM BOSTON LICENSE, LLC)
- WNNZ (640 AM; 50 kW; WESTFIELD, MA; Owner: CLEAR CHANNEL BROADCASTING LICENSES, INC.)
- WCRN (830 AM; 50 kW; WORCESTER, MA; Owner: CARTER BROADCASTING CORPORATION)
- WGY (810 AM; 50 kW; SCHENECTADY, NY; Owner: CLEAR CHANNEL BROADCASTING LICENSES, INC.)
- WNBX (1480 AM; 5 kW; SPRINGFIELD, VT)
- WEEI (850 AM; 50 kW; BOSTON, MA; Owner: ENTERCOM BOSTON LICENSE, LLC)
- WCHP (760 AM; 35 kW; CHAMPLAIN, NY; Owner: CHAMPLAIN RADIO, INC.)
- WSYB (1380 AM; 5 kW; RUTLAND, VT; Owner: CAPSTAR TX LIMITED PARTNERSHIP)
- WKOX (1200 AM; 50 kW; FRAMINGHAM, MA; Owner: CAPSTAR TX LIMITED PARTNERSHIP)
Strongest FM radio stations in Hartford:
- WWOD (104.3 FM; HARTFORD, VT; Owner: FAMILY BROADCASTING, INC.)
- W232AP (94.3 FM; WHITE RIVER JUNCTION, VT; Owner: CLEAR CHANNEL BROADCASTING LICENSES, INC.)
- WXXK (100.5 FM; LEBANON, NH; Owner: CAPSTAR TX LIMITED PARTNERSHIP)
- WMXR (93.9 FM; WOODSTOCK, VT; Owner: CLEAR CHANNEL BROADCASTING LICENSES, INC.)
- WGXL (92.3 FM; HANOVER, NH; Owner: CAPSTAR TX LIMITED PARTNERSHIP)
- WVPR (89.5 FM; WINDSOR, VT; Owner: VERMONT PUBLIC RADIO)
- WEVH (91.3 FM; HANOVER, NH; Owner: NEW HAMPSHIRE PUBLIC RADIO INC)
- W294AB (106.7 FM; HANOVER, NH; Owner: GREAT NORTHERN RADIO, L.L.C.)
- WFRD (99.3 FM; HANOVER, NH; Owner: TRUSTEES OF DARTMOUTH COLLEGE)
- WRJT (103.1 FM; ROYALTON, VT; Owner: LISBON COMMUNICATIONS, INC.)
- WHDQ (106.1 FM; CLAREMONT, NH; Owner: GREAT NORTHERN RADIO, L.L.C.)
- W272AU (102.3 FM; HANOVER, ETC., NH; Owner: CAPSTAR TX LIMITED PARTNERSHIP)
- W280CS (103.9 FM; HANOVER, ETC., NH; Owner: CHRISTIAN MINISTRIES, INC.)
- WSSH (95.3 FM; WHITE RIVER JUNCTION, VT; Owner: GREAT NORTHERN RADIO, L.L.C.)
- WJJR (98.1 FM; RUTLAND, VT; Owner: 6 JOHNSON ROAD LICENSES, INC.)
- WZRT (97.1 FM; RUTLAND, VT; Owner: CAPSTAR TX LIMITED PARTNERSHIP)
- WEBK (105.3 FM; KILLINGTON, VT; Owner: 6 JOHNSON ROAD LICENSES, INC.)
- W261CB (100.1 FM; NORWICH(WEST LEBANON, VT; Owner: HARVEST TRANSLATORS, INC.)
- WGLV (91.7 FM; WOODSTOCK, VT; Owner: CHRISTIAN MINISTRIES INC)
- WHDQ-FM1 (106.1 FM; RUTLAND, VT; Owner: GREAT NORTHERN RADIO, L.L.C.)
TV broadcast stations around Hartford:
- W15BK (Channel 15; HANOVER, NH; Owner: UNIVERSITY OF NEW HAMPSHIRE)
- WVTA (Channel 41; WINDSOR, VT; Owner: VERMONT ETV, INC.)
- WNNE (Channel 31; HARTFORD, VT; Owner: HEARST-ARGYLE STATIONS, INC.)
- W17CI (Channel 17; CLAREMONT, NH; Owner: UPPER VALLEY BROADCASTING, LLC)
- W65AM (Channel 65; LEBANON, ETC., NH; Owner: HEARST-ARGYLE STATIONS, INC.)
- National Bridge Inventory (NBI) Statistics
- 57Number of bridges
- 1,096ft / 334mTotal length
- $51,752,000Total costs
- 750,896Total average daily traffic
- 87,234Total average daily truck traffic
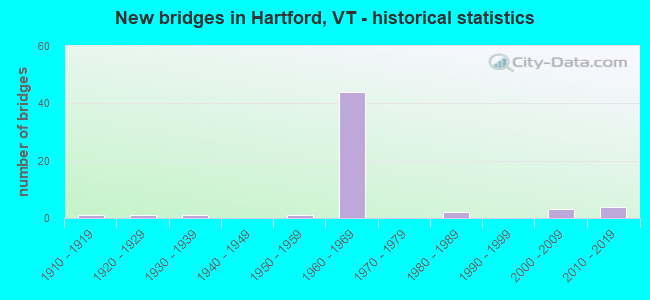
- New bridges - historical statistics
- 11910-1919
- 11920-1929
- 11930-1939
- 11950-1959
- 441960-1969
- 21980-1989
- 32000-2009
- 42010-2019
FCC Registered Antenna Towers: 39 (See the full list of FCC Registered Antenna Towers)
FCC Registered Private Land Mobile Towers: 2 (See the full list of FCC Registered Private Land Mobile Towers in Hartford, VT)
FCC Registered Broadcast Land Mobile Towers: 8 (See the full list of FCC Registered Broadcast Land Mobile Towers)
FCC Registered Microwave Towers: 9 (See the full list of FCC Registered Microwave Towers in this town)
FCC Registered Paging Towers: 2 (See the full list of FCC Registered Paging Towers)
FCC Registered Amateur Radio Licenses: 8 (See the full list of FCC Registered Amateur Radio Licenses in Hartford)
2004 - 2018 National Fire Incident Reporting System (NFIRS) incidents
- Fire incident types reported to NFIRS in Hartford, VT
- 12153.8%Structure Fires
- 5424.0%Outside Fires
- 3013.3%Mobile Property/Vehicle Fires
- 208.9%Other
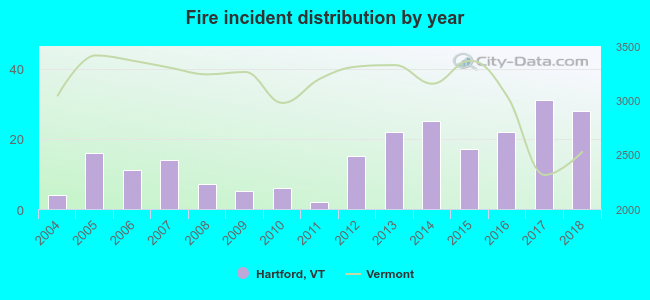 Based on the data from the years 2004 - 2018 the average number of fires per year is 15. The highest number of reported fire incidents - 31 took place in 2017, and the least - 2 in 2011. The data has an increasing trend.
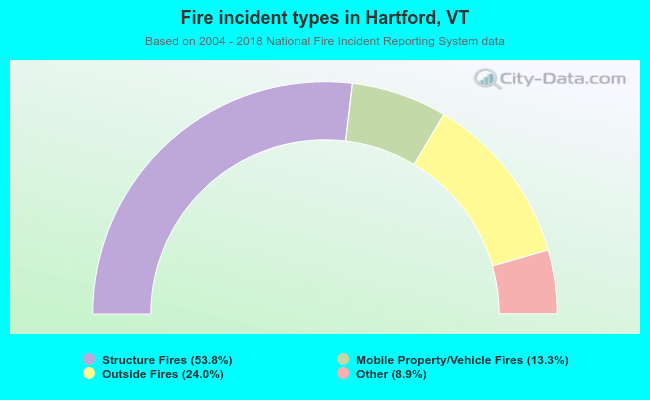 When looking into fire subcategories, the most reports belonged to: Structure Fires (53.8%), and Outside Fires (24.0%).
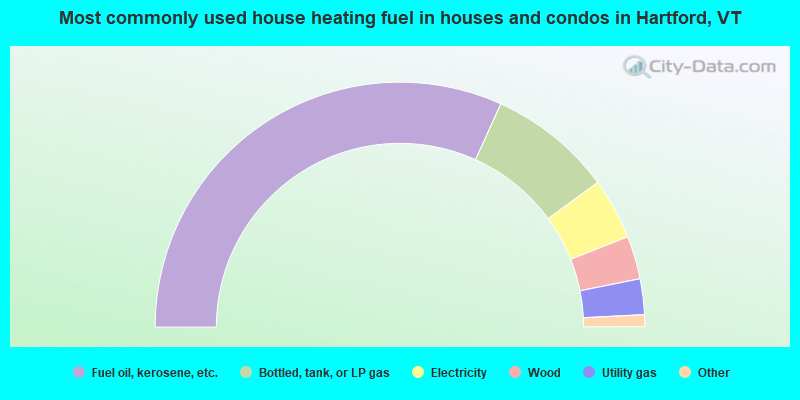
- 63.6%Fuel oil, kerosene, etc.
- 16.4%Bottled, tank, or LP gas
- 8.1%Electricity
- 5.7%Wood
- 4.7%Utility gas
- 1.4%Other fuel
- 0.2%Solar energy
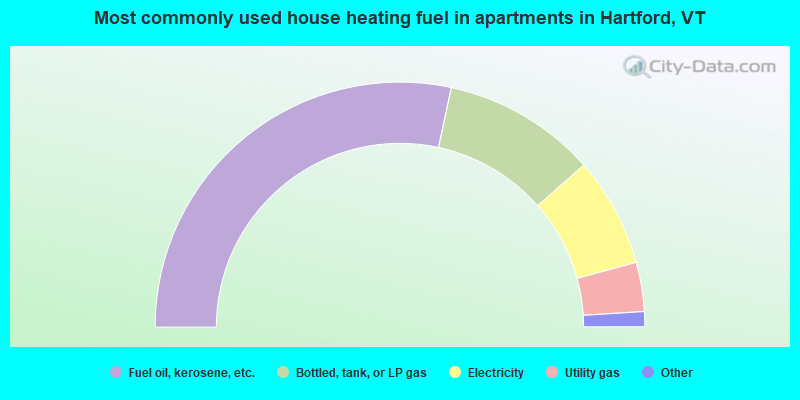
- 56.8%Fuel oil, kerosene, etc.
- 20.3%Bottled, tank, or LP gas
- 14.5%Electricity
- 6.5%Utility gas
- 1.2%Wood
- 0.4%Other fuel
- 0.4%No fuel used
Hartford compared to Vermont state average:
- Unemployed percentage significantly below state average.
- Hispanic race population percentage below state average.
- Foreign-born population percentage below state average.
- Length of stay since moving in significantly above state average.
- Number of rooms per house significantly below state average.
- House age significantly below state average.
Hartford on our top lists:
- #10 on the list of "Top 101 cities with largest percentage of females in industries: petroleum and petroleum products merchant wholesalers (population 5,000+)"
- #16 on the list of "Top 101 cities with largest percentage of males in industries: u. s. postal service (population 5,000+)"
- #19 on the list of "Top 101 cities with largest percentage of females in industries: health care (population 5,000+)"
- #24 on the list of "Top 101 cities with largest percentage of males in occupations: other food preparation and serving workers including supervisors (population 5,000+)"
- #33 on the list of "Top 101 cities with largest percentage of males in industries: book stores and news dealers (population 5,000+)"
- #37 on the list of "Top 101 cities with largest percentage of females in industries: vending machine operators (population 5,000+)"
- #43 on the list of "Top 101 cities with largest percentage of males in occupations: librarians, curators, and archivists (population 5,000+)"
- #44 on the list of "Top 101 cities with largest percentage of males in industries: paper and paper products merchant wholesalers (population 5,000+)"
- #45 on the list of "Top 101 cities with largest percentage of males in industries: health care (population 5,000+)"
- #47 on the list of "Top 101 cities with the lowest number of robberies per 100,000 residents (population 5,000+)"
- #48 on the list of "Top 101 cities with largest percentage of males in occupations: special education teachers (population 5,000+)"
- #49 on the list of "Top 101 cities with largest percentage of females in occupations: other transportation workers (population 5,000+)"
- #55 on the list of "Top 101 cities with largest percentage of males in occupations: supervisors and other personal care and service workers except personal appearance, transportation, and child care workers (population 5,000+)"
- #57 on the list of "Top 101 cities with largest percentage of females in occupations: registered nurses (population 5,000+)"
- #74 on the list of "Top 101 cities with largest percentage of males in industries: data processing, libraries, and other information services (population 5,000+)"
- #85 on the list of "Top 101 cities with largest percentage of females in industries: sewing, needlework, and piece goods stores (population 5,000+)"
- #93 on the list of "Top 101 cities with largest percentage of females in industries: fuel dealers (population 5,000+)"
- #93 on the list of "Top 101 cities with largest percentage of males in industries: motor vehicle and parts dealers (population 5,000+)"
- #99 on the list of "Top 101 cities with the largest city-data.com crime index increase from 2002 to 2012 (population 5,000+)"
- #39 on the list of "Top 101 counties with the highest percentage of residents that keep firearms around their homes"
- #40 on the list of "Top 101 counties with highest percentage of residents voting for Obama (Democrat) in the 2012 Presidential Election (pop. 50,000+)"
- #47 on the list of "Top 101 counties with the highest percentage of residents that smoked 100+ cigarettes in their lives"
- #54 on the list of "Top 101 counties with the lowest surface withdrawal of fresh water for public supply (pop. 50,000+)"
- #61 on the list of "Top 101 counties with the best general health status score of residents (1-5), 3 years of data"

|
|
Total of 13 patent applications in 2008-2024.