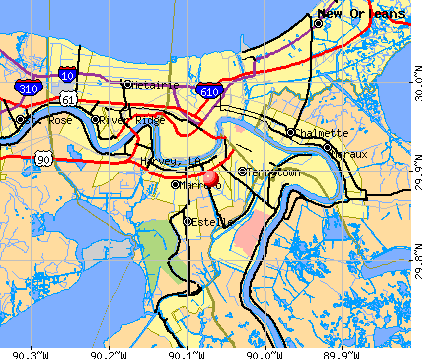
Harvey, Louisiana
Submit your own pictures of this place and show them to the world
- OSM Map
- General Map
- Google Map
- MSN Map
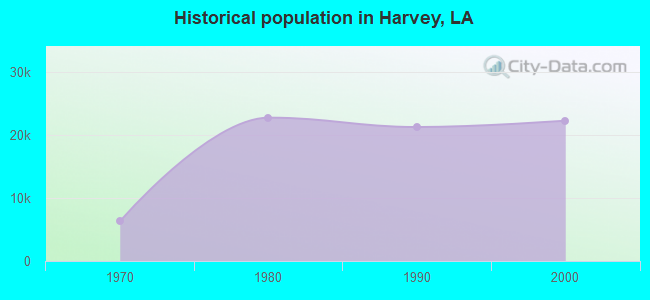
Population change since 2000: -8.4%
| Males: 10,245 | |
| Females: 10,103 |
| Median resident age: | 38.0 years |
| Louisiana median age: | 38.2 years |
Zip codes: 70058.
| Harvey: | $40,759 |
| LA: | $55,416 |
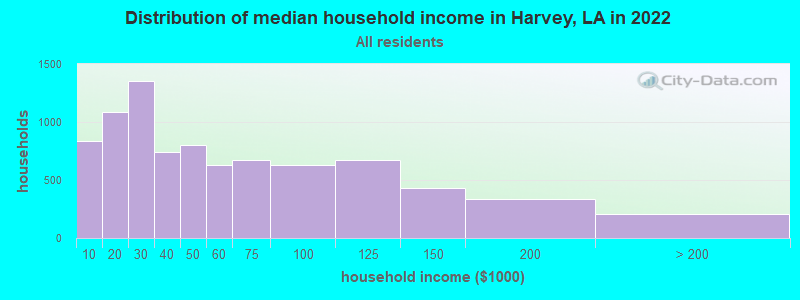
Estimated per capita income in 2022: $26,010 (it was $14,885 in 2000)
Harvey CDP income, earnings, and wages data
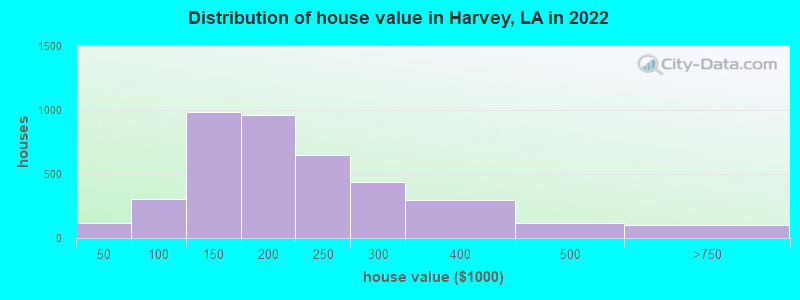
Estimated median house or condo value in 2022: $192,615 (it was $85,100 in 2000)
| Harvey: | $192,615 |
| LA: | $209,200 |
Mean prices in 2022: all housing units: $196,903; detached houses: $201,331; townhouses or other attached units: $332,200; in 3-to-4-unit structures: $77,018; in 5-or-more-unit structures: $147,004; mobile homes: $58,709
Median gross rent in 2022: $1,147.
(15.0% for White Non-Hispanic residents, 25.8% for Black residents, 39.7% for Hispanic or Latino residents, 4.8% for American Indian residents, 59.2% for other race residents, 36.5% for two or more races residents)
Detailed information about poverty and poor residents in Harvey, LA


Compare current foreclosures in Harvey, LA:
| Photo | Address | Area | Beds / Baths | Price | Details |
|---|---|---|---|---|---|

|
#1
Lake Salvador Dr
Harvey, LA 70058
|
- sq. feet
|
- baths - beds |
show details | |

|
#2
Alex Kornman Blvd Apt A
Harvey, LA 70058
|
- sq. feet
|
- baths - beds |
show details | |

|
#3
2nd Ave
Harvey, LA 70058
|
- sq. feet
|
- baths - beds |
show details | |

|
#4
Manhattan Blvd Ste 402
Harvey, LA 70058
|
- sq. feet
|
- baths - beds |
show details | |

|
#5
Manhattan Blvd Apt U152
Harvey, LA 70058
|
- sq. feet
|
- baths - beds |
show details | |

|
#6
London Cross Rd
Harvey, LA 70058
|
- sq. feet
|
- baths - beds |
show details | |

|
#7
Shadow Lake Ct
Harvey, LA 70058
|
- sq. feet
|
- baths - beds |
show details | |

|
#8
Glenmere Dr
Harvey, LA 70058
|
- sq. feet
|
- baths - beds |
show details | |

|
#9
Whitney Ave Apt 328
Harvey, LA 70058
|
- sq. feet
|
- baths - beds |
show details | |

|
#10
Esther St
Harvey, LA 70058
|
- sq. feet
|
- baths - beds |
show details |
| Photo | Address | Area | Beds / Baths | Price | Details |
|---|---|---|---|---|---|

|
#11
Lorene Dr Apt 35
Harvey, LA 70058
|
- sq. feet
|
- baths - beds |
show details | |

|
#12
Jupiter St
Harvey, LA 70058
|
- sq. feet
|
- baths - beds |
show details | |

|
#13
Titan St
Harvey, LA 70058
|
- sq. feet
|
- baths - beds |
show details | |

|
#14
Lorene Dr Apt 49
Harvey, LA 70058
|
- sq. feet
|
- baths - beds |
show details | |

|
#15
Woodmere Blvd
Harvey, LA 70058
|
- sq. feet
|
- baths - beds |
show details | |

|
#16
Agateway Dr
Harvey, LA 70058
|
- sq. feet
|
- baths - beds |
show details | |

|
#17
Snowbird Dr
Harvey, LA 70058
|
- sq. feet
|
- baths - beds |
show details | |

|
#18
W Catawba Dr
Harvey, LA 70058
|
- sq. feet
|
- baths - beds |
show details | |

|
#19
Bradford Pl
Harvey, LA 70058
|
- sq. feet
|
- baths - beds |
show details | |

|
#20
Max Dr
Harvey, LA 70058
|
- sq. feet
|
- baths - beds |
show details |
| Photo | Address | Area | Beds / Baths | Price | Details |
|---|---|---|---|---|---|

|
#21
41st St
Harvey, LA 70058
|
- sq. feet
|
- baths - beds |
show details | |

|
#22
Max Dr
Harvey, LA 70058
|
- sq. feet
|
- baths - beds |
show details | |
|
|
#23
Irwin Kuntz Dr
Harvey, LA 70058
|
- sq. feet
|
- baths - beds |
show details | |

|
#24
Red Cedar Ln
Harvey, LA 70058
|
- sq. feet
|
- baths - beds |
show details | |

|
#25
Inwood Dr
Harvey, LA 70058
|
- sq. feet
|
- baths - beds |
show details | |

|
#26
Red Cypress Dr
Harvey, LA 70058
|
- sq. feet
|
- baths - beds |
show details | |

|
#27
W Catawba Dr
Harvey, LA 70058
|
- sq. feet
|
- baths - beds |
show details | |

|
#28
Whippletree Dr
Harvey, LA 70058
|
- sq. feet
|
- baths - beds |
show details | |

|
#29
Nathan Kornman Dr
Harvey, LA 70058
|
- sq. feet
|
- baths - beds |
show details | |

|
#30
Wedgwood Dr
Harvey, LA 70058
|
- sq. feet
|
- baths - beds |
show details |
| Photo | Address | Area | Beds / Baths | Price | Details |
|---|---|---|---|---|---|

|
#31
Timberview Ln
Harvey, LA 70058
|
- sq. feet
|
- baths - beds |
show details | |

|
#32
Chalmette St
Harvey, LA 70058
|
- sq. feet
|
- baths - beds |
show details | |

|
#33
Pailet Ave
Harvey, LA 70058
|
- sq. feet
|
- baths - beds |
show details | |

|
#34
Lake Providence Dr
Harvey, LA 70058
|
- sq. feet
|
- baths - beds |
show details | |

|
#35
Brown Ave
Harvey, LA 70058
|
- sq. feet
|
- baths - beds |
show details | |

|
#36
Timberlane Estate Dr
Harvey, LA 70058
|
- sq. feet
|
- baths - beds |
show details | |

|
#37
Lake Superior Dr
Harvey, LA 70058
|
- sq. feet
|
- baths - beds |
show details | |

|
#38
Titan St
Harvey, LA 70058
|
- sq. feet
|
- baths - beds |
show details | |

|
#39
Sugarloaf Dr
Harvey, LA 70058
|
- sq. feet
|
- baths - beds |
show details | |

|
#40
Cimwood Dr
Harvey, LA 70058
|
- sq. feet
|
- baths - beds |
show details |
| Photo | Address | Area | Beds / Baths | Price | Details |
|---|---|---|---|---|---|

|
#41
Deerwood Ct
Harvey, LA 70058
|
- sq. feet
|
- baths - beds |
show details | |

|
#42
Aspen Dr
Harvey, LA 70058
|
- sq. feet
|
- baths - beds |
show details | |

|
#43
Stall Dr
Harvey, LA 70058
|
- sq. feet
|
- baths - beds |
show details | |

|
#44
Terraza Del Este
Harvey, LA 70058
|
- sq. feet
|
- baths - beds |
show details | |

|
#45
Maplewood Dr
Harvey, LA 70058
|
- sq. feet
|
- baths - beds |
show details | |

|
#46
Southern Oaks Dr
Harvey, LA 70058
|
- sq. feet
|
- baths - beds |
show details | |

|
#47
Nathan Kornman Dr
Harvey, LA 70058
|
- sq. feet
|
- baths - beds |
show details | |

|
#48
Breckenridge Dr
Harvey, LA 70058
|
- sq. feet
|
- baths - beds |
show details | |

|
#49
E Parc Green St
Harvey, LA 70058
|
- sq. feet
|
- baths - beds |
show details | |

|
Check over 1 million property listings on Foreclosure.com!
|
browse all offers | |||


- 10,01347.7%Black alone
- 6,26429.9%White alone
- 2,78413.3%Hispanic
- 1,6637.9%Asian alone
- 2851.4%Two or more races
- 100.05%American Indian alone
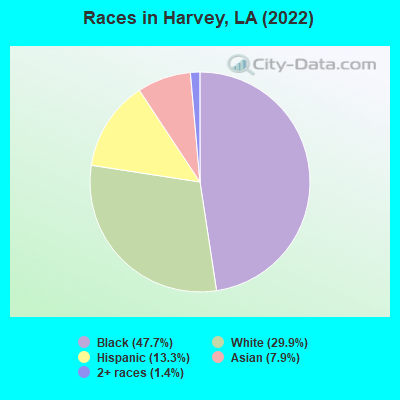
Races in Harvey detailed stats: ancestries, foreign born residents, place of birth
According to our research of Louisiana and other state lists, there were 82 registered sex offenders living in Harvey, Louisiana as of April 27, 2024.
The ratio of all residents to sex offenders in Harvey is 246 to 1.
 Recent articles from our blog. Our writers, many of them Ph.D. graduates or candidates, create easy-to-read articles on a wide variety of topics.

 | Safest Parts Of the city to live (24 replies) |
| Relocating to New Orleans and have concerns about safety and flooding (7 replies) |
| Amazon. Bidding for new headquarters (86 replies) |
| Are the Pumps On?? (41 replies) |
| The Easier Commute from NOLA--Metairie/Kenner area or Harvey/Gretna? (5 replies) |
| Can Someone Please Tell Me About Harvey LA (8 replies) |
Latest news from Harvey, LA collected exclusively by city-data.com from local newspapers, TV, and radio stations
Ancestries: Italian (3.7%), French (3.3%), German (3.3%), American (3.1%), English (2.4%), African (1.9%).
Current Local Time: CST time zone
Elevation: 4 feet
Land area: 6.68 square miles.
Population density: 3,048 people per square mile (average).
2,401 residents are foreign born (6.7% Latin America, 3.8% Asia).
| This place: | 11.4% |
| Louisiana: | 4.2% |
Median real estate property taxes paid for housing units with mortgages in 2022: $1,127 (0.5%)
Median real estate property taxes paid for housing units with no mortgage in 2022: $535 (0.3%)
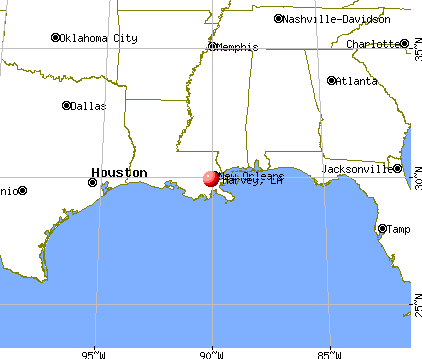
Nearest city with pop. 50,000+: New Orleans, LA  (5.7 miles , pop. 484,674).
Nearest city with pop. 1,000,000+: Houston, TX (319.0 miles , pop. 1,953,631).
Nearest cities:
), ), ), Latitude: 29.89 N, Longitude: 90.07 W
Daytime population change due to commuting: +3,092 (+14.7%)
Workers who live and work in this place: 1,124 (13.1%)
| Here: | 3.5% |
| Louisiana: | 3.8% |
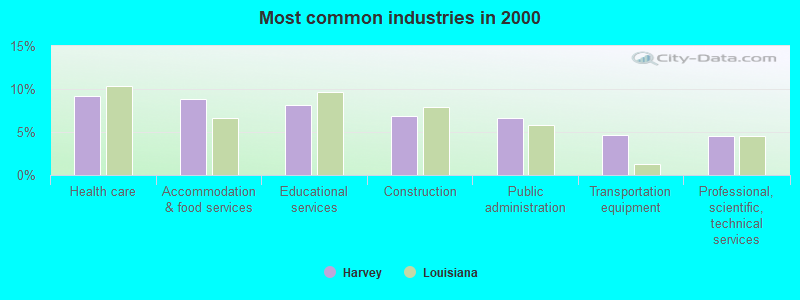
- Health care (9.2%)
- Accommodation & food services (8.8%)
- Educational services (8.2%)
- Construction (6.8%)
- Public administration (6.6%)
- Transportation equipment (4.7%)
- Professional, scientific, technical services (4.6%)
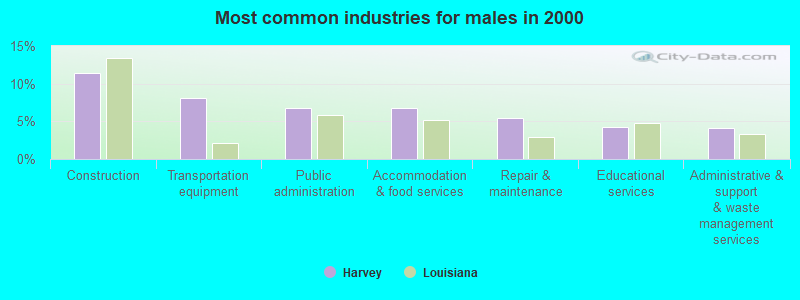
- Construction (11.4%)
- Transportation equipment (8.1%)
- Public administration (6.8%)
- Accommodation & food services (6.7%)
- Repair & maintenance (5.4%)
- Educational services (4.3%)
- Administrative & support & waste management services (4.1%)
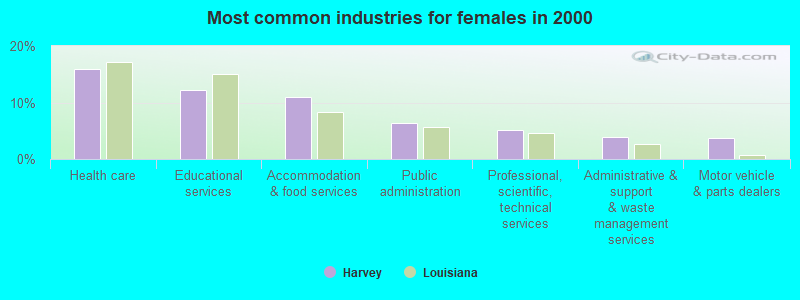
- Health care (15.9%)
- Educational services (12.3%)
- Accommodation & food services (11.0%)
- Public administration (6.4%)
- Professional, scientific, technical services (5.1%)
- Administrative & support & waste management services (4.0%)
- Motor vehicle & parts dealers (3.7%)
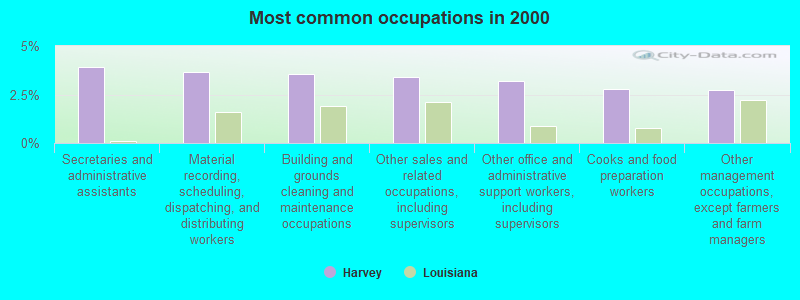
- Secretaries and administrative assistants (3.9%)
- Material recording, scheduling, dispatching, and distributing workers (3.7%)
- Building and grounds cleaning and maintenance occupations (3.6%)
- Other sales and related occupations, including supervisors (3.4%)
- Other office and administrative support workers, including supervisors (3.2%)
- Cooks and food preparation workers (2.8%)
- Other management occupations, except farmers and farm managers (2.7%)
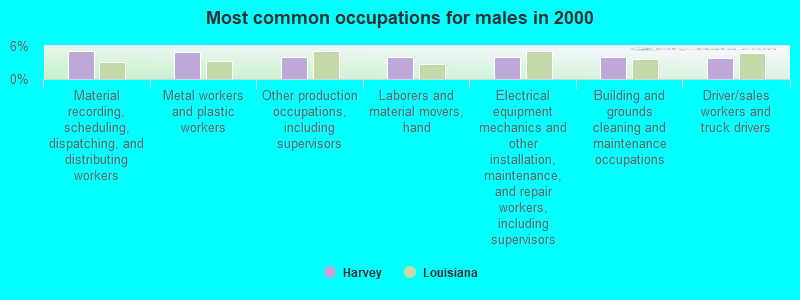
- Material recording, scheduling, dispatching, and distributing workers (5.1%)
- Metal workers and plastic workers (5.0%)
- Other production occupations, including supervisors (4.0%)
- Laborers and material movers, hand (4.0%)
- Electrical equipment mechanics and other installation, maintenance, and repair workers, including supervisors (4.0%)
- Building and grounds cleaning and maintenance occupations (4.0%)
- Driver/sales workers and truck drivers (3.8%)
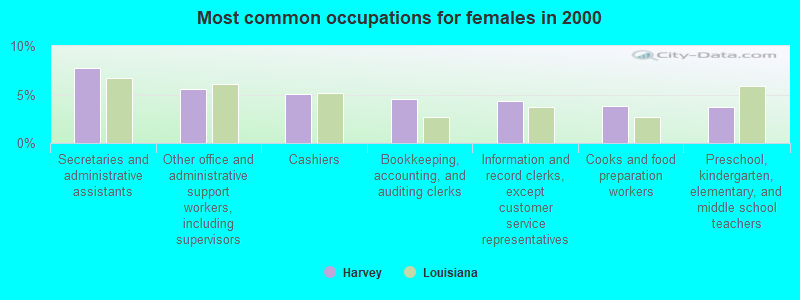
- Secretaries and administrative assistants (7.8%)
- Other office and administrative support workers, including supervisors (5.5%)
- Cashiers (5.0%)
- Bookkeeping, accounting, and auditing clerks (4.6%)
- Information and record clerks, except customer service representatives (4.3%)
- Cooks and food preparation workers (3.8%)
- Preschool, kindergarten, elementary, and middle school teachers (3.7%)
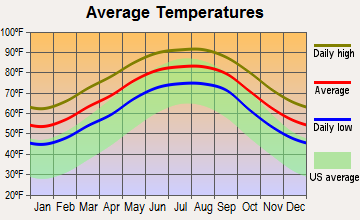
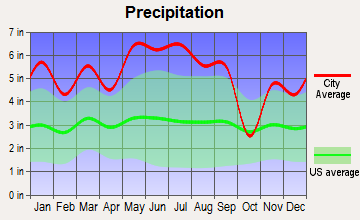
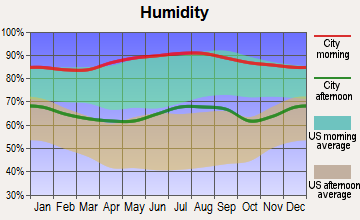
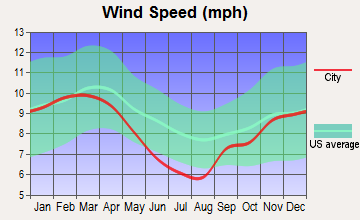
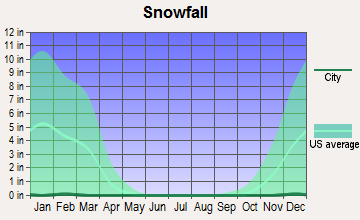
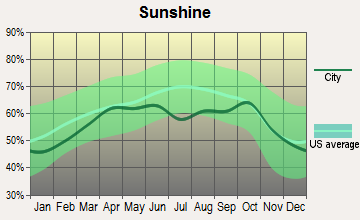
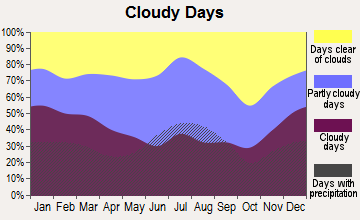
Average climate in Harvey, Louisiana
Based on data reported by over 4,000 weather stations
|
|


(lower is better)
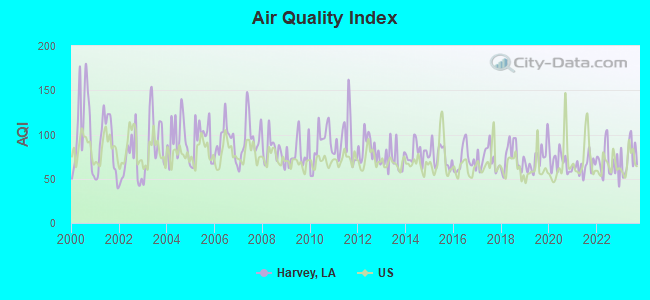
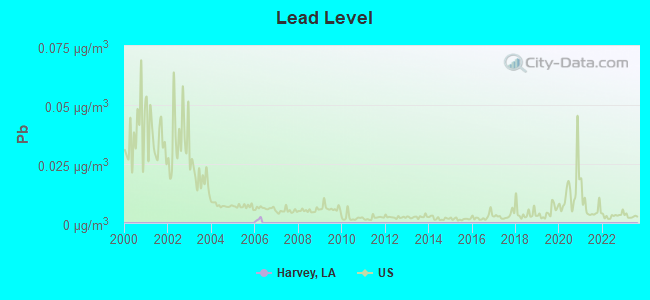
Air Quality Index (AQI) level in 2023 was 75.0. This is about average.
| City: | 75.0 |
| U.S.: | 72.6 |
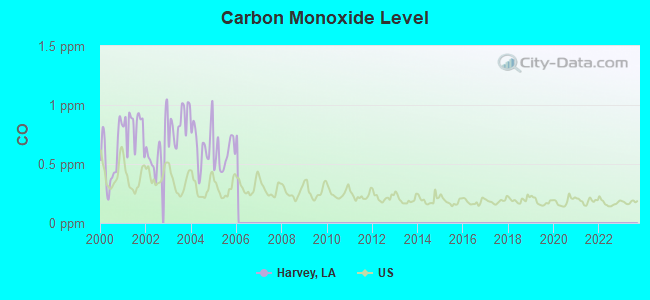
Carbon Monoxide (CO) [ppm] level in 2005 was 0.575. This is significantly worse than average. Closest monitor was 7.3 miles away from the city center.
| City: | 0.575 |
| U.S.: | 0.251 |
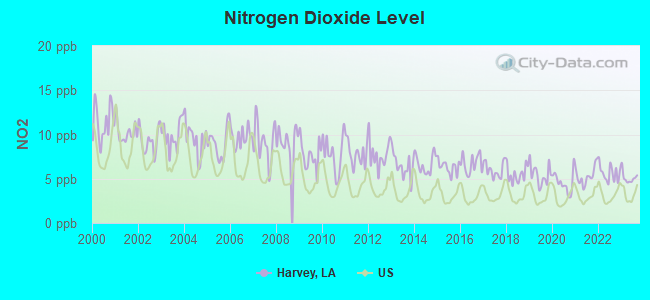
Nitrogen Dioxide (NO2) [ppb] level in 2023 was 5.12. This is about average. Closest monitor was 1.1 miles away from the city center.
| City: | 5.12 |
| U.S.: | 5.11 |
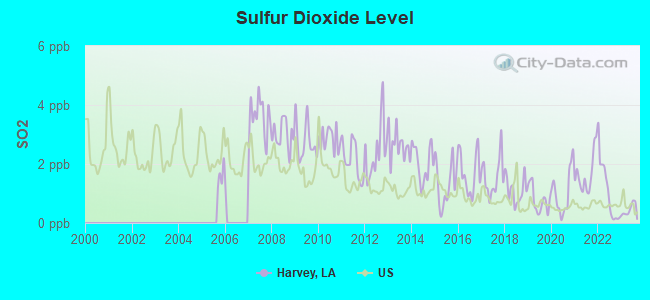
Sulfur Dioxide (SO2) [ppb] level in 2023 was 0.421. This is significantly better than average. Closest monitor was 1.1 miles away from the city center.
| City: | 0.421 |
| U.S.: | 1.515 |
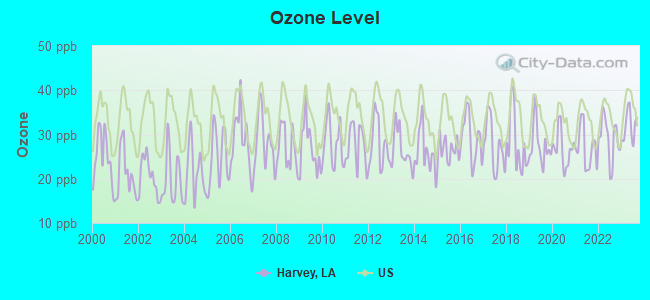
Ozone [ppb] level in 2023 was 31.9. This is about average. Closest monitor was 2.5 miles away from the city center.
| City: | 31.9 |
| U.S.: | 33.3 |
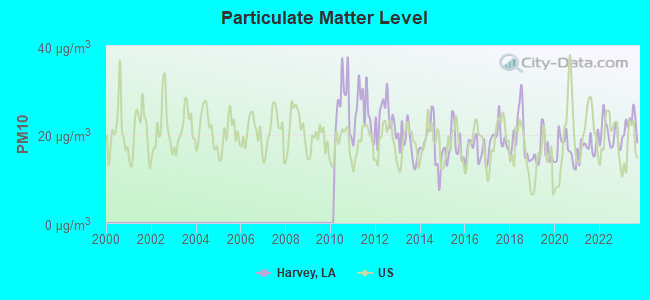
Particulate Matter (PM10) [µg/m3] level in 2023 was 22.2. This is about average. Closest monitor was 5.5 miles away from the city center.
| City: | 22.2 |
| U.S.: | 19.2 |
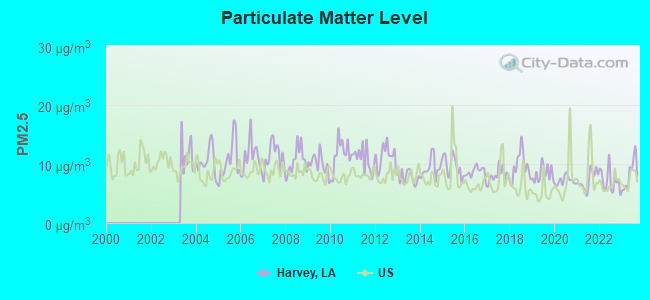
Particulate Matter (PM2.5) [µg/m3] level in 2023 was 8.17. This is about average. Closest monitor was 5.0 miles away from the city center.
| City: | 8.17 |
| U.S.: | 8.11 |
Tornado activity:
Harvey-area historical tornado activity is slightly below Louisiana state average. It is 17% greater than the overall U.S. average.
On 12/6/1983, a category F4 (max. wind speeds 207-260 mph) tornado 24.7 miles away from the Harvey place center injured 25 people and caused between $5,000,000 and $50,000,000 in damages.
On 10/3/1964, a category F4 tornado 27.0 miles away from the place center killed 22 people and injured 165 people and caused between $500,000 and $5,000,000 in damages.
Earthquake activity:
Harvey-area historical earthquake activity is significantly above Louisiana state average. It is 56% smaller than the overall U.S. average.On 9/10/2006 at 14:56:08, a magnitude 5.9 (5.9 MB, 5.5 MS, 5.8 MW, Class: Moderate, Intensity: VI - VII) earthquake occurred 327.8 miles away from the city center
On 10/24/1997 at 08:35:17, a magnitude 4.9 (4.8 MB, 4.2 MS, 4.9 LG, Depth: 6.2 mi, Class: Light, Intensity: IV - V) earthquake occurred 187.2 miles away from the city center
On 5/6/2018 at 16:47:09, a magnitude 4.6 (4.6 MB, Depth: 6.2 mi) earthquake occurred 163.2 miles away from the city center
On 6/30/1994 at 01:08:24, a magnitude 4.2 (4.2 MB, Depth: 6.2 mi) earthquake occurred 137.1 miles away from the city center
On 5/17/2012 at 08:12:00, a magnitude 4.8 (4.8 MW, Depth: 3.1 mi) earthquake occurred 291.4 miles away from the city center
On 1/18/1999 at 07:00:53, a magnitude 4.8 (4.8 MB, 4.0 LG, Depth: 0.6 mi) earthquake occurred 294.1 miles away from the city center
Magnitude types: regional Lg-wave magnitude (LG), body-wave magnitude (MB), surface-wave magnitude (MS), moment magnitude (MW)
Natural disasters:
The number of natural disasters in Jefferson Parish (31) is a lot greater than the US average (15).Major Disasters (Presidential) Declared: 23
Emergencies Declared: 5
Causes of natural disasters: Hurricanes: 17, Floods: 6, Storms: 6, Tropical Storms: 6, Heavy Rain: 1, Tornado: 1, Other: 2 (Note: some incidents may be assigned to more than one category).

Main business address for: SUPERIOR ENERGY SERVICES INC (OIL, GAS FIELD SERVICES, NBC).
Hospitals in Harvey:
- AIRLIE GROUP HOME (12 AIRLIE STREET)
- ANGUS COMMUNITY HOME (1404 ANGUS DRIVE)
- BARBWOOD COMMUNITY HOME (3116 BARBWOOD DRIVE)
- LAC ST PIERRE COMMUNITY HOME (4215 LAC ST PIERRE)
- LIRO COMMUNITY HOME (3732 LIR0 LANE)
- LOCHLOMAND GROUP HOME (1207 LOCHLOMAND)
- VIOLA COMMUNITY HOME (2316 LITCHWOOD LANE)
- WEST HARVEY GROUP HOME (1002 ORANGE BLOSSOM LANE)
- WESTMERE COMMUNITY HOME (2317 WESTMERE)
Nursing Homes in Harvey:
- MAISON DE'VILLE NURSING HOME OF HARVEY (2233 EIGHTH STREET)
- WEST JEFFERSON HEALTH CARE CENTER (1020 MANHATTAN BLVD)
Dialysis Facilities in Harvey:
Home Health Centers in Harvey:
Heliports located in Harvey:
Amtrak station near Harvey:
- 4 miles: NEW ORLEANS (1001 LOYOLA AVE.) . Services: ticket office, fully wheelchair accessible, enclosed waiting area, public restrooms, public payphones, snack bar, paid short-term parking, paid long-term parking, call for car rental service, taxi stand, intercity bus service, public transit connection.
Colleges/universities with over 2000 students nearest to Harvey:
- Loyola University New Orleans (about 5 miles; New Orleans, LA; Full-time enrollment: 3,912)
- Tulane University of Louisiana (about 5 miles; New Orleans, LA; FT enrollment: 11,089)
- Xavier University of Louisiana (about 6 miles; New Orleans, LA; FT enrollment: 2,492)
- Delgado Community College (about 7 miles; New Orleans, LA; FT enrollment: 12,843)
- University of New Orleans (about 10 miles; New Orleans, LA; FT enrollment: 8,201)
- Nicholls State University (about 45 miles; Thibodaux, LA; FT enrollment: 5,997)
- Southeastern Louisiana University (about 50 miles; Hammond, LA; FT enrollment: 12,713)
Public high schools in Harvey:
- WEST JEFFERSON HIGH SCHOOL (Students: 1,263, Location: 2200 EIGHTH STREET, Grades: 9-12)
- HELEN COX HIGH SCHOOL (Students: 971, Location: 2200 LAPALCO BOULEVARD, Grades: 9-12)
- JEFFERSON CHAMBER FOUNDATION ACADEMY (Location: 475 MANHATTAN BOULEVARD, Grades: 8-12, Charter school)
Private high school in Harvey:
Public elementary/middle schools in Harvey:
- WOODLAND WEST ELEMENTARY SCHOOL (Students: 763, Location: 2143 MARS STREET, Grades: PK-5)
- ELLA C. PITTMAN ELEMENTARY SCHOOL (Students: 559, Location: 3800 THIRTEENTH STREET, Grades: PK-5)
- CELERITY WOODMERE CHARTER SCHOOL (Location: 3191 ALEX KORNMAN BLVD., Grades: PK-5, Charter school)
Private elementary/middle school in Harvey:
Points of interest:
Notable locations in Harvey: Harvey Wastewater Treatment Plant (A), Jefferson Parish West Bank Office (B), Jefferson Parish Library Jane O Chatelain West Bank Regional Branch (C), Jefferson Parish Sheriff's Office (D), Maison De Ville Nursing Home of Harvey (E), Harvey Volunteer Fire Company (F), Creative Kids Care Day Care Center (G), Noahs Ark Child Care Center (H), Rivarde Juvenile Detention Center (I), Marrero - Harvey Volunteer Fire Department (J), Jefferson Central Office (K), West Jefferson Health Care Center (L). Display/hide their locations on the map
Shopping Centers: Manhattan Plaza Shopping Center (1), Manhattan Square Shopping Center (2), Manhattan Place Shopping Center (3). Display/hide their locations on the map
Main business address in Harvey: SUPERIOR ENERGY SERVICES INC (A). Display/hide its location on the map
Churches in Harvey include: New Bethel Baptist Church (A), Infant Jesus of Prague Church (B), Harvest Time Fellowship Church (C), Church of Abundant Life (D), Faith Presbyterian Church (E), Fair Haven Church of God In Christ (F), Cornerstone Full Gospel Church (G), Manhattan Church (H), Holy Hill Baptist Church (I). Display/hide their locations on the map
Cemetery: Evening Star Cemetery (1). Display/hide its location on the map
Parks in Harvey include: Martin Luther King Junior Park (1), Harvey Park (2), Woodlawn West Park (3). Display/hide their locations on the map
Tourist attractions: B & L Amusement CO (Amusement & Theme Parks; 3714 Westbank Expressway), Fastravel Services (Tours & Charters; 2066 Woodmere Boulevard).
Hotels: Days Inn & Suites (3750 Westbank Expressway), Holiday Inn Express Harvey (2433 Manhattan Boulevard), New Orleans Westbank Travelodge Hotel (2200 Westbank Expy), Best Western Westbank (1700 Lapalco Boulevard), Days Inn (3750 Westbank Expressway).
Court: Jefferson Parish - District Attorney- Juvenile Court- Child Support Enforcement Divi (1546 Gretna Boulevard).
Birthplace of: Greg Brooks - 2005 NFL player (Cincinnati Bengals, born: Dec 16, 1980), Greg Monroe - Basketball player, Larry Foster - Football player.
Drinking water stations with addresses in Harvey and their reported violations in the past:
CHAHTA MOBILE HOME PARK (Address: 10 Tunica Ct. , Population served: 180, Groundwater):Past monitoring violations:
- Failure Submit IDSE/Subpart V Plan Rpt - In JAN-01-2013, Contaminant: DBP STAGE 2. Follow-up actions: St Violation/Reminder Notice (FEB-21-2014), St Compliance achieved (MAR-27-2014)
- Monitoring and Reporting (DBP) - Between JAN-2013 and AUG-2013, Contaminant: Total Haloacetic Acids (HAA5). Follow-up actions: St Public Notif requested (OCT-30-2013), St Violation/Reminder Notice (OCT-30-2013), St Public Notif received (DEC-26-2013)
- Monitoring and Reporting (DBP) - Between JAN-2013 and AUG-2013, Contaminant: TTHM. Follow-up actions: St Public Notif requested (OCT-30-2013), St Violation/Reminder Notice (OCT-30-2013), St Public Notif received (DEC-26-2013)
- Monitoring, Source Water (GWR) - In JUL-01-2010, Contaminant: E. COLI. Follow-up actions: St Compliance achieved (2 times from AUG-24-2010 to SEP-22-2010)
- Monitoring, Repeat Major (TCR) - In JUL-2010, Contaminant: Coliform (TCR). Follow-up actions: St Violation/Reminder Notice (AUG-12-2010), St Public Notif requested (AUG-12-2010)
- 3 routine major monitoring violations
- One regular monitoring violation
| This place: | 2.7 people |
| Louisiana: | 2.5 people |
| This place: | 68.4% |
| Whole state: | 67.1% |
| This place: | 8.4% |
| Whole state: | 6.8% |
Likely homosexual households (counted as self-reported same-sex unmarried-partner households)
- Lesbian couples: 0.5% of all households
- Gay men: 0.3% of all households
People in group quarters in Harvey in 2010:
- 157 people in nursing facilities/skilled-nursing facilities
- 13 people in group homes intended for adults
- 7 people in emergency and transitional shelters (with sleeping facilities) for people experiencing homelessness
- 2 people in other noninstitutional facilities
People in group quarters in Harvey in 2000:
- 150 people in nursing homes
- 58 people in other nonhousehold living situations
- 29 people in homes for the mentally retarded
- 23 people in other workers' dormitories
- 15 people in other group homes
- 6 people in religious group quarters
Banks with most branches in Harvey (2011 data):
- Iberiabank: Lapalco Branch at 3900 Lapalco Blvd., branch established on 2008/04/15; Manhattan Branch at 2439 Manhattan Boulevard, branch established on 2002/08/05. Info updated 2011/06/08: Bank assets: $11,676.7 mil, Deposits: $9,387.9 mil, headquarters in Lafayette, LA, positive income, Commercial Lending Specialization, 187 total offices, Holding Company: Iberiabank Corporation
- First NBC Bank: Manhattan Branch at 1901 Manhattan Boulevard, branch established on 2011/01/24. Info updated 2011/11/21: Bank assets: $2,218.7 mil, Deposits: $1,904.1 mil, headquarters in New Orleans, LA, positive income, Commercial Lending Specialization, 33 total offices, Holding Company: First Nbc Bank Holding Company
- JPMorgan Chase Bank, National Association: Manhattan Boulevard Branch at 2340 Manhattan Boulevard, branch established on 1989/06/05. Info updated 2011/11/10: Bank assets: $1,811,678.0 mil, Deposits: $1,190,738.0 mil, headquarters in Columbus, OH, positive income, International Specialization, 5577 total offices, Holding Company: Jpmorgan Chase & Co.
- Capital One, National Association: Manhattan Branch at 2412 Manhattan Blvd & Central Blvd, branch established on 1999/10/05. Info updated 2011/07/01: Bank assets: $133,477.8 mil, Deposits: $97,063.7 mil, headquarters in Mclean, VA, positive income, 984 total offices, Holding Company: Capital One Financial Corporation
- Home Bank: Guaranty Savings Bank at 1800 Manhattan Blvd, branch established on 2007/08/01. Info updated 2011/07/21: Bank assets: $953.5 mil, Deposits: $732.8 mil, headquarters in Lafayette, LA, positive income, Commercial Lending Specialization, 23 total offices
- First Bank and Trust: Manhattan Branch at 2800 Manhattan Boulevard, Suite C, branch established on 1999/04/26. Info updated 2009/02/17: Bank assets: $760.5 mil, Deposits: $610.3 mil, headquarters in New Orleans, LA, negative income in the last year, Commercial Lending Specialization, 17 total offices, Holding Company: First Trust Corporation
- Gulf Coast Bank and Trust Company: Gulf Coast Bank & Trust Manhattan Bo at 1901 Manhattan Boulevard, branch established on 2011/09/01. Info updated 2006/11/03: Bank assets: $881.1 mil, Deposits: $740.2 mil, headquarters in New Orleans, LA, positive income, Commercial Lending Specialization, 21 total offices
- Regions Bank: Lapalco Branch at 1536 Lapalco Boulevard, branch established on 1882/01/01. Info updated 2011/02/24: Bank assets: $123,368.2 mil, Deposits: $98,301.3 mil, headquarters in Birmingham, AL, positive income, Commercial Lending Specialization, 1778 total offices, Holding Company: Regions Financial Corporation
- Mississippi River Bank: Harvey Branch at 1440 Lapalco Boulevard, branch established on 1992/03/10. Info updated 2008/04/02: Bank assets: $157.5 mil, Deposits: $134.3 mil, headquarters in Belle Chasse, LA, positive income, Commercial Lending Specialization, 3 total offices
- 2 other banks with 2 local branches
For population 15 years and over in Harvey:
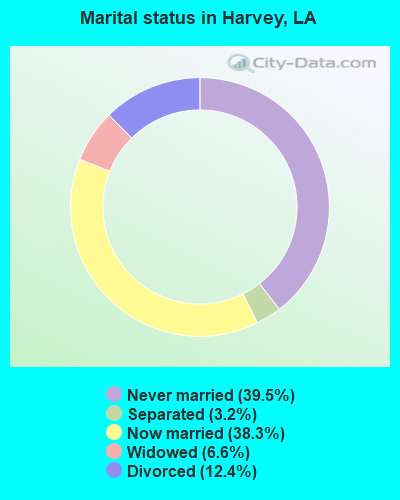
- Never married: 39.5%
- Now married: 38.3%
- Separated: 3.2%
- Widowed: 6.6%
- Divorced: 12.4%
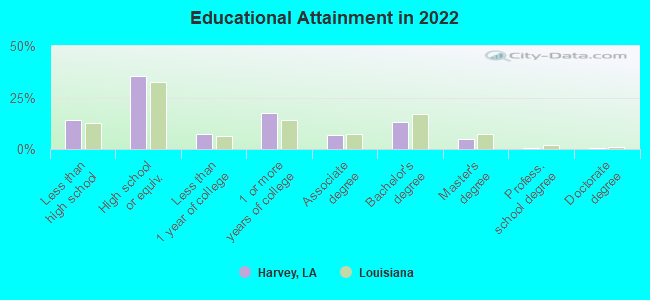
For population 25 years and over in Harvey:
- High school or higher: 84.8%
- Bachelor's degree or higher: 18.0%
- Graduate or professional degree: 5.3%
- Unemployed: 9.2%
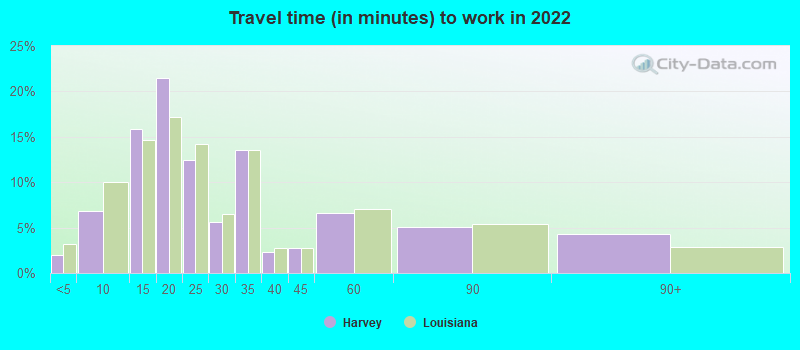
- Mean travel time to work (commute): 28.0 minutes
| Here: | 10.9 |
| Louisiana average: | 11.9 |
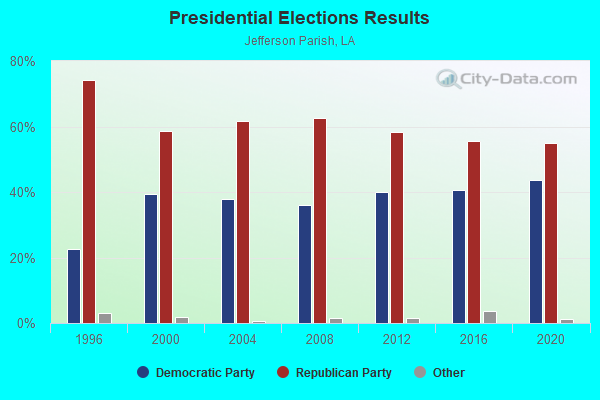
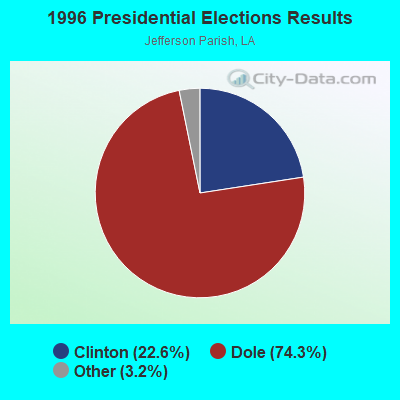
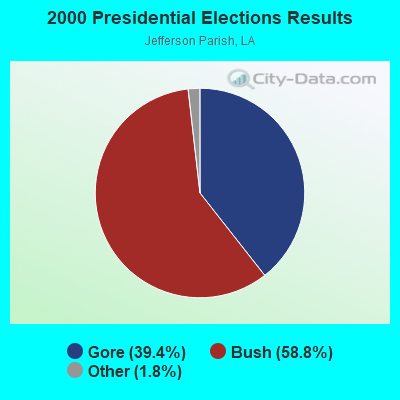
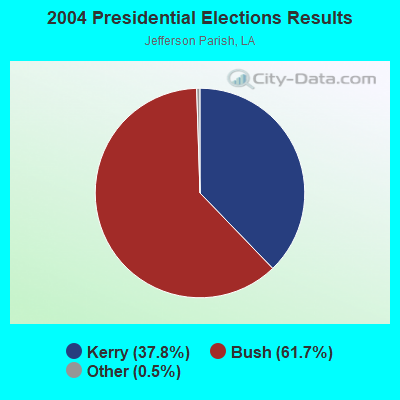
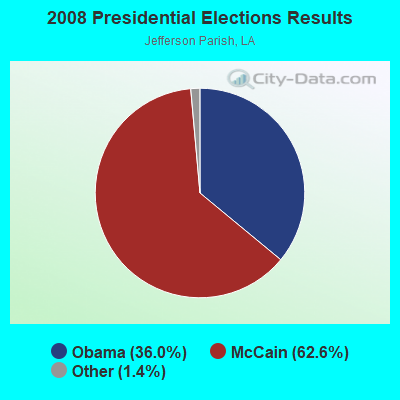
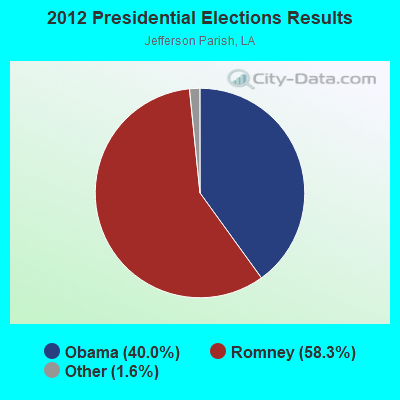
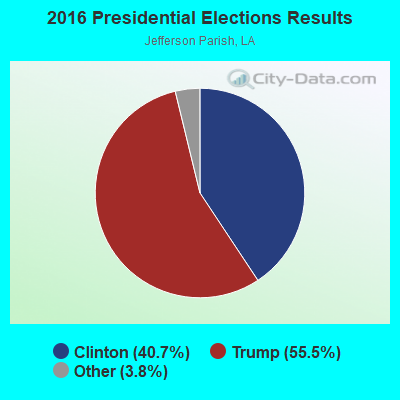
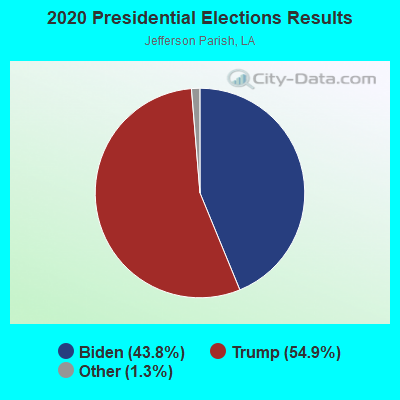
Graphs represent county-level data. Detailed 2008 Election Results
Religion statistics for Harvey, LA (based on Jefferson Parish data)
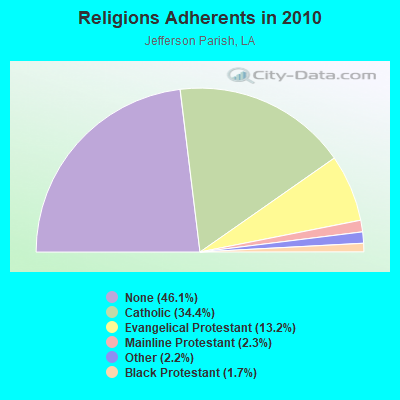
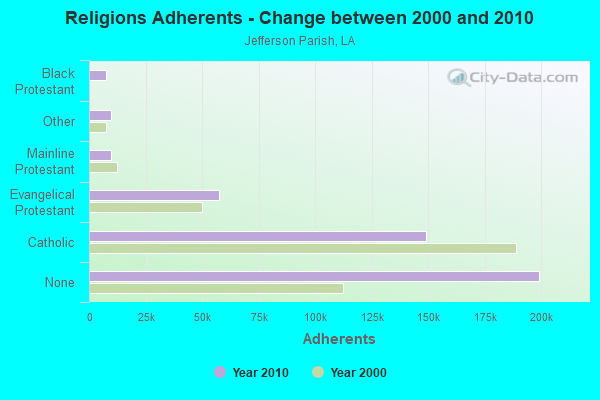
| Religion | Adherents | Congregations |
|---|---|---|
| Catholic | 148,827 | 43 |
| Evangelical Protestant | 57,266 | 160 |
| Mainline Protestant | 9,908 | 30 |
| Other | 9,666 | 23 |
| Black Protestant | 7,394 | 32 |
| Orthodox | 300 | 1 |
| None | 199,191 | - |
Food Environment Statistics:
| Jefferson Parish: | 2.43 / 10,000 pop. |
| Louisiana: | 2.56 / 10,000 pop. |
| Jefferson Parish: | 0.16 / 10,000 pop. |
| Louisiana: | 0.18 / 10,000 pop. |
| This county: | 1.41 / 10,000 pop. |
| Louisiana: | 1.29 / 10,000 pop. |
| Jefferson Parish: | 2.91 / 10,000 pop. |
| State: | 4.49 / 10,000 pop. |
| Jefferson Parish: | 7.59 / 10,000 pop. |
| Louisiana: | 5.92 / 10,000 pop. |
| Jefferson Parish: | 11.2% |
| Louisiana: | 10.9% |
| This county: | 28.3% |
| State: | 29.2% |
| Here: | 14.5% |
| Louisiana: | 13.7% |
Health and Nutrition:
| Harvey: | 48.0% |
| Louisiana: | 49.4% |
| Harvey: | 44.7% |
| Louisiana: | 46.5% |
| This city: | 29.3 |
| Louisiana: | 29.1 |
| This city: | 20.5% |
| State: | 20.3% |
| Harvey: | 12.5% |
| Louisiana: | 11.4% |
| Harvey: | 6.7 |
| Louisiana: | 6.8 |
| This city: | 34.2% |
| Louisiana: | 34.5% |
| This city: | 54.4% |
| Louisiana: | 55.8% |
| Here: | 80.9% |
| State: | 80.2% |
More about Health and Nutrition of Harvey, LA Residents
7.42% of this county's 2020 resident taxpayers moved to other counties in 2021 ($53,152 average adjusted gross income)
| Here: | 7.42% |
| Louisiana average: | 7.33% |
0.02% of residents moved to foreign countries ($118 average AGI)
Jefferson Parish: 0.02% Louisiana average: 0.02%
Top counties to which taxpayers relocated from this county between 2020 and 2021:
| to Orleans Parish, LA | |
| to St. Tammany Parish, LA | |
| to St. Charles Parish, LA |
| Businesses in Harvey, LA | ||||
| Name | Count | Name | Count | |
|---|---|---|---|---|
| AT&T | 2 | New Balance | 1 | |
| AutoZone | 1 | Nike | 4 | |
| Barnes & Noble | 1 | Nissan | 1 | |
| Bed Bath & Beyond | 1 | Office Depot | 1 | |
| Best Western | 1 | Papa John's Pizza | 1 | |
| Blockbuster | 1 | Payless | 1 | |
| Burger King | 3 | Penske | 1 | |
| Burlington Coat Factory | 1 | PetSmart | 1 | |
| CVS | 1 | Pier 1 Imports | 1 | |
| Catherines | 1 | Popeyes | 1 | |
| Chevrolet | 1 | Quiznos | 1 | |
| Circle K | 2 | RadioShack | 1 | |
| Comfort Suites | 1 | Rue21 | 1 | |
| Curves | 1 | SONIC Drive-In | 1 | |
| Decora Cabinetry | 1 | Sam's Club | 1 | |
| Domino's Pizza | 1 | Shoe Carnival | 1 | |
| FedEx | 4 | Sprint Nextel | 1 | |
| Ford | 1 | Starbucks | 1 | |
| GameStop | 2 | Subway | 3 | |
| H&R Block | 4 | T-Mobile | 3 | |
| Holiday Inn | 1 | T.G.I. Driday's | 1 | |
| Honda | 1 | Taco Bell | 1 | |
| IHOP | 1 | Target | 1 | |
| Jones New York | 1 | The Athlete's Foot | 1 | |
| KFC | 1 | Tire Kingdom | 1 | |
| Lane Bryant | 1 | Toyota | 1 | |
| Little Caesars Pizza | 1 | Travelodge | 1 | |
| Long John Silver's | 1 | U-Haul | 1 | |
| Lowe's | 1 | UPS | 5 | |
| Marshalls | 1 | Verizon Wireless | 1 | |
| MasterBrand Cabinets | 8 | Volkswagen | 1 | |
| Mazda | 1 | Walgreens | 2 | |
| McDonald's | 2 | Walmart | 2 | |
| Men's Wearhouse | 1 | Wendy's | 1 | |
Strongest AM radio stations in Harvey:
- WLNO (1060 AM; 50 kW; NEW ORLEANS, LA; Owner: COMMUNICOM CO. OF LOUISIANA, L.P.)
- WWL (870 AM; 50 kW; NEW ORLEANS, LA; Owner: ENTERCOM NEW ORLEANS LICENSE, LLC)
- KGLA (1540 AM; daytime; 1 kW; GRETNA, LA; Owner: CROCODILE BROADCASTING CORP., INC.)
- WYLD (940 AM; 10 kW; NEW ORLEANS, LA; Owner: CLEAR CHANNEL BROADCASTING LICENSES, INC.)
- WSMB (1350 AM; 5 kW; NEW ORLEANS, LA; Owner: ENTERCOM NEW ORLEANS LICENSE, LLC)
- KKNO (750 AM; daytime; 0 kW; GRETNA, LA; Owner: ROBERT C. BLAKES ENTERPRISES, INC.)
- WODT (1280 AM; 5 kW; NEW ORLEANS, LA; Owner: CLEAR CHANNEL BROADCASTING LICENSES, INC.)
- WTIX (690 AM; 10 kW; NEW ORLEANS, LA; Owner: WTIX, INC.)
- WSHO (800 AM; 1 kW; NEW ORLEANS, LA; Owner: SHADOWLANDS COMMUNICATIONS, L.L.C.)
- WGSO (990 AM; 1 kW; NEW ORLEANS, LA; Owner: WGSO, L.L.C.)
- WVOG (600 AM; 1 kW; NEW ORLEANS, LA; Owner: F.W. ROBERT BROADCASTING CO., INC.)
- WBOK (1230 AM; 1 kW; NEW ORLEANS, LA; Owner: CHRISTIAN BROADCASTING CORPORATION)
- WBYU (1450 AM; 1 kW; NEW ORLEANS, LA; Owner: ABC, INC.)
Strongest FM radio stations in Harvey:
- WYLD-FM (98.5 FM; NEW ORLEANS, LA; Owner: CLEAR CHANNEL BROADCASTING LICENSES, INC.)
- WLMG (101.9 FM; NEW ORLEANS, LA; Owner: ENTERCOM NEW ORLEANS LICENSE, LLC)
- WEZB (97.1 FM; NEW ORLEANS, LA; Owner: ENTERCOM NEW ORLEANS LICENSE, LLC)
- WTKL (95.7 FM; NEW ORLEANS, LA; Owner: ENTERCOM NEW ORLEANS LICENSE, LLC)
- WWNO (89.9 FM; NEW ORLEANS, LA; Owner: LOUISIANA STATE UNIV & A & M COLLEGE)
- WQUE-FM (93.3 FM; NEW ORLEANS, LA; Owner: CLEAR CHANNEL BROADCASTING LICENSES, INC.)
- WWOZ (90.7 FM; NEW ORLEANS, LA; Owner: FRIENDS OF WWOZ, INC.)
- WNOE-FM (101.1 FM; NEW ORLEANS, LA; Owner: CLEAR CHANNEL BROADCASTING LICENSES, INC.)
- WRNO-FM (99.5 FM; NEW ORLEANS, LA; Owner: CLEAR CHANNEL BROADCASTING LICENSES, INC.)
- WKZN (105.3 FM; KENNER, LA; Owner: ENTERCOM NEW ORLEANS LICENSE, LLC)
- WBSN-FM (89.1 FM; NEW ORLEANS, LA; Owner: PROVIDENCE EDUCATIONAL FOUNDATION)
- WRBH (88.3 FM; NEW ORLEANS, LA; Owner: RADIO FOR THE BLIND & HANDICAPPED, INC.)
- KMEZ (102.9 FM; BELLE CHASSE, LA; Owner: CITADEL BROADCASTING COMPANY)
- WTUL (91.5 FM; NEW ORLEANS, LA; Owner: TULANE EDUCATIONAL FUND)
- KKND (106.7 FM; PORT SULPHUR, LA; Owner: CITADEL BROADCASTING COMPANY)
- KSTE-FM (104.1 FM; HOUMA, LA; Owner: CLEAR CHANNEL BROADCASTING LICENSES, INC.)
- WCKW-FM (92.3 FM; LAPLACE, LA; Owner: 222 CORPORATION)
- KCIL (107.5 FM; HOUMA, LA; Owner: GUARANTY BROADCASTING COMPANY OF HOUMA, LLC)
- WTIX-FM (94.3 FM; GALLIANO, LA; Owner: FLEUR DE LIS BROADCASTING, INC.)
- KLRZ (100.3 FM; LAROSE, LA; Owner: COASTAL BROADCASTING OF LAROSE, INC.)
TV broadcast stations around Harvey:
- WWL-TV (Channel 4; NEW ORLEANS, LA; Owner: WWL-TV, INC.)
- WHNO (Channel 20; NEW ORLEANS, LA; Owner: LESEA BROADCASTING CORPORATION)
- K66FW (Channel 14; NEW ORLEANS, LA; Owner: VENTANA TELEVISION, INC.)
- WLPN-LP (Channel 61; NEW ORLEANS, LA; Owner: GLENN R. & KARIN A. PLUMMER)
- K59DG (Channel 59; NEW ORLEANS, LA; Owner: TRINITY BROADCCASTING NETWORK)
- KNOV-LP (Channel 57; NEW ORLEANS, LA; Owner: BEACH TV PROPERTIES, INC.)
- WYES-TV (Channel 12; NEW ORLEANS, LA; Owner: GREATER NEW ORLEANS ED TV FOUNDATION)
- WBXN-CA (Channel 10; NEW ORLEANS, LA; Owner: THE BOX WORLDWIDE LLC)
- WVUE (Channel 8; NEW ORLEANS, LA; Owner: EMMIS TELEIVISION LICENSE CORPORATION)
- WDSU (Channel 6; NEW ORLEANS, LA; Owner: NEW ORLEANS HEARST-ARGYLE TELEVISION, INC.)
- WLAE-TV (Channel 32; NEW ORLEANS, LA; Owner: EDUCATIONAL BROADCASTING FOUNDATION, INC.)
- WGNO (Channel 26; NEW ORLEANS, LA; Owner: TRIBUNE TELEVISION NEW ORLEANS, INC.)
- WNOL-TV (Channel 38; NEW ORLEANS, LA; Owner: TRIBUNE TELEVISION NEW ORLEANS, INC.)
- WPXL (Channel 49; NEW ORLEANS, LA; Owner: FLINN BROADCASTING CORPORATION)
- WUPL (Channel 54; SLIDELL, LA; Owner: UPN TELEVISION STATIONS INC.)
- National Bridge Inventory (NBI) Statistics
- 41Number of bridges
- 456ft / 139mTotal length
- $447,000Total costs
- 315,701Total average daily traffic
- 2,783Total average daily truck traffic
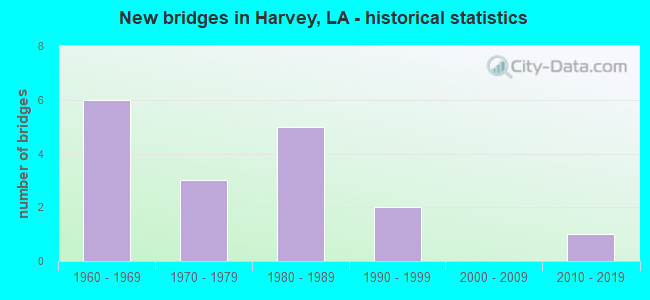
- New bridges - historical statistics
- 61960-1969
- 31970-1979
- 51980-1989
- 21990-1999
- 12010-2019
FCC Registered Antenna Towers:
113 (See the full list of FCC Registered Antenna Towers in Harvey)FCC Registered Broadcast Land Mobile Towers:
19 (See the full list of FCC Registered Broadcast Land Mobile Towers in Harvey, LA)FCC Registered Microwave Towers:
6 (See the full list of FCC Registered Microwave Towers in this town)FCC Registered Maritime Coast & Aviation Ground Towers:
12 (See the full list of FCC Registered Maritime Coast & Aviation Ground Towers)FCC Registered Amateur Radio Licenses:
53 (See the full list of FCC Registered Amateur Radio Licenses in Harvey)FAA Registered Aircraft:
7- Aircraft: PIPER PA-32-300 (Category: Land, Seats: 6, Weight: Up to 12,499 Pounds, Speed: 126 mph), Engine: LYCOMING IO-540 SER (300 HP) (Reciprocating)
N-Number: 419LJ, N419LJ, N-419LJ, Serial Number: 32-7840060, Year manufactured: 1977, Airworthiness Date: 01/02/1978, Certificate Issue Date: 08/07/2018
Registrant (LLC): Tiburon LLC, 1840 Jutland Dr, Harvey, LA 70058 - Aircraft: ISRAEL AIRCRAFT INDUSTRIES 1124A (Category: Land, Engines: 2, Seats: 12, Weight: 12,500 - 19,999 Pounds), Engine: AIRESEARCH TFE731 SER (3500 Pounds of Thrust) (Turbo-fan)
N-Number: 777HD, N777HD, N-777HD, Serial Number: 397, Year manufactured: 1983, Airworthiness Date: 12/08/1983, Certificate Issue Date: 10/02/2017
Registrant (Corporation): White Dove Fellowship Inc, 3600 Manhattan Blvd, Harvey, LA 70058
Deregistered: Cancel Date: 04/04/1985 - Aircraft: CESSNA 560 (Category: Land, Engines: 2, Seats: 11, Weight: 12,500 - 19,999 Pounds), Engine: P&W CANADA JT15D 5 SER (2900 Pounds of Thrust) (Turbo-fan)
N-Number: 818BF, N818BF, N-818BF, Serial Number: 560-0317, Year manufactured: 1995, Airworthiness Date: 08/30/1995, Certificate Issue Date: 08/22/2013
Registrant (LLC): Starlight Aviation LLC, 1901 Manhattan Blvd / Bldg H Ste 101, Harvey, LA 70058 - Aircraft: BELL 407 (Category: Land, Seats: 7, Weight: Up to 12,499 Pounds), Engine: ROLLS-ROYC 250-C47B (650 HP) (Turbo-shaft)
N-Number: 911HL, N911HL, N-911HL, Serial Number: 53692, Year manufactured: 2006, Airworthiness Date: 03/15/2006, Certificate Issue Date: 10/23/2006
Registrant (Government): Jefferson Parish Sheriffs Office, 1801 Westbank Expy, Harvey, LA 70058 - Aircraft: BELL UH-1H (Category: Land, Seats: 15, Weight: Up to 12,499 Pounds), Engine: Turbo-shaft
N-Number: 911NN, N911NN, N-911NN, Serial Number: 71-20068, Certificate Issue Date: 04/20/2009
Registrant (Government): Jefferson Parish Sheriffs Office, 1801 Westbank Expy, Harvey, LA 70058 - Aircraft: ROBINSON HELICOPTER COMPANY R44 II (Category: Land, Seats: 4, Weight: Up to 12,499 Pounds), Engine: LYCOMING IO-540 SER (300 HP) (Reciprocating)
N-Number: 40KV, N40KV, N-40KV, Serial Number: 10736, Year manufactured: 2005, Airworthiness Date: 05/06/2005, Certificate Issue Date: 10/25/2012
Registrant (Corporation): Richards Helicopter Services LLC, 3716 Vonnie Dr, Harvey, LA 70058 - Aircraft: POLARIS 2001 FIB (Category: Sea, Seats: 2, Weight: Up to 12,499 Pounds), Engine: 2 Cycle
N-Number: 95538, N95538, N-95538, Serial Number: E 3503J10, Certificate Issue Date: 04/14/2008
Registrant (Individual): Michael E Boatright, 2649 Centaur St, Harvey, LA 70058
Deregistered: Cancel Date: 04/04/2017
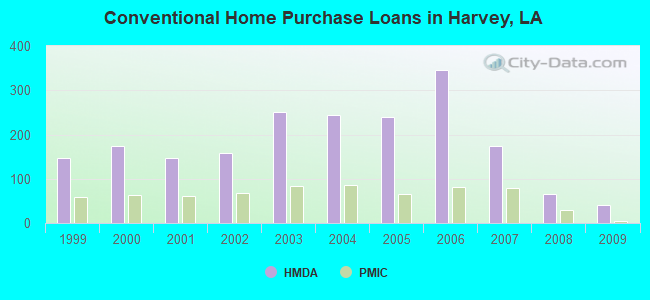
| Home Mortgage Disclosure Act Aggregated Statistics For Year 2009 (Based on 5 full and 2 partial tracts) | ||||||||||||||
| A) FHA, FSA/RHS & VA Home Purchase Loans | B) Conventional Home Purchase Loans | C) Refinancings | D) Home Improvement Loans | E) Loans on Dwellings For 5+ Families | F) Non-occupant Loans on < 5 Family Dwellings (A B C & D) | G) Loans On Manufactured Home Dwelling (A B C & D) | ||||||||
|---|---|---|---|---|---|---|---|---|---|---|---|---|---|---|
| Number | Average Value | Number | Average Value | Number | Average Value | Number | Average Value | Number | Average Value | Number | Average Value | Number | Average Value | |
| LOANS ORIGINATED | 56 | $146,334 | 40 | $115,520 | 155 | $136,809 | 20 | $20,986 | 1 | $350,000 | 30 | $105,885 | 0 | $0 |
| APPLICATIONS APPROVED, NOT ACCEPTED | 3 | $167,653 | 4 | $89,725 | 30 | $118,592 | 5 | $67,056 | 0 | $0 | 4 | $87,825 | 1 | $52,000 |
| APPLICATIONS DENIED | 15 | $146,470 | 17 | $136,594 | 125 | $125,931 | 34 | $46,719 | 1 | $170,000 | 18 | $99,854 | 3 | $66,000 |
| APPLICATIONS WITHDRAWN | 7 | $143,433 | 6 | $93,363 | 40 | $150,938 | 5 | $65,860 | 0 | $0 | 4 | $117,820 | 0 | $0 |
| FILES CLOSED FOR INCOMPLETENESS | 1 | $119,720 | 1 | $139,650 | 16 | $148,891 | 3 | $115,110 | 0 | $0 | 1 | $47,150 | 0 | $0 |
Detailed HMDA statistics for the following Tracts: 0260.00 , 0261.00, 0262.00, 0263.00, 0278.03, 0278.04, 0278.05
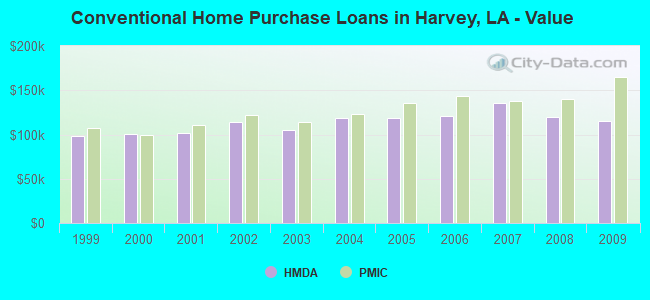
| Private Mortgage Insurance Companies Aggregated Statistics For Year 2009 (Based on 3 full and 2 partial tracts) | ||||
| A) Conventional Home Purchase Loans | B) Refinancings | |||
|---|---|---|---|---|
| Number | Average Value | Number | Average Value | |
| LOANS ORIGINATED | 5 | $164,798 | 4 | $152,520 |
| APPLICATIONS APPROVED, NOT ACCEPTED | 2 | $86,840 | 2 | $178,775 |
| APPLICATIONS DENIED | 3 | $157,943 | 3 | $167,713 |
| APPLICATIONS WITHDRAWN | 0 | $0 | 1 | $188,800 |
| FILES CLOSED FOR INCOMPLETENESS | 0 | $0 | 1 | $134,900 |
Detailed PMIC statistics for the following Tracts: 0260.00 , 0261.00, 0262.00, 0263.00, 0278.03, 0278.04, 0278.05
2002 - 2018 National Fire Incident Reporting System (NFIRS) incidents
- Fire incident types reported to NFIRS in Harvey, LA
- 1,13152.7%Structure Fires
- 54725.5%Outside Fires
- 45321.1%Mobile Property/Vehicle Fires
- 150.7%Other
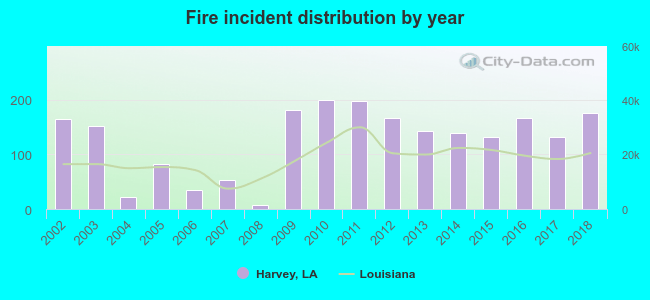 Based on the data from the years 2002 - 2018 the average number of fires per year is 126. The highest number of reported fires - 199 took place in 2010, and the least - 7 in 2008. The data has an increasing trend.
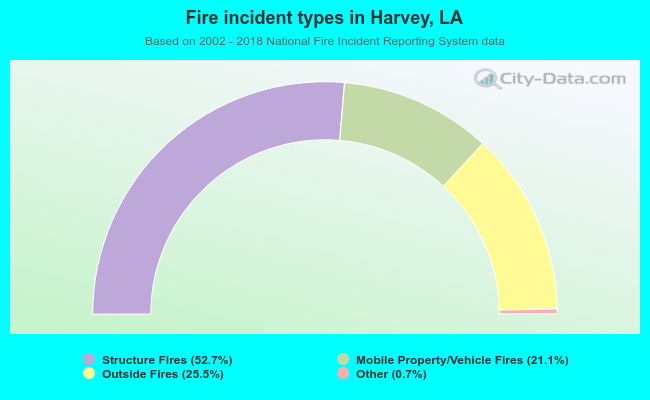 When looking into fire subcategories, the most incidents belonged to: Structure Fires (52.7%), and Outside Fires (25.5%).
Fire-safe hotels and motels in Harvey, Louisiana:
- Sun Suites Of New Orleans-Harvey, 1101 Manhattan Blvd, Harvey, Louisiana 70058 , Phone: (504) 365-9676, Fax: (504) 365-9691
- Best Western Westbank, 1700 Lapalco Blvd, Harvey, Louisiana 70058 , Phone: (504) 366-5369, Fax: (504) 262-0949
- Holiday Inn Express - Harvey, 2933 Manhatton Blvd, Harvey, Louisiana 70058 , Phone: (504) 366-5055, Fax: (504) 366-5018
- Comfort Suites, 1611 Elton Court Rd, Harvey, Louisiana 70058 , Phone: (504) 361-9110, Fax: (504) 361-9148
- Hampton Inn & Suites, 1651 5th St, Harvey, Louisiana 70058 , Phone: (504) 371-6666
- TownePlace Suites by Marriott New Orleans Harvey/West Bank, 1800 Central Blvd, Harvey, Louisiana 70058 , Phone: (504) 495-1144, Fax: (504) 495-1308
| Most common first names in Harvey, LA among deceased individuals | ||
| Name | Count | Lived (average) |
|---|---|---|
| John | 114 | 69.1 years |
| Joseph | 109 | 69.8 years |
| Mary | 97 | 75.4 years |
| James | 83 | 67.9 years |
| Charles | 71 | 67.9 years |
| Robert | 59 | 63.3 years |
| William | 54 | 66.2 years |
| George | 46 | 70.9 years |
| Henry | 42 | 73.9 years |
| Willie | 41 | 68.6 years |
| Most common last names in Harvey, LA among deceased individuals | ||
| Last name | Count | Lived (average) |
|---|---|---|
| Williams | 63 | 72.2 years |
| Johnson | 55 | 70.6 years |
| Brown | 50 | 66.0 years |
| Smith | 47 | 69.0 years |
| Adams | 35 | 71.7 years |
| Davis | 33 | 67.5 years |
| Jones | 33 | 69.1 years |
| Landry | 32 | 72.4 years |
| Boudreaux | 30 | 73.7 years |
| Jackson | 27 | 67.1 years |
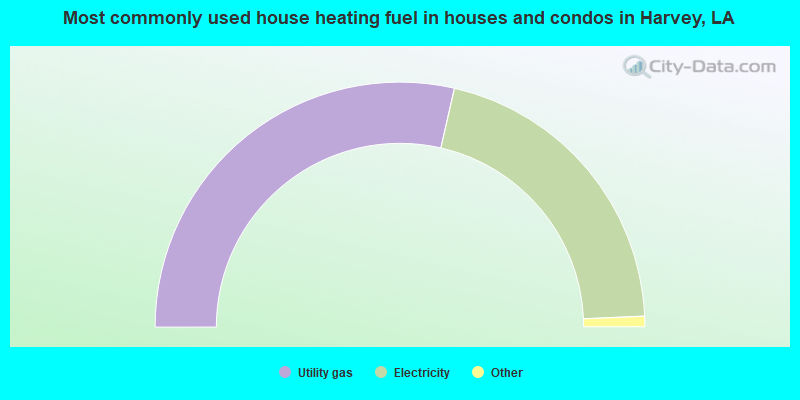
- 57.2%Utility gas
- 41.5%Electricity
- 0.7%Bottled, tank, or LP gas
- 0.4%Solar energy
- 0.2%No fuel used
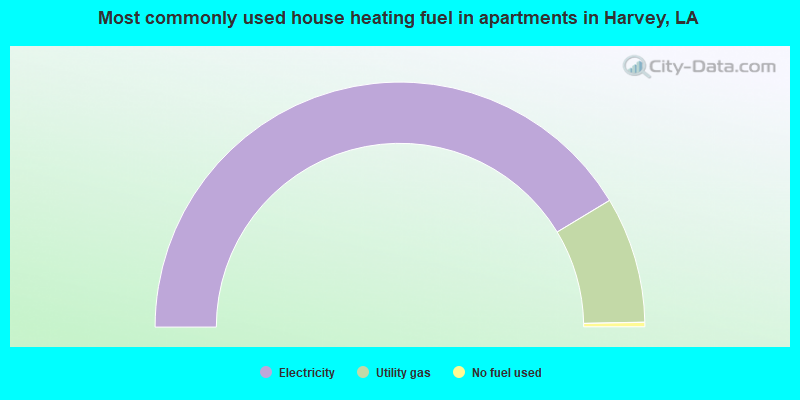
- 82.7%Electricity
- 16.7%Utility gas
- 0.6%No fuel used
Harvey compared to Louisiana state average:
- Unemployed percentage below state average.
- Hispanic race population percentage above state average.
- Foreign-born population percentage significantly above state average.
- Length of stay since moving in above state average.
Harvey on our top lists:
- #37 on the list of "Top 101 cities with largest percentage of males in occupations: construction and extraction occupations (population 5,000+)"
- #65 on the list of "Top 101 cities with the most residents born in Honduras (population 500+)"
- #93 on the list of "Top 101 cities with the most residents born in Vietnam (population 500+)"
- #99 on the list of "Top 101 cities with the most recent year of entry for the foreign-born population (2,000+ people)+"
- #25 (70058) on the list of "Top 101 zip codes with the largest percentage of French first ancestries (pop 5,000+)"
- #46 on the list of "Top 101 counties with the lowest percentage of residents that drank alcohol in the past 30 days"
- #49 on the list of "Top 101 counties with the largest decrease in the number of infant deaths per 1000 residents 2000-2006 to 2007-2013 (pop. 50,000+)"
- #50 on the list of "Top 101 counties with the largest increase in the number of births per 1000 residents 2000-2006 to 2007-2013 (pop 50,000+)"
- #64 on the list of "Top 101 counties with the highest number of infant deaths per 1000 residents 2007-2013 (pop. 50,000+)"
- #68 on the list of "Top 101 counties with the highest surface withdrawal of fresh water for public supply (pop. 50,000+)"

|
|
Total of 26 patent applications in 2008-2024.