According to our research of Arkansas and other state lists, there were 2 registered sex offenders living in Haskell, Arkansas as of April 28, 2024. The ratio of all residents to sex offenders in Haskell is 2,203 to 1. The ratio of registered sex offenders to all residents in this city is much lower than the state average.
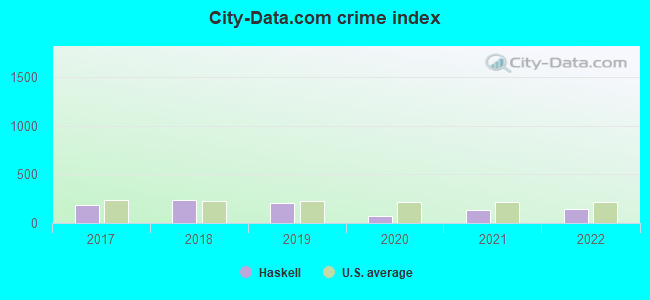
Crime rates in Haskell by year
Type
2017
2018
2019
2020
2021
2022
Murders (per 100,000)
0 (0.0)
0 (0.0)
0 (0.0)
0 (0.0)
0 (0.0)
0 (0.0)
Rapes (per 100,000)
5 (110.7)
9 (193.6)
5 (106.0)
0 (0.0)
2 (42.6)
2 (49.2)
Robberies (per 100,000)
0 (0.0)
0 (0.0)
0 (0.0)
1 (21.4)
0 (0.0)
0 (0.0)
Assaults (per 100,000)
7 (155.0)
10 (215.1)
11 (233.3)
4 (85.7)
11 (234.0)
9 (221.6)
Burglaries (per 100,000)
15 (332.2)
2 (43.0)
14 (296.9)
15 (321.4)
21 (446.8)
19 (467.9)
Thefts (per 100,000)
47 (1,041)
32 (688.3)
59 (1,251)
22 (471.4)
28 (595.7)
22 (541.7)
Auto thefts (per 100,000)
3 (66.4)
2 (43.0)
3 (63.6)
4 (85.7)
2 (42.6)
4 (98.5)
Arson (per 100,000)
0 (0.0)
0 (0.0)
1 (21.2)
1 (21.4)
1 (21.3)
0 (0.0)
City-Data.com crime index
189.8
231.9
207.4
71.8
139.4
146.0
The City-Data.com crime index weighs serious crimes and violent crimes more heavily. Higher means more crime, U.S. average is 246.1. It adjusts for the number of visitors and daily workers commuting into cities.
Latest news from Haskell, AR collected exclusively by city-data.com from local newspapers, TV, and radio stations
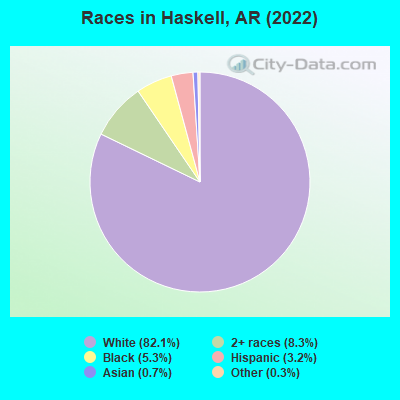
Ancestries: American (22.7%), German (10.4%), Irish (10.3%), English (9.7%), Romanian (3.3%), African (1.5%).
Current Local Time: CST time zone
Elevation: 298 feet
Land area: 4.62 square miles.
Population density: 874 people per square mile (low).
24 residents are foreign born
This city:
0.6%
Arkansas:
5.0%
Median real estate property taxes paid for housing units with mortgages in 2022: $1,214 (0.7%) Median real estate property taxes paid for housing units with no mortgage in 2022: $1,288 (0.8%)
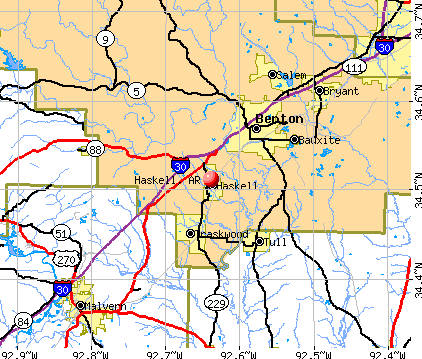
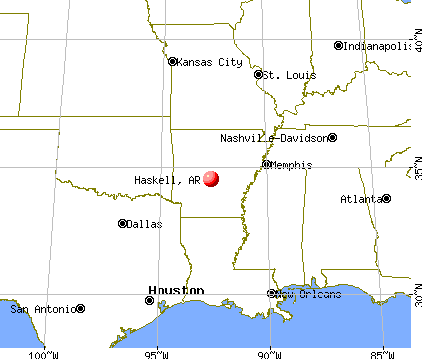
Nearest city with pop. 50,000+: Little Rock, AR (23.4 miles , pop. 183,133).
Nearest city with pop. 200,000+: Shreveport, LA (155.7 miles , pop. 200,145).
Nearest city with pop. 1,000,000+: Dallas, TX (266.6 miles , pop. 1,188,580).
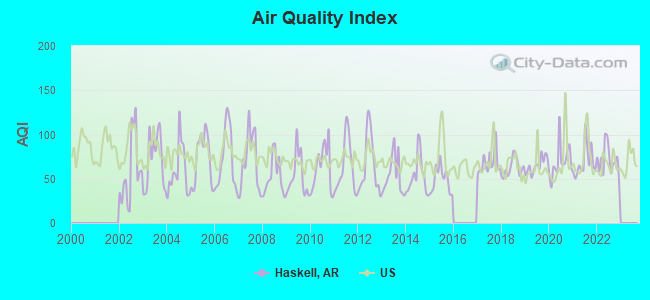
Air Quality Index (AQI) level in 2022 was 70.9. This is about average.
City:
70.9
U.S.:
72.6
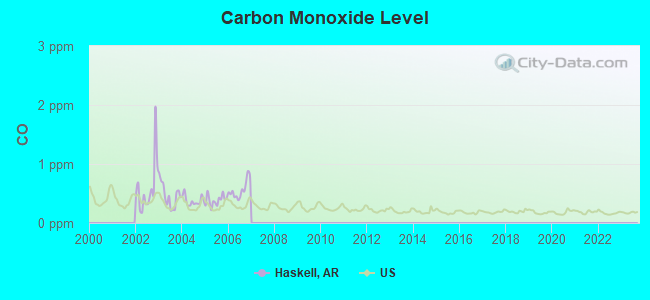
Carbon Monoxide (CO) [ppm] level in 2006 was 0.564. This is significantly worse than average.Closest monitor was 20.6 miles away from the city center.
City:
0.564
U.S.:
0.251
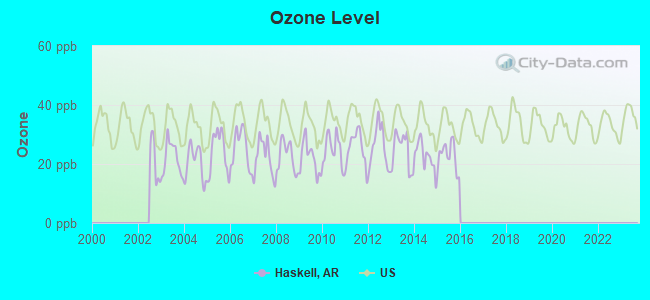
Ozone [ppb] level in 2015 was 22.8. This is significantly better than average.Closest monitor was 20.6 miles away from the city center.
City:
22.8
U.S.:
33.3
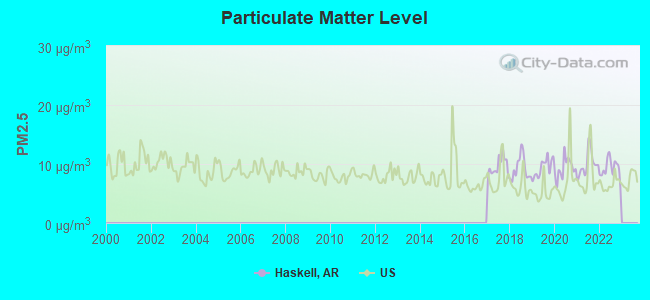
Particulate Matter (PM2.5) [µg/m3] level in 2022 was 9.25. This is about average.Closest monitor was 20.6 miles away from the city center.
City:
9.25
U.S.:
8.11
Tornado activity:
Haskell-area historical tornado activity is slightly above Arkansas state average. It is 129% greater than the overall U.S. average.
On 3/1/1997, a category F4 (max. wind speeds 207-260 mph) tornado 6.8 miles away from the Haskell city center killed 10 peopleand injured 40 people.
On 3/1/1997, a category F4 tornado 10.1 miles away from the city center injured 11 people.
Earthquake activity:
Haskell-area historical earthquake activity is significantly above Arkansas state average. It is 478% greater than the overall U.S. average.
On 11/6/2011 at 03:53:10, a magnitude 5.7 (5.7 MW, Depth: 3.2 mi, Class: Moderate, Intensity: VI - VII) earthquake occurred 244.1 miles away from the city center On 9/3/2016 at 12:02:44, a magnitude 5.8 (5.8 MW, Depth: 3.5 mi) earthquake occurred 275.5 miles away from Haskell center On 1/21/1982 at 00:33:54, a magnitude 4.7 (4.5 MB, 4.7 LG, 4.5 LG, Class: Light, Intensity: IV - V) earthquake occurred 51.7 miles away from Haskell center On 5/4/2001 at 06:42:12, a magnitude 4.7 (4.2 MB, 4.7 LG, 4.5 LG) earthquake occurred 54.2 miles away from Haskell center On 2/28/2011 at 05:00:50, a magnitude 4.7 (4.7 MW, Depth: 2.0 mi) earthquake occurred 54.8 miles away from Haskell center On 3/25/1976 at 00:41:20, a magnitude 5.0 (4.9 MB, 5.0 LG) earthquake occurred 152.2 miles away from the city center Magnitude types: regional Lg-wave magnitude (LG), body-wave magnitude (MB), moment magnitude (MW)
Natural disasters:
The number of natural disasters in Saline County (17) is near the US average (15). Major Disasters (Presidential) Declared: 12 Emergencies Declared: 3
Causes of natural disasters: Storms: 11, Floods: 9, Tornadoes: 8, Winter Storms: 4, Hurricanes: 2, Winds: 2, Other: 1 (Note: some incidents may be assigned to more than one category).
Hospitals and medical centers near Haskell:
SALINE COUNTY HEALTH UNIT (Home Health Center, about 6 miles away; BENTON, AR)
HH SVCS OF SALINE MEMORIAL (Home Health Center, about 6 miles away; BENTON, AR)
HH AND HOSPICE SRVC OF SALINE (Hospital, about 6 miles away; BENTON, AR)
SALINE MEMORIAL HOSPITAL Acute Care Hospitals (about 6 miles away; BENTON, AR)
FMCNA - BENTON (Dialysis Facility, about 7 miles away; BENTON, AR)
STONEYBROOK HEALTH AND REHABILITATION CENTER (Nursing Home, about 8 miles away; BENTON, AR)
RIDGEWOOD HEALTH AND REHAB (Nursing Home, about 8 miles away; BENTON, AR)
Amtrak station near Haskell:
15 miles: MALVERN (200 E. 1ST ST.) . Services: fully wheelchair accessible, public payphones, paid short-term parking, paid long-term parking, call for taxi service.
Colleges/universities with over 2000 students nearest to Haskell:
University of Arkansas at Little Rock (about 23 miles; Little Rock, AR; Full-time enrollment: 9,227)
Pulaski Technical College (about 27 miles; North Little Rock, AR; FT enrollment: 8,396)
National Park Community College (about 28 miles; Hot Springs, AR; FT enrollment: 2,237)
Henderson State University (about 36 miles; Arkadelphia, AR; FT enrollment: 3,528)
University of Arkansas at Pine Bluff (about 40 miles; Pine Bluff, AR; FT enrollment: 2,558)
University of Central Arkansas (about 41 miles; Conway, AR; FT enrollment: 9,972)
Arkansas State University-Beebe (about 58 miles; Beebe, AR; FT enrollment: 3,387)
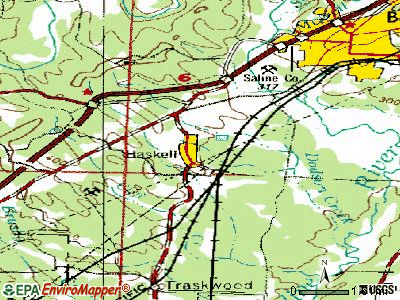
Notable locations in Haskell: Haskell Police Department (A), Haskell Fire Department Station 1 (B), Haskell Fire Department (C). Display/hide their locations on the map
Saline County has a predicted average indoor radon screening level less than 2 pCi/L (pico curies per liter) - Low Potential
Drinking water stations with addresses in Haskell that have no violations reported:
HASKELL WATER SYSTEM (Population served: 3,990,Primary Water Source Type: Purch surface water)
Average household size:
This city:
2.9 people
Arkansas:
2.5 people
Percentage of family households:
This city:
78.5%
Whole state:
67.6%
Percentage of households with unmarried partners:
This city:
6.0%
Whole state:
5.7%
Likely homosexual households (counted as self-reported same-sex unmarried-partner households)
Lesbian couples: 0.2% of all households
Gay men: 0.2% of all households
281 people in group homes intended for adults in 2010
248 people in correctional residential facilities in 2010
People in group quarters in Haskell in 2000:
236 people in nursing homes
182 people in state prisons
165 people in other nonhousehold living situations
66 people in homes for the mentally ill
64 people in homes or halfway houses for drug/alcohol abuse
3 people in other noninstitutional group quarters
Banks with branches in Haskell (2011 data):
Farmers Bank & Trust Company: Haskell Branch at 112 N. Hwy 229, branch established on 2004/07/19. Info updated 2008/11/05: Bank assets: $734.1 mil, Deposits: $634.1 mil, headquarters in Magnolia, AR, positive income, Commercial Lending Specialization, 13 total offices, Holding Company: Magnolia Banking Corporation
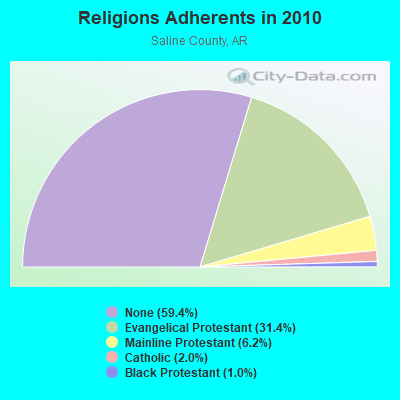
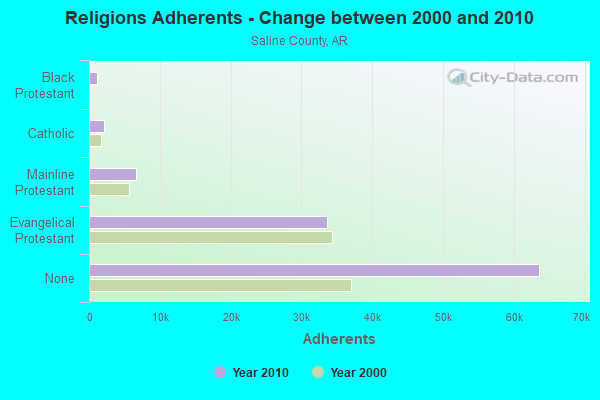
Religion statistics for Haskell, AR (based on Saline County data)
Religion
Adherents
Congregations
Evangelical Protestant
33,609
121
Mainline Protestant
6,680
17
Catholic
2,113
1
Black Protestant
1,081
6
Other
3
1
None
63,632
-
Source: Clifford Grammich, Kirk Hadaway, Richard Houseal, Dale E.Jones, Alexei Krindatch, Richie Stanley and Richard H.Taylor. 2012. 2010 U.S.Religion Census: Religious Congregations & Membership Study. Association of Statisticians of American Religious Bodies. Jones, Dale E., et al. 2002. Congregations and Membership in the United States 2000. Nashville, TN: Glenmary Research Center. Graphs represent county-level data
Stand Pipe West Of City (Lat: 34.503417 Lon: -92.656278), Type: Pole, Structure height: 3 m, Call Sign: WPGK248, Assigned Frequencies: 173.390 MHz, Grant Date: 02/03/2015, Expiration Date: 02/03/2025, Registrant: Business Radio Licensing, 30251 Golden Lantern, Suite E # 501, Laguna Niguel, CA 92677-5993, Phone: (949) 348-8510, Fax: (949) 348-8514, Email:
FCC Registered Microwave Towers:
3
STATION, Mo Pac Right Of Way 1.5 Mi Se Of Jct Of Hwy 67 & Hwy 229 (Lat: 34.515083 Lon: -92.627361), Overall height: 42.7 m, Call Sign: WNTI746, Assigned Frequencies: 928.093 MHz, 952.093 MHz, Grant Date: 03/20/2021, Expiration Date: 04/09/2031, Registrant: Prokarma, 222 So 15th St., Suite 505n, Omaha, NE 68102, Phone: (402) 522-5068, Fax: (402) 346-6676, Email:
Haskell, 935 Graham Road (Ar10909-S) (Lat: 34.506694 Lon: -92.658444), Type: Gtower, Structure height: 86 m, Overall height: 87.2 m, Call Sign: WQYC563, Assigned Frequencies: 10835.0 MHz, 10915.0 MHz, Grant Date: 08/17/2016, Expiration Date: 08/17/2026, Cancellation Date: 10/04/2022, Certifier: Gregory M Romano, Registrant: Verizon, 1300 I St Nw - Suite 500 East, Washington, DC 20005, Phone: (202) 515-2453, Email:
.75 Miles West Of 130/Hwy 70, 2.75 Miles Nnw Of (Lat: 34.533417 Lon: -92.690417), Overall height: 97.5 m, Call Sign: KNKG835, Licensee ID: L00000769, Assigned Frequencies: 931.337 MHz, Grant Date: 09/20/1999, Expiration Date: 04/01/2009, Cancellation Date: 01/31/2008, Certifier: Michael J Batis, Registrant: Teletouch Licenses, Inc.
1 Km West Of I30 And Hwy 70, 4 Km North, Northwest Of (Lat: 34.533417 Lon: -92.690417), Overall height: 97.5 m, Call Sign: KNKG837, Licensee ID: L00000769, Assigned Frequencies: 931.487 MHz, 931.487 MHz, Grant Date: 08/20/1999, Expiration Date: 04/01/2009, Cancellation Date: 01/31/2008, Certifier: Michael J Batis, Registrant: Teletouch Licenses, Inc.
0.75 Miles W Of I30/Highway 70 2.75 Miles Nnw Of (Lat: 34.533417 Lon: -92.690417), Overall height: 97.5 m, Call Sign: KNKM689, Licensee ID: L01422065, Assigned Frequencies: 931.212 MHz, Grant Date: 05/05/2009, Expiration Date: 04/01/2019, Cancellation Date: 01/28/2014, Certifier: Shawn E Endsley, Registrant: Usa Mobility Wireless, Inc., 3000 Technology Dr. #400, Plano, TX 75074, Phone: (972) 801-0000, Fax: (972) 801-1699, Email:
.75mi W Of 130/Hwy70, 2.75mi Nnw Of (Lat: 34.533417 Lon: -92.690417), Type: Tower, Structure height: 64.6 m, Call Sign: KNKO256, Assigned Frequencies: 931.812 MHz, Grant Date: 05/11/1999, Expiration Date: 04/01/2009, Cancellation Date: 05/06/2004, Certifier: Paul H Kuzia, Registrant: Wilkinson Barker Knauer, LLP, 2300 N Street, N.W., 7th Floor, Washington, DC 20037, Phone: (202) 783-4141, Fax: (202) 783-5851, Email:
FCC Registered Amateur Radio Licenses:
2
Call Sign: KD5FAT, Licensee ID: L01418468, Grant Date: 07/23/2008, Expiration Date: 08/18/2018, Cancellation Date: 08/19/2020, Certifier: Rocky O Kasiah, Registrant: Rocky O Kasiah, 322 Hayes, Haskell, AR 72015
Call Sign: KD5YDG, Licensee ID: L00705241, Grant Date: 06/23/2003, Expiration Date: 06/23/2013, Cancellation Date: 06/24/2015, Certifier: Steven L Shepard, Registrant: Steven L Shepard, 134 Rachel Cove, Haskell, AR 72015
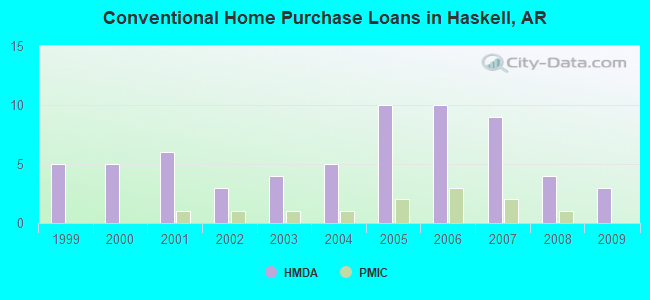
Home Mortgage Disclosure Act Aggregated Statistics For Year 2009 (Based on 1 partial tract)
A) FHA, FSA/RHS & VA Home Purchase Loans
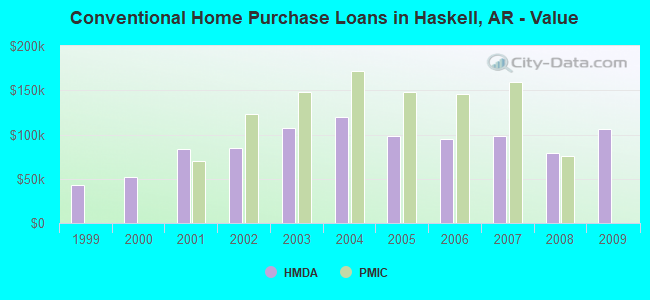
B) Conventional Home Purchase Loans
C) Refinancings
D) Home Improvement Loans
F) Non-occupant Loans on < 5 Family Dwellings (A B C & D)
G) Loans On Manufactured Home Dwelling (A B C & D)
Number
Average Value
Number
Average Value
Number
Average Value
Number
Average Value
Number
Average Value
Number
Average Value
LOANS ORIGINATED
7
$130,441
3
$105,910
7
$168,110
1
$30,490
1
$230,340
1
$39,830
APPLICATIONS APPROVED, NOT ACCEPTED
0
$0
0
$0
0
$0
0
$0
0
$0
1
$39,200
APPLICATIONS DENIED
1
$160,290
1
$37,600
2
$123,170
1
$10,760
0
$0
1
$49,520
APPLICATIONS WITHDRAWN
0
$0
0
$0
2
$142,685
0
$0
0
$0
0
$0
FILES CLOSED FOR INCOMPLETENESS
0
$0
0
$0
0
$0
0
$0
0
$0
0
$0
Aggregated Statistics For Year 2008 (Based on 1 partial tract)
A) FHA, FSA/RHS & VA Home Purchase Loans
B) Conventional Home Purchase Loans
C) Refinancings
D) Home Improvement Loans
F) Non-occupant Loans on < 5 Family Dwellings (A B C & D)
G) Loans On Manufactured Home Dwelling (A B C & D)
Number
Average Value
Number
Average Value
Number
Average Value
Number
Average Value
Number
Average Value
Number
Average Value
LOANS ORIGINATED
4
$131,128
4
$79,588
6
$126,653
2
$30,180
2
$75,565
1
$46,320
APPLICATIONS APPROVED, NOT ACCEPTED
0
$0
0
$0
1
$54,050
0
$0
0
$0
0
$0
APPLICATIONS DENIED
1
$92,460
2
$69,165
3
$129,883
0
$0
0
$0
1
$50,050
APPLICATIONS WITHDRAWN
1
$71,120
0
$0
1
$64,010
0
$0
0
$0
0
$0
FILES CLOSED FOR INCOMPLETENESS
0
$0
0
$0
0
$0
0
$0
0
$0
0
$0
Aggregated Statistics For Year 2007 (Based on 1 partial tract)
A) FHA, FSA/RHS & VA Home Purchase Loans
B) Conventional Home Purchase Loans
C) Refinancings
D) Home Improvement Loans
F) Non-occupant Loans on < 5 Family Dwellings (A B C & D)
G) Loans On Manufactured Home Dwelling (A B C & D)
Number
Average Value
Number
Average Value
Number
Average Value
Number
Average Value
Number
Average Value
Number
Average Value
LOANS ORIGINATED
2
$88,100
9
$97,869
4
$120,438
2
$29,160
3
$69,283
2
$31,515
APPLICATIONS APPROVED, NOT ACCEPTED
0
$0
1
$44,010
1
$127,570
0
$0
0
$0
1
$35,030
APPLICATIONS DENIED
0
$0
2
$68,675
2
$118,150
1
$7,560
1
$74,940
1
$51,830
APPLICATIONS WITHDRAWN
0
$0
1
$78,230
1
$186,960
0
$0
0
$0
0
$0
FILES CLOSED FOR INCOMPLETENESS
0
$0
0
$0
0
$0
0
$0
0
$0
0
$0
Aggregated Statistics For Year 2006 (Based on 1 partial tract)
A) FHA, FSA/RHS & VA Home Purchase Loans
B) Conventional Home Purchase Loans
C) Refinancings
D) Home Improvement Loans
F) Non-occupant Loans on < 5 Family Dwellings (A B C & D)
G) Loans On Manufactured Home Dwelling (A B C & D)
Number
Average Value
Number
Average Value
Number
Average Value
Number
Average Value
Number
Average Value
Number
Average Value
LOANS ORIGINATED
2
$133,485
10
$94,723
6
$88,248
1
$23,470
2
$62,940
1
$59,300
APPLICATIONS APPROVED, NOT ACCEPTED
0
$0
2
$83,700
1
$115,130
0
$0
1
$88,190
1
$53,070
APPLICATIONS DENIED
0
$0
3
$60,897
3
$77,640
1
$7,820
1
$27,830
3
$47,353
APPLICATIONS WITHDRAWN
0
$0
1
$68,100
2
$110,370
0
$0
0
$0
0
$0
FILES CLOSED FOR INCOMPLETENESS
0
$0
0
$0
1
$93,520
0
$0
0
$0
0
$0
Aggregated Statistics For Year 2005 (Based on 1 partial tract)
A) FHA, FSA/RHS & VA Home Purchase Loans
B) Conventional Home Purchase Loans
C) Refinancings
D) Home Improvement Loans
F) Non-occupant Loans on < 5 Family Dwellings (A B C & D)
G) Loans On Manufactured Home Dwelling (A B C & D)
Number
Average Value
Number
Average Value
Number
Average Value
Number
Average Value
Number
Average Value
Number
Average Value
LOANS ORIGINATED
2
$121,395
10
$98,270
5
$116,886
2
$29,560
1
$116,370
2
$54,275
APPLICATIONS APPROVED, NOT ACCEPTED
0
$0
1
$64,100
1
$69,430
0
$0
0
$0
1
$24,360
APPLICATIONS DENIED
0
$0
3
$79,743
3
$78,823
1
$37,340
0
$0
3
$50,763
APPLICATIONS WITHDRAWN
0
$0
1
$66,590
2
$75,700
0
$0
0
$0
0
$0
FILES CLOSED FOR INCOMPLETENESS
0
$0
0
$0
0
$0
0
$0
0
$0
0
$0
Aggregated Statistics For Year 2004 (Based on 1 partial tract)
A) FHA, FSA/RHS & VA Home Purchase Loans
B) Conventional Home Purchase Loans
C) Refinancings
D) Home Improvement Loans
F) Non-occupant Loans on < 5 Family Dwellings (A B C & D)
G) Loans On Manufactured Home Dwelling (A B C & D)
Number
Average Value
Number
Average Value
Number
Average Value
Number
Average Value
Number
Average Value
Number
Average Value
LOANS ORIGINATED
2
$89,035
5
$119,286
6
$82,307
1
$35,830
1
$148,110
2
$36,050
APPLICATIONS APPROVED, NOT ACCEPTED
0
$0
1
$44,360
1
$50,230
0
$0
0
$0
1
$17,600
APPLICATIONS DENIED
0
$0
2
$67,430
3
$87,063
1
$19,470
0
$0
2
$49,385
APPLICATIONS WITHDRAWN
0
$0
0
$0
2
$110,280
0
$0
0
$0
0
$0
FILES CLOSED FOR INCOMPLETENESS
0
$0
0
$0
0
$0
0
$0
0
$0
0
$0
Aggregated Statistics For Year 2003 (Based on 1 partial tract)
A) FHA, FSA/RHS & VA Home Purchase Loans
B) Conventional Home Purchase Loans
C) Refinancings
D) Home Improvement Loans
F) Non-occupant Loans on < 5 Family Dwellings (A B C & D)
Number
Average Value
Number
Average Value
Number
Average Value
Number
Average Value
Number
Average Value
LOANS ORIGINATED
2
$75,920
4
$107,525
9
$97,503
1
$12,620
1
$60,360
APPLICATIONS APPROVED, NOT ACCEPTED
0
$0
1
$121,880
2
$73,565
0
$0
0
$0
APPLICATIONS DENIED
0
$0
3
$54,553
5
$78,658
0
$0
0
$0
APPLICATIONS WITHDRAWN
0
$0
0
$0
2
$72,010
0
$0
0
$0
FILES CLOSED FOR INCOMPLETENESS
0
$0
0
$0
0
$0
0
$0
0
$0
Aggregated Statistics For Year 2002 (Based on 1 partial tract)
A) FHA, FSA/RHS & VA Home Purchase Loans
B) Conventional Home Purchase Loans
C) Refinancings
D) Home Improvement Loans
F) Non-occupant Loans on < 5 Family Dwellings (A B C & D)
Number
Average Value
Number
Average Value
Number
Average Value
Number
Average Value
Number
Average Value
LOANS ORIGINATED
3
$89,730
3
$84,633
8
$105,324
2
$15,645
1
$52,360
APPLICATIONS APPROVED, NOT ACCEPTED
0
$0
2
$35,915
1
$100,100
0
$0
0
$0
APPLICATIONS DENIED
1
$66,940
2
$62,450
4
$80,388
1
$16,270
0
$0
APPLICATIONS WITHDRAWN
0
$0
0
$0
2
$80,230
0
$0
0
$0
FILES CLOSED FOR INCOMPLETENESS
0
$0
0
$0
0
$0
0
$0
0
$0
Aggregated Statistics For Year 2001 (Based on 1 partial tract)
A) FHA, FSA/RHS & VA Home Purchase Loans
B) Conventional Home Purchase Loans
C) Refinancings
D) Home Improvement Loans
F) Non-occupant Loans on < 5 Family Dwellings (A B C & D)
Number
Average Value
Number
Average Value
Number
Average Value
Number
Average Value
Number
Average Value
LOANS ORIGINATED
2
$81,345
6
$83,907
7
$87,046
3
$12,240
1
$40,090
APPLICATIONS APPROVED, NOT ACCEPTED
0
$0
2
$69,740
1
$116,280
0
$0
0
$0
APPLICATIONS DENIED
0
$0
5
$37,284
3
$44,273
1
$15,380
0
$0
APPLICATIONS WITHDRAWN
0
$0
0
$0
2
$74,010
0
$0
0
$0
FILES CLOSED FOR INCOMPLETENESS
0
$0
0
$0
1
$62,500
0
$0
0
$0
Aggregated Statistics For Year 2000 (Based on 1 partial tract)
A) FHA, FSA/RHS & VA Home Purchase Loans
B) Conventional Home Purchase Loans
C) Refinancings
D) Home Improvement Loans
F) Non-occupant Loans on < 5 Family Dwellings (A B C & D)
Number
Average Value
Number
Average Value
Number
Average Value
Number
Average Value
Number
Average Value
LOANS ORIGINATED
1
$95,030
5
$51,810
3
$60,067
2
$13,070
1
$18,850
APPLICATIONS APPROVED, NOT ACCEPTED
0
$0
2
$47,875
0
$0
0
$0
0
$0
APPLICATIONS DENIED
0
$0
4
$34,915
3
$47,533
1
$5,690
0
$0
APPLICATIONS WITHDRAWN
0
$0
0
$0
2
$56,805
0
$0
0
$0
FILES CLOSED FOR INCOMPLETENESS
0
$0
0
$0
1
$23,650
0
$0
0
$0
Aggregated Statistics For Year 1999 (Based on 1 partial tract)
A) FHA, FSA/RHS & VA Home Purchase Loans
B) Conventional Home Purchase Loans
C) Refinancings
D) Home Improvement Loans
F) Non-occupant Loans on < 5 Family Dwellings (A B C & D)
Detailed PMIC statistics for the following Tracts:0105.03
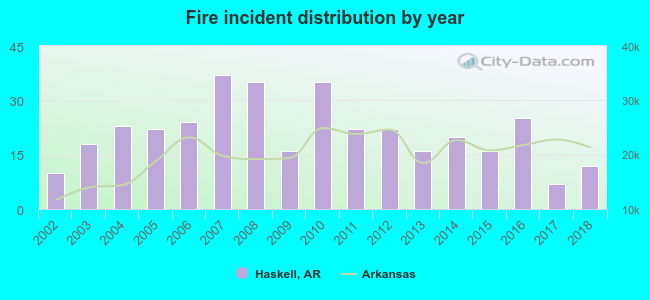
2002 - 2018 National Fire Incident Reporting System (NFIRS) incidents
According to the data from the years 2002 - 2018 the average number of fires per year is 21. The highest number of fire incidents - 37 took place in 2007, and the least - 7 in 2017. The data has a rising trend.
When looking into fire subcategories, the most reports belonged to: Outside Fires (55.0%), and Structure Fires (35.3%).
Fire incident types reported to NFIRS in Haskell, AR
#10 on the list of "Top 101 cities with the largest percentage of people in other nonhousehold living situations (population 1,000+)"
#15 on the list of "Top 101 cities with the largest percentage of people in homes for the mentally ill (population 1,000+)"
#18 on the list of "Top 101 cities with the largest percentage of people in homes or halfway houses for drug/alcohol abuse (population 1,000+)"
#16 on the list of "Top 101 counties with the largest number of people moving in compared to moving out (pop. 50,000+)"
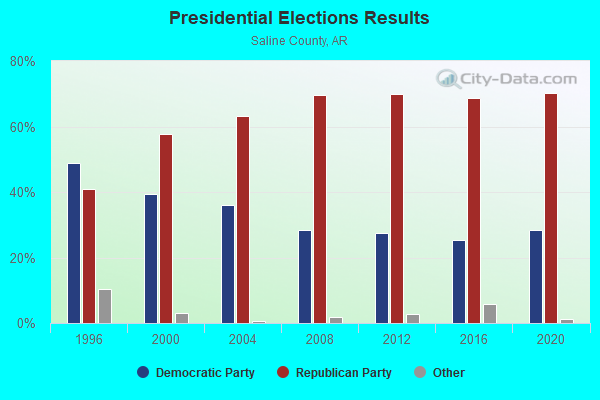
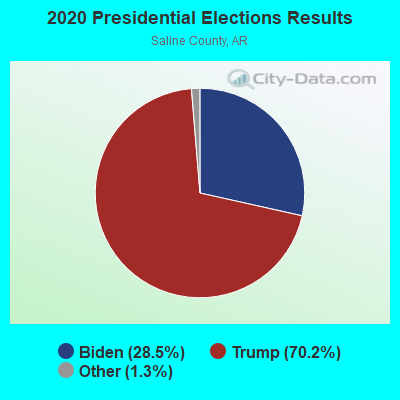
#77 on the list of "Top 101 counties with highest percentage of residents voting for 3rd party candidates in the 2012 Presidential Election (pop. 50,000+)"
#99 on the list of "Top 101 counties with highest percentage of residents voting for Romney (Republican) in the 2012 Presidential Election (pop. 50,000+)"
There is 1 pilot and no other airmen in this city.


 Recent articles from our blog. Our writers, many of them Ph.D. graduates or candidates, create easy-to-read articles on a wide variety of topics.

 (23.4 miles


 According to the data from the years 2002 - 2018 the average number of fires per year is 21. The highest number of fire incidents - 37 took place in 2007, and the least - 7 in 2017. The data has a rising trend.
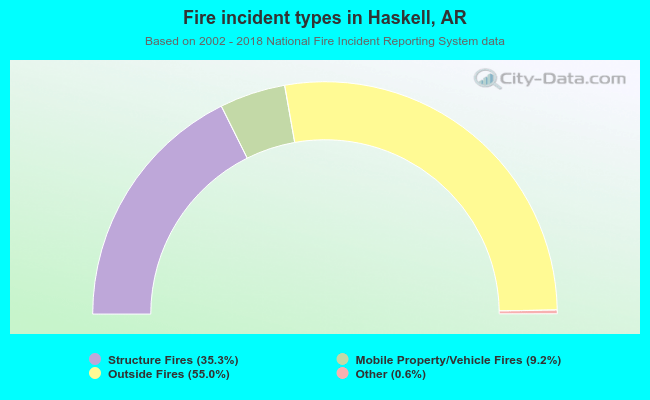 When looking into fire subcategories, the most reports belonged to: Outside Fires (55.0%), and Structure Fires (35.3%).