Hopkins, Minnesota

Submit your own pictures of this city and show them to the world
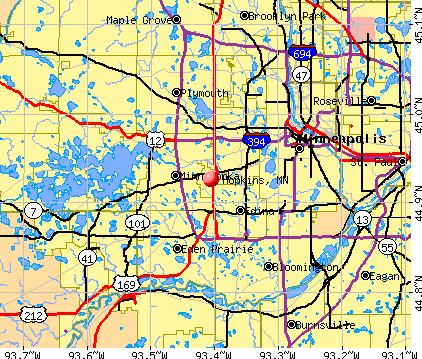
- OSM Map
- General Map
- Google Map
- MSN Map
Population change since 2000: +6.6%
 |
| Males: 8,792 | |
| Females: 9,477 |
| Median resident age: | 35.7 years |
| Minnesota median age: | 39.0 years |
Zip codes: 55305.
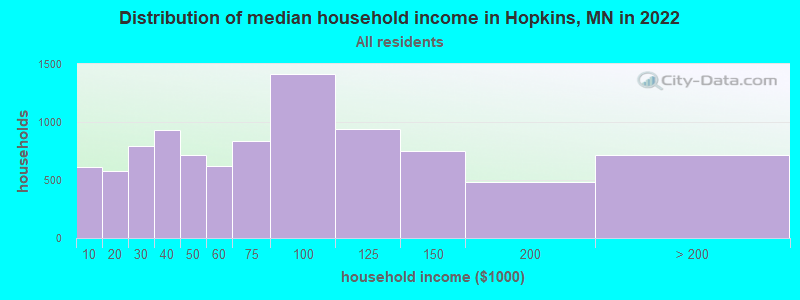
| Hopkins: | $67,640 |
| MN: | $82,338 |
Estimated per capita income in 2022: $45,669 (it was $26,759 in 2000)
Hopkins city income, earnings, and wages data
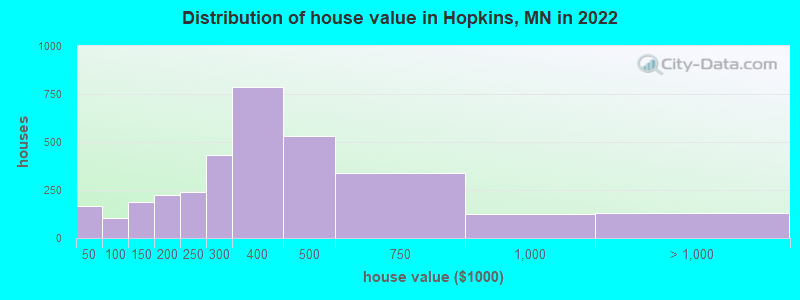
Estimated median house or condo value in 2022: $337,283 (it was $126,100 in 2000)
| Hopkins: | $337,283 |
| MN: | $314,600 |
Mean prices in 2022: all housing units: $376,416; detached houses: $425,853; townhouses or other attached units: $309,910; in 2-unit structures: $324,859; in 3-to-4-unit structures: $78,001; in 5-or-more-unit structures: $201,794
Median gross rent in 2022: $1,285.
(6.6% for White Non-Hispanic residents, 7.3% for Black residents, 20.7% for Hispanic or Latino residents, 7.7% for American Indian residents, 31.9% for other race residents, 10.9% for two or more races residents)
Detailed information about poverty and poor residents in Hopkins, MN


Compare current foreclosures in Hopkins, MN:
| Photo | Address | Area | Beds / Baths | Price | Details |
|---|---|---|---|---|---|

|
#1
Chasewood Pkwy Apt 104
Hopkins, MN 55343
|
1,096 sq. feet
|
2 baths 2 beds |
show details | |

|
#2
18th Ave N
Hopkins, MN 55343
|
900 sq. feet
|
1 baths 3 beds |
show details | |

|
#3
18th Ave N
Hopkins, MN 55343
|
1,724 sq. feet
|
1 baths 3 beds |
show details | |

|
#4
Ashley Rd
Hopkins, MN 55343
|
1,758 sq. feet
|
2 baths 3 beds |
show details | |

|
#5
Sherwood Hills Rd
Hopkins, MN 55305
|
3,004 sq. feet
|
4 baths 3 beds |
show details | |

|
#6
16th Ave N
Hopkins, MN 55343
|
1,644 sq. feet
|
2 baths 3 beds |
show details | |

|
#7
6th Ave S
Hopkins, MN 55343
|
1,464 sq. feet
|
1 baths 5 beds |
show details | |

|
#8
Sunset Dr S
Hopkins, MN 55305
|
1,674 sq. feet
|
4 baths 3 beds |
show details | |

|
#9
Westbrooke Way Apt 1
Hopkins, MN 55343
|
918 sq. feet
|
1 baths 2 beds |
show details | |

|
#10
Pepperwood Cir
Hopkins, MN 55305
|
1,374 sq. feet
|
2 baths 3 beds |
show details |
| Photo | Address | Area | Beds / Baths | Price | Details |
|---|---|---|---|---|---|

|
#11
Dominick Dr
Hopkins, MN 55343
|
2,240 sq. feet
|
3 baths 4 beds |
show details | |

|
#12
Cedarwood Rdg
Hopkins, MN 55305
|
1,733 sq. feet
|
3 baths 4 beds |
show details | |

|
#13
Baker Trl
Hopkins, MN 55305
|
2,000 sq. feet
|
4 baths 5 beds |
show details | |

|
#14
Vernon Dr S
Hopkins, MN 55305
|
1,152 sq. feet
|
1 baths 3 beds |
show details | |

|
#15
Cedar Lake Rd Apt 116
Hopkins, MN 55305
|
812 sq. feet
|
1 baths 1 beds |
show details | |
|
|
#16
Shady Oak Rd S
Hopkins, MN 55343
|
2,390 sq. feet
|
3 baths 3 beds |
show details | |

|
#17
Hopkins Xrd
Hopkins, MN 55305
|
2,566 sq. feet
|
1 baths 3 beds |
show details | |

|
#18
Trailwood S
Hopkins, MN 55343
|
1,284 sq. feet
|
3 baths 3 beds |
show details | |

|
#19
11th Ave S Apt 1
Hopkins, MN 55343
|
704 sq. feet
|
1 baths 1 beds |
show details | |

|
#20
Cedar Lake Rd Apt 304
Hopkins, MN 55305
|
1,180 sq. feet
|
2 baths 2 beds |
show details |
| Photo | Address | Area | Beds / Baths | Price | Details |
|---|---|---|---|---|---|

|
#21
20th Ave N
Hopkins, MN 55343
|
- sq. feet
|
5 baths 6 beds |
show details | |

|
#22
8th Ave S
Hopkins, MN 55343
|
- sq. feet
|
- baths - beds |
show details | |

|
#23
5th Ave S Apt 608
Hopkins, MN 55343
|
- sq. feet
|
- baths - beds |
show details | |

|
#24
Old Settlers Trl Apt 8
Hopkins, MN 55343
|
- sq. feet
|
- baths - beds |
show details | |

|
#25
Blake Rd N Apt 320
Hopkins, MN 55343
|
- sq. feet
|
- baths - beds |
show details | |

|
#26
2nd St Ne, Apt 205
Hopkins, MN 55343
|
- sq. feet
|
- baths - beds |
show details | |

|
#27
Greenbrier Rd Apt 200
Hopkins, MN 55305
|
- sq. feet
|
- baths - beds |
show details | |

|
#28
Minnetonka Blvd Apt 205
Hopkins, MN 55305
|
- sq. feet
|
- baths - beds |
show details | |

|
#29
Feltl Ct Apt 331
Hopkins, MN 55343
|
- sq. feet
|
- baths - beds |
show details | |

|
#30
Oak Ridge Rd Apt 108
Hopkins, MN 55305
|
- sq. feet
|
- baths - beds |
show details |
| Photo | Address | Area | Beds / Baths | Price | Details |
|---|---|---|---|---|---|

|
#31
Wayzata Blvd # 226
Hopkins, MN 55305
|
- sq. feet
|
- baths - beds |
show details | |

|
#32
Ridgedale Dr # 222
Hopkins, MN 55305
|
- sq. feet
|
- baths - beds |
show details | |

|
#33
Ridgedale Dr # 123
Hopkins, MN 55305
|
- sq. feet
|
- baths - beds |
show details | |

|
#34
Deer Ridge Ln
Hopkins, MN 55343
|
- sq. feet
|
- baths - beds |
show details | |

|
#35
Cedar Hills Blvd Apt 370
Hopkins, MN 55305
|
- sq. feet
|
- baths - beds |
show details | |

|
#36
5th Ave N Apt 422
Hopkins, MN 55343
|
- sq. feet
|
- baths - beds |
show details | |

|
#37
8th Ave S Apt 314
Hopkins, MN 55343
|
- sq. feet
|
- baths - beds |
show details | |

|
#38
N Van Buren Pl
Hopkins, MN 55343
|
- sq. feet
|
- baths - beds |
show details | |

|
#39
Ridgedale Dr # 241
Hopkins, MN 55305
|
- sq. feet
|
- baths - beds |
show details | |

|
#40
Plymouth Rd Apt 117
Hopkins, MN 55305
|
- sq. feet
|
- baths - beds |
show details |
| Photo | Address | Area | Beds / Baths | Price | Details |
|---|---|---|---|---|---|

|
#41
Marion Ln W Apt 1102
Hopkins, MN 55305
|
- sq. feet
|
- baths - beds |
show details | |

|
#42
7th Ave S
Hopkins, MN 55343
|
- sq. feet
|
- baths - beds |
show details | |

|
#43
Smetana Rd Apt 213
Hopkins, MN 55343
|
- sq. feet
|
- baths - beds |
show details | |

|
#44
Greenbrier Rd Apt 109
Hopkins, MN 55305
|
- sq. feet
|
- baths - beds |
show details | |

|
#45
Shadyside Cir
Hopkins, MN 55343
|
- sq. feet
|
- baths - beds |
show details | |

|
#46
Berkshire Dr
Hopkins, MN 55343
|
- sq. feet
|
- baths - beds |
show details | |

|
#47
Lake St NE Apt 603
Hopkins, MN 55343
|
- sq. feet
|
- baths - beds |
show details | |

|
#48
Carlson Pkwy, Apt 409
Hopkins, MN 55305
|
- sq. feet
|
- baths - beds |
show details | |

|
#49
Marion Ln W Apt 6306
Hopkins, MN 55305
|
- sq. feet
|
- baths - beds |
show details | |

|
Check over 1 million property listings on Foreclosure.com!
|
browse all offers | |||


- 10,85658.4%White alone
- 3,77520.3%Black alone
- 1,6228.7%Two or more races
- 1,4387.7%Hispanic
- 9495.1%Asian alone
- 600.3%Other race alone
- 300.2%American Indian alone
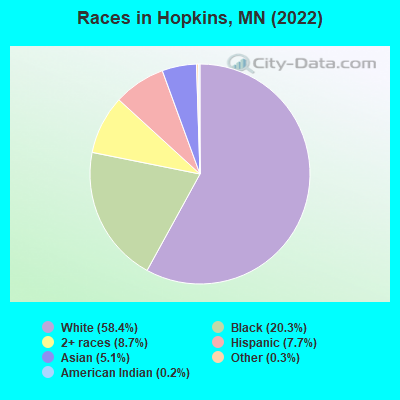
Races in Hopkins detailed stats: ancestries, foreign born residents, place of birth
Type |
2009 |
2010 |
2011 |
2012 |
2013 |
2014 |
2015 |
2016 |
2017 |
2018 |
2019 |
2020 |
2021 |
2022 |
|---|---|---|---|---|---|---|---|---|---|---|---|---|---|---|
| Murders (per 100,000) | 1 (5.9) | 0 (0.0) | 0 (0.0) | 0 (0.0) | 0 (0.0) | 0 (0.0) | 0 (0.0) | 0 (0.0) | 1 (5.5) | 0 (0.0) | 1 (5.3) | 0 (0.0) | 1 (5.5) | 0 (0.0) |
| Rapes (per 100,000) | 14 (82.8) | 13 (73.9) | 7 (39.5) | 8 (44.6) | 5 (27.6) | 8 (44.1) | 9 (49.5) | 11 (60.5) | 5 (27.5) | 7 (37.2) | 9 (48.0) | 11 (59.2) | 6 (32.8) | 3 (16.6) |
| Robberies (per 100,000) | 16 (94.6) | 11 (62.5) | 11 (62.1) | 10 (55.7) | 11 (60.7) | 12 (66.2) | 10 (55.0) | 11 (60.5) | 10 (55.0) | 7 (37.2) | 5 (26.7) | 7 (37.7) | 11 (60.2) | 2 (11.0) |
| Assaults (per 100,000) | 18 (106.4) | 9 (51.2) | 17 (95.9) | 13 (72.4) | 18 (99.4) | 17 (93.8) | 23 (126.6) | 22 (121.1) | 17 (93.5) | 18 (95.6) | 18 (96.1) | 22 (118.5) | 33 (180.6) | 31 (171.0) |
| Burglaries (per 100,000) | 107 (632.6) | 100 (568.5) | 98 (552.8) | 84 (467.9) | 71 (392.1) | 92 (507.4) | 58 (319.3) | 58 (319.2) | 46 (252.9) | 52 (276.0) | 47 (250.9) | 58 (312.4) | 71 (388.6) | 56 (309.0) |
| Thefts (per 100,000) | 279 (1,649) | 374 (2,126) | 333 (1,878) | 292 (1,627) | 342 (1,889) | 346 (1,908) | 276 (1,519) | 305 (1,679) | 176 (967.6) | 262 (1,391) | 218 (1,164) | 344 (1,853) | 360 (1,970) | 311 (1,716) |
| Auto thefts (per 100,000) | 47 (277.9) | 21 (119.4) | 16 (90.3) | 31 (172.7) | 37 (204.3) | 28 (154.4) | 29 (159.6) | 15 (82.6) | 31 (170.4) | 20 (106.2) | 27 (144.1) | 48 (258.5) | 53 (290.1) | 54 (297.9) |
| Arson (per 100,000) | 6 (35.5) | 4 (22.7) | 6 (33.8) | 0 (0.0) | 0 (0.0) | 2 (11.0) | 4 (22.0) | 4 (22.0) | 2 (11.0) | 0 (0.0) | 1 (5.3) | 2 (10.8) | 2 (10.9) | 0 (0.0) |
| City-Data.com crime index | 260.2 | 222.5 | 190.4 | 178.5 | 179.5 | 198.1 | 177.4 | 186.9 | 138.2 | 143.4 | 152.0 | 199.1 | 220.6 | 164.9 |
The City-Data.com crime index weighs serious crimes and violent crimes more heavily. Higher means more crime, U.S. average is 246.1. It adjusts for the number of visitors and daily workers commuting into cities.
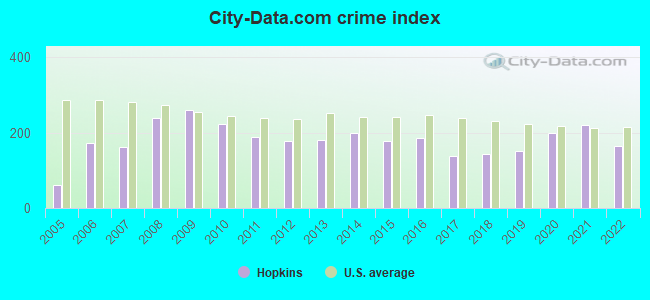
Crime rate in Hopkins detailed stats: murders, rapes, robberies, assaults, burglaries, thefts, arson
Full-time law enforcement employees in 2021, including police officers: 37 (30 officers - 24 male; 6 female).
| Officers per 1,000 residents here: | 1.64 |
| Minnesota average: | 1.76 |
 Recent articles from our blog. Our writers, many of them Ph.D. graduates or candidates, create easy-to-read articles on a wide variety of topics.

 | Is Hopkins Really That Bad? (38 replies) |
| Hopkins/St. Louis Park vs. North St. Paul (14 replies) |
| Plymouth or Eden Prairie Better for a Young Family? (5 replies) |
| Hopkins: What's Where (8 replies) |
| Special Education: Hopkins, Richfield, Edina, ??? (1 reply) |
| Can a Minneapolitan be happy living in Hopkins? (42 replies) |
Latest news from Hopkins, MN collected exclusively by city-data.com from local newspapers, TV, and radio stations
Hopkins, MN City Guides:
Ancestries: German (15.9%), Norwegian (6.0%), American (5.4%), Somali (3.9%), English (3.8%), European (3.8%).
Current Local Time: CST time zone
Incorporated on 11/07/1893
Land area: 4.08 square miles.
Population density: 4,482 people per square mile (average).
2,120 residents are foreign born (4.5% Africa, 3.9% Asia, 2.0% Latin America).
| This city: | 11.4% |
| Minnesota: | 8.5% |
Median real estate property taxes paid for housing units with mortgages in 2022: $4,221 (1.3%)
Median real estate property taxes paid for housing units with no mortgage in 2022: $4,717 (1.2%)
Nearest city with pop. 50,000+: Minnetonka, MN  (2.8 miles , pop. 51,301).
Nearest city with pop. 200,000+: Minneapolis, MN (7.2 miles , pop. 382,618).
Nearest city with pop. 1,000,000+: Chicago, IL (358.2 miles , pop. 2,896,016).
Nearest cities:
), ), )Latitude: 44.93 N, Longitude: 93.41 W
Daytime population change due to commuting: +2,523 (+13.6%)
Workers who live and work in this city: 2,927 (29.4%)

Hopkins, Minnesota accommodation & food services, waste management - Economy and Business Data
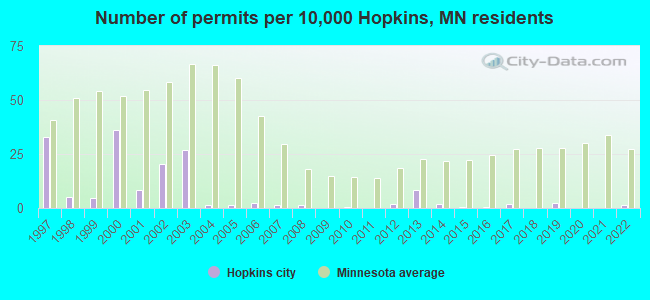
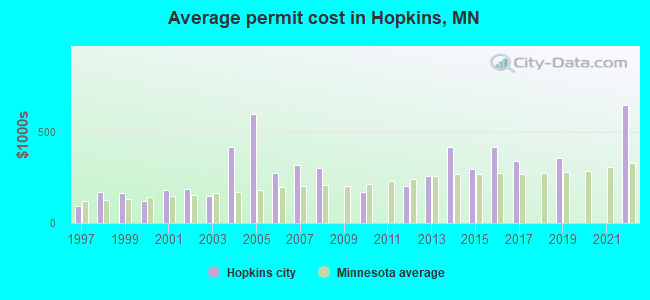
Single-family new house construction building permits:
- 2022: 2 buildings, average cost: $649,000
- 2019: 4 buildings, average cost: $356,300
- 2017: 3 buildings, average cost: $343,300
- 2016: 1 building, cost: $420,000
- 2015: 1 building, cost: $296,200
- 2014: 3 buildings, average cost: $420,000
- 2013: 14 buildings, average cost: $257,000
- 2012: 3 buildings, average cost: $200,500
- 2010: 1 building, cost: $170,000
- 2008: 2 buildings, average cost: $305,000
- 2007: 2 buildings, average cost: $320,000
- 2006: 4 buildings, average cost: $273,300
- 2005: 2 buildings, average cost: $600,000
- 2004: 2 buildings, average cost: $418,500
- 2003: 46 buildings, average cost: $150,900
- 2002: 35 buildings, average cost: $184,800
- 2001: 14 buildings, average cost: $180,900
- 2000: 62 buildings, average cost: $121,800
- 1999: 8 buildings, average cost: $162,700
- 1998: 9 buildings, average cost: $172,400
- 1997: 56 buildings, average cost: $91,100
| Here: | 2.2% |
| Minnesota: | 2.6% |
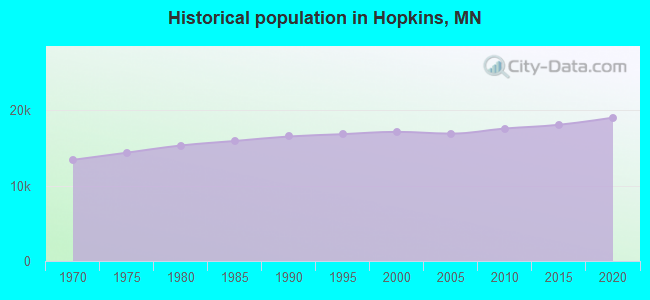
Population change in the 1990s: +600 (+3.6%).
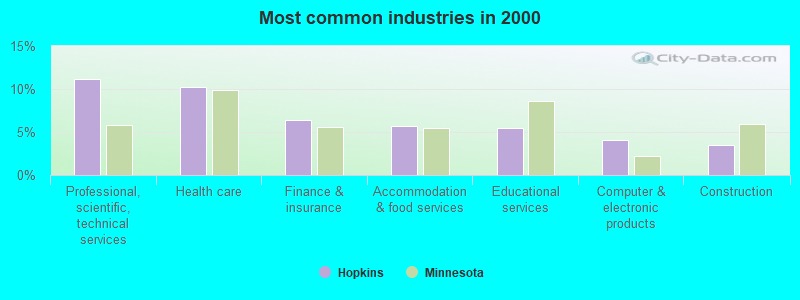
- Professional, scientific, technical services (11.2%)
- Health care (10.2%)
- Finance & insurance (6.4%)
- Accommodation & food services (5.7%)
- Educational services (5.5%)
- Computer & electronic products (4.0%)
- Construction (3.4%)
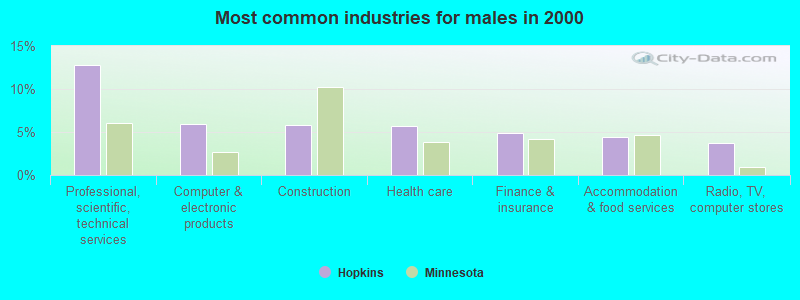
- Professional, scientific, technical services (12.8%)
- Computer & electronic products (5.9%)
- Construction (5.8%)
- Health care (5.7%)
- Finance & insurance (4.9%)
- Accommodation & food services (4.4%)
- Radio, TV, computer stores (3.8%)
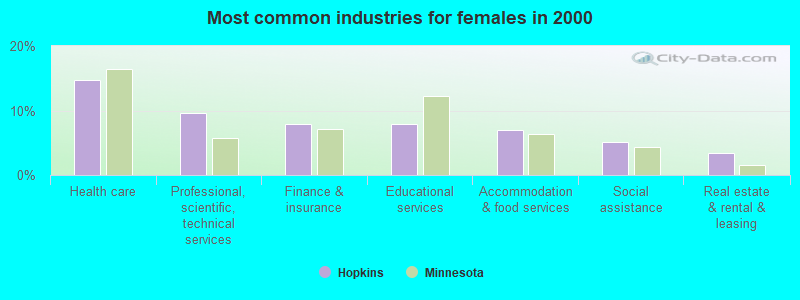
- Health care (14.7%)
- Professional, scientific, technical services (9.6%)
- Finance & insurance (7.9%)
- Educational services (7.9%)
- Accommodation & food services (6.9%)
- Social assistance (5.1%)
- Real estate & rental & leasing (3.5%)
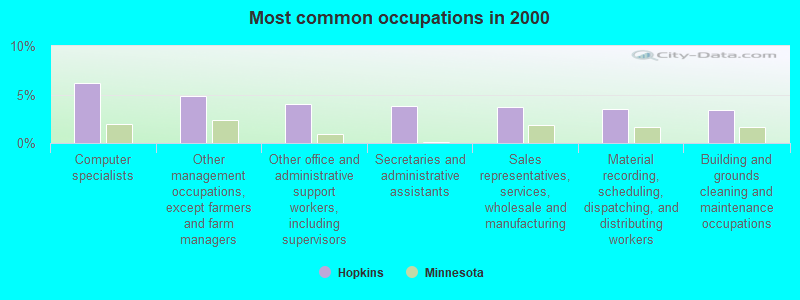
- Computer specialists (6.2%)
- Other management occupations, except farmers and farm managers (4.8%)
- Other office and administrative support workers, including supervisors (4.0%)
- Secretaries and administrative assistants (3.8%)
- Sales representatives, services, wholesale and manufacturing (3.7%)
- Material recording, scheduling, dispatching, and distributing workers (3.5%)
- Building and grounds cleaning and maintenance occupations (3.4%)
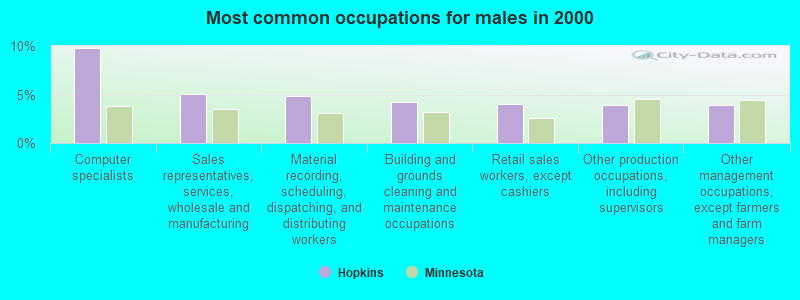
- Computer specialists (9.8%)
- Sales representatives, services, wholesale and manufacturing (5.0%)
- Material recording, scheduling, dispatching, and distributing workers (4.9%)
- Building and grounds cleaning and maintenance occupations (4.2%)
- Retail sales workers, except cashiers (4.0%)
- Other production occupations, including supervisors (3.9%)
- Other management occupations, except farmers and farm managers (3.9%)
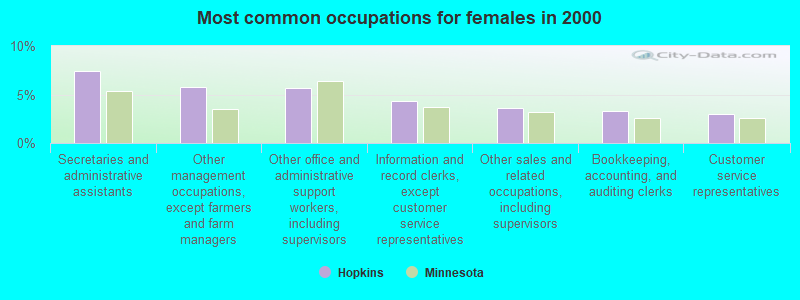
- Secretaries and administrative assistants (7.5%)
- Other management occupations, except farmers and farm managers (5.8%)
- Other office and administrative support workers, including supervisors (5.6%)
- Information and record clerks, except customer service representatives (4.4%)
- Other sales and related occupations, including supervisors (3.6%)
- Bookkeeping, accounting, and auditing clerks (3.3%)
- Customer service representatives (3.0%)
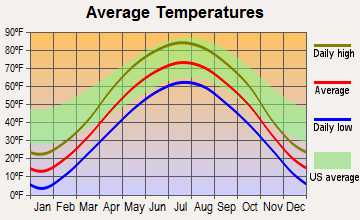
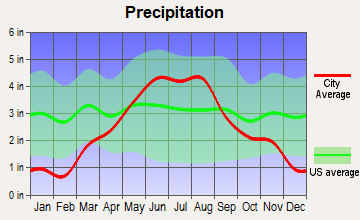
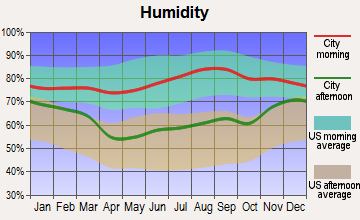
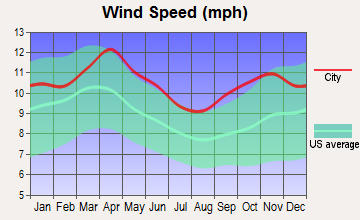
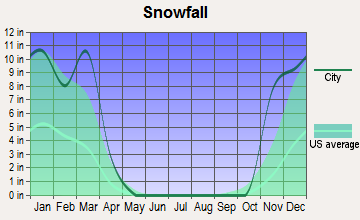
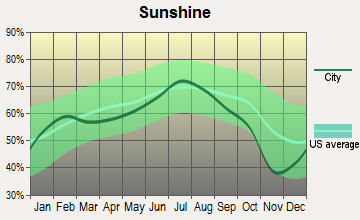
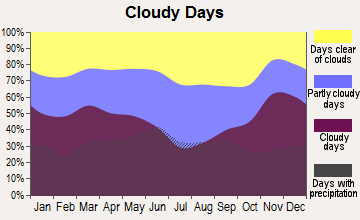
Average climate in Hopkins, Minnesota
Based on data reported by over 4,000 weather stations
|
|


(lower is better)
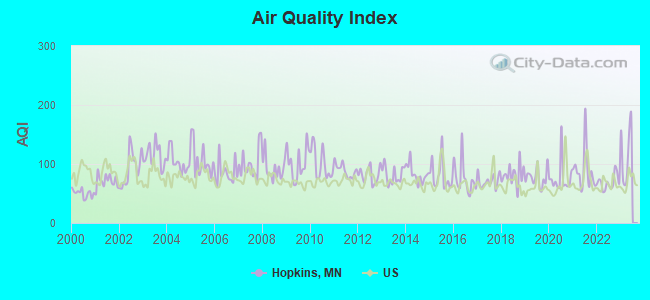
Air Quality Index (AQI) level in 2022 was 68.7. This is about average.
| City: | 68.7 |
| U.S.: | 72.6 |
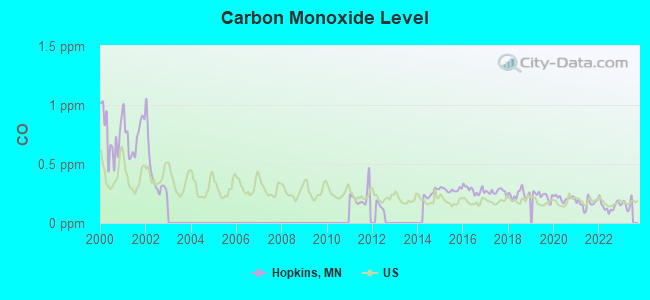
Carbon Monoxide (CO) [ppm] level in 2022 was 0.144. This is significantly better than average. Closest monitor was 6.1 miles away from the city center.
| City: | 0.144 |
| U.S.: | 0.251 |
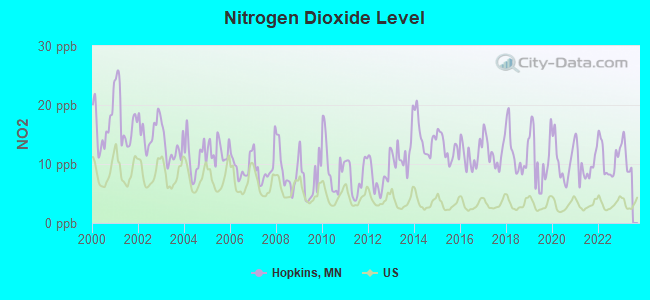
Nitrogen Dioxide (NO2) [ppb] level in 2022 was 10.8. This is significantly worse than average. Closest monitor was 6.2 miles away from the city center.
| City: | 10.8 |
| U.S.: | 5.1 |
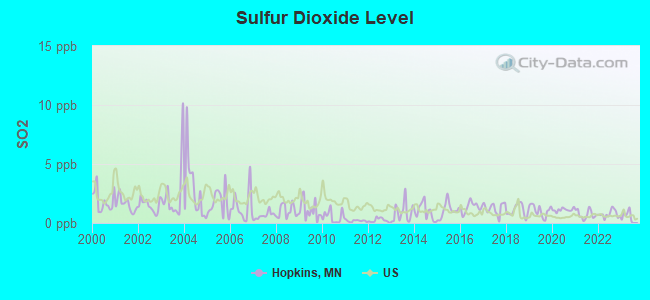
Sulfur Dioxide (SO2) [ppb] level in 2022 was 0.761. This is significantly better than average. Closest monitor was 3.4 miles away from the city center.
| City: | 0.761 |
| U.S.: | 1.515 |
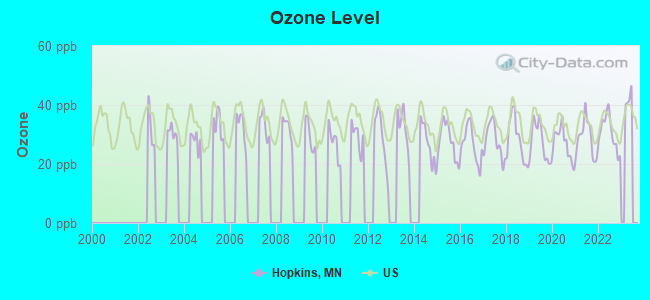
Ozone [ppb] level in 2022 was 30.7. This is about average. Closest monitor was 7.3 miles away from the city center.
| City: | 30.7 |
| U.S.: | 33.3 |
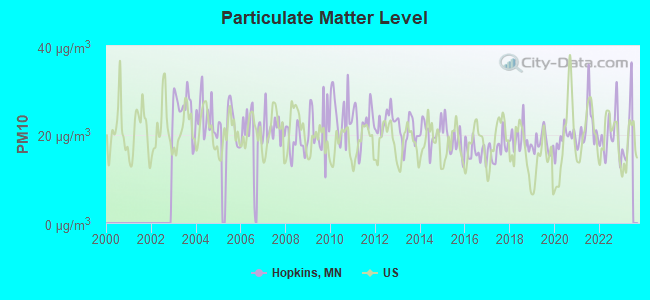
Particulate Matter (PM10) [µg/m3] level in 2022 was 19.7. This is about average. Closest monitor was 3.4 miles away from the city center.
| City: | 19.7 |
| U.S.: | 19.2 |
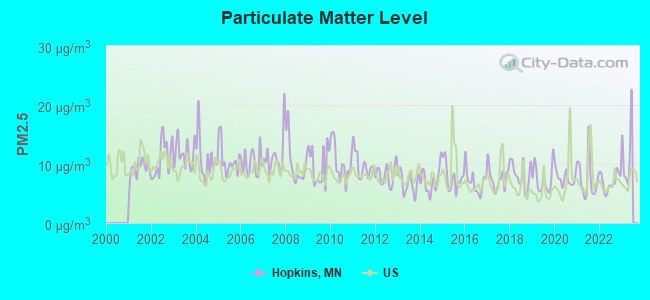
Particulate Matter (PM2.5) [µg/m3] level in 2022 was 7.01. This is about average. Closest monitor was 3.4 miles away from the city center.
| City: | 7.01 |
| U.S.: | 8.11 |
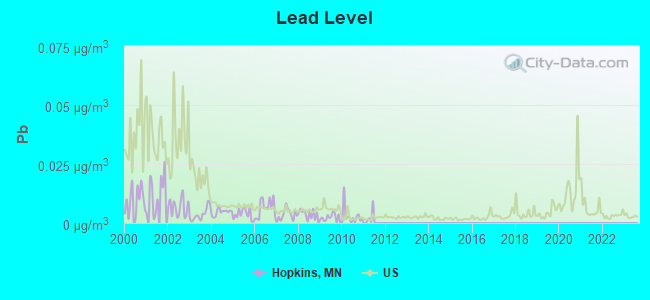
Lead (Pb) [µg/m3] level in 2010 was 0.00278. This is significantly better than average. Closest monitor was 2.1 miles away from the city center.
| City: | 0.00278 |
| U.S.: | 0.00931 |
Tornado activity:
Hopkins-area historical tornado activity is slightly above Minnesota state average. It is 31% greater than the overall U.S. average.
On 5/6/1965, a category F4 (max. wind speeds 207-260 mph) tornado 3.9 miles away from the Hopkins city center killed 6 people and injured 158 people and caused between $5,000,000 and $50,000,000 in damages.
On 5/6/1965, a category F4 tornado 6.3 miles away from the city center caused between $5,000,000 and $50,000,000 in damages.
Earthquake activity:
Hopkins-area historical earthquake activity is significantly above Minnesota state average. It is 54% smaller than the overall U.S. average.On 7/9/1975 at 14:54:15, a magnitude 4.6 (4.6 MB, Class: Light, Intensity: IV - V) earthquake occurred 138.1 miles away from Hopkins center
On 6/5/1993 at 01:24:53, a magnitude 4.1 (4.1 LG, Depth: 6.2 mi) earthquake occurred 149.7 miles away from Hopkins center
On 3/4/1983 at 06:32:18, a magnitude 4.6 (4.4 MB, 4.6 LG, 4.4 ML) earthquake occurred 299.8 miles away from the city center
On 10/20/1995 at 15:57:18, a magnitude 3.7 (3.7 LG, Depth: 3.1 mi, Class: Light, Intensity: II - III) earthquake occurred 178.3 miles away from Hopkins center
On 2/9/1994 at 08:45:35, a magnitude 3.1 (3.1 LG, Depth: 3.1 mi) earthquake occurred 78.2 miles away from Hopkins center
On 11/3/2002 at 20:41:56, a magnitude 4.3 (4.3 MB, Depth: 3.1 mi) earthquake occurred 311.8 miles away from Hopkins center
Magnitude types: regional Lg-wave magnitude (LG), body-wave magnitude (MB), local magnitude (ML)
Natural disasters:
The number of natural disasters in Hennepin County (17) is near the US average (15).Major Disasters (Presidential) Declared: 12
Emergencies Declared: 4
Causes of natural disasters: Floods: 11, Storms: 8, Tornadoes: 4, Winds: 3, Drought: 1, Hurricane: 1, Landslide: 1, Mudslide: 1, Other: 2 (Note: some incidents may be assigned to more than one category).

Hospitals and medical centers in Hopkins:
Amtrak station near Hopkins:
College/University in Hopkins:
Colleges/universities with over 2000 students nearest to Hopkins:
- Minneapolis Community and Technical College (about 7 miles; Minneapolis, MN; Full-time enrollment: 6,726)
- Capella University (about 8 miles; Minneapolis, MN; FT enrollment: 21,718)
- Normandale Community College (about 8 miles; Bloomington, MN; FT enrollment: 7,048)
- Walden University (about 8 miles; Minneapolis, MN; FT enrollment: 62,473)
- Augsburg College (about 9 miles; Minneapolis, MN; FT enrollment: 2,954)
- University of Minnesota-Twin Cities (about 10 miles; Minneapolis, MN; FT enrollment: 43,506)
- University of St Thomas (about 11 miles; Saint Paul, MN; FT enrollment: 8,762)
Public high schools in Hopkins:
- 270 HOPKINS IS (Location: 1101 W HWY 7., Grades: 9-12)
- HEADWAY ACADEMY (Location: 1001 STATE HWY 7, Grades: 7-12)
- 270 - HAP - IS (Location: 1001 W. HIGHWAY 7, Grades: 10-12)
- MAIN STREET SCHOOL PERFORMING ARTS (Location: 1320 MAIN ST, Grades: 9-12, Charter school)
- UBAH MEDICAL ACADEMY CHARTER SCHOOL (Location: 1600 MAIN ST, Grades: 9-12, Charter school)
Private high school in Hopkins:
Public elementary/middle schools in Hopkins:
- ALICE SMITH ELEMENTARY (Location: 801 MINNETONKA MILLS RD, Grades: PK-6)
- EISENHOWER ELEMENTARY (Location: 1001 HWY 7, Grades: PK-6)
- XINXING ACADEMY (Location: 1001 HWY 7, Grades: KG-6)
Private elementary/middle school in Hopkins:
Points of interest:
Notable locations in Hopkins: Oak Ridge Country Club (A), Hopkins Commerce Center (B), Hopkins Fire Department (C), Hopkins City Hall (D). Display/hide their locations on the map
Shopping Centers: Knollwood Village Shopping Center (1), Suburban Square Shopping Center (2). Display/hide their locations on the map
Parks in Hopkins include: Hagan Field (1), Hilltop Park (2), Interlachen Park (3), Burnes Park (4), Central Park (5). Display/hide their locations on the map
Tourist attractions: Public Libraries - Hennepin County Libraries- Administrative & Technical Services- Rene (Cultural Attractions- Events- & Facilities; 12601 Ridgedale Drive Lowr), Public Libraries - Hennepin County Libraries- Administrative & Technical Serv (Cultural Attractions- Events- & Facilities; 12601 Ridgedale Drive Lowr), Public Libraries - Hennepin County Libraries- Southdale-Hennepin Area Lib (Cultural Attractions- Events- & Facilities; 7001 York Avenue South), Hennepin County Libraries - Minnetonka-Ridgedale (Cultural Attractions- Events- & Facilities; 12601 Ridgedale Drive Lowr).
Hotels: Minneapolis Marriott Southwest (5801 Opus Parkway), Holiday Inn Express Minnetonka (10985 Red Circle Drive), Sheraton Minneapolis West Hotel (12201 Ridgedale Drive), Hampton Inn Minneapolis/Minnetonka (10420 Wayzata Boulevard).
Birthplace of: Aaron Brown - Journalist, Michael Lehan - 2005 NFL player (Cleveland Browns, born: Nov 25, 1979), Samantha Harris - Journalist, Archie H. Miller - Politician, David Carr (journalist) - Journalist.
| This city: | 2.1 people |
| Minnesota: | 2.5 people |
| This city: | 47.5% |
| Whole state: | 64.6% |
| This city: | 6.7% |
| Whole state: | 6.9% |
Likely homosexual households (counted as self-reported same-sex unmarried-partner households)
- Lesbian couples: 0.2% of all households
- Gay men: 0.3% of all households
12 people in group homes intended for adults in 2010
People in group quarters in Hopkins in 2000:
- 302 people in nursing homes
- 133 people in other group homes
- 4 people in homes for the mentally ill
- 2 people in homes for the mentally retarded
- 2 people in religious group quarters
Banks with branches in Hopkins (2011 data):
- U.S. Bank National Association: Hopkins Branch at 16 Ninth Avenue North, branch established on 1905/01/01; Hopkins Drive Up Branch at 40 10th Avenue North, branch established on 2002/07/01. Info updated 2012/01/30: Bank assets: $330,470.8 mil, Deposits: $236,091.5 mil, headquarters in Cincinnati, OH, positive income, 3121 total offices, Holding Company: U.S. Bancorp
- Wells Fargo Bank, National Association: Hopkins Branch at 1011 First Street South, branch established on 1910/01/01. Info updated 2011/04/05: Bank assets: $1,161,490.0 mil, Deposits: $905,653.0 mil, headquarters in Sioux Falls, SD, positive income, 6395 total offices, Holding Company: Wells Fargo & Company
- Citizens Independent Bank: Hopkins Branch at 10901 Excelsior Boulevard, branch established on 2000/01/01. Info updated 2006/11/03: Bank assets: $304.1 mil, Deposits: $248.2 mil, headquarters in Saint Louis Park, MN, positive income, Commercial Lending Specialization, 4 total offices, Holding Company: Bakken Securities, Inc.
For population 15 years and over in Hopkins:
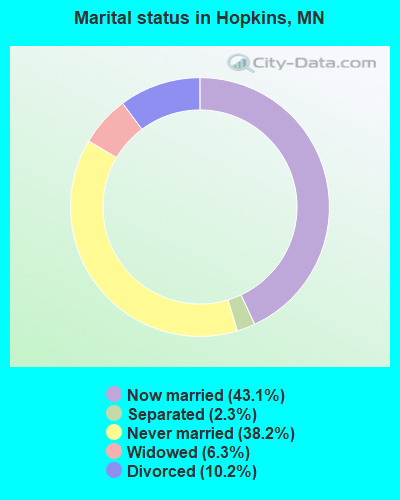
- Never married: 38.2%
- Now married: 43.1%
- Separated: 2.3%
- Widowed: 6.3%
- Divorced: 10.2%
For population 25 years and over in Hopkins:
- High school or higher: 95.4%
- Bachelor's degree or higher: 45.7%
- Graduate or professional degree: 15.7%
- Unemployed: 4.1%
- Mean travel time to work (commute): 14.7 minutes
| Here: | 9.5 |
| Minnesota average: | 10.9 |
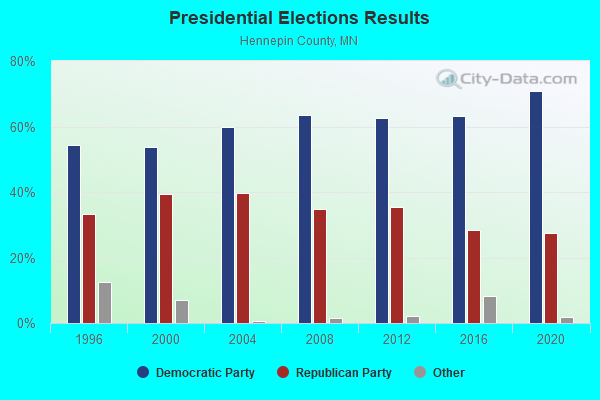
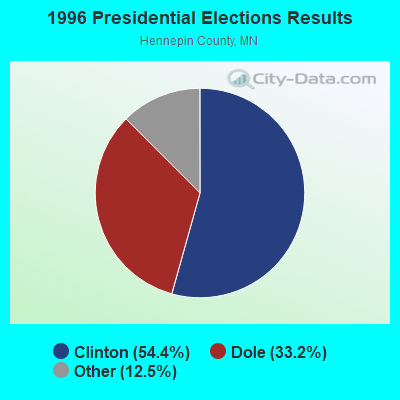
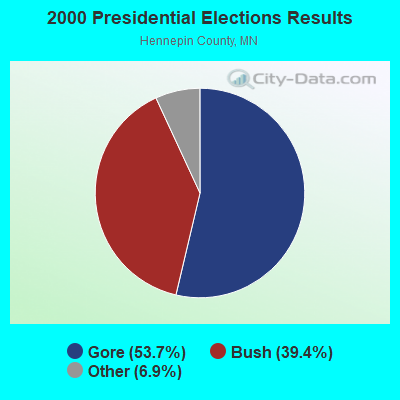
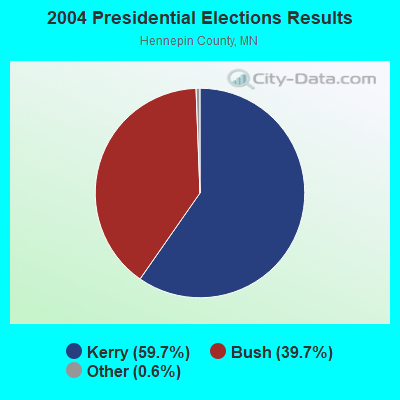
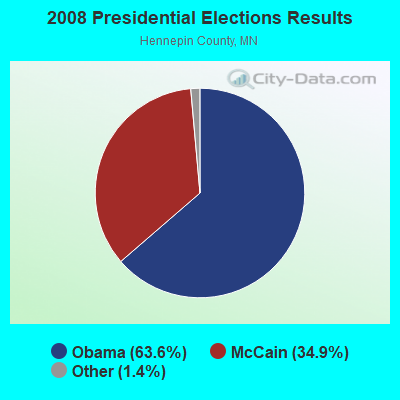
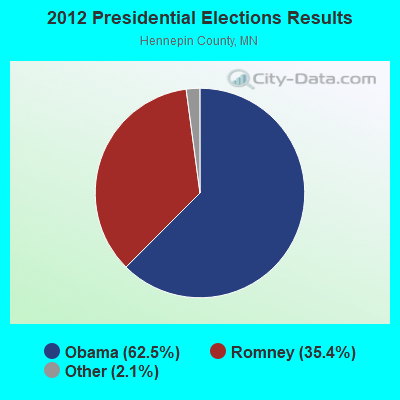
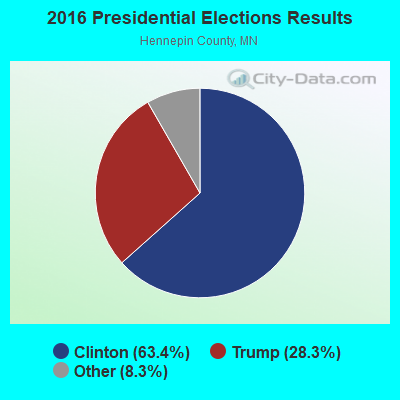
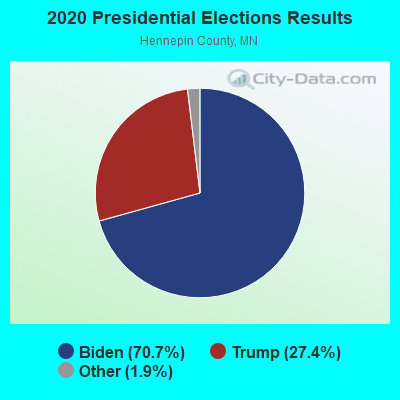
Graphs represent county-level data. Detailed 2008 Election Results
Religion statistics for Hopkins, MN (based on Hennepin County data)
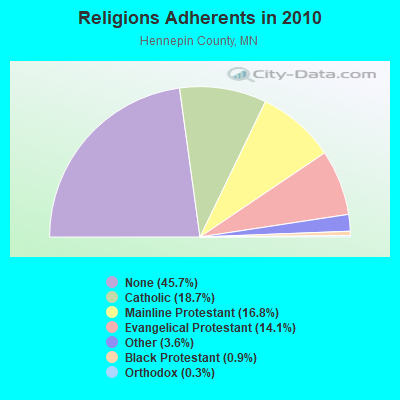
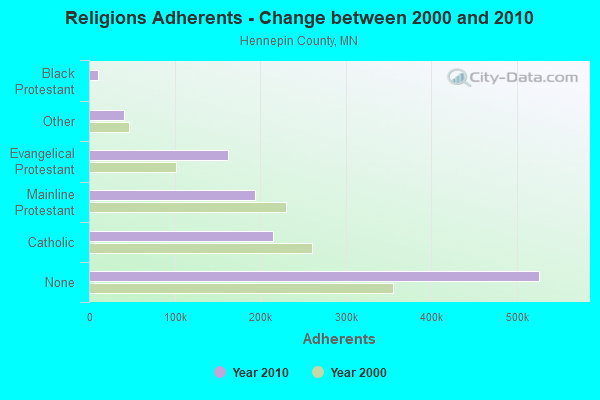
| Religion | Adherents | Congregations |
|---|---|---|
| Catholic | 215,205 | 74 |
| Mainline Protestant | 193,498 | 234 |
| Evangelical Protestant | 162,094 | 393 |
| Other | 41,287 | 110 |
| Black Protestant | 10,812 | 21 |
| Orthodox | 3,337 | 6 |
| None | 526,192 | - |
Food Environment Statistics:
| Hennepin County: | 1.79 / 10,000 pop. |
| State: | 1.83 / 10,000 pop. |
| This county: | 0.12 / 10,000 pop. |
| Minnesota: | 0.13 / 10,000 pop. |
| Hennepin County: | 0.69 / 10,000 pop. |
| Minnesota: | 0.49 / 10,000 pop. |
| This county: | 2.50 / 10,000 pop. |
| State: | 3.90 / 10,000 pop. |
| Here: | 7.13 / 10,000 pop. |
| Minnesota: | 6.98 / 10,000 pop. |
| This county: | 5.8% |
| Minnesota: | 6.5% |
| Here: | 22.8% |
| Minnesota: | 25.9% |
| Hennepin County: | 15.2% |
| State: | 13.0% |
Health and Nutrition:
| Hopkins: | 49.2% |
| Minnesota: | 50.6% |
| Hopkins: | 46.6% |
| State: | 48.4% |
| This city: | 28.4 |
| Minnesota: | 28.5 |
| Here: | 20.9% |
| Minnesota: | 21.0% |
| Hopkins: | 11.2% |
| State: | 9.8% |
| Here: | 6.8 |
| Minnesota: | 6.8 |
| This city: | 31.9% |
| Minnesota: | 33.5% |
| Hopkins: | 57.0% |
| State: | 57.7% |
| Hopkins: | 80.1% |
| Minnesota: | 79.3% |
More about Health and Nutrition of Hopkins, MN Residents
| Local government employment and payroll (March 2022) | |||||
| Function | Full-time employees | Monthly full-time payroll | Average yearly full-time wage | Part-time employees | Monthly part-time payroll |
|---|---|---|---|---|---|
| Police Protection - Officers | 27 | $256,661 | $114,072 | 0 | $0 |
| Streets and Highways | 16 | $113,798 | $85,349 | 0 | $0 |
| Parks and Recreation | 16 | $99,575 | $74,681 | 27 | $24,144 |
| Financial Administration | 8 | $62,214 | $93,321 | 0 | $0 |
| Other and Unallocable | 7 | $47,821 | $81,979 | 0 | $0 |
| Other Government Administration | 6 | $61,946 | $123,892 | 8 | $7,986 |
| Police - Other | 6 | $36,695 | $73,390 | 1 | $2,007 |
| Firefighters | 5 | $47,263 | $113,431 | 31 | $24,130 |
| Water Supply | 5 | $34,526 | $82,862 | 0 | $0 |
| Housing and Community Development (Local) | 3 | $25,346 | $101,384 | 0 | $0 |
| Welfare | 2 | $13,141 | $78,846 | 1 | $1,777 |
| Natural Resources | 1 | $8,294 | $99,528 | 0 | $0 |
| Sewerage | 1 | $9,364 | $112,368 | 0 | $0 |
| Solid Waste Management | 1 | $5,976 | $71,712 | 0 | $0 |
| Totals for Government | 104 | $822,620 | $94,918 | 68 | $60,043 |
Hopkins government finances - Expenditure in 2021 (per resident):
- Construction - Regular Highways: $3,946,000 ($215.99)
Sewerage: $2,919,000 ($159.78)
Water Utilities: $1,840,000 ($100.72)
- Current Operations - Police Protection: $6,225,000 ($340.74)
Parks and Recreation: $3,311,000 ($181.24)
Sewerage: $2,344,000 ($128.30)
Regular Highways: $2,326,000 ($127.32)
Central Staff Services: $1,799,000 ($98.47)
Local Fire Protection: $1,589,000 ($86.98)
Housing and Community Development: $1,538,000 ($84.19)
Water Utilities: $1,362,000 ($74.55)
Financial Administration: $1,115,000 ($61.03)
Solid Waste Management: $913,000 ($49.98)
Protective Inspection and Regulation - Other: $797,000 ($43.63)
- General - Interest on Debt: $2,277,000 ($124.64)
- Other Capital Outlay - Regular Highways: $1,206,000 ($66.01)
Parks and Recreation: $148,000 ($8.10)
Solid Waste Management: $79,000 ($4.32)
Central Staff Services: $15,000 ($0.82)
Local Fire Protection: $5,000 ($0.27)
Protective Inspection and Regulation - Other: $5,000 ($0.27)
- Total Salaries and Wages: $14,390,000 ($787.67)
- Water Utilities - Interest on Debt: $104,000 ($5.69)
Hopkins government finances - Revenue in 2021 (per resident):
- Charges - Sewerage: $3,726,000 ($203.95)
Solid Waste Management: $971,000 ($53.15)
Parks and Recreation: $371,000 ($20.31)
Other: $192,000 ($10.51)
Parking Facilities: $96,000 ($5.25)
- Federal Intergovernmental - Other: $28,000 ($1.53)
- Local Intergovernmental - General Local Government Support: $745,000 ($40.78)
Other: $110,000 ($6.02)
Housing and Community Development: $46,000 ($2.52)
- Miscellaneous - Special Assessments: $1,469,000 ($80.41)
General Revenue - Other: $557,000 ($30.49)
Rents: $423,000 ($23.15)
Fines and Forfeits: $198,000 ($10.84)
Sale of Property: $140,000 ($7.66)
Interest Earnings: $137,000 ($7.50)
Donations From Private Sources: $13,000 ($0.71)
- Revenue - Water Utilities: $2,208,000 ($120.86)
- State Intergovernmental - General Local Government Support: $1,485,000 ($81.29)
Highways: $820,000 ($44.88)
Other: $612,000 ($33.50)
- Tax - Property: $21,825,000 ($1194.65)
Public Utilities Sales: $1,190,000 ($65.14)
Occupation and Business License - Other: $449,000 ($24.58)
Other License: $209,000 ($11.44)
Alcoholic Beverage License: $40,000 ($2.19)
Hopkins government finances - Debt in 2021 (per resident):
- Long Term Debt - Outstanding Unspecified Public Purpose: $83,505,000 ($4570.86)
Beginning Outstanding - Unspecified Public Purpose: $76,375,000 ($4180.58)
Issue, Unspecified Public Purpose: $12,575,000 ($688.32)
Retired Unspecified Public Purpose: $5,445,000 ($298.05)
Hopkins government finances - Cash and Securities in 2021 (per resident):
- Other Funds - Cash and Securities: $35,341,000 ($1934.48)
- Sinking Funds - Cash and Securities: $9,436,000 ($516.50)
6.75% of this county's 2021 resident taxpayers lived in other counties in 2020 ($70,758 average adjusted gross income)
| Here: | 6.75% |
| Minnesota average: | 7.43% |
0.00% of residents moved from foreign countries ($39 average AGI)
Hennepin County: 0.00% Minnesota average: 0.00%
Top counties from which taxpayers relocated into this county between 2020 and 2021:
| from Ramsey County, MN | |
| from Anoka County, MN | |
| from Dakota County, MN |
8.44% of this county's 2020 resident taxpayers moved to other counties in 2021 ($85,733 average adjusted gross income)
| Here: | 8.44% |
| Minnesota average: | 7.79% |
0.01% of residents moved to foreign countries ($68 average AGI)
Hennepin County: 0.01% Minnesota average: 0.00%
Top counties to which taxpayers relocated from this county between 2020 and 2021:
| to Ramsey County, MN | |
| to Anoka County, MN | |
| to Dakota County, MN |
| Businesses in Hopkins, MN | ||||
| Name | Count | Name | Count | |
|---|---|---|---|---|
| Ace Hardware | 1 | KFC | 1 | |
| Applebee's | 1 | LA Fitness | 1 | |
| Arby's | 1 | MasterBrand Cabinets | 1 | |
| Budget Car Rental | 1 | New Balance | 1 | |
| Caribou Coffee | 1 | Papa John's Pizza | 1 | |
| Chipotle | 1 | Pizza Hut | 1 | |
| Cold Stone Creamery | 1 | Starbucks | 1 | |
| Curves | 1 | Taco Bell | 1 | |
| DHL | 1 | U-Haul | 1 | |
| Dairy Queen | 2 | UPS | 4 | |
| Decora Cabinetry | 1 | Walgreens | 2 | |
| Domino's Pizza | 1 | Wendy's | 2 | |
| FedEx | 1 | White Castle | 1 | |
| Honda | 1 | |||
Strongest AM radio stations in Hopkins:
- WWTC (1280 AM; 5 kW; MINNEAPOLIS, MN; Owner: SCA LICENSE CORPORATION)
- KYCR (1570 AM; 4 kW; GOLDEN VALLEY, MN; Owner: COMMON GROUND BROADCASTING COMPANY,)
- WCCO (830 AM; 50 kW; MINNEAPOLIS, MN; Owner: INFINITY MEDIA CORPORATION)
- KDIZ (1440 AM; 5 kW; GOLDEN VALLEY, MN; Owner: KQRS, INC.)
- KFAN (1130 AM; 50 kW; MINNEAPOLIS, MN; Owner: AMFM RADIO LICENSES, L.L.C.)
- KSTP (1500 AM; 50 kW; ST. PAUL, MN; Owner: KSTP-AM, LLC (DELAWARE))
- WCTS (1030 AM; 50 kW; MAPLEWOOD, MN; Owner: CNTL. BAPT. THEO/AL SEMI MINNEAPOLIS)
- WMNN (1330 AM; 10 kW; MINNEAPOLIS, MN; Owner: MINNESOTA PUBLIC RADIO.)
- KCCO (950 AM; 1 kW; ST. LOUIS PARK, MN; Owner: THE AUDIO HOUSE, INC.)
- KTIS (900 AM; 25 kW; MINNEAPOLIS, MN; Owner: NORTHWESTERN COLLEGE)
- KSMM (1530 AM; 9 kW; SHAKOPEE, MN; Owner: STARBOARD BROADCASTING, INC.)
- KUOM (770 AM; daytime; 5 kW; MINNEAPOLIS, MN)
- KKMS (980 AM; 5 kW; RICHFIELD, MN)
Strongest FM radio stations in Hopkins:
- WGVZ (105.7 FM; EDEN PRAIRIE, MN; Owner: KQRS, INC.)
- KTCZ-FM (97.1 FM; MINNEAPOLIS, MN; Owner: AMFM RADIO LICENSES, L.L.C.)
- K214DF (90.7 FM; GOLDEN VALLEY, MN; Owner: EDUCATIONAL MEDIA FOUNDATION)
- KNOW-FM (91.1 FM; MINNEAPOLIS-ST. PAUL, MN; Owner: MINNESOTA PUBLIC RADIO)
- WLTE (102.9 FM; MINNEAPOLIS, MN; Owner: INFINITY MEDIA CORPORATION)
- KFAI (90.3 FM; MINNEAPOLIS, MN; Owner: FRESH AIR, INC.)
- KSTP-FM (94.5 FM; ST. PAUL, MN; Owner: KSTP-FM, LLC, A DELAWARE LLC)
- KDXL (106.5 FM; ST. LOUIS PARK, MN; Owner: INDEPENDENT SCHOOL DISTRICT #283)
- KUOM-FM (106.5 FM; ST. LOUIS PARK, MN; Owner: REGENTS OF THE UNIVERSITY OF MINNESOTA)
- KEEY-FM (102.1 FM; ST. PAUL, MN; Owner: AMFM RADIO LICENSES, L.L.C.)
- KTIS-FM (98.5 FM; MINNEAPOLIS, MN; Owner: NORTHWESTERN COLLEGE)
- KDWB-FM (101.3 FM; RICHFIELD, MN; Owner: AMFM RADIO LICENSES, L.L.C.)
- KQRS-FM (92.5 FM; GOLDEN VALLEY, MN; Owner: KQRS, Inc.)
- KSJN (99.5 FM; MINNEAPOLIS, MN; Owner: MINNESOTA PUBLIC RADIO)
- KXXR (93.7 FM; MINNEAPOLIS, MN; Owner: KQRS, INC.)
- KQQL (107.9 FM; ANOKA, MN; Owner: AMFM RADIO LICENSES, L.L.C.)
- KBEM-FM (88.5 FM; MINNEAPOLIS, MN; Owner: BD. OF EDUCATION, S.S.D. NO. 1)
- KJZI (100.3 FM; MINNEAPOLIS, MN; Owner: AMFM RADIO LICENSES, L.L.C.)
- WCAL (89.3 FM; NORTHFIELD, MN; Owner: ST. OLAF COLLEGE)
- KNOF (95.3 FM; ST. PAUL, MN; Owner: SELBY GOSPEL BROADCASTING CORPORATION)
TV broadcast stations around Hopkins:
- K07UI (Channel 7; MINNEAPOLIS, ETC., MN; Owner: WORD OF GOD FELLOWSHIP, INC.)
- K67HG (Channel 67; MINNEAPOLIS, MN; Owner: VENTANA TELEVISION, INC.)
- K58BS (Channel 58; MINNEAPOLIS, MN; Owner: TRINITY BROADCASTING NETWORK)
- K14KH (Channel 14; MINNEAPOLIS, MN; Owner: THREE ANGELS BROADCASTING NETWORK)
- K19ER (Channel 19; ST. PAUL, MN; Owner: CATHOLIC VIEWS BROADCASTS, INC.)
- W62BD (Channel 62; MINNEAPOLIS, MN; Owner: WORD OF GOD FELLOWSHIP, INC.)
- KARE (Channel 11; MINNEAPOLIS, MN; Owner: MULTIMEDIA HOLDINGS CORPORATION)
- KSTP-TV (Channel 5; ST. PAUL, MN; Owner: HUBBARD BROADCASTING, INC.)
- KMSP-TV (Channel 9; MINNEAPOLIS, MN; Owner: FOX TELEVISION STATIONS, INC.)
- WBWX-CA (Channel 13; MINNEAPOLIS, MN; Owner: THE BOX WORLDWIDE LLC)
- KTCA-TV (Channel 2; ST. PAUL, MN; Owner: TWIN CITIES PUBLIC TELEVISION, INC.)
- WCCO-TV (Channel 4; MINNEAPOLIS, MN; Owner: CBS BROADCASTING INC.)
- KSTC-TV (Channel 45; MINNEAPOLIS, MN; Owner: HUBBARD BROADCASTING, INC.)
- KTCI-TV (Channel 17; ST. PAUL, MN; Owner: TWIN CITIES PUBLIC TELEVISION, INC.)
- KMWB (Channel 23; MINNEAPOLIS, MN; Owner: KLGT LICENSEE, LLC)
- WFTC (Channel 29; MINNEAPOLIS, MN; Owner: FOX TELEVISION STATIONS, INC.)
- KPXM (Channel 41; ST. CLOUD, MN; Owner: PAXSON MINNEAPOLIS LICENSE, INC.)
- National Bridge Inventory (NBI) Statistics
- 15Number of bridges
- 210ft / 63.6mTotal length
- $999,999,000Total costs
- 469,655Total average daily traffic
- 22,135Total average daily truck traffic
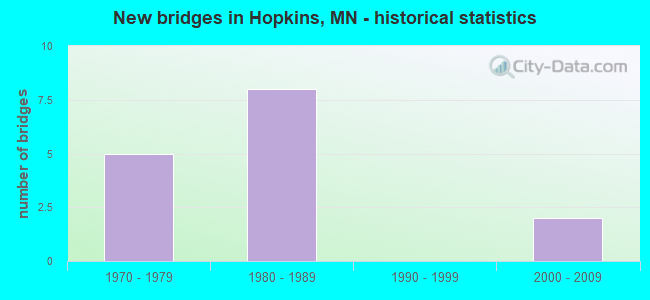
- New bridges - historical statistics
- 51970-1979
- 81980-1989
- 22000-2009
FCC Registered Broadcast Land Mobile Towers: 14 (See the full list of FCC Registered Broadcast Land Mobile Towers in Hopkins, MN)
FCC Registered Microwave Towers: 9 (See the full list of FCC Registered Microwave Towers in this town)
FCC Registered Amateur Radio Licenses: 83 (See the full list of FCC Registered Amateur Radio Licenses in Hopkins)
FAA Registered Aircraft: 8 (See the full list of FAA Registered Aircraft in Hopkins)
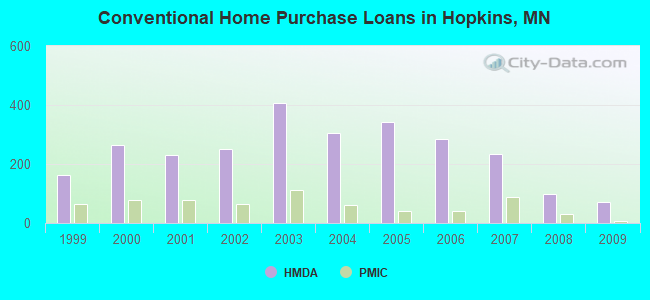
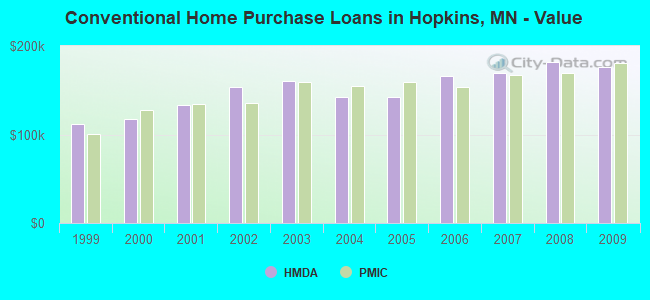
| Home Mortgage Disclosure Act Aggregated Statistics For Year 2009 (Based on 3 full tracts) | ||||||||||
| A) FHA, FSA/RHS & VA Home Purchase Loans | B) Conventional Home Purchase Loans | C) Refinancings | D) Home Improvement Loans | F) Non-occupant Loans on < 5 Family Dwellings (A B C & D) | ||||||
|---|---|---|---|---|---|---|---|---|---|---|
| Number | Average Value | Number | Average Value | Number | Average Value | Number | Average Value | Number | Average Value | |
| LOANS ORIGINATED | 80 | $169,723 | 70 | $175,823 | 310 | $204,557 | 10 | $127,472 | 29 | $148,614 |
| APPLICATIONS APPROVED, NOT ACCEPTED | 1 | $68,840 | 8 | $153,202 | 31 | $206,236 | 1 | $7,980 | 2 | $156,825 |
| APPLICATIONS DENIED | 7 | $103,951 | 14 | $143,589 | 76 | $214,676 | 8 | $158,399 | 11 | $122,184 |
| APPLICATIONS WITHDRAWN | 4 | $162,192 | 9 | $131,949 | 58 | $160,747 | 4 | $93,135 | 7 | $110,696 |
| FILES CLOSED FOR INCOMPLETENESS | 0 | $0 | 0 | $0 | 18 | $204,019 | 2 | $13,500 | 0 | $0 |
Detailed HMDA statistics for the following Tracts: 0232.00 , 0233.00, 0234.00
| Private Mortgage Insurance Companies Aggregated Statistics For Year 2009 (Based on 3 full tracts) | ||||||
| A) Conventional Home Purchase Loans | B) Refinancings | C) Non-occupant Loans on < 5 Family Dwellings (A & B) | ||||
|---|---|---|---|---|---|---|
| Number | Average Value | Number | Average Value | Number | Average Value | |
| LOANS ORIGINATED | 8 | $180,722 | 10 | $207,583 | 1 | $54,870 |
| APPLICATIONS APPROVED, NOT ACCEPTED | 4 | $145,515 | 2 | $286,595 | 0 | $0 |
| APPLICATIONS DENIED | 2 | $57,865 | 1 | $165,000 | 0 | $0 |
| APPLICATIONS WITHDRAWN | 0 | $0 | 0 | $0 | 0 | $0 |
| FILES CLOSED FOR INCOMPLETENESS | 1 | $44,900 | 1 | $390,000 | 1 | $44,900 |
Detailed PMIC statistics for the following Tracts: 0232.00 , 0233.00, 0234.00
2002 - 2018 National Fire Incident Reporting System (NFIRS) incidents
- Fire incident types reported to NFIRS in Hopkins, MN
- 49855.5%Structure Fires
- 25628.5%Outside Fires
- 12113.5%Mobile Property/Vehicle Fires
- 232.6%Other
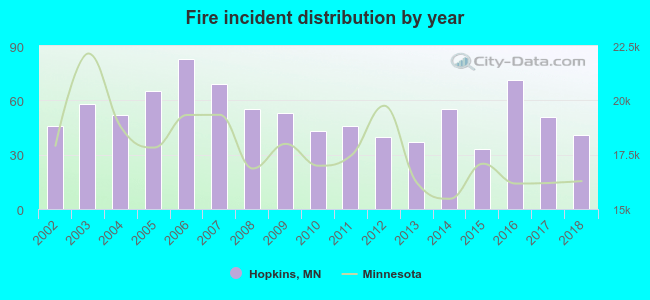 According to the data from the years 2002 - 2018 the average number of fires per year is 53. The highest number of reported fires - 83 took place in 2006, and the least - 33 in 2015. The data has a dropping trend.
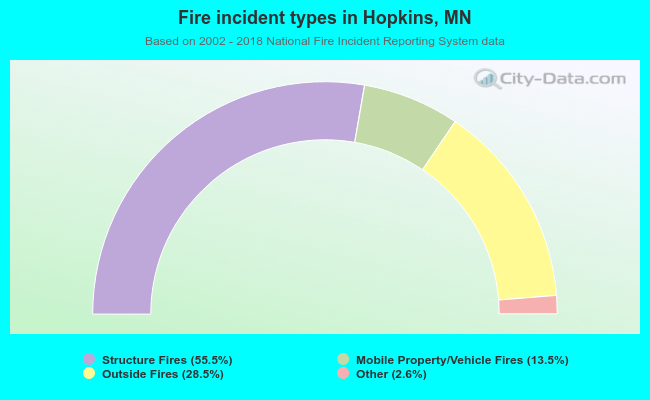 When looking into fire subcategories, the most reports belonged to: Structure Fires (55.5%), and Outside Fires (28.5%).
Fire-safe hotels and motels in Hopkins, Minnesota:
- HOME2 SUITES BY HILTON, 6030 CLEARWATER Dr, Hopkins, Minnesota 55343 , Phone: (952) 945-9999, Fax: (952) 945-9998
- Travelodge Minneapolis/Hopkins, 1501 Hwy 7, Hopkins, Minnesota 55305 , Phone: (952) 935-7711, Fax: (952) 943-5666
| Most common first names in Hopkins, MN among deceased individuals | ||
| Name | Count | Lived (average) |
|---|---|---|
| John | 250 | 75.8 years |
| Mary | 222 | 81.0 years |
| Robert | 192 | 73.1 years |
| William | 180 | 76.1 years |
| Helen | 146 | 83.8 years |
| Margaret | 122 | 81.6 years |
| Dorothy | 121 | 78.6 years |
| Anna | 118 | 85.9 years |
| George | 117 | 77.0 years |
| Donald | 113 | 74.3 years |
| Most common last names in Hopkins, MN among deceased individuals | ||
| Last name | Count | Lived (average) |
|---|---|---|
| Johnson | 193 | 78.4 years |
| Anderson | 157 | 79.4 years |
| Nelson | 117 | 75.9 years |
| Olson | 77 | 77.9 years |
| Peterson | 73 | 77.4 years |
| Carlson | 69 | 79.7 years |
| Smith | 56 | 79.0 years |
| Larson | 46 | 75.3 years |
| Erickson | 46 | 79.1 years |
| Miller | 33 | 82.1 years |
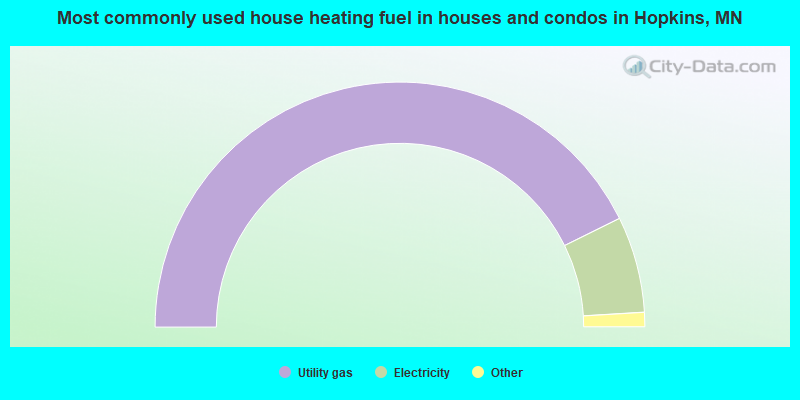
- 85.4%Utility gas
- 12.7%Electricity
- 1.0%No fuel used
- 0.8%Bottled, tank, or LP gas
- 0.2%Other fuel
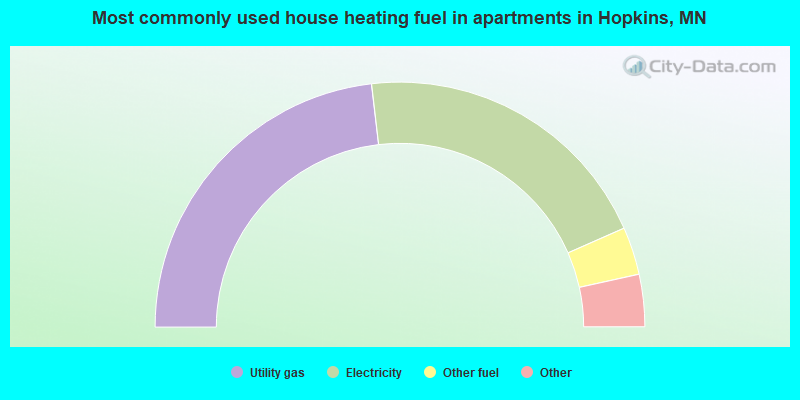
- 46.3%Utility gas
- 40.5%Electricity
- 6.3%Other fuel
- 3.2%No fuel used
- 2.2%Bottled, tank, or LP gas
- 1.0%Fuel oil, kerosene, etc.
- 0.5%Wood
Hopkins compared to Minnesota state average:
- Unemployed percentage significantly below state average.
- Black race population percentage significantly above state average.
- Median age significantly below state average.
- Renting percentage above state average.
- Length of stay since moving in significantly above state average.
- Number of rooms per house significantly below state average.
- Percentage of population with a bachelor's degree or higher above state average.
Hopkins on our top lists:
- #14 on the list of "Top 101 cities with the most residents born in Born at sea (population 500+)"
- #45 on the list of "Top 101 cities with the most recent year of entry for the foreign-born population (2,000+ people)+"
- #63 on the list of "Top 101 cities with the most residents born in Other Eastern Africa (population 500+)"
- #89 on the list of "Top 101 cities with the most residents born in Eastern Africa (population 500+)"
- #94 on the list of "Top 101 cities with the most residents born in Sierra Leone (population 500+)"
- #96 on the list of "Top 100 cities with smallest houses (pop. 5,000+)"
- #70 (55305) on the list of "Top 101 zip codes with the largest percentage of Swedish first ancestries (pop 5,000+)"
- #4 on the list of "Top 101 counties with the most Mainline Protestant adherents"
- #7 on the list of "Top 101 counties with the highest percentage of residents that exercised in the past month"
- #10 on the list of "Top 101 counties with the most Mainline Protestant congregations"
- #15 on the list of "Top 101 counties with the highest percentage of residents that visited a dentist within the past year"
- #28 on the list of "Top 101 counties with the best general health status score of residents (1-5), 3 years of data"

|
|
Total of 356 patent applications in 2008-2024.