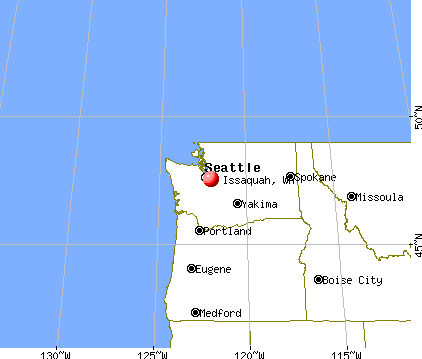
Issaquah, Washington
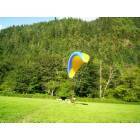
Issaquah: Paraglider Issaquah
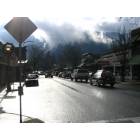
Issaquah: downtown
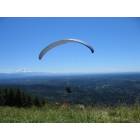
Issaquah: Tiger Mountain - Issaquah
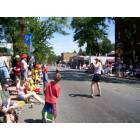
Issaquah: 4th of July Parade Front St.

Issaquah: Snow storm - back yard in Issaquah - January 2007
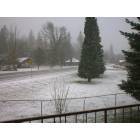
Issaquah: Issaquah snow from balcony.jpg
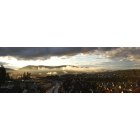
Issaquah: Issaquah Highlands Panorama
Issaquah: Issaquah Highlands Sunshower
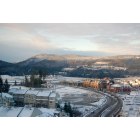
Issaquah: Issaquah Highlands Snowy Day
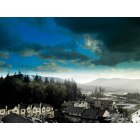
Issaquah: Somewhere Over the Rainbow . . . Issaquah Mountains
Issaquah: Issaquah- The Tip of the South End of Lake Sammamish
- add
your
Submit your own pictures of this city and show them to the world
- OSM Map
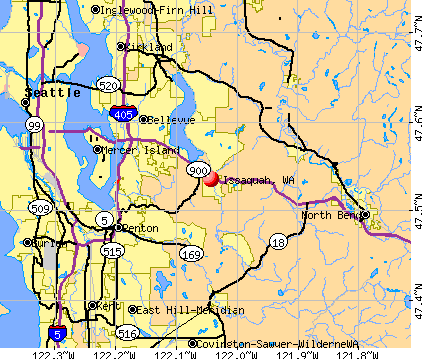
- General Map
- Google Map
- MSN Map
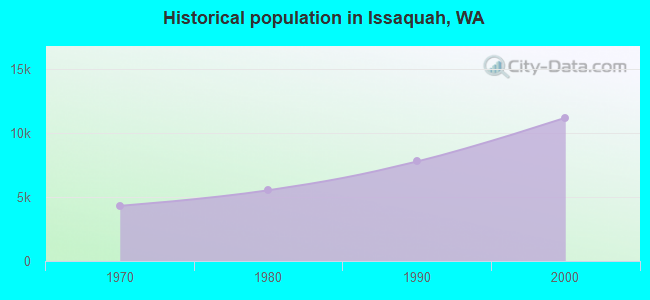
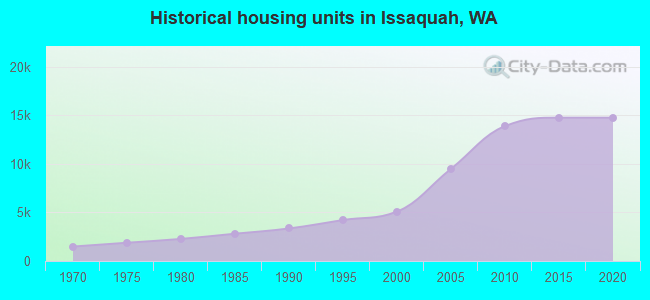
Population change since 2000: +250.9%
| Males: 19,593 | |
| Females: 19,751 |
| Median resident age: | 37.1 years |
| Washington median age: | 38.4 years |
Zip codes: 98029.
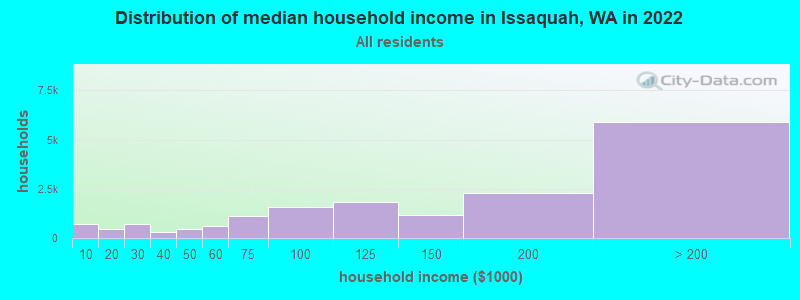
| Issaquah: | $142,902 |
| WA: | $91,306 |
Estimated per capita income in 2022: $87,571 (it was $34,222 in 2000)
Issaquah city income, earnings, and wages data
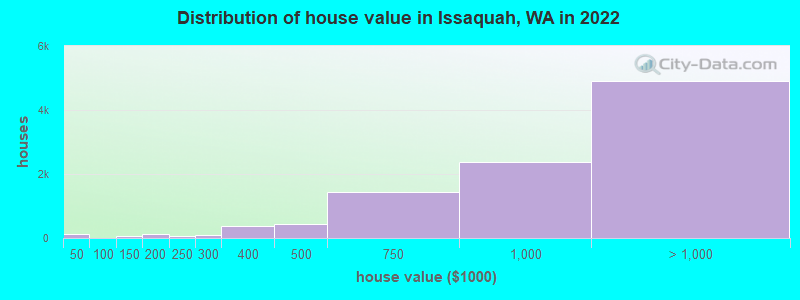
Estimated median house or condo value in 2022: over $1,000,000 (it was $254,400 in 2000)
| Issaquah: | over $1,000,000 |
| WA: | $569,500 |
Mean prices in 2022: all housing units: over $1,000,000; detached houses: over $1,000,000; townhouses or other attached units: $770,647; in 2-unit structures: $568,138; in 3-to-4-unit structures: $701,928; in 5-or-more-unit structures: $463,060
Median gross rent in 2022: $2,368.
(4.2% for White Non-Hispanic residents, 1.5% for Black residents, 13.5% for Hispanic or Latino residents, 0.7% for American Indian residents, 18.1% for other race residents, 5.2% for two or more races residents)
Detailed information about poverty and poor residents in Issaquah, WA


Compare current foreclosures near Issaquah, WA:
| Photo | Address | Area | Beds / Baths | Price | Details |
|---|---|---|---|---|---|

|
#1
SE 47th Pl
Issaquah, WA 98029
|
2,610 sq. feet
|
2 baths 3 beds |
show details | |

|
#2
NE Park Dr
Issaquah, WA 98029
|
1,560 sq. feet
|
3 baths 3 beds |
show details | |

|
#3
SE 130th St
Issaquah, WA 98027
|
3,600 sq. feet
|
5 baths 5 beds |
show details | |

|
#4
SE Tiger Mountain Rd
Issaquah, WA 98027
|
3,520 sq. feet
|
4 baths 4 beds |
show details | |

|
#5
224th Ln SE Apt 102
Issaquah, WA 98029
|
1,075 sq. feet
|
2 baths 2 beds |
show details | |

|
#6
NW Gilman Blvd Unit 1474
Issaquah, WA 98027
|
- sq. feet
|
- baths - beds |
show details | |

|
#7
Larch Ave Ne, # 298
Issaquah, WA 98029
|
- sq. feet
|
- baths - beds |
show details | |

|
#8
SE Newport Way Apt I204
Issaquah, WA 98027
|
- sq. feet
|
- baths - beds |
show details | |

|
#9
NE Ingram Way, # E205
Issaquah, WA 98029
|
- sq. feet
|
- baths - beds |
show details | |

|
#10
309th Pl SE
Issaquah, WA 98027
|
- sq. feet
|
- baths - beds |
show details |
| Photo | Address | Area | Beds / Baths | Price | Details |
|---|---|---|---|---|---|

|
#11
2nd Ave SE
Issaquah, WA 98027
|
- sq. feet
|
- baths - beds |
show details | |

|
#12
Newport Way SW Apt 204
Issaquah, WA 98027
|
- sq. feet
|
- baths - beds |
show details | |

|
#13
SE Newport Way Apt P103
Issaquah, WA 98027
|
- sq. feet
|
- baths - beds |
show details | |

|
#14
Ridge View Ave NE Unit J201
Issaquah, WA 98029
|
- sq. feet
|
- baths - beds |
show details | |

|
#15
260th Ave SE
Issaquah, WA 98027
|
- sq. feet
|
- baths - beds |
show details | |

|
#16
25th Ave Ne, # N413
Issaquah, WA 98029
|
- sq. feet
|
- baths - beds |
show details | |

|
#17
NW Gilman Blvd, Ste 2 Pmb 9131
Issaquah, WA 98027
|
- sq. feet
|
- baths - beds |
show details | |

|
#18
SE Newport Way Unit J242
Issaquah, WA 98027
|
- sq. feet
|
- baths - beds |
show details | |

|
#19
NW Pine Cone Dr Unit 409
Issaquah, WA 98027
|
- sq. feet
|
- baths - beds |
show details | |

|
#20
Newport Way NW Apt D2
Issaquah, WA 98027
|
- sq. feet
|
- baths - beds |
show details |
| Photo | Address | Area | Beds / Baths | Price | Details |
|---|---|---|---|---|---|

|
#21
42nd Ave S Apt 101
Kent, WA 98032
|
995 sq. feet
|
2 baths 2 beds |
show details | |

|
#22
57th Ave S Unit B104
Seattle, WA 98178
|
572 sq. feet
|
1 baths 1 beds |
show details | |

|
#23
16th Ave S
Seattle, WA 98168
|
1,800 sq. feet
|
1 baths 4 beds |
show details | |

|
#24
185th Pl SE
Kent, WA 98042
|
2,550 sq. feet
|
2 baths 3 beds |
show details | |

|
#25
S 241st St
Kent, WA 98030
|
1,840 sq. feet
|
2 baths 4 beds |
show details | |

|
#26
119th Pl SE
Kent, WA 98030
|
2,550 sq. feet
|
2 baths 3 beds |
show details | |

|
#27
S 170th St
Seattle, WA 98188
|
2,650 sq. feet
|
2 baths 5 beds |
show details | |

|
#28
Boxley Pl NE
North Bend, WA 98045
|
1,230 sq. feet
|
1 baths 3 beds |
show details | |

|
#29
44th Ave S
Seattle, WA 98178
|
1,680 sq. feet
|
2 baths 3 beds |
show details | |

|
#30
42nd Ct NE
Auburn, WA 98002
|
1,584 sq. feet
|
2 baths 3 beds |
show details |
| Photo | Address | Area | Beds / Baths | Price | Details |
|---|---|---|---|---|---|

|
#31
NE 173rd St
Woodinville, WA 98072
|
2,730 sq. feet
|
2 baths 3 beds |
show details | |

|
#32
SE 278th Pl
Kent, WA 98030
|
2,478 sq. feet
|
2 baths 4 beds |
show details | |

|
#33
NE 5th St
Renton, WA 98056
|
1,930 sq. feet
|
2 baths 3 beds |
show details | |

|
#34
NE Woodinville Duvall Rd
Woodinville, WA 98072
|
1,520 sq. feet
|
1 baths 2 beds |
show details | |

|
#35
SE 266th St
Kent, WA 98042
|
920 sq. feet
|
1 baths 3 beds |
show details | |

|
#36
226th Pl NE
Sammamish, WA 98074
|
1,650 sq. feet
|
2 baths 3 beds |
show details | |

|
#37
S 249th St
Kent, WA 98032
|
1,120 sq. feet
|
1 baths 3 beds |
show details | |

|
#38
SE 19th St
Renton, WA 98055
|
1,480 sq. feet
|
2 baths 3 beds |
show details | |

|
#39
Lake Fenwick Rd
Kent, WA 98032
|
3,440 sq. feet
|
3 baths 4 beds |
show details | |

|
#40
S 240th Pl
Kent, WA 98030
|
- sq. feet
|
3 baths 4 beds |
show details |
| Photo | Address | Area | Beds / Baths | Price | Details |
|---|---|---|---|---|---|

|
#41
77th Ave S
Seattle, WA 98178
|
3,090 sq. feet
|
4 baths 6 beds |
show details | |

|
#42
Lake Alice Rd SE
Fall City, WA 98024
|
1,750 sq. feet
|
2 baths 3 beds |
show details | |

|
#43
SE 243rd St
Maple Valley, WA 98038
|
2,350 sq. feet
|
2 baths 4 beds |
show details | |

|
#44
E Lynn St # 98102
Seattle, WA 98102
|
792 sq. feet
|
1 baths - beds |
show details | |

|
#45
S 36th Pl
Renton, WA 98055
|
- sq. feet
|
2 baths 4 beds |
show details | |

|
#46
254th Way SE
Maple Valley, WA 98038
|
3,120 sq. feet
|
2 baths 4 beds |
show details | |

|
#47
Bellevue Ave E Apt 304
Seattle, WA 98102
|
448 sq. feet
|
1 baths 1 beds |
show details | |

|
#48
S 124th St
Seattle, WA 98178
|
1,100 sq. feet
|
1 baths 2 beds |
show details | |

|
#49
SW 119th St
Seattle, WA 98146
|
2,540 sq. feet
|
2 baths 4 beds |
show details | |

|
Check over 1 million property listings on Foreclosure.com!
|
browse all offers | |||


- 21,86355.2%White alone
- 11,21928.3%Asian alone
- 2,7957.1%Two or more races
- 2,6096.6%Hispanic
- 7051.8%Black alone
- 3360.8%Other race alone
- 1130.3%Native Hawaiian and Other
Pacific Islander alone - 760.2%American Indian alone
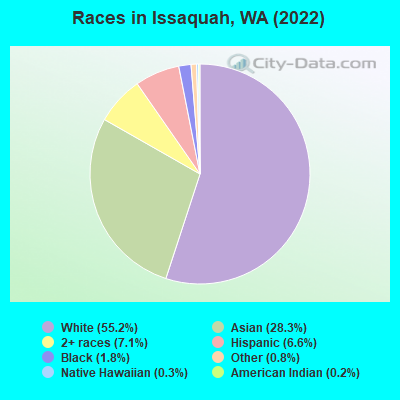
Races in Issaquah detailed stats: ancestries, foreign born residents, place of birth
According to our research of Washington and other state lists, there were 4 registered sex offenders living in Issaquah, Washington as of April 27, 2024.
The ratio of all residents to sex offenders in Issaquah is 8,976 to 1.
The ratio of registered sex offenders to all residents in this city is much lower than the state average.
Type |
2009 |
2010 |
2011 |
2012 |
2013 |
2014 |
2015 |
2016 |
2017 |
2018 |
2019 |
2020 |
2021 |
2022 |
|---|---|---|---|---|---|---|---|---|---|---|---|---|---|---|
| Murders (per 100,000) | 0 (0.0) | 0 (0.0) | 0 (0.0) | 0 (0.0) | 0 (0.0) | 0 (0.0) | 0 (0.0) | 0 (0.0) | 1 (2.6) | 0 (0.0) | 0 (0.0) | 1 (2.5) | 0 (0.0) | 0 (0.0) |
| Rapes (per 100,000) | 4 (16.0) | 6 (19.7) | 4 (12.9) | 2 (6.4) | 6 (18.0) | 6 (17.5) | 1 (2.9) | 12 (32.2) | 6 (15.5) | 16 (41.4) | 10 (24.6) | 8 (19.7) | 4 (9.8) | 2 (5.1) |
| Robberies (per 100,000) | 9 (36.0) | 6 (19.7) | 9 (29.1) | 6 (19.1) | 8 (24.0) | 8 (23.3) | 9 (25.7) | 12 (32.2) | 8 (20.7) | 7 (18.1) | 2 (4.9) | 6 (14.8) | 8 (19.6) | 12 (30.8) |
| Assaults (per 100,000) | 6 (24.0) | 16 (52.6) | 13 (42.1) | 10 (31.9) | 7 (21.0) | 4 (11.6) | 1 (2.9) | 13 (34.8) | 11 (28.5) | 7 (18.1) | 9 (22.1) | 13 (32.0) | 3 (7.4) | 5 (12.8) |
| Burglaries (per 100,000) | 51 (203.8) | 101 (331.9) | 120 (388.2) | 102 (325.5) | 71 (212.8) | 70 (203.7) | 110 (314.3) | 160 (428.9) | 115 (298.0) | 133 (344.5) | 78 (191.9) | 129 (317.3) | 161 (395.2) | 133 (341.8) |
| Thefts (per 100,000) | 531 (2,122) | 585 (1,922) | 581 (1,880) | 616 (1,965) | 691 (2,071) | 922 (2,682) | 918 (2,623) | 917 (2,458) | 951 (2,464) | 1,134 (2,937) | 984 (2,421) | 977 (2,403) | 1,352 (3,319) | 1,422 (3,654) |
| Auto thefts (per 100,000) | 51 (203.8) | 51 (167.6) | 36 (116.5) | 38 (121.2) | 52 (155.9) | 93 (270.6) | 54 (154.3) | 72 (193.0) | 103 (266.9) | 90 (233.1) | 80 (196.8) | 60 (147.6) | 135 (331.4) | 137 (352.0) |
| Arson (per 100,000) | 1 (4.0) | 6 (19.7) | 4 (12.9) | 4 (12.8) | 1 (3.0) | 2 (5.8) | 1 (2.9) | 2 (5.4) | 4 (10.4) | 2 (5.2) | 2 (4.9) | 2 (4.9) | 2 (4.9) | 1 (2.6) |
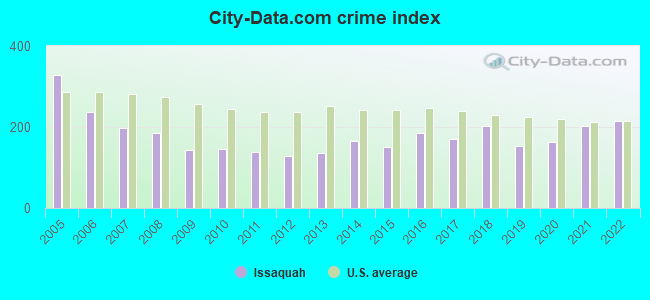
| City-Data.com crime index | 143.9 | 145.7 | 139.2 | 128.3 | 136.0 | 166.5 | 149.8 | 186.1 | 170.3 | 202.5 | 151.6 | 161.6 | 202.1 | 214.2 |
The City-Data.com crime index weighs serious crimes and violent crimes more heavily. Higher means more crime, U.S. average is 246.1. It adjusts for the number of visitors and daily workers commuting into cities.
Crime rate in Issaquah detailed stats: murders, rapes, robberies, assaults, burglaries, thefts, arson
Full-time law enforcement employees in 2021, including police officers: 49 (30 officers - 25 male; 5 female).
| Officers per 1,000 residents here: | 0.74 |
| Washington average: | 1.35 |
 Recent articles from our blog. Our writers, many of them Ph.D. graduates or candidates, create easy-to-read articles on a wide variety of topics.

 | Few Issaquah Rental Homes - Why? (5 replies) |
| Sammamish and Issaquah schools pressure cookers? (28 replies) |
| Issaquah for Retirement? (13 replies) |
| Issaquah school district budget cuts (4 replies) |
| Issaquah for a new college grad? (6 replies) |
| Bellevue vs Issaquah School district (5 replies) |
Latest news from Issaquah, WA collected exclusively by city-data.com from local newspapers, TV, and radio stations
Issaquah, WA City Guides:
Ancestries: English (7.8%), German (5.4%), European (4.5%), American (4.0%), Irish (3.0%), Russian (2.4%).
Current Local Time: PST time zone
Incorporated in 1892
Elevation: 100 feet
Land area: 8.42 square miles.
Population density: 4,670 people per square mile (average).
12,160 residents are foreign born (18.9% Asia, 5.2% Europe).
| This city: | 30.7% |
| Washington: | 14.9% |
Median real estate property taxes paid for housing units with mortgages in 2022: $7,356 (0.7%)
Median real estate property taxes paid for housing units with no mortgage in 2022: $6,327 (0.8%)
Nearest city with pop. 50,000+: Issaquah Plateau, WA (1.9 miles  , pop. 50,237).
Nearest city with pop. 200,000+: East Seattle, WA (8.0 miles , pop. 480,100).
Nearest city with pop. 1,000,000+: Los Angeles, CA (949.6 miles , pop. 3,694,820).
Nearest cities:
), ), ), ), ), Latitude: 47.54 N, Longitude: 122.04 W
Daytime population change due to commuting: +6,883 (+17.4%)
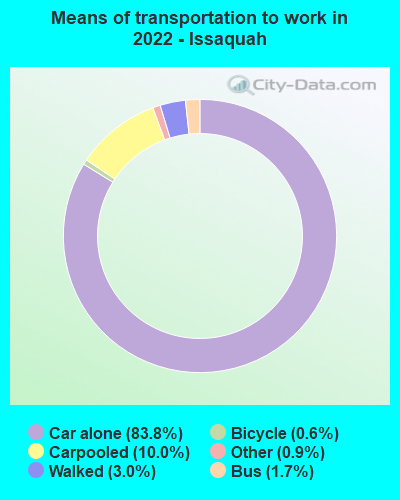
Workers who live and work in this city: 11,420 (50.5%)
Area code: 425
Property values in Issaquah, WA
Issaquah, Washington accommodation & food services, waste management - Economy and Business Data
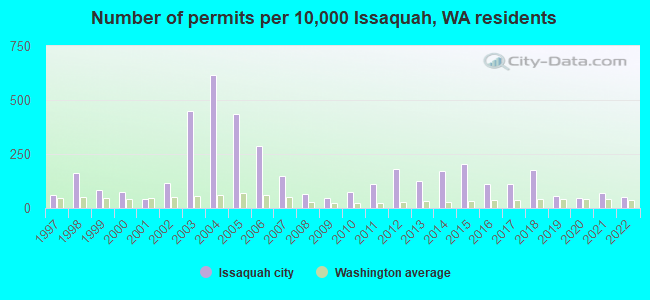
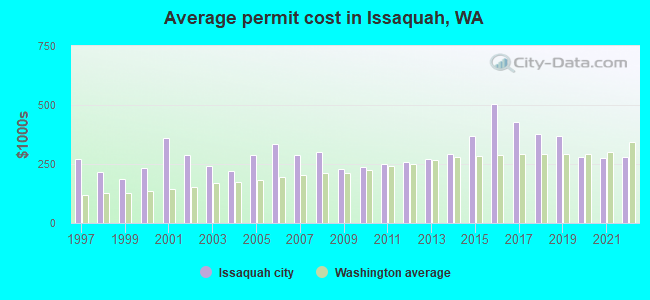
Single-family new house construction building permits:
- 2022: 56 buildings, average cost: $280,800
- 2021: 77 buildings, average cost: $275,200
- 2020: 51 buildings, average cost: $277,800
- 2019: 64 buildings, average cost: $370,300
- 2018: 199 buildings, average cost: $378,700
- 2017: 125 buildings, average cost: $425,900
- 2016: 127 buildings, average cost: $503,500
- 2015: 226 buildings, average cost: $367,700
- 2014: 189 buildings, average cost: $291,700
- 2013: 138 buildings, average cost: $273,300
- 2012: 203 buildings, average cost: $258,300
- 2011: 126 buildings, average cost: $252,200
- 2010: 84 buildings, average cost: $237,800
- 2009: 53 buildings, average cost: $227,500
- 2008: 71 buildings, average cost: $300,600
- 2007: 165 buildings, average cost: $287,300
- 2006: 324 buildings, average cost: $334,500
- 2005: 486 buildings, average cost: $288,100
- 2004: 692 buildings, average cost: $219,200
- 2003: 501 buildings, average cost: $241,700
- 2002: 132 buildings, average cost: $289,900
- 2001: 46 buildings, average cost: $359,000
- 2000: 81 buildings, average cost: $234,800
- 1999: 92 buildings, average cost: $186,000
- 1998: 184 buildings, average cost: $218,300
- 1997: 68 buildings, average cost: $269,900
| Here: | 3.2% |
| Washington: | 4.6% |
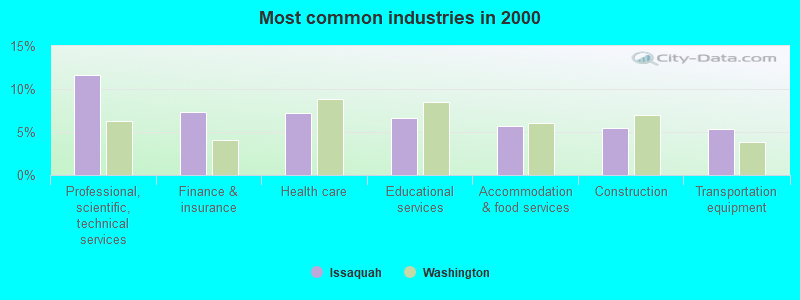
- Professional, scientific, technical services (11.6%)
- Finance & insurance (7.3%)
- Health care (7.2%)
- Educational services (6.7%)
- Accommodation & food services (5.7%)
- Construction (5.5%)
- Transportation equipment (5.4%)
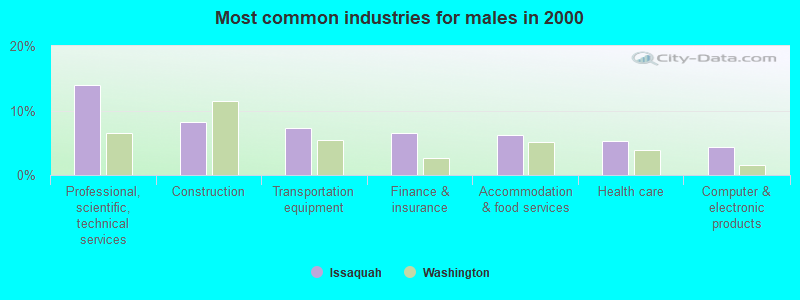
- Professional, scientific, technical services (14.0%)
- Construction (8.3%)
- Transportation equipment (7.3%)
- Finance & insurance (6.5%)
- Accommodation & food services (6.1%)
- Health care (5.3%)
- Computer & electronic products (4.4%)
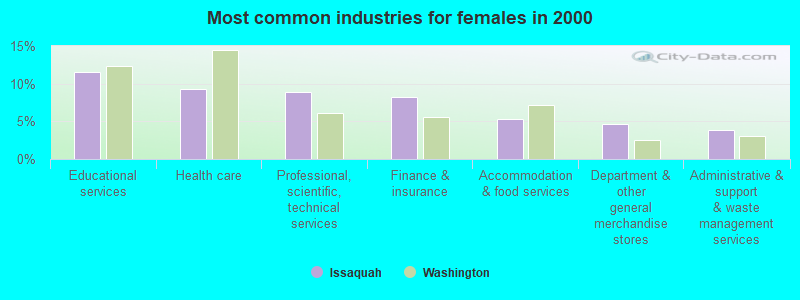
- Educational services (11.5%)
- Health care (9.4%)
- Professional, scientific, technical services (8.8%)
- Finance & insurance (8.3%)
- Accommodation & food services (5.2%)
- Department & other general merchandise stores (4.7%)
- Administrative & support & waste management services (3.8%)
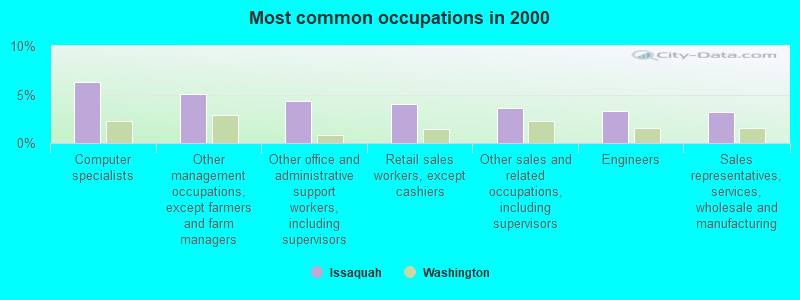
- Computer specialists (6.3%)
- Other management occupations, except farmers and farm managers (5.0%)
- Other office and administrative support workers, including supervisors (4.3%)
- Retail sales workers, except cashiers (4.0%)
- Other sales and related occupations, including supervisors (3.6%)
- Engineers (3.3%)
- Sales representatives, services, wholesale and manufacturing (3.2%)
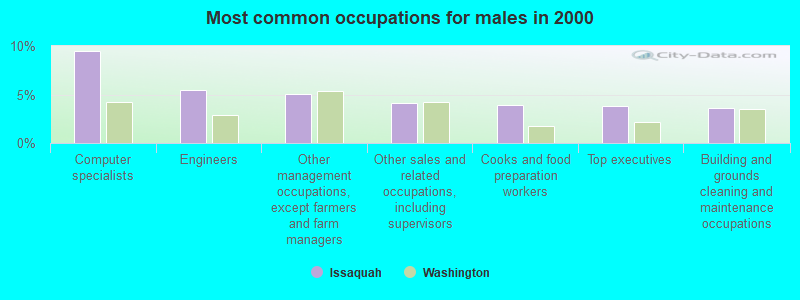
- Computer specialists (9.5%)
- Engineers (5.5%)
- Other management occupations, except farmers and farm managers (5.1%)
- Other sales and related occupations, including supervisors (4.1%)
- Cooks and food preparation workers (3.9%)
- Top executives (3.8%)
- Building and grounds cleaning and maintenance occupations (3.6%)
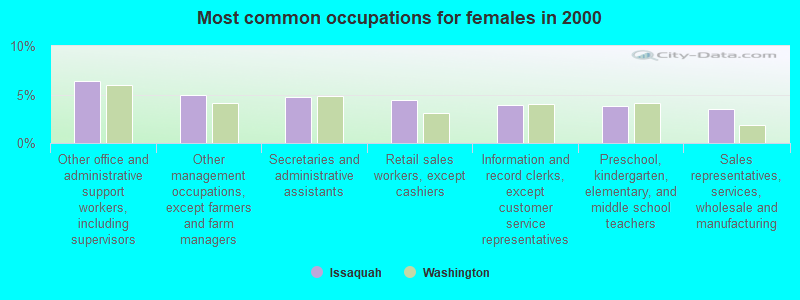
- Other office and administrative support workers, including supervisors (6.4%)
- Other management occupations, except farmers and farm managers (5.0%)
- Secretaries and administrative assistants (4.7%)
- Retail sales workers, except cashiers (4.5%)
- Information and record clerks, except customer service representatives (3.9%)
- Preschool, kindergarten, elementary, and middle school teachers (3.8%)
- Sales representatives, services, wholesale and manufacturing (3.5%)
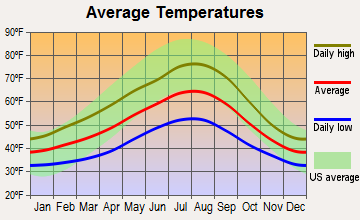
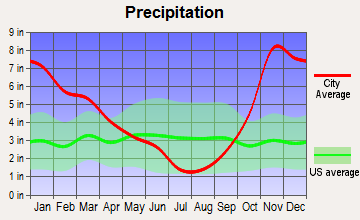
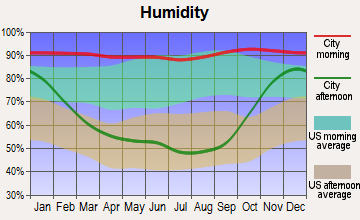
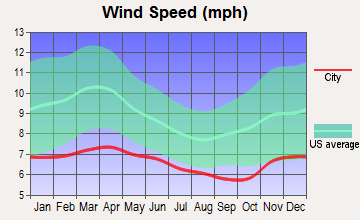
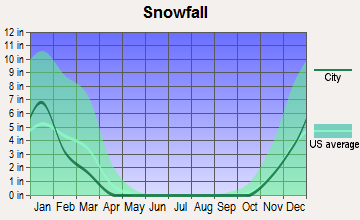
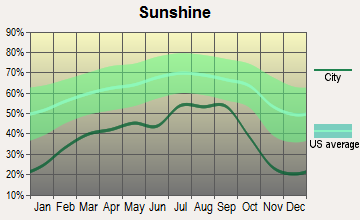
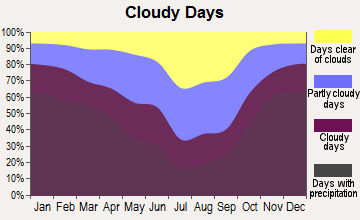
Average climate in Issaquah, Washington
Based on data reported by over 4,000 weather stations
|
|


(lower is better)
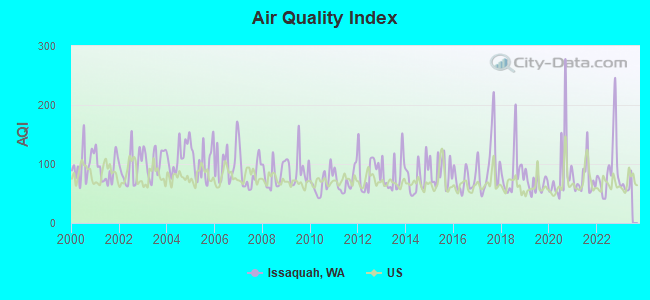
Air Quality Index (AQI) level in 2022 was 94.0. This is worse than average.
| City: | 94.0 |
| U.S.: | 72.6 |
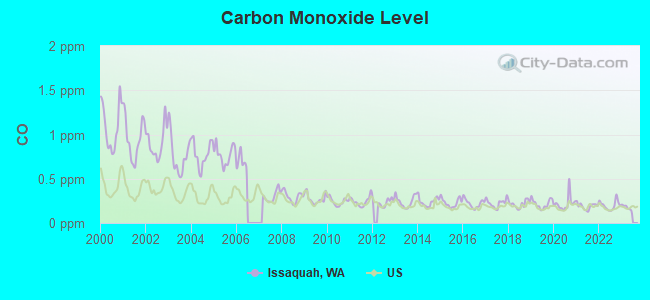
Carbon Monoxide (CO) [ppm] level in 2022 was 0.200. This is better than average. Closest monitor was 9.1 miles away from the city center.
| City: | 0.200 |
| U.S.: | 0.251 |
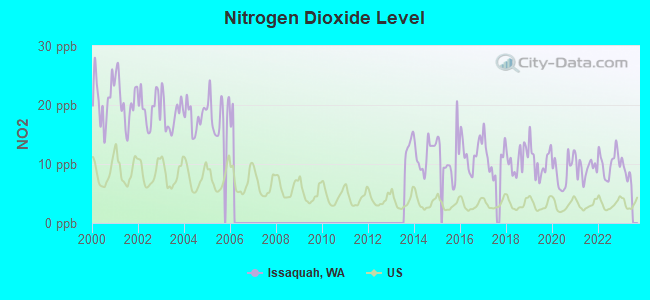
Nitrogen Dioxide (NO2) [ppb] level in 2022 was 10.2. This is significantly worse than average. Closest monitor was 10.1 miles away from the city center.
| City: | 10.2 |
| U.S.: | 5.1 |
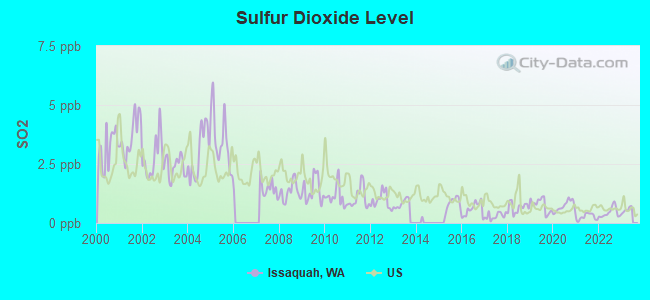
Sulfur Dioxide (SO2) [ppb] level in 2022 was 0.443. This is significantly better than average. Closest monitor was 10.1 miles away from the city center.
| City: | 0.443 |
| U.S.: | 1.515 |
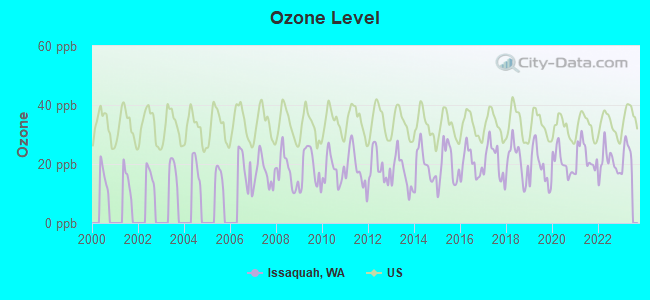
Ozone [ppb] level in 2022 was 20.4. This is significantly better than average. Closest monitor was 1.5 miles away from the city center.
| City: | 20.4 |
| U.S.: | 33.3 |
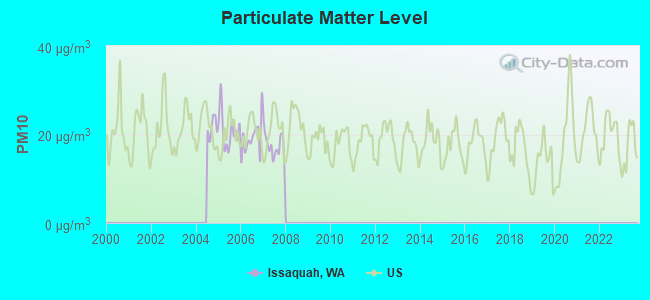
Particulate Matter (PM10) [µg/m3] level in 2007 was 17.4. This is about average. Closest monitor was 12.6 miles away from the city center.
| City: | 17.4 |
| U.S.: | 19.2 |
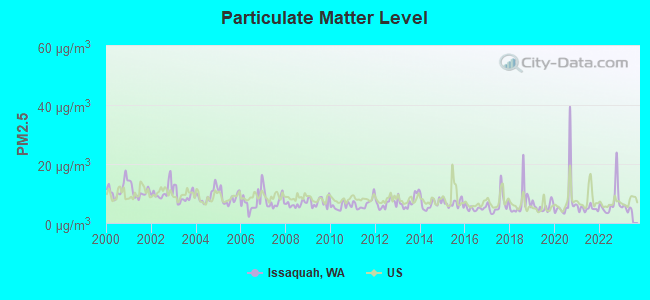
Particulate Matter (PM2.5) [µg/m3] level in 2022 was 7.22. This is about average. Closest monitor was 9.1 miles away from the city center.
| City: | 7.22 |
| U.S.: | 8.11 |
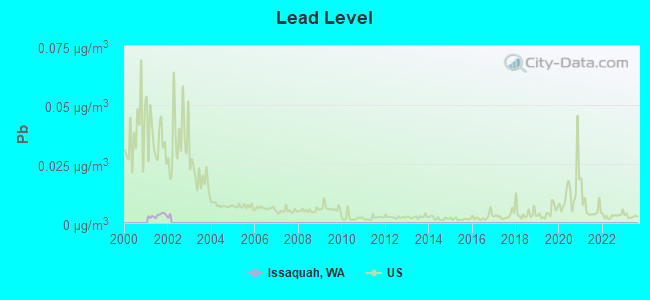
Lead (Pb) [µg/m3] level in 2001 was 0.00317. This is significantly better than average. Closest monitor was 1.5 miles away from the city center.
| City: | 0.00317 |
| U.S.: | 0.00931 |
Earthquake activity:
Issaquah-area historical earthquake activity is significantly above Washington state average. It is 1325% greater than the overall U.S. average.On 4/13/1949 at 19:55:42, a magnitude 7.0 (7.0 UK, Class: Major, Intensity: VIII - XII) earthquake occurred 29.1 miles away from Issaquah center, causing $80,000,000 total damage
On 2/28/2001 at 18:54:32, a magnitude 6.8 (6.5 MB, 6.6 MS, 6.8 MW, Class: Strong, Intensity: VII - IX) earthquake occurred 39.8 miles away from Issaquah center, causing $2,000,000,000 total damage and $305,000,000 insured losses
On 2/28/2001 at 18:54:32, a magnitude 6.8 (6.8 MD, Depth: 32.2 mi) earthquake occurred 41.7 miles away from Issaquah center
On 4/29/1965 at 15:28:43, a magnitude 6.6 (6.6 UK) earthquake occurred 20.3 miles away from the city center, causing $28,000,000 total damage
On 7/3/1999 at 01:43:54, a magnitude 5.8 (5.4 MB, 5.5 MS, 5.8 MW, 5.3 ME, Depth: 25.2 mi, Class: Moderate, Intensity: VI - VII) earthquake occurred 64.8 miles away from the city center
On 5/3/1996 at 04:04:22, a magnitude 5.5 (5.2 MB, 5.3 MD, 5.5 ML, Depth: 2.5 mi) earthquake occurred 24.9 miles away from Issaquah center
Magnitude types: body-wave magnitude (MB), duration magnitude (MD), energy magnitude (ME), local magnitude (ML), surface-wave magnitude (MS), moment magnitude (MW)
Natural disasters:
The number of natural disasters in King County (30) is a lot greater than the US average (15).Major Disasters (Presidential) Declared: 27
Emergencies Declared: 1
Causes of natural disasters: Floods: 21, Storms: 16, Mudslides: 11, Landslides: 9, Winter Storms: 7, Earthquakes: 2, Heavy Rains: 2, Winds: 2, Hurricane: 1, Snow: 1, Volcanic Eruption: 1, Other: 1 (Note: some incidents may be assigned to more than one category).
Main business address for: COSTCO WHOLESALE CORP /NEW (RETAIL-VARIETY STORES).
Hospitals and medical centers in Issaquah:
- SWEDISH ISSAQUAH (Voluntary non-profit - Private, 751 NE BLAKELY DR)
- BRIARWOOD AT TIMBER RIDGE (100 TIMBER RIDGE WAY NW)
- ISSAQUAH NURSING AND REHABILITATION CENTER (805 FRONT STREET)
- ISSAQUAH VILLA CARE CENTER (805 FRONT ST)
- MARIANWOOD (3725 PROVIDENCE POINT DR SE)
- MARIANWOOD EXTENDED HEALTHCARE (3725 PROVIDENCE PT.DR. S.E.)
- PROVIDENCE MARIANWOOD (3725 PROVIDENCE POINT DRIVE SOUTHEAST)
Heliports located in Issaquah:
See details about Heliports located in Issaquah, WAAmtrak station near Issaquah:
- 15 miles: SEATTLE (303 S. JACKSON ST.) . Services: ticket office, fully wheelchair accessible, enclosed waiting area, public restrooms, public payphones, vending machines, paid short-term parking, paid long-term parking, call for car rental service, taxi stand, intercity bus service, public transit connection.
Colleges/universities with over 2000 students nearest to Issaquah:
- Bellevue College (about 7 miles; Bellevue, WA; Full-time enrollment: 10,940)
- Renton Technical College (about 8 miles; Renton, WA; FT enrollment: 2,549)
- Lake Washington Institute of Technology (about 14 miles; Kirkland, WA; FT enrollment: 2,947)
- Seattle University (about 14 miles; Seattle, WA; FT enrollment: 5,808)
- Seattle Central College (about 15 miles; Seattle, WA; FT enrollment: 5,825)
- Seattle Community College-South Campus (about 15 miles; Seattle, WA; FT enrollment: 3,986)
- University of Washington-Seattle Campus (about 16 miles; Seattle, WA; FT enrollment: 39,445)
Public high schools in Issaquah:
- ISSAQUAH HIGH SCHOOL (Location: 700 2ND AVE SE, Grades: 9-12)
- ISSAQUAH SPECIAL SERVICES (Location: 565 NW HOLLY ST, Grades: PK-12)
- TIGER MOUNTAIN COMMUNITY HIGH SCHOOL (Location: 355 SE EVANS LN, Grades: 9-12)
Public elementary/middle schools in Issaquah:
- ISSAQUAH MIDDLE SCHOOL (Location: 400 1ST AVE SE, Grades: 6-8)
- ISSAQUAH VALLEY ELEMENTARY (Location: 555 NW HOLLY ST, Grades: KG-5)
- BEAVER LAKE MIDDLE SCHOOL (Location: 25025 SE 32ND ST, Grades: 6-8)
- CLARK ELEMENTARY (Location: 500 2ND AVE SE, Grades: KG-5)
- CHALLENGER ELEMENTARY (Location: 25200 SE KLAHANIE BLVD, Grades: KG-5)
- DISCOVERY ELEMENTARY (Location: 2300 228TH AVE SE, Grades: PK-5)
- ENDEAVOUR ELEMENTARY SCHOOL (Location: 26205 SE ISSAQUAH-FALL CITY RD, Grades: KG-5)
- GRAND RIDGE ELEMENTARY (Location: 1739 NE PARK DR, Grades: KG-5)
- PACIFIC CASCADE MIDDLE SCHOOL (Location: 24635 SE ISSAQUAH FALL CITY RD, Grades: 6-8)
Private elementary/middle schools in Issaquah:
- ST JOSEPH SCHOOL (Students: 355, Location: 220 MT PARK BLVD SW, Grades: PK-8)
- SAMMAMISH CHRISTIAN SCHOOL & NOAH'S ARK PRESCHOOL (Students: 136, Location: 4221 228TH AVE SE B, Grades: PK-2)
- SNOQUALMIE SPRINGS SCHOOL (Students: 55, Location: 25237 SE ISSAQUAH FALL CITY RD, Grades: PK-3)
Library in Issaquah:
- KING COUNTY LIBRARY SYSTEM (Operating income: $85,303,841; Location: 960 NEWPORT WAY NW; 2,838,794 books; 20,048 e-books; 318,003 audio materials; 242,699 video materials; 66 local licensed databases; 11 state licensed databases; 14 other licensed databases; 11,885 print serial subscriptions; 5,835 electronic serial subscriptions)
Points of interest:
Notable locations in Issaquah: Issaquah School District 411 Transportation Center (A), Yeoman Square (B), Town and Country Square (C), Issaquah Plaza (D), Gilman Square (E), Goodes Corner (F), Eastside Fire and Rescue Station 73 Bellevue Medic 14 (G), Eastside Fire and Rescue Station 72 (H), Issaquah Nursing and Rehabilitation Center (I), Eastside Fire and Rescue Station 71 (J), Eastside Fire and Rescue Headquarters (K). Display/hide their locations on the map
Main business address in Issaquah: COSTCO WHOLESALE CORP /NEW (A). Display/hide its location on the map
Churches in Issaquah include: Community Church of Issaquah (A), Mountain Creek Christian Fellowship Church (B), Saint Joseph Catholic Church (C), Church of Christ Isaaquah (D), Meadow Creek Chapel (E), Our Savior Lutheran Church of Issaquah (F), Saint Michael and All Angels Church of Issaquah (G), Kingdom Hall of Jehovahs Witnesses (H), The Church of Jesus Christ of Latter Day Saints (I). Display/hide their locations on the map
Cemetery: Hillside Cemetery (1). Display/hide its location on the map
Lakes: Tradition Lake (A), Round Lake (B). Display/hide their locations on the map
Creeks: East Fork Issaquah Creek (A), Hope Creek (B). Display/hide their locations on the map
Tourist attractions: Issaquah Historical Society Depot (Museums; 50 Rainier Boulevard North) (1), Issaquah Historical Society (Museums; 165 Southeast Andrews Street) (2), Cougar Mountain Zoological Park (Cultural Attractions- Events- & Facilities; 19525 Southeast 54th Street) (3), Illusionz Magical Entertainment Center (Arcades & Amusements; 1025 NW Gilman Blvd) (4). Display/hide their approximate locations on the map
Hotels: Motel 6 (1885 15th Place Northwest) (1), Holiday Inn of Issaquah (1801 12th Avenue Northwest) (2). Display/hide their approximate locations on the map
Court: King County - Courts- District Court Divisions- East Division- Issaquah Courthouse- District Co (5415 220th Avenue Southeast) (1). Display/hide its approximate location on the map
Birthplace of: Shawn Medved - Soccer player, Colin Curtis - Baseball player, Hans Gasser - College basketball player (Washington Huskies), Matt Nelson - College basketball player (Eastern Wash. Eagles).
Drinking water stations with addresses in Issaquah and their reported violations in the past:
ISSAQUAH CHRISTIAN CHURCH (Population served: 79, Groundwater):Past monitoring violations:FRATERNITY SNOQUALMIE (Population served: 43, Groundwater):
- 3 routine major monitoring violations
Past monitoring violations:
- 3 routine major monitoring violations
| This city: | 2.3 people |
| Washington: | 2.5 people |
| This city: | 62.4% |
| Whole state: | 64.4% |
| This city: | 5.7% |
| Whole state: | 7.7% |
Likely homosexual households (counted as self-reported same-sex unmarried-partner households)
- Lesbian couples: 0.3% of all households
- Gay men: 0.3% of all households
People in group quarters in Issaquah in 2010:
- 242 people in nursing facilities/skilled-nursing facilities
- 121 people in other noninstitutional facilities
- 68 people in workers' group living quarters and job corps centers
- 12 people in group homes intended for adults
People in group quarters in Issaquah in 2000:
- 140 people in nursing homes
- 77 people in other noninstitutional group quarters
- 10 people in homes for the mentally retarded
Banks with most branches in Issaquah (2011 data):
- Opus Bank: Issaquah Branch, Pine Lake Branch, Front Street Branch. Info updated 2011/11/08: Bank assets: $2,404.2 mil, Deposits: $1,831.2 mil, headquarters in Irvine, CA, negative income in the last year, Commercial Lending Specialization, 38 total offices
- JPMorgan Chase Bank, National Association: Pine Lake Branch, Issaquah, Lake Sammamish Branch. Info updated 2011/11/10: Bank assets: $1,811,678.0 mil, Deposits: $1,190,738.0 mil, headquarters in Columbus, OH, positive income, International Specialization, 5577 total offices, Holding Company: Jpmorgan Chase & Co.
- Wells Fargo Bank, National Association: Pine Lake Branch, Klahanie Village Branch, Issaquah Branch. Info updated 2011/04/05: Bank assets: $1,161,490.0 mil, Deposits: $905,653.0 mil, headquarters in Sioux Falls, SD, positive income, 6395 total offices, Holding Company: Wells Fargo & Company
- KeyBank National Association: Issaquah North Branch at 6220 East Lake Sammamish Parkway, Suite E, branch established on 2001/04/16; Issaquah Branch at 405 N.W. Gilman Boulevard, branch established on 1984/07/18. Info updated 2008/03/03: Bank assets: $86,198.8 mil, Deposits: $64,214.8 mil, headquarters in Cleveland, OH, positive income, Commercial Lending Specialization, 1067 total offices, Holding Company: Keycorp
- Bank of America, National Association: Issaquah Branch at 665 Front St. N., branch established on 1944/01/03; West Issaquah Branch at 1135 N.W. Gilman Boulevard, Suite F-1, branch established on 1969/12/15. Info updated 2009/11/18: Bank assets: $1,451,969.3 mil, Deposits: $1,077,176.8 mil, headquarters in Charlotte, NC, positive income, 5782 total offices, Holding Company: Bank Of America Corporation
- Washington Federal: Issaquah Branch at 855 Rainier Boulevard, branch established on 1968/07/01. Info updated 2011/12/19: Bank assets: $13,653.0 mil, Deposits: $8,905.8 mil, headquarters in Seattle, WA, positive income, Mortgage Lending Specialization, 174 total offices
- U.S. Bank National Association: Issaquah Branch at 1295 N.W. Gilman Boulevard, branch established on 1985/12/02. Info updated 2012/01/30: Bank assets: $330,470.8 mil, Deposits: $236,091.5 mil, headquarters in Cincinnati, OH, positive income, 3121 total offices, Holding Company: U.S. Bancorp
- AmericanWest Bank: Issaquah Branch at 1375 Northwest Mall Street, Suite 1, branch established on 2005/06/15. Info updated 2011/12/12: Bank assets: $2,274.6 mil, Deposits: $1,889.1 mil, headquarters in Spokane, WA, positive income, Commercial Lending Specialization, 76 total offices, Holding Company: Skbhc Holdings Llc
- Sterling Savings Bank: Issaquah Branch at 705 Gilman Boulevard, branch established on 2006/08/30. Info updated 2012/03/21: Bank assets: $9,207.8 mil, Deposits: $6,454.1 mil, headquarters in Spokane, WA, positive income, Commercial Lending Specialization, 192 total offices, Holding Company: Sterling Financial Corporation
For population 15 years and over in Issaquah:
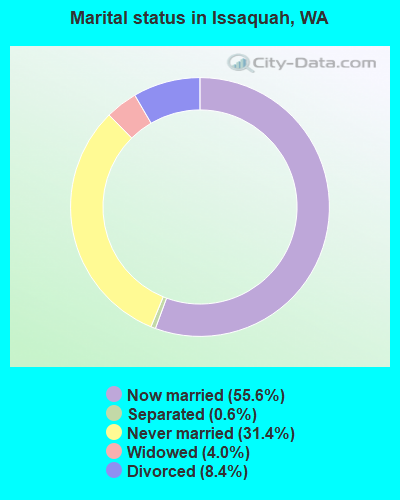
- Never married: 31.4%
- Now married: 55.6%
- Separated: 0.6%
- Widowed: 4.0%
- Divorced: 8.4%
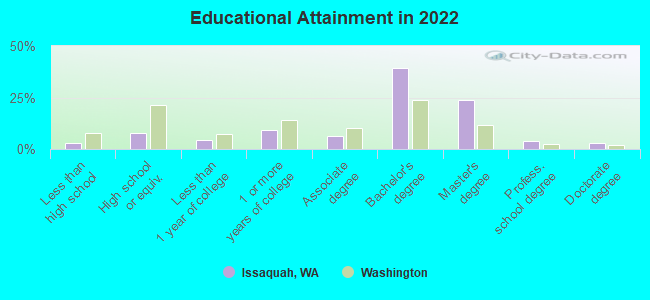
For population 25 years and over in Issaquah:
- High school or higher: 97.2%
- Bachelor's degree or higher: 68.5%
- Graduate or professional degree: 29.1%
- Unemployed: 4.3%
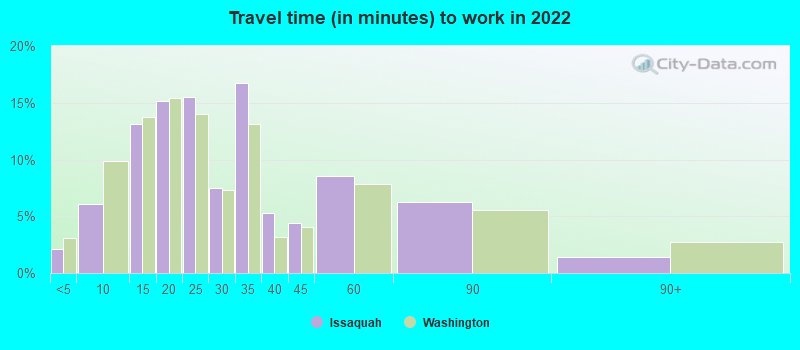
- Mean travel time to work (commute): 17.3 minutes
| Here: | 9.2 |
| Washington average: | 11.6 |
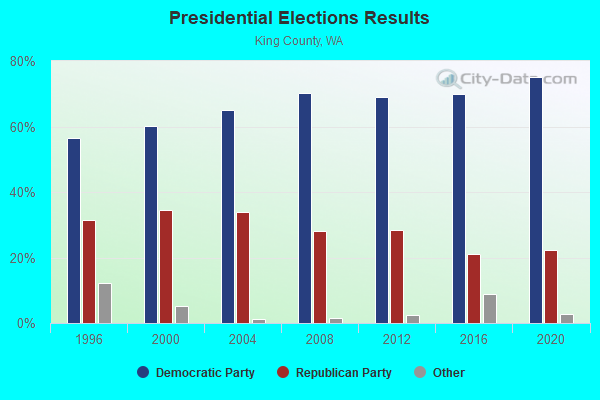
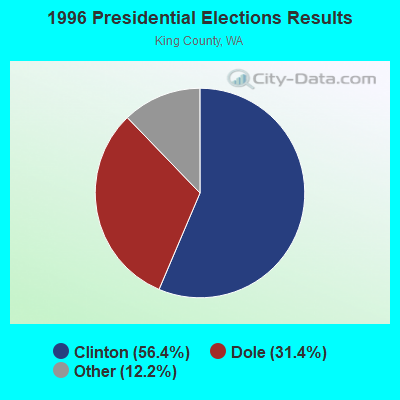
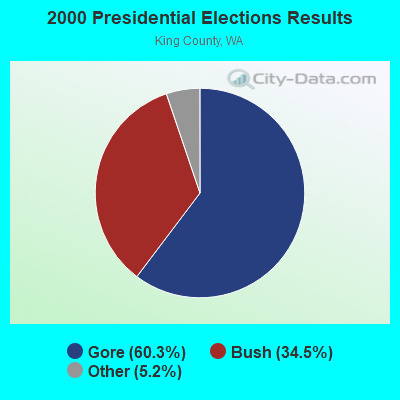
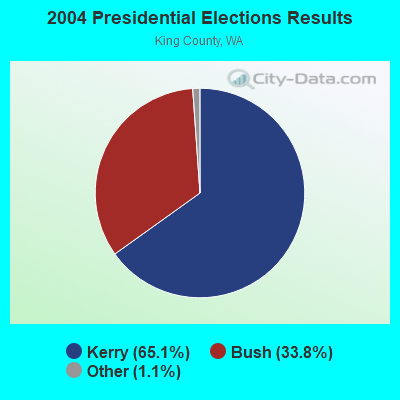
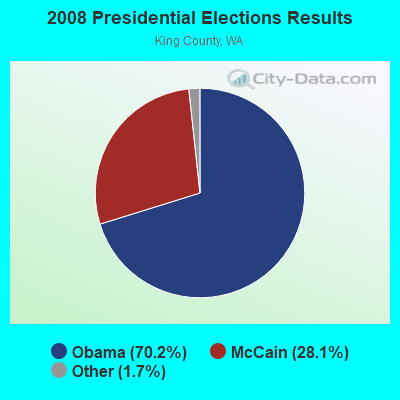
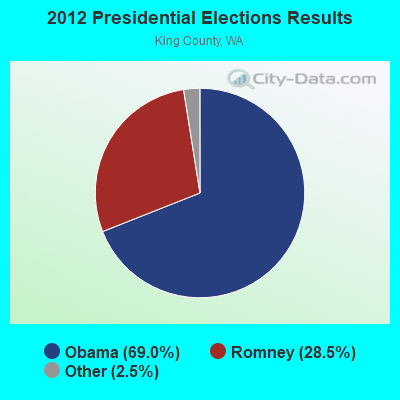
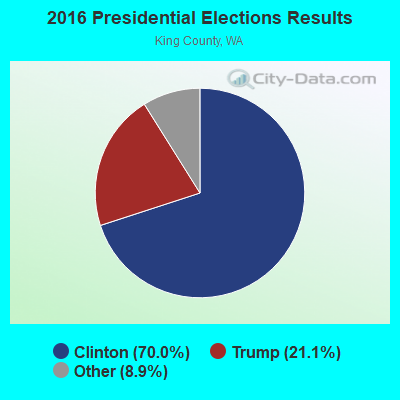
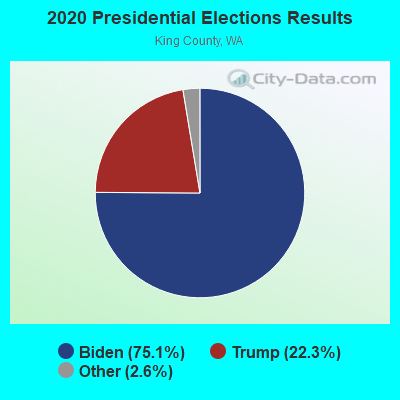
Graphs represent county-level data. Detailed 2008 Election Results
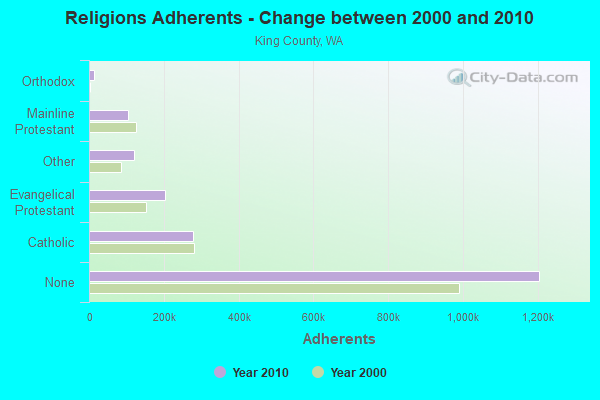
Religion statistics for Issaquah, WA (based on King County data)
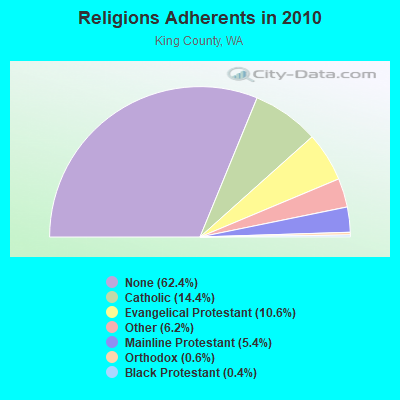
| Religion | Adherents | Congregations |
|---|---|---|
| Catholic | 278,340 | 71 |
| Evangelical Protestant | 204,523 | 711 |
| Other | 119,713 | 329 |
| Mainline Protestant | 104,806 | 304 |
| Orthodox | 12,257 | 20 |
| Black Protestant | 7,030 | 24 |
| None | 1,204,580 | - |
Food Environment Statistics:
| King County: | 2.37 / 10,000 pop. |
| Washington: | 2.06 / 10,000 pop. |
| This county: | 0.16 / 10,000 pop. |
| Washington: | 0.19 / 10,000 pop. |
| King County: | 1.19 / 10,000 pop. |
| State: | 1.18 / 10,000 pop. |
| Here: | 2.16 / 10,000 pop. |
| State: | 2.67 / 10,000 pop. |
| King County: | 10.95 / 10,000 pop. |
| Washington: | 8.26 / 10,000 pop. |
| This county: | 6.7% |
| Washington: | 7.7% |
| Here: | 20.5% |
| Washington: | 25.7% |
| This county: | 14.6% |
| Washington: | 13.9% |
Health and Nutrition:
| Here: | 52.1% |
| State: | 49.9% |
| Here: | 51.1% |
| State: | 47.2% |
| Issaquah: | 27.9 |
| Washington: | 28.4 |
| This city: | 20.7% |
| Washington: | 20.9% |
| This city: | 8.7% |
| Washington: | 10.5% |
| This city: | 6.9 |
| State: | 6.8 |
| Issaquah: | 32.0% |
| Washington: | 32.8% |
| Issaquah: | 59.5% |
| Washington: | 56.8% |
| This city: | 81.2% |
| Washington: | 79.4% |
More about Health and Nutrition of Issaquah, WA Residents
| Local government employment and payroll (March 2022) | |||||
| Function | Full-time employees | Monthly full-time payroll | Average yearly full-time wage | Part-time employees | Monthly part-time payroll |
|---|---|---|---|---|---|
| Other Government Administration | 103 | $766,674 | $89,321 | 9 | $31,426 |
| Parks and Recreation | 35 | $218,528 | $74,924 | 4 | $14,794 |
| Police Protection - Officers | 34 | $298,972 | $105,520 | 0 | $0 |
| Police - Other | 15 | $91,916 | $73,533 | 0 | $0 |
| Streets and Highways | 15 | $108,691 | $86,953 | 0 | $0 |
| Water Supply | 12 | $71,718 | $71,718 | 0 | $0 |
| Correction | 12 | $65,354 | $65,354 | 0 | $0 |
| Sewerage | 12 | $75,169 | $75,169 | 0 | $0 |
| Financial Administration | 9 | $73,775 | $98,367 | 3 | $22,409 |
| Judicial and Legal | 5 | $32,694 | $78,466 | 0 | $0 |
| Solid Waste Management | 4 | $38,110 | $114,330 | 1 | $3,447 |
| Totals for Government | 256 | $1,841,601 | $86,325 | 17 | $72,076 |
Issaquah government finances - Expenditure in 2021 (per resident):
- Construction - Regular Highways: $5,737,000 ($145.82)
General - Other: $363,000 ($9.23)
Parks and Recreation: $182,000 ($4.63)
Local Fire Protection: $92,000 ($2.34)
- Current Operations - Sewerage: $13,838,000 ($351.72)
Water Utilities: $9,191,000 ($233.61)
Police Protection: $7,277,000 ($184.96)
Local Fire Protection: $7,270,000 ($184.78)
Central Staff Services: $5,140,000 ($130.64)
Parks and Recreation: $4,521,000 ($114.91)
Regular Highways: $4,429,000 ($112.57)
General - Other: $4,147,000 ($105.40)
Judicial and Legal Services: $3,355,000 ($85.27)
Housing and Community Development: $3,342,000 ($84.94)
Financial Administration: $2,781,000 ($70.68)
Health - Other: $2,294,000 ($58.31)
Correctional Institutions: $2,020,000 ($51.34)
General Public Buildings: $1,705,000 ($43.34)
Natural Resources - Other: $888,000 ($22.57)
Miscellaneous Commercial Activities - Other: $25,000 ($0.64)
- General - Interest on Debt: $786,000 ($19.98)
- Other Capital Outlay - Water Utilities: $1,279,000 ($32.51)
Sewerage: $1,149,000 ($29.20)
Natural Resources - Other: $257,000 ($6.53)
Parks and Recreation: $35,000 ($0.89)
Regular Highways: $20,000 ($0.51)
General - Other: $5,000 ($0.13)
- Total Salaries and Wages: $23,413,000 ($595.08)
- Water Utilities - Interest on Debt: $44,000 ($1.12)
Issaquah government finances - Revenue in 2021 (per resident):
- Charges - Solid Waste Management: $11,071,000 ($281.39)
Sewerage: $5,747,000 ($146.07)
Other: $5,698,000 ($144.83)
Parks and Recreation: $817,000 ($20.77)
Regular Highways: $118,000 ($3.00)
Miscellaneous Commercial Activities: $111,000 ($2.82)
- Federal Intergovernmental - Health and Hospitals: $134,000 ($3.41)
Other: $47,000 ($1.19)
- Local Intergovernmental - Other: $1,046,000 ($26.59)
- Miscellaneous - Interest Earnings: $1,332,000 ($33.86)
Rents: $1,332,000 ($33.86)
Fines and Forfeits: $845,000 ($21.48)
General Revenue - Other: $588,000 ($14.95)
Donations From Private Sources: $289,000 ($7.35)
Special Assessments: $89,000 ($2.26)
- Revenue - Water Utilities: $11,354,000 ($288.58)
- State Intergovernmental - Health and Hospitals: $1,797,000 ($45.67)
Highways: $1,605,000 ($40.79)
Other: $574,000 ($14.59)
General Local Government Support: $551,000 ($14.00)
- Tax - General Sales and Gross Receipts: $17,427,000 ($442.94)
Property: $11,281,000 ($286.73)
Occupation and Business License - Other: $5,626,000 ($143.00)
Public Utilities Sales: $5,279,000 ($134.18)
Documentary and Stock Transfer: $4,329,000 ($110.03)
Other License: $1,993,000 ($50.66)
Other Selective Sales: $247,000 ($6.28)
Amusements Sales: $91,000 ($2.31)
Public Utility License: $3,000 ($0.08)
Issaquah government finances - Debt in 2021 (per resident):
- Long Term Debt - Outstanding Unspecified Public Purpose: $43,772,000 ($1112.55)
Beginning Outstanding - Unspecified Public Purpose: $38,638,000 ($982.06)
Issue, Unspecified Public Purpose: $16,253,000 ($413.10)
Retired Unspecified Public Purpose: $11,120,000 ($282.64)
6.69% of this county's 2021 resident taxpayers lived in other counties in 2020 ($106,002 average adjusted gross income)
| Here: | 6.69% |
| Washington average: | 7.53% |
0.02% of residents moved from foreign countries ($181 average AGI)
King County: 0.02% Washington average: 0.05%
Top counties from which taxpayers relocated into this county between 2020 and 2021:
| from Snohomish County, WA | |
| from Pierce County, WA | |
| from Los Angeles County, CA |
7.71% of this county's 2020 resident taxpayers moved to other counties in 2021 ($123,052 average adjusted gross income)
| Here: | 7.71% |
| Washington average: | 7.40% |
0.01% of residents moved to foreign countries ($183 average AGI)
King County: 0.01% Washington average: 0.04%
Top counties to which taxpayers relocated from this county between 2020 and 2021:
| to Snohomish County, WA | |
| to Pierce County, WA | |
| to Maricopa County, AZ |
| Businesses in Issaquah, WA | ||||
| Name | Count | Name | Count | |
|---|---|---|---|---|
| 24 Hour Fitness | 1 | Kroger | 4 | |
| AT&T | 1 | Lane Bryant | 1 | |
| Barnes & Noble | 1 | Lowe's | 1 | |
| Baskin-Robbins | 2 | MasterBrand Cabinets | 3 | |
| Bath & Body Works | 1 | McDonald's | 2 | |
| Bed Bath & Beyond | 1 | Motel 6 | 1 | |
| Ben & Jerry's | 1 | New Balance | 1 | |
| Big O Tires | 1 | Nike | 4 | |
| Blockbuster | 1 | Office Depot | 1 | |
| Burger King | 1 | Panera Bread | 1 | |
| Chevrolet | 1 | Papa John's Pizza | 1 | |
| Chico's | 1 | Payless | 1 | |
| Chipotle | 1 | PetSmart | 1 | |
| Cold Stone Creamery | 1 | Pier 1 Imports | 1 | |
| Costco | 1 | Qdoba Mexican Grill | 1 | |
| Curves | 1 | Quiznos | 1 | |
| DHL | 1 | RadioShack | 1 | |
| Dennys | 1 | Red Robin | 1 | |
| Domino's Pizza | 1 | Rite Aid | 1 | |
| Famous Footwear | 1 | Safeway | 1 | |
| FedEx | 6 | Sprint Nextel | 1 | |
| Firestone Complete Auto Care | 1 | Staples | 1 | |
| Ford | 1 | Starbucks | 9 | |
| GNC | 2 | Subway | 5 | |
| GameStop | 1 | T-Mobile | 3 | |
| H&R Block | 1 | Taco Bell | 1 | |
| Hilton | 1 | Target | 1 | |
| Holiday Inn | 1 | Trader Joe's | 1 | |
| Home Depot | 1 | U-Haul | 1 | |
| IHOP | 1 | UPS | 8 | |
| Jack In The Box | 1 | Vans | 1 | |
| Jamba Juice | 2 | Verizon Wireless | 1 | |
| Justice | 1 | Vons | 1 | |
| KFC | 1 | YMCA | 1 | |
| Kincaid | 1 | |||
Strongest AM radio stations in Issaquah:
- KIXI (880 AM; 50 kW; MERCER ISLAND/SEATTL, WA; Owner: BELLEVUE RADIO, INC.)
- KIRO (710 AM; 50 kW; SEATTLE, WA; Owner: ENTERCOM SEATTLE LICENSE, LLC)
- KKNW (1150 AM; 10 kW; SEATTLE, WA; Owner: ORCA RADIO, INC.)
- KTTH (770 AM; 50 kW; SEATTLE, WA; Owner: ENTERCOM SEATTLE LICENSE, LLC)
- KOMO (1000 AM; 50 kW; SEATTLE, WA; Owner: FISHER BROADCASTING - SEATTLE RADIO, L.L.C.)
- KGNW (820 AM; 50 kW; BURIEN-SEATTLE, WA; Owner: INSPIRATION MEDIA, INC.)
- KYCW (1090 AM; 50 kW; SEATTLE, WA; Owner: INFINITY RADIO SUBSIDIARY OPERATIONS INC.)
- KJR (950 AM; 50 kW; SEATTLE, WA)
- KRIZ (1420 AM; 10 kW; RENTON, WA; Owner: KRIZ BROADCASTING, INC.)
- KKOL (1300 AM; 50 kW; SEATTLE, WA; Owner: INSPIRATION MEDIA, INC.)
- KNWX (1210 AM; 28 kW; AUBURN-FEDERAL WAY, WA; Owner: ENTERCOM SEATTLE LICENSE, LLC)
- KRKO (1380 AM; 50 kW; EVERETT, WA; Owner: S-R BROADCASTING, CO.)
- KYIZ (1620 AM; 10 kW; RENTON, WA; Owner: KRIZ BROADCASTING, INC.)
Strongest FM radio stations in Issaquah:
- KBSG-FM (97.3 FM; TACOMA, WA; Owner: ENTERCOM SEATTLE LICENSE, LLC)
- KMTT (103.7 FM; TACOMA, WA; Owner: ENTERCOM SEATTLE LICENSE, LLC)
- KNDD (107.7 FM; SEATTLE, WA; Owner: ENTERCOM SEATTLE LICENSE, LLC)
- KYPT (96.5 FM; SEATTLE, WA; Owner: INFINITY RADIO SUBSIDIARY OPERATIONS INC.)
- KBKS (106.1 FM; TACOMA, WA; Owner: INFINITY RADIO SUBSIDIARY OPERATIONS INC.)
- KING-FM (98.1 FM; SEATTLE, WA; Owner: CLASSIC RADIO, INC.)
- KLSY-FM (92.5 FM; BELLEVUE, WA; Owner: BELLEVUE RADIO INC.)
- KPLU-FM (88.5 FM; TACOMA, WA; Owner: PACIFIC LUTHERAN UNIVERSITY, INC.)
- KWJZ (98.9 FM; SEATTLE, WA; Owner: ORCA RADIO, INC.)
- KZOK-FM (102.5 FM; SEATTLE, WA; Owner: INFINITY RADIO SUBSIDIARY OPERATIONS INC.)
- KMPS-FM (94.1 FM; SEATTLE, WA; Owner: INFINITY RADIO SUBSIDIARY OPERATIONS INC.)
- KJR-FM (95.7 FM; SEATTLE, WA; Owner: ACKERLEY MEDIA GROUP, INC.)
- KUBE (93.3 FM; SEATTLE, WA; Owner: ACKERLEY MEDIA GROUP, INC.)
- KPLZ-FM (101.5 FM; SEATTLE, WA; Owner: FISHER BROADCASTING - SEATTLE RADIO, L.L.C.)
- KNHC (89.5 FM; SEATTLE, WA; Owner: SEATTLE PUBLIC SCHOOLS)
- KQBZ (100.7 FM; SEATTLE, WA; Owner: ENTERCOM SEATTLE LICENSE, LLC)
- KISW (99.9 FM; SEATTLE, WA; Owner: ENTERCOM SEATTLE LICENSE, LLC)
- KRWM (106.9 FM; BREMERTON, WA; Owner: SEASCAPE RADIO, INC.)
- K201EX (88.1 FM; GREENWATER, WA; Owner: CALVARY CHAPEL OF TWIN FALLS, INC.)
- KUOW (94.9 FM; SEATTLE, WA; Owner: THE UNIVERSITY OF WASHINGTON)
TV broadcast stations around Issaquah:
- KHCV (Channel 45; SEATTLE, WA; Owner: NORTH PACIFIC INTERNATIONAL TELEVISION, INC.)
- KWPX (Channel 33; BELLEVUE, WA; Owner: PAXSON COMMUNICATIONS LICENSE COMPANY, LLC)
- KWDK (Channel 56; TACOMA, WA; Owner: PUGET SOUND EDUCATIONAL TV, INC.)
- KWOG (Channel 51; BELLEVUE, WA; Owner: AFRICAN-AMERICAN BROADCASTING CO.OF BELLEVUE, INC.)
- KSTW (Channel 11; TACOMA, WA; Owner: UPN TELEVISION STATIONS INC.)
- KING-TV (Channel 5; SEATTLE, WA; Owner: KING BROADCASTING COMPANY)
- KTWB-TV (Channel 22; SEATTLE, WA; Owner: TRIBUNE TELEVISION HOLDINGS, INC.)
- K58DP (Channel 58; SEATTLE, WA; Owner: WORD OF GOD FELLOWSHIP, INC.)
- KCTS-TV (Channel 9; SEATTLE, WA; Owner: KCTS TELEVISION)
- KOMO-TV (Channel 4; SEATTLE, WA; Owner: FISHER BROADCASTING - SEATTLE TV, L.L.C.)
- KIRO-TV (Channel 7; SEATTLE, WA; Owner: KIRO-TV HOLDINGS, INC.)
- K57HB (Channel 57; EUREKA, CA; Owner: MS COMMUNICATIONS, LLC)
- K68DL (Channel 68; SEATTLE, WA; Owner: THREE ANGELS BROADCASTING NETWORK)
- KONG-TV (Channel 16; EVERETT, WA; Owner: KONG-TV, INC.)
- KCPQ (Channel 13; TACOMA, WA; Owner: TRIBUNE TELEVISION NORTHWEST, INC.)
- KBTC-TV (Channel 28; TACOMA, WA; Owner: BATES TECHNICAL COLLEGE)
- K03FA (Channel 3; ISSAQUAH, ETC., WA; Owner: KING CTY. T.V. RECPT. DIST. #2)
- K10LA (Channel 10; ISSAQUAH, ETC., WA; Owner: KING CTY. T.V. RECPT. DIST. #2)
Issaquah fatal accident list:
Sep 26, 1998 03:01 AM, I-90, Vehicles: 1, Persons: 1, Fatalities: 1, Drunk persons involved: 1
Jun 3, 1994 05:54 PM, I90, Vehicles: 1, Persons: 1, Fatalities: 1, Drunk persons involved: 1
Sep 3, 1988 04:40 AM, I90, Vehicles: 1, Persons: 1, Fatalities: 1, Drunk persons involved: 1
- National Bridge Inventory (NBI) Statistics
- 67Number of bridges
- 1,056ft / 322mTotal length
- $229,819,000Total costs
- 1,560,215Total average daily traffic
- 103,193Total average daily truck traffic
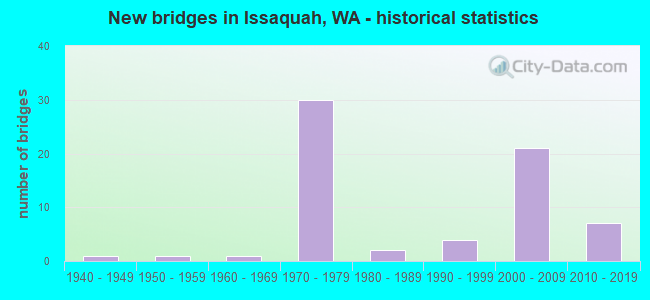
- New bridges - historical statistics
- 11940-1949
- 11950-1959
- 11960-1969
- 301970-1979
- 21980-1989
- 41990-1999
- 212000-2009
- 72010-2019
FCC Registered Commercial Land Mobile Towers: 24 (See the full list of FCC Registered Commercial Land Mobile Towers in Issaquah, WA)
FCC Registered Private Land Mobile Towers: 5 (See the full list of FCC Registered Private Land Mobile Towers)
FCC Registered Broadcast Land Mobile Towers: 68 (See the full list of FCC Registered Broadcast Land Mobile Towers)
FCC Registered Microwave Towers: 87 (See the full list of FCC Registered Microwave Towers in this town)
FCC Registered Paging Towers: 16 (See the full list of FCC Registered Paging Towers)
FCC Registered Maritime Coast & Aviation Ground Towers: 2 (See the full list of FCC Registered Maritime Coast & Aviation Ground Towers)
FCC Registered Amateur Radio Licenses: 695 (See the full list of FCC Registered Amateur Radio Licenses in Issaquah)
FAA Registered Aircraft Manufacturers and Dealers: 2 (See the full list of FAA Registered Manufacturers and Dealers in Issaquah)
FAA Registered Aircraft: 62 (See the full list of FAA Registered Aircraft)
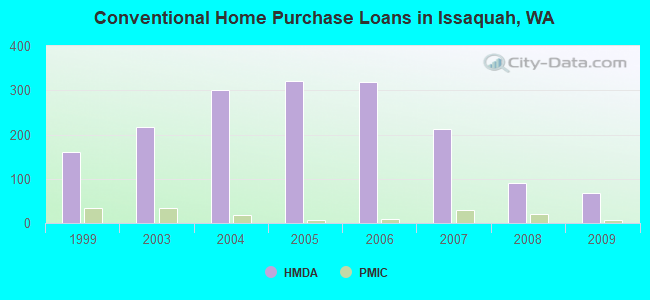
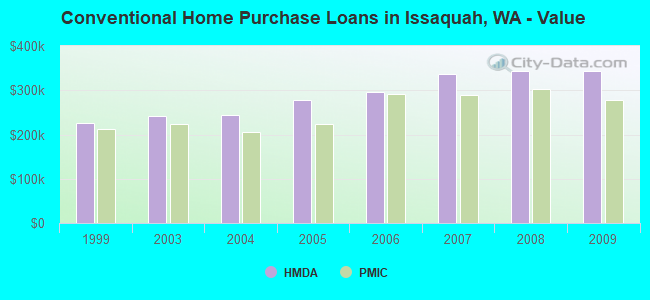
| Home Mortgage Disclosure Act Aggregated Statistics For Year 2009 (Based on 1 full and 3 partial tracts) | ||||||||||
| A) FHA, FSA/RHS & VA Home Purchase Loans | B) Conventional Home Purchase Loans | C) Refinancings | D) Home Improvement Loans | F) Non-occupant Loans on < 5 Family Dwellings (A B C & D) | ||||||
|---|---|---|---|---|---|---|---|---|---|---|
| Number | Average Value | Number | Average Value | Number | Average Value | Number | Average Value | Number | Average Value | |
| LOANS ORIGINATED | 27 | $283,276 | 67 | $343,829 | 382 | $300,435 | 11 | $171,287 | 9 | $292,534 |
| APPLICATIONS APPROVED, NOT ACCEPTED | 3 | $254,550 | 8 | $323,291 | 35 | $324,674 | 2 | $194,875 | 1 | $449,080 |
| APPLICATIONS DENIED | 6 | $312,072 | 10 | $430,240 | 69 | $362,093 | 2 | $150,315 | 5 | $344,490 |
| APPLICATIONS WITHDRAWN | 5 | $272,530 | 8 | $381,645 | 59 | $352,065 | 3 | $236,620 | 5 | $332,164 |
| FILES CLOSED FOR INCOMPLETENESS | 0 | $0 | 1 | $645,150 | 18 | $336,062 | 0 | $0 | 1 | $271,900 |
Detailed HMDA statistics for the following Tracts: 0250.03 , 0250.04, 0321.03, 0321.04
| Private Mortgage Insurance Companies Aggregated Statistics For Year 2009 (Based on 1 full and 3 partial tracts) | ||||
| A) Conventional Home Purchase Loans | B) Refinancings | |||
|---|---|---|---|---|
| Number | Average Value | Number | Average Value | |
| LOANS ORIGINATED | 7 | $278,371 | 8 | $289,762 |
| APPLICATIONS APPROVED, NOT ACCEPTED | 3 | $388,457 | 2 | $454,940 |
| APPLICATIONS DENIED | 0 | $0 | 0 | $0 |
| APPLICATIONS WITHDRAWN | 0 | $0 | 0 | $0 |
| FILES CLOSED FOR INCOMPLETENESS | 0 | $0 | 0 | $0 |
Detailed PMIC statistics for the following Tracts: 0250.03 , 0250.04, 0321.03, 0321.04
2002 - 2018 National Fire Incident Reporting System (NFIRS) incidents
- Fire incident types reported to NFIRS in Issaquah, WA
- 42238.8%Structure Fires
- 36533.6%Outside Fires
- 19517.9%Mobile Property/Vehicle Fires
- 1059.7%Other
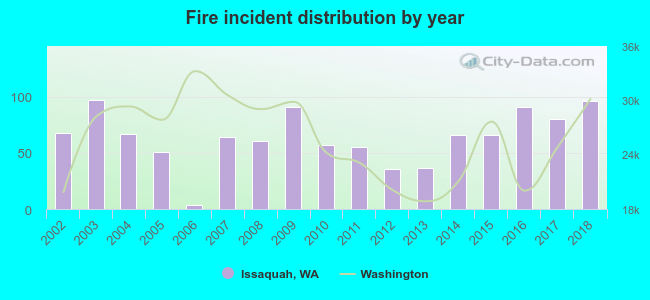 According to the data from the years 2002 - 2018 the average number of fire incidents per year is 64. The highest number of reported fires - 97 took place in 2003, and the least - 4 in 2006. The data has an increasing trend.
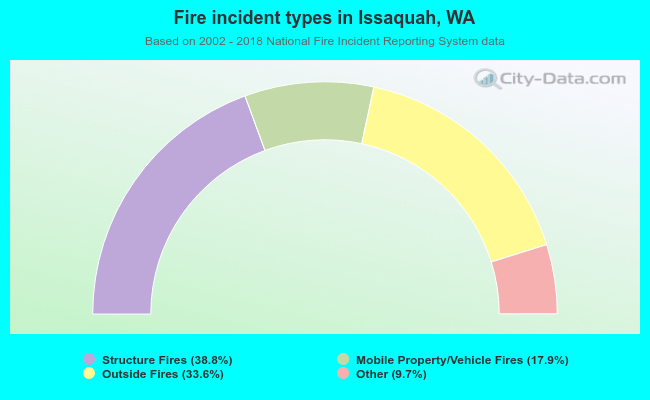 When looking into fire subcategories, the most reports belonged to: Structure Fires (38.8%), and Outside Fires (33.6%).
Fire-safe hotels and motels in Issaquah, Washington:
- Holiday Inn Seattle Issaquah, 1801 12TH Ave NW, Issaquah, Washington 98027 , Phone: (425) 392-6421, Fax: (425) 391-4650
- Hilton Garden Inn Seattle/Issaquah, 1800 NW Gilman Blvd, Issaquah, Washington 98027 , Phone: (425) 837-3600, Fax: (425) 837-3635
- Homewood Suites Seattle/Issaquah, 1484 Hyla Avenue NW, Issaquah, Washington 98027 , Phone: (800) 225-5466, Fax: (425) 391-4001
- Springhill Suitesby Marriott Seattle Issaquah, 1185 NW Maple, Issaquah, Washington 98027 , Phone: (425) 427-6000
| Most common first names in Issaquah, WA among deceased individuals | ||
| Name | Count | Lived (average) |
|---|---|---|
| John | 123 | 76.6 years |
| William | 109 | 76.7 years |
| Robert | 105 | 76.2 years |
| Mary | 99 | 79.7 years |
| James | 85 | 74.4 years |
| Helen | 74 | 82.6 years |
| George | 65 | 78.2 years |
| Charles | 61 | 77.7 years |
| Dorothy | 54 | 81.2 years |
| Margaret | 54 | 81.8 years |
| Most common last names in Issaquah, WA among deceased individuals | ||
| Last name | Count | Lived (average) |
|---|---|---|
| Johnson | 60 | 76.5 years |
| Anderson | 44 | 75.0 years |
| Smith | 34 | 78.7 years |
| Brown | 32 | 78.9 years |
| Jones | 31 | 80.9 years |
| Clark | 24 | 80.0 years |
| Hall | 21 | 78.9 years |
| Thompson | 21 | 76.9 years |
| Nelson | 20 | 76.1 years |
| Lewis | 20 | 83.2 years |
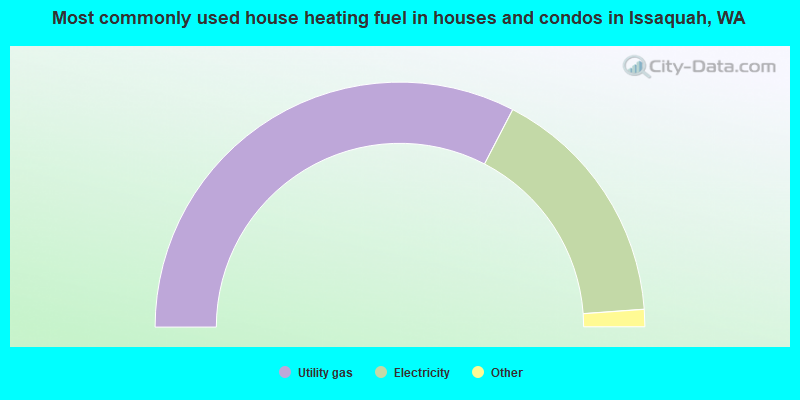
- 65.3%Utility gas
- 32.5%Electricity
- 1.2%Bottled, tank, or LP gas
- 0.5%Solar energy
- 0.4%Fuel oil, kerosene, etc.
- 0.1%Other fuel
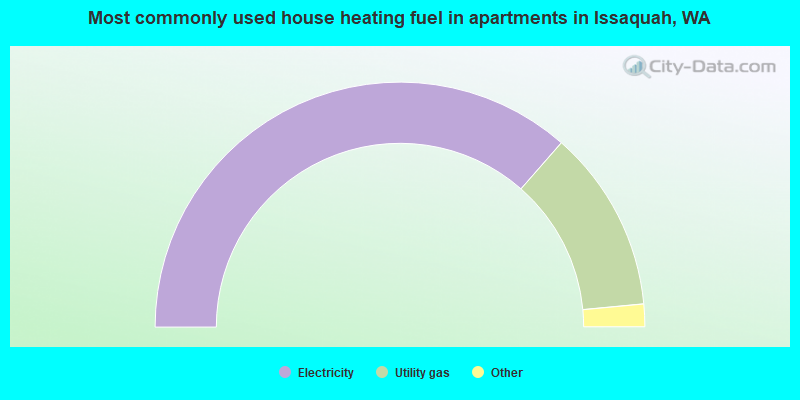
- 72.9%Electricity
- 24.1%Utility gas
- 1.0%Fuel oil, kerosene, etc.
- 0.8%Bottled, tank, or LP gas
- 0.7%No fuel used
- 0.3%Solar energy
- 0.2%Wood
Issaquah compared to Washington state average:
- Median household income above state average.
- Median house value above state average.
- Unemployed percentage significantly below state average.
- Median age above state average.
- Foreign-born population percentage significantly above state average.
- Length of stay since moving in above state average.
- House age significantly below state average.
- Number of college students above state average.
- Percentage of population with a bachelor's degree or higher significantly above state average.
Issaquah on our top lists:
- #23 on the list of "Top 101 cities with the largest percentage population increase from 2000 (population 5,000+)"
- #32 on the list of "Top 101 cities with the highest number of auto thefts per 100,000 residents, excludes tourist destinations and others with a lot of outsiders visiting based on city industries data (population 5,000+)"
- #74 on the list of "Top 101 cities with the most residents born in Hong Kong (population 500+)"
- #76 on the list of "Top 101 cities with the most people taking a ferryboat to work (population 5,000+)"
- #5 on the list of "Top 101 counties with the most Mainline Protestant congregations"
- #8 on the list of "Top 101 counties with the lowest Ozone (1-hour) air pollution readings in 2012 (ppm)"
- #9 on the list of "Top 101 counties with the most Other congregations"
- #11 on the list of "Top 101 counties with the most Mainline Protestant adherents"
- #11 on the list of "Top 101 counties with the highest percentage of residents that exercised in the past month"

|
|
Total of 4131 patent applications in 2008-2024.