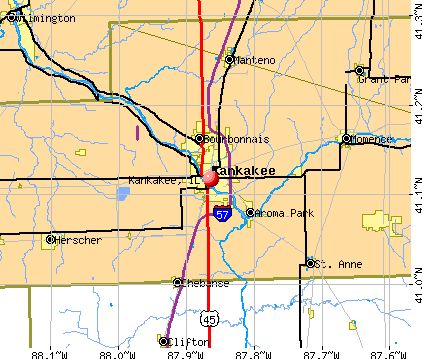
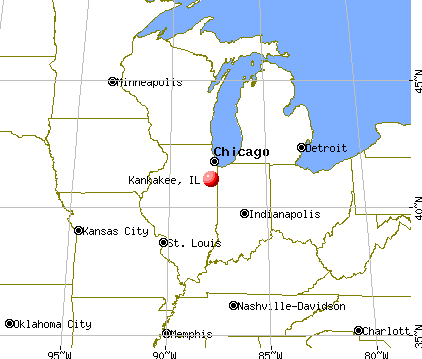
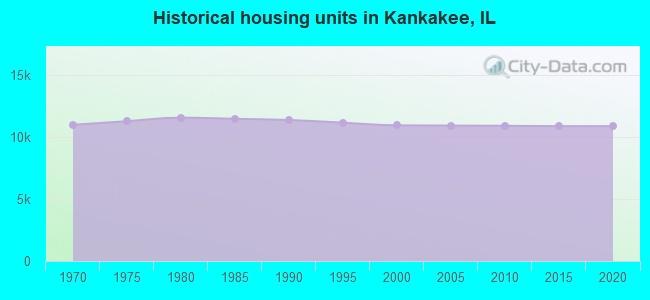
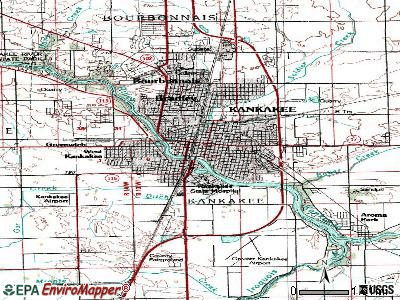
Kankakee, Illinois
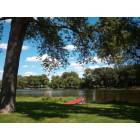
Kankakee: Kankakee River in Kankakee, IL

Kankakee: Kankakee River in Kankakee, IL
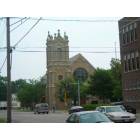
Kankakee: St Patrick's Catholic church
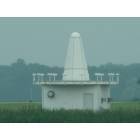
Kankakee: Kankakee VOR
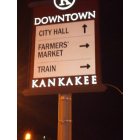
Kankakee: New signs in downtown Kankakee
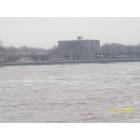
Kankakee: Kankakee Hydrolic Plant ,The Elder highrise, and the Washington St. Bridge. Kankakee,IL
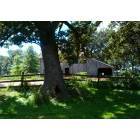
Kankakee: Barn in Kankakee, IL

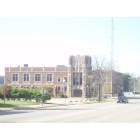
Kankakee: Kankakee Court House
Kankakee: Kankakee Police Department
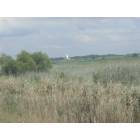
Kankakee: The Kankakee, Illinois VOR (VHF Omnidirectional Range Ground Station)
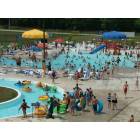
Kankakee: Splash Valley
- see
14
more - add
your
Submit your own pictures of this city and show them to the world
- OSM Map
- General Map
- Google Map
- MSN Map
Population change since 2000: -14.1%
 |
| Males: 11,583 | |
| Females: 12,019 |
| Median resident age: | 35.9 years |
| Illinois median age: | 39.1 years |
Zip codes: 60901.
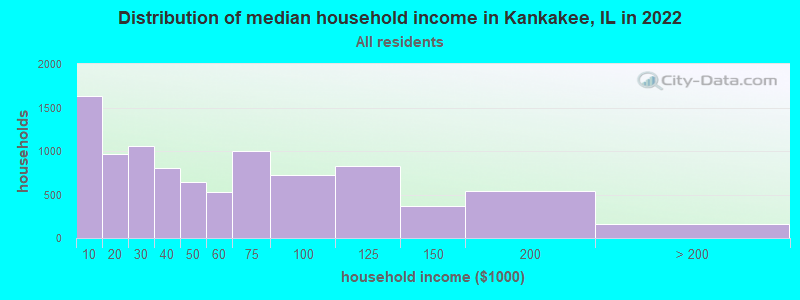
| Kankakee: | $45,997 |
| IL: | $76,708 |
Estimated per capita income in 2022: $24,423 (it was $15,479 in 2000)
Kankakee city income, earnings, and wages data
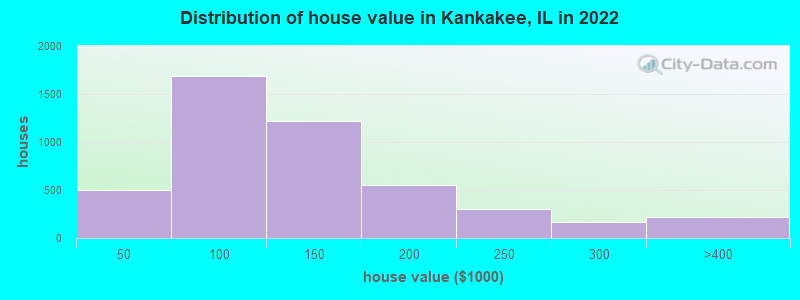
Estimated median house or condo value in 2022: $111,768 (it was $72,300 in 2000)
| Kankakee: | $111,768 |
| IL: | $251,600 |
Mean prices in 2022: all housing units: $134,564; detached houses: $134,671; townhouses or other attached units: $158,678; in 2-unit structures: $105,030; in 3-to-4-unit structures: $131,801; in 5-or-more-unit structures: $170,044; mobile homes: $14,737
Median gross rent in 2022: $951.
(16.9% for White Non-Hispanic residents, 40.2% for Black residents, 28.9% for Hispanic or Latino residents, 27.0% for other race residents, 15.1% for two or more races residents)
Detailed information about poverty and poor residents in Kankakee, IL

Compare current foreclosures in Kankakee, IL:
| Photo | Address | Area | Beds / Baths | Price | Details |
|---|---|---|---|---|---|

|
#1
S Small Ave
Kankakee, IL 60901
|
1,020 sq. feet
|
1 baths 2 beds |
show details | |

|
#2
W Vanmeter St
Kankakee, IL 60901
|
1,771 sq. feet
|
2 baths 3 beds |
show details | |

|
#3
S Curtis Ave
Kankakee, IL 60901
|
1,210 sq. feet
|
2 baths 4 beds |
show details | |

|
#4
S May Ave
Kankakee, IL 60901
|
1,120 sq. feet
|
1 baths 2 beds |
show details | |

|
#5
S 4th Ave
Kankakee, IL 60901
|
- sq. feet
|
1 baths 2 beds |
show details | |

|
#6
Strasma W Dr
Kankakee, IL 60901
|
- sq. feet
|
2 baths 4 beds |
show details | |

|
#7
S 6th Ave
Kankakee, IL 60901
|
- sq. feet
|
- baths - beds |
show details | |

|
#8
S 4th Ave
Kankakee, IL 60901
|
- sq. feet
|
- baths - beds |
show details | |

|
#9
S 10th Ave
Kankakee, IL 60901
|
- sq. feet
|
- baths - beds |
show details | |

|
#10
N Schuyler Ave Apt 1
Kankakee, IL 60901
|
- sq. feet
|
- baths - beds |
show details |
| Photo | Address | Area | Beds / Baths | Price | Details |
|---|---|---|---|---|---|

|
#11
N 9th Ave
Kankakee, IL 60901
|
- sq. feet
|
- baths - beds |
show details | |

|
#12
S 4th Ave
Kankakee, IL 60901
|
- sq. feet
|
- baths - beds |
show details | |

|
#13
S Evergreen Ave
Kankakee, IL 60901
|
- sq. feet
|
- baths - beds |
show details | |

|
#14
S 7th Ave
Kankakee, IL 60901
|
- sq. feet
|
- baths - beds |
show details | |

|
#15
Apache Path
Kankakee, IL 60901
|
- sq. feet
|
- baths - beds |
show details | |

|
#16
S 4th Ave
Kankakee, IL 60901
|
- sq. feet
|
- baths - beds |
show details | |

|
#17
E River St Apt 406
Kankakee, IL 60901
|
- sq. feet
|
- baths - beds |
show details | |

|
#18
S 6th Ave
Kankakee, IL 60901
|
- sq. feet
|
- baths - beds |
show details | |

|
#19
W Hickory St
Kankakee, IL 60901
|
- sq. feet
|
- baths - beds |
show details | |

|
#20
N Fairmont Ave
Kankakee, IL 60901
|
- sq. feet
|
- baths - beds |
show details |
| Photo | Address | Area | Beds / Baths | Price | Details |
|---|---|---|---|---|---|

|
#21
W Cypress St
Kankakee, IL 60901
|
- sq. feet
|
- baths - beds |
show details | |

|
#22
E Risser St
Kankakee, IL 60901
|
- sq. feet
|
- baths - beds |
show details | |

|
#23
N Pearl St
Kankakee, IL 60901
|
- sq. feet
|
- baths - beds |
show details | |

|
#24
S Myrtle Ave
Kankakee, IL 60901
|
- sq. feet
|
- baths - beds |
show details | |

|
#25
Country Club Dr
Kankakee, IL 60901
|
- sq. feet
|
- baths - beds |
show details | |

|
#26
S Myrtle Ave
Kankakee, IL 60901
|
- sq. feet
|
- baths - beds |
show details | |

|
#27
S State Route 115
Kankakee, IL 60901
|
- sq. feet
|
- baths - beds |
show details | |

|
#28
W Calista St
Kankakee, IL 60901
|
- sq. feet
|
- baths - beds |
show details | |

|
#29
S Rosewood Ave
Kankakee, IL 60901
|
- sq. feet
|
- baths - beds |
show details | |

|
#30
W State Route 17
Kankakee, IL 60901
|
- sq. feet
|
- baths - beds |
show details |
| Photo | Address | Area | Beds / Baths | Price | Details |
|---|---|---|---|---|---|

|
#31
N Bates Ave
Kankakee, IL 60901
|
- sq. feet
|
- baths - beds |
show details | |

|
#32
Sunset View Ln
Kankakee, IL 60901
|
- sq. feet
|
- baths - beds |
show details | |

|
#33
W Hawkins St
Kankakee, IL 60901
|
- sq. feet
|
- baths - beds |
show details | |

|
#34
W Bourbonnais St
Kankakee, IL 60901
|
- sq. feet
|
- baths - beds |
show details | |

|
#35
W Mertens St
Kankakee, IL 60901
|
- sq. feet
|
- baths - beds |
show details | |

|
#36
S Alma Ave
Kankakee, IL 60901
|
- sq. feet
|
- baths - beds |
show details | |

|
#37
W Potawatamie Trl
Kankakee, IL 60901
|
- sq. feet
|
- baths - beds |
show details | |

|
#38
S Curtis Ave
Kankakee, IL 60901
|
- sq. feet
|
- baths - beds |
show details | |

|
#39
W Grace St
Kankakee, IL 60901
|
- sq. feet
|
- baths - beds |
show details | |

|
#40
N Kennedy Dr
Kankakee, IL 60901
|
- sq. feet
|
- baths - beds |
show details |
| Photo | Address | Area | Beds / Baths | Price | Details |
|---|---|---|---|---|---|

|
#41
W Grace St
Kankakee, IL 60901
|
- sq. feet
|
- baths - beds |
show details | |

|
#42
S May Ave
Kankakee, IL 60901
|
- sq. feet
|
- baths - beds |
show details | |

|
#43
W 3000s Rd
Kankakee, IL 60901
|
- sq. feet
|
- baths - beds |
show details | |

|
#44
El Camino Dr
Kankakee, IL 60901
|
- sq. feet
|
- baths - beds |
show details | |

|
#45
W Silverado Dr
Kankakee, IL 60901
|
- sq. feet
|
- baths - beds |
show details | |

|
#46
S Curtis Ave
Kankakee, IL 60901
|
- sq. feet
|
- baths - beds |
show details | |

|
#47
Fairway Ct
Kankakee, IL 60901
|
- sq. feet
|
- baths - beds |
show details | |

|
#48
W Exore Ln
Kankakee, IL 60901
|
- sq. feet
|
- baths - beds |
show details | |

|
#49
N West Ave
Kankakee, IL 60901
|
- sq. feet
|
- baths - beds |
show details | |

|
Check over 1 million property listings on Foreclosure.com!
|
browse all offers | |||


- 9,87540.3%Black alone
- 8,33134.0%White alone
- 5,40222.1%Hispanic
- 6712.7%Two or more races
- 2611.1%Asian alone
- 210.09%American Indian alone
- 120.05%Other race alone
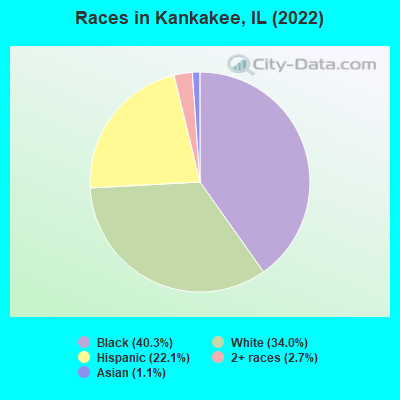
Races in Kankakee detailed stats: ancestries, foreign born residents, place of birth
According to our research of Illinois and other state lists, there were 123 registered sex offenders living in Kankakee, Illinois as of April 25, 2024.
The ratio of all residents to sex offenders in Kankakee is 212 to 1.
Type |
2009 |
2010 |
2011 |
2012 |
2013 |
2014 |
2015 |
2016 |
2017 |
2018 |
2019 |
2020 |
|---|---|---|---|---|---|---|---|---|---|---|---|---|
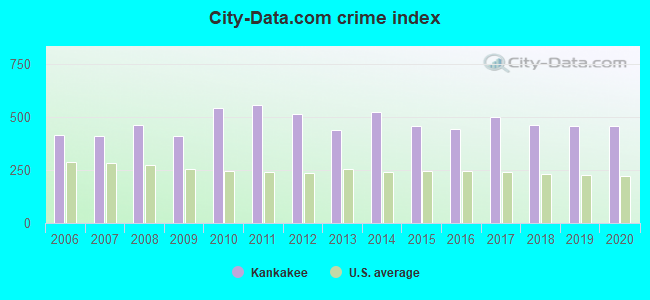
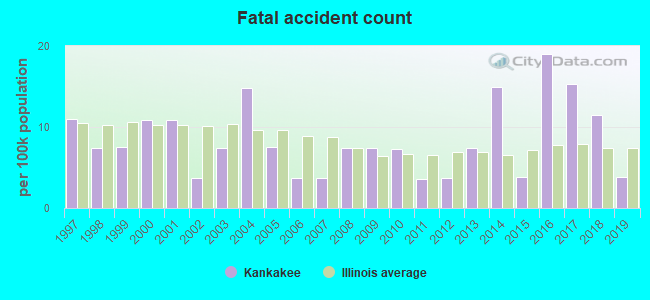
| Murders (per 100,000) | 2 (7.5) | 4 (14.5) | 4 (14.5) | 6 (21.7) | 4 (14.7) | 6 (22.2) | 3 (11.2) | 5 (18.9) | 6 (22.8) | 4 (15.4) | 4 (15.5) | 8 (30.9) |
| Rapes (per 100,000) | 0 (0.0) | 42 (152.5) | 31 (112.2) | 26 (94.2) | 23 (84.3) | 28 (103.6) | 23 (86.2) | 21 (79.2) | 35 (133.3) | 35 (134.4) | 29 (112.1) | 23 (88.9) |
| Robberies (per 100,000) | 98 (368.2) | 99 (359.5) | 110 (398.3) | 72 (260.8) | 70 (256.5) | 93 (344.1) | 67 (251.0) | 75 (282.9) | 68 (258.9) | 47 (180.5) | 53 (204.9) | 33 (127.6) |
| Assaults (per 100,000) | 103 (387.0) | 100 (363.1) | 108 (391.0) | 135 (489.0) | 99 (362.8) | 94 (347.8) | 113 (423.3) | 84 (316.9) | 101 (384.5) | 144 (553.2) | 150 (579.8) | 180 (696.0) |
| Burglaries (per 100,000) | 271 (1,018) | 339 (1,231) | 391 (1,416) | 352 (1,275) | 285 (1,044) | 292 (1,080) | 273 (1,023) | 251 (946.8) | 198 (753.9) | 143 (549.3) | 156 (603.0) | 112 (433.1) |
| Thefts (per 100,000) | 761 (2,859) | 746 (2,709) | 859 (3,110) | 812 (2,941) | 743 (2,723) | 906 (3,352) | 808 (3,027) | 748 (2,822) | 800 (3,046) | 682 (2,620) | 675 (2,609) | 651 (2,517) |
| Auto thefts (per 100,000) | 63 (236.7) | 47 (170.7) | 53 (191.9) | 46 (166.6) | 35 (128.3) | 34 (125.8) | 47 (176.1) | 49 (184.8) | 51 (194.2) | 46 (176.7) | 42 (162.3) | 52 (201.1) |
| Arson (per 100,000) | 10 (37.6) | 12 (43.6) | 16 (57.9) | 25 (90.6) | 10 (36.6) | 15 (55.5) | 19 (71.2) | 10 (37.7) | 10 (38.1) | 11 (42.3) | 6 (23.2) | 2 (7.7) |
| City-Data.com crime index | 407.5 | 539.7 | 555.3 | 515.0 | 438.6 | 519.9 | 458.1 | 443.3 | 497.0 | 460.5 | 457.6 | 457.6 |
The City-Data.com crime index weighs serious crimes and violent crimes more heavily. Higher means more crime, U.S. average is 246.1. It adjusts for the number of visitors and daily workers commuting into cities.
Crime rate in Kankakee detailed stats: murders, rapes, robberies, assaults, burglaries, thefts, arson
Full-time law enforcement employees in 2021, including police officers: 65 (57 officers - 47 male; 10 female).
| Officers per 1,000 residents here: | 2.24 |
| Illinois average: | 2.84 |
 Recent articles from our blog. Our writers, many of them Ph.D. graduates or candidates, create easy-to-read articles on a wide variety of topics.

 | Boating Question- Fox River/ChainOLakes vs Kankakee (5 replies) |
| Suburbs of Suburbs (32 replies) |
| Newly married couple looking for our first home! (52 replies) |
| South Suburban Retail News (37 replies) |
| Nicest/safest parts of Bourbonnais (6 replies) |
| Commute everywhere, live life, I’m not John Cusak (24 replies) |
Latest news from Kankakee, IL collected exclusively by city-data.com from local newspapers, TV, and radio stations
Ancestries: African (36.2%), German (7.4%), Irish (5.7%), English (1.7%), French (1.5%), American (1.4%).
Current Local Time: CST time zone
Incorporated on 04/26/1892
Elevation: 663 feet
Land area: 12.3 square miles.
Population density: 1,923 people per square mile (low).
2,707 residents are foreign born (9.7% Latin America).
| This city: | 11.1% |
| Illinois: | 14.1% |
Median real estate property taxes paid for housing units with mortgages in 2022: $3,127 (2.5%)
Median real estate property taxes paid for housing units with no mortgage in 2022: $2,384 (2.6%)
Nearest city with pop. 50,000+: Joliet, IL  (31.5 miles , pop. 106,221).
Nearest city with pop. 200,000+: Chicago, IL (51.0 miles , pop. 2,896,016).
Nearest cities:
), ), ), ), )Latitude: 41.12 N, Longitude: 87.86 W
Daytime population change due to commuting: +3,853 (+15.7%)
Workers who live and work in this city: 4,364 (44.5%)
Area code: 815
Kankakee, Illinois accommodation & food services, waste management - Economy and Business Data
Single-family new house construction building permits:
- 2022: 1 building, cost: $250,000
- 2015: 6 buildings, average cost: $141,700
- 2014: 6 buildings, average cost: $93,700
- 2013: 1 building, cost: $259,000
- 2012: 1 building, cost: $193,000
- 2011: 4 buildings, average cost: $113,500
- 2009: 11 buildings, average cost: $112,200
- 2008: 5 buildings, average cost: $156,100
- 2007: 24 buildings, average cost: $83,600
- 2006: 9 buildings, average cost: $147,800
- 2005: 7 buildings, average cost: $107,000
- 2004: 7 buildings, average cost: $100,000
- 2003: 11 buildings, average cost: $113,900
- 2002: 3 buildings, average cost: $96,700
- 2001: 6 buildings, average cost: $85,000
- 2000: 11 buildings, average cost: $85,000
- 1999: 2 buildings, average cost: $40,000
- 1998: 3 buildings, average cost: $35,300
- 1997: 1 building, cost: $87,000
| Here: | 8.6% |
| Illinois: | 4.2% |
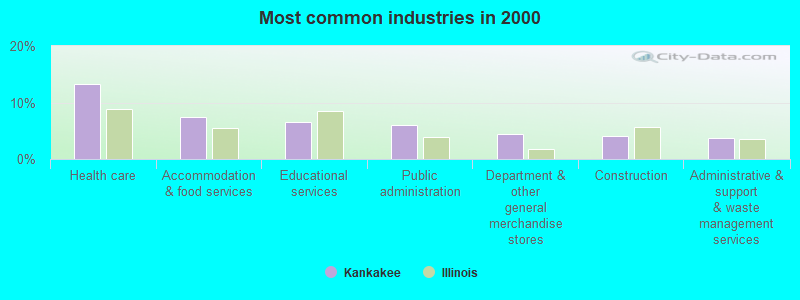
- Health care (13.3%)
- Accommodation & food services (7.3%)
- Educational services (6.5%)
- Public administration (6.0%)
- Department & other general merchandise stores (4.5%)
- Construction (4.0%)
- Administrative & support & waste management services (3.7%)
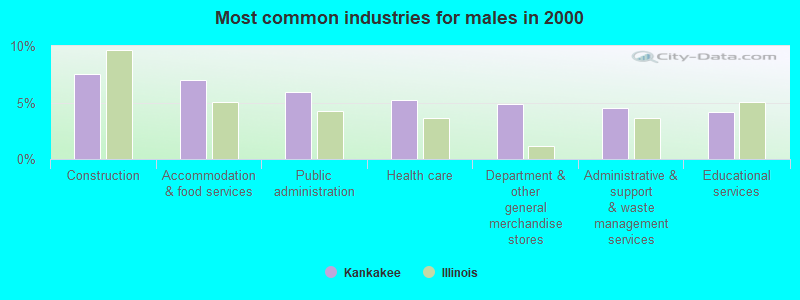
- Construction (7.5%)
- Accommodation & food services (7.0%)
- Public administration (6.0%)
- Health care (5.2%)
- Department & other general merchandise stores (4.8%)
- Administrative & support & waste management services (4.5%)
- Educational services (4.2%)
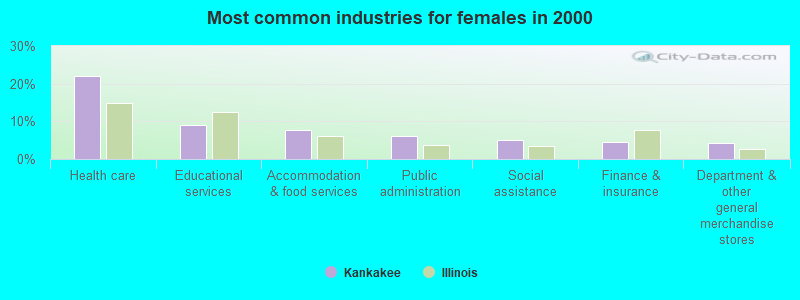
- Health care (21.9%)
- Educational services (9.0%)
- Accommodation & food services (7.8%)
- Public administration (6.0%)
- Social assistance (5.1%)
- Finance & insurance (4.5%)
- Department & other general merchandise stores (4.1%)
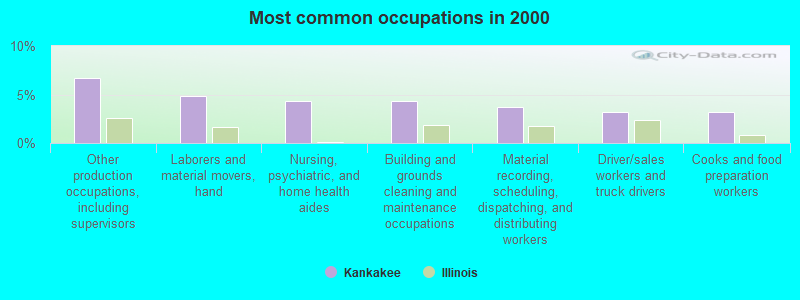
- Other production occupations, including supervisors (6.7%)
- Laborers and material movers, hand (4.8%)
- Nursing, psychiatric, and home health aides (4.4%)
- Building and grounds cleaning and maintenance occupations (4.3%)
- Material recording, scheduling, dispatching, and distributing workers (3.7%)
- Driver/sales workers and truck drivers (3.2%)
- Cooks and food preparation workers (3.1%)
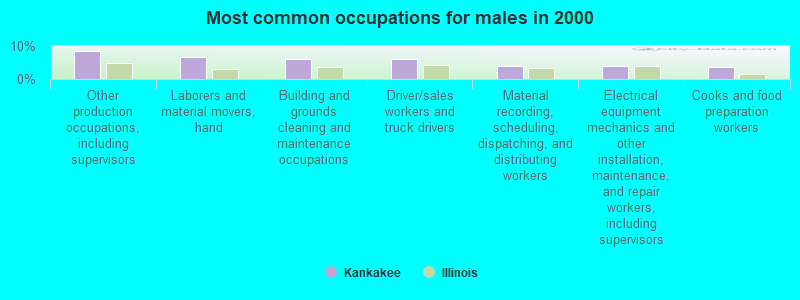
- Other production occupations, including supervisors (8.5%)
- Laborers and material movers, hand (6.8%)
- Building and grounds cleaning and maintenance occupations (6.0%)
- Driver/sales workers and truck drivers (5.9%)
- Material recording, scheduling, dispatching, and distributing workers (4.1%)
- Electrical equipment mechanics and other installation, maintenance, and repair workers, including supervisors (4.0%)
- Cooks and food preparation workers (3.5%)
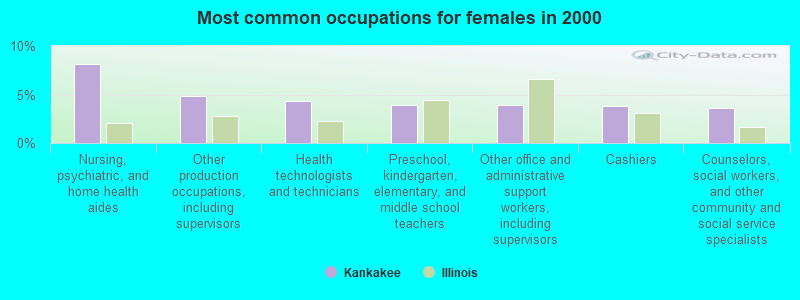
- Nursing, psychiatric, and home health aides (8.1%)
- Other production occupations, including supervisors (4.9%)
- Health technologists and technicians (4.3%)
- Preschool, kindergarten, elementary, and middle school teachers (3.9%)
- Other office and administrative support workers, including supervisors (3.9%)
- Cashiers (3.8%)
- Counselors, social workers, and other community and social service specialists (3.6%)
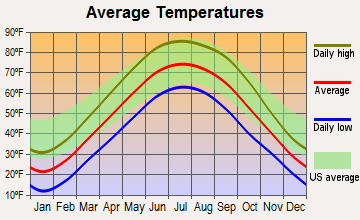
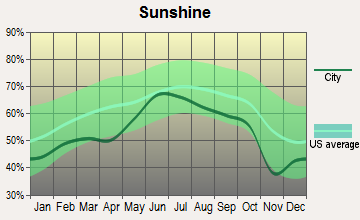
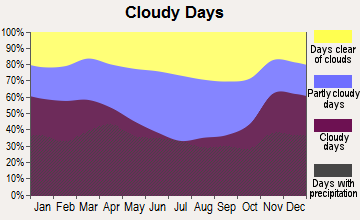
Average climate in Kankakee, Illinois
Based on data reported by over 4,000 weather stations
|
|

(lower is better)
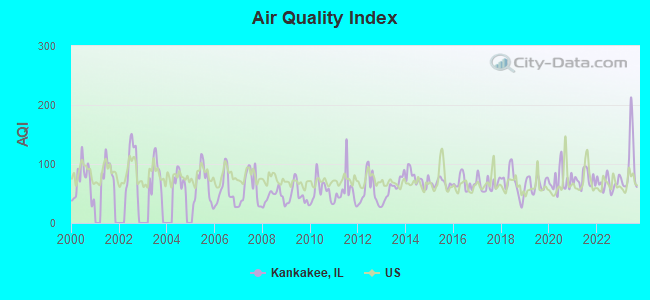
Air Quality Index (AQI) level in 2023 was 97.3. This is worse than average.
| City: | 97.3 |
| U.S.: | 72.6 |
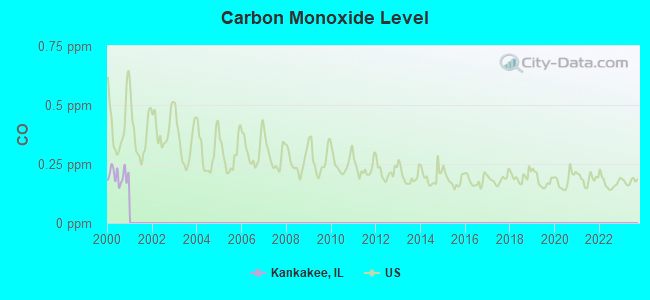
Carbon Monoxide (CO) [ppm] level in 2000 was 0.201. This is better than average. Closest monitor was 18.5 miles away from the city center.
| City: | 0.201 |
| U.S.: | 0.251 |
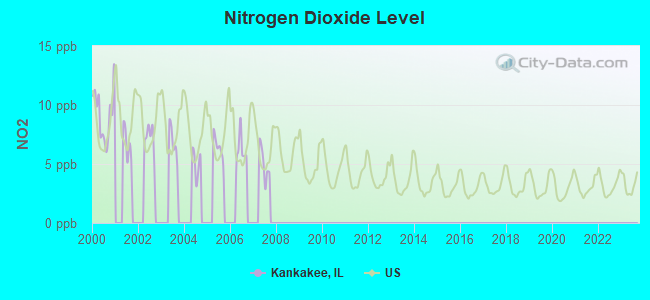
Nitrogen Dioxide (NO2) [ppb] level in 2000 was 9.21. This is significantly worse than average. Closest monitor was 18.5 miles away from the city center.
| City: | 9.21 |
| U.S.: | 5.11 |
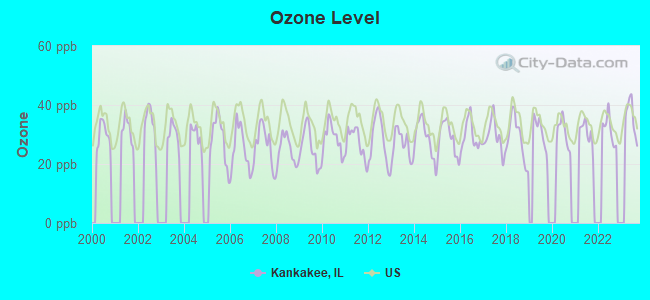
Ozone [ppb] level in 2023 was 35.9. This is about average. Closest monitor was 0.2 miles away from the city center.
| City: | 35.9 |
| U.S.: | 33.3 |
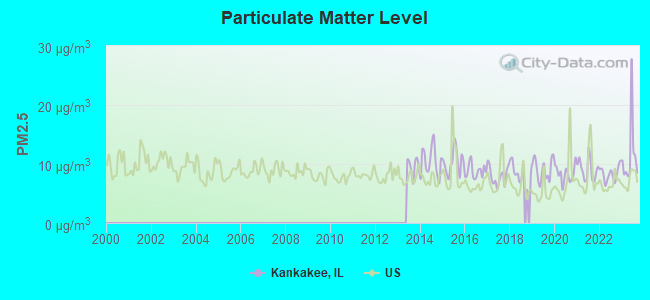
Particulate Matter (PM2.5) [µg/m3] level in 2023 was 11.5. This is significantly worse than average. Closest monitor was 18.5 miles away from the city center.
| City: | 11.5 |
| U.S.: | 8.1 |
Tornado activity:
Kankakee-area historical tornado activity is near Illinois state average. It is 76% greater than the overall U.S. average.
On 8/28/1990, a category F5 (max. wind speeds 261-318 mph) tornado 30.5 miles away from the Kankakee city center killed 29 people and injured 350 people and caused between $50,000 and $500,000 in damages.
On 4/17/1963, a category F4 (max. wind speeds 207-260 mph) tornado 13.0 miles away from the city center killed one person and injured 70 people and caused between $500,000 and $5,000,000 in damages.
Earthquake activity:
Kankakee-area historical earthquake activity is significantly above Illinois state average. It is 64% greater than the overall U.S. average.On 4/18/2008 at 09:36:59, a magnitude 5.4 (5.1 MB, 4.8 MS, 5.4 MW, 5.2 MW, Class: Moderate, Intensity: VI - VII) earthquake occurred 184.3 miles away from Kankakee center
On 6/10/1987 at 23:48:54, a magnitude 5.1 (4.9 MB, 4.4 MS, 4.6 MS, 5.1 LG) earthquake occurred 158.8 miles away from the city center
On 4/18/2008 at 09:36:59, a magnitude 5.2 (5.2 MW, Depth: 8.9 mi) earthquake occurred 184.4 miles away from the city center
On 6/18/2002 at 17:37:15, a magnitude 5.0 (4.3 MB, 4.6 MW, 5.0 LG) earthquake occurred 216.5 miles away from Kankakee center
On 6/28/2004 at 06:10:52, a magnitude 4.2 (4.2 MW, Depth: 6.2 mi, Class: Light, Intensity: IV - V) earthquake occurred 58.8 miles away from the city center
On 4/18/2008 at 15:14:16, a magnitude 4.8 (4.5 MB, 4.8 MW, 4.6 MW) earthquake occurred 182.7 miles away from the city center
Magnitude types: regional Lg-wave magnitude (LG), body-wave magnitude (MB), surface-wave magnitude (MS), moment magnitude (MW)
Natural disasters:
The number of natural disasters in Kankakee County (6) is a lot smaller than the US average (15).Major Disasters (Presidential) Declared: 2
Emergencies Declared: 3
Causes of natural disasters: Storms: 3, Flood: 1, Hurricane: 1, Snow: 1, Tornado: 1, Winter Storm: 1, Other: 1 (Note: some incidents may be assigned to more than one category).
Main business address for: CENTRUE FINANCIAL CORP (SAVINGS INSTITUTION, FEDERALLY CHARTERED).
Hospitals in Kankakee:
- DEARBORN COURT (520 SOUTH DEARBORN STREET)
- EAGLE COURT (1890 EAST EAGLE STREET)
- HUNT TERRACE (1180 SOUTH FOURTH STREET)
- KANKAKEE COURT (260 SOUTH CHICAGO AVENUE)
- PRESENCE ST MARYS HOSPITAL (Voluntary non-profit - Other, 500 W COURT ST)
- RIVER COURT (760 EAST RIVER STREET)
- RIVERSIDE MEDICAL CENTER (Voluntary non-profit - Private, 350 N WALL ST)
- STATION COURT (275 WEST STATION STREET)
Nursing Homes in Kankakee:
- KANKAKEE NURSING AND REHAB CTR (1050 JEFFREY STREET)
- MANORCARE OF KANKAKEE (900 WEST RIVER PLACE)
- MILLER HEALTH CARE CENTER (1601 BUTTERFIELD TRAIL)
- PROVENA HERITAGE VILLAGE (901 NORTH ENTRANCE AVENUE)
- SHAPIRO DEVELOPMENTAL CENTER (100 E JEFFERY ST)
Dialysis Facilities in Kankakee:
Home Health Centers in Kankakee:
Airports and heliports located in Kankakee:
- Greater Kankakee Airport (IKK) (Runways: 2, Air Taxi Ops: 1,000, Itinerant Ops: 21,000, Local Ops: 25,000, Military Ops: 3,000)
- Kankakee Airport (3KK) (Runways: 2, Itinerant Ops: 2,000, Local Ops: 9,000)
- Benoit Airport (IL78) (Runways: 1)
- Hawker Airport (12IL) (Runways: 1)
- Riverside Medical Center Heliport (10IL)
- St Mary's Hospital - Kankakee Heliport (11IL)
College/University in Kankakee:
Other colleges/universities with over 2000 students near Kankakee:
- Olivet Nazarene University (about 3 miles; Bourbonnais, IL; Full-time enrollment: 4,731)
- Governors State University (about 25 miles; University Park, IL; FT enrollment: 4,043)
- Prairie State College (about 31 miles; Chicago Heights, IL; FT enrollment: 4,050)
- University of St Francis (about 32 miles; Joliet, IL; FT enrollment: 2,454)
- Joliet Junior College (about 32 miles; Joliet, IL; FT enrollment: 11,401)
- Lewis University (about 36 miles; Romeoville, IL; FT enrollment: 5,739)
- South Suburban College (about 37 miles; South Holland, IL; FT enrollment: 3,972)
Public high schools in Kankakee:
- KANKAKEE HIGH SCHOOL (Students: 1,296, Location: 1200 W JEFFERY ST, Grades: 9-12)
- KANKAKEE AREA CO-OP DAY SCHOOL (Students: 60, Location: 1 STUART DR, Grades: 4-12)
- I KAN REGIONAL ALTERNATVE ATT CTR (Students: 37, Location: 50 W INDUSTRIAL DR, Grades: 6-12)
- SALT SCHOOL (Location: 50 W INDUSTRIAL DR, Grades: 9-12)
Private high schools in Kankakee:
Biggest public elementary/middle schools in Kankakee:
- KANKAKEE JUNIOR HIGH SCHOOL (Students: 741, Location: 2250 E CRESTWOOD ST, Grades: 7-8)
- LIMESTONE MIDDLE SCH (Students: 690, Location: 963 N 5000W RD, Grades: PK-8)
- JOHN KENNEDY MIDDLE GRADE SCHOOL (Students: 665, Location: 1550 W CALISTA ST, Grades: 3-6)
- TAFT PRIMARY SCHOOL (Students: 490, Location: 1155 W HAWKINS ST, Grades: KG-3)
- KING MIDDLE GRADE SCHOOL (Students: 488, Location: 1440 E COURT ST, Grades: 3-6)
- MARK TWAIN PRIMARY SCHOOL (Students: 449, Location: 2250 E COURT ST, Grades: PK-3)
- STEUBEN ELEMENTARY SCHOOL (Students: 331, Location: 520 S WILDWOOD AVE, Grades: KG-3)
- EDISON PRIMARY SCHOOL (Students: 288, Location: 1991 E MAPLE ST, Grades: KG-3)
- LINCOLN CLTRL CTR-MONTESSORI ELEM (Students: 267, Location: 240 WARREN AVE, Grades: KG-8)
- LAFAYETTE PRIMARY SCHOOL (Students: 255, Location: 369 N 5TH AVE, Grades: KG-3)
Private elementary/middle school in Kankakee:
Libraries in Kankakee:
- KANKAKEE PUBLIC LIBRARY (Operating income: $1,452,164; Location: 201 EAST MERCHANT STREET; 103,123 books; 1,776 audio materials; 1,682 video materials; 5 local licensed databases; 20 state licensed databases; 1 other licensed databases; 245 print serial subscriptions)
- LIMESTONE TOWNSHIP LIBRARY (Operating income: $209,482; Location: 2701 WEST TOWER ROAD; 17,108 books; 441 audio materials; 1,172 video materials; 17 state licensed databases; 1 other licensed databases; 5 print serial subscriptions)
User-submitted facts and corrections:
- Churches in Kankakee: Saint Stanislaus has been closed for over 15 years, Saint Patrick's Roman Catholic Parish was not listed along with Saint Martin's Roman Catholic Parish not listed.
Points of interest:
Notable locations in Kankakee: Kankakee Country Club (A), Kankakee Fire Department Training and Reserve Apparatus Station 2 (B), Kankakee Public Library (C), Kankakee County Courthouse (D), Shapiro Developmental Center (E), Kankakee Fire Department Station 4 (F), Kankakee Fire Department Station 3 (G), Kankakee Fire Department Station 6 (H), Kankakee Fire Department Station 5 (I). Display/hide their locations on the map
Shopping Centers: Marycrest Shopping Center (1), West Marycrest Shopping Center (2), Meadowview Shopping Center (3). Display/hide their locations on the map
Main business address in Kankakee: CENTRUE FINANCIAL CORP (A). Display/hide its location on the map
Churches in Kankakee include: Annunciation Greek Orthodox Church (A), Central Christian Church (B), Church of God (C), First Church of Christ Scientist (D), First Church of God (E), First Church of the Nazarene (F), Kingdom Hall of Jehovahs Witnesses (G), Morning Star Baptist Church (H), Our Lady of Fatima Roman Catholic Mission (I). Display/hide their locations on the map
Cemeteries: Mound Grove Cemetery (1), Mount Calvary Cemetery (2), Old State Hospital Cemetery (3), State Hospital Cemetery (4). Display/hide their locations on the map
Creeks: Soldier Creek (A), Brainard Creek (B), Gar Creek (C). Display/hide their locations on the map
Parks in Kankakee include: Pioneer Park (1), Pierson Park (2), Beckman Park (3), Bird Park (4), Snow Park (5), Cobb Park (6), Old Fair Park (7), River Road Park (8), Riverview Historic District (9). Display/hide their locations on the map
Tourist attractions: Board Machine Inc (Amusement & Theme Parks; 2006 East Maple Street), Ace Entertainment (Arcades & Amusements; 1973 East Pine Street).
Hotel: Hilton Garden Inn (455 Riverstone Parkway).
Court: Ymca - For Court Reservations (1075 North Kennedy Drive).
Birthplace of: Thomas V. Draude - CEO of Marine Corps University Foundation, Adam Kinzinger - Politician, Bruce Vaughan - Professional golfer, Charlotte Thompson Reid - Politician, Dennis Tobenski - Composer, Fred MacMurray - (1908-1991), actor, Harold Gray - Cartoonist, Jack Sikma - Basketball player-coach, John Moisant - Aviator, Mike Russow - Martial artist.
Drinking water stations with addresses in Kankakee and their reported violations in the past:
AQUA ILLINOIS-UNIVERSITY PARK (Address: 1000 S SCHUYLER AVE , Population served: 6,800, Groundwater):Past monitoring violations:AQUA ILLINOIS-SUN RIVER TERRACE (Address: 1000 S SCHUYLER AVE , Population served: 380, Groundwater):
- One minor monitoring violation
Past monitoring violations:AQUA ILLINOIS-OAKVIEW (Address: 1000 S SCHUYLER AVE , Population served: 367, Purch groundwater):
- Monitoring and Reporting (DBP) - Between JUL-2006 and SEP-2006, Contaminant: Chlorine. Follow-up actions: St Violation/Reminder Notice (AUG-14-2006), St Compliance achieved (AUG-17-2006)
- 2 regular monitoring violations
Past health violations:FRANS ON 17 (Population served: 100, Groundwater):
- MCL, Average - Between OCT-2007 and DEC-2007, Contaminant: Combined Radium (-226 and -228). Follow-up actions: St Compliance achieved (DEC-31-2007), St Public Notif requested (JAN-17-2008), St Violation/Reminder Notice (JAN-17-2008), St Public Notif received (MAR-27-2008)
- MCL, Average - Between JUL-2007 and SEP-2007, Contaminant: Combined Radium (-226 and -228). Follow-up actions: St Public Notif requested (OCT-26-2007), St Violation/Reminder Notice (OCT-26-2007), St Public Notif received (NOV-13-2007), St Compliance achieved (DEC-31-2007)
- MCL, Average - Between APR-2007 and JUN-2007, Contaminant: Combined Radium (-226 and -228). Follow-up actions: St Public Notif requested (AUG-03-2007), St Violation/Reminder Notice (AUG-03-2007), St Public Notif received (AUG-30-2007), St Compliance achieved (DEC-31-2007)
- MCL, Average - Between JAN-2007 and MAR-2007, Contaminant: Combined Radium (-226 and -228). Follow-up actions: St BCA signed (AUG-02-2004), St Intentional no-action (FEB-01-2005), St Public Notif requested (APR-24-2007), St Violation/Reminder Notice (APR-24-2007), St Public Notif received (MAY-29-2007), St Compliance achieved (DEC-31-2007)
- MCL, Average - Between OCT-2006 and DEC-2006, Contaminant: Combined Radium (-226 and -228). Follow-up actions: St BCA signed (AUG-02-2004), St Intentional no-action (FEB-01-2005), St Public Notif requested (JAN-24-2007), St Violation/Reminder Notice (JAN-24-2007), St Public Notif received (FEB-08-2007), St Compliance achieved (DEC-31-2007)
- MCL, Average - Between JUL-2006 and SEP-2006, Contaminant: Combined Radium (-226 and -228). Follow-up actions: St BCA signed (AUG-02-2004), St Intentional no-action (FEB-01-2005), St Public Notif requested (OCT-17-2006), St Violation/Reminder Notice (OCT-17-2006), St Public Notif received (NOV-02-2006), St Compliance achieved (DEC-31-2007)
- 9 other older health violations
Past health violations:ON DECK (Population served: 25, Groundwater):Past monitoring violations:
- MCL, Acute (TCR) - In JUN-2009, Contaminant: Coliform. Follow-up actions: St Compliance achieved (AUG-26-2009)
- MCL, Acute (TCR) - In APR-2009, Contaminant: Coliform. Follow-up actions: St Public Notif requested (APR-10-2009), St Boil Water Order (APR-10-2009), St Site Visit (enforcement) (APR-10-2009), St Public Notif received (APR-10-2009), St Violation/Reminder Notice (APR-10-2009), St Compliance achieved (JUN-17-2009)
- One minor monitoring violation
Past monitoring violations:
- One regular monitoring violation
Drinking water stations with addresses in Kankakee that have no violations reported:
- AQUA ILLINOIS-KANKAKEE (Address: 1000 S SCHUYLER AVE , Population served: 78,738, Primary Water Source Type: Surface water)
- AQUA ILLINOIS-WILLOWBROOK (Address: 1000 S SCHUYLER AVE , Population served: 3,422, Primary Water Source Type: Groundwater)
- AQUA ILLINOIS-VILLAGE WOODS (Address: 1000 S SCHUYLER AVE , Population served: 945, Primary Water Source Type: Groundwater)
- AQUA ILLINOIS-SKYLINE (Address: 1000 S SCHUYLER AVE , Population served: 220, Primary Water Source Type: Groundwater)
- AQUA ILLINOIS-HIGHLAND ESTATES (Address: 1000 S SCHUYLER AVE , Population served: 162, Primary Water Source Type: Groundwater)
- RIVERSIDE MEDICAL CENTER (Population served: 150, Primary Water Source Type: Groundwater)
- LIMESTONE TOWNSHIP LIBRARY (Population served: 150, Primary Water Source Type: Groundwater)
- POPPYS CLUB IRWIN (Population served: 120, Primary Water Source Type: Groundwater)
- THE OFFICE (76273) (Population served: 80, Primary Water Source Type: Groundwater)
- LIMESTONE PARK DISTRICT (Population served: 75, Primary Water Source Type: Groundwater)
| This city: | 2.7 people |
| Illinois: | 2.6 people |
| This city: | 62.2% |
| Whole state: | 65.8% |
| This city: | 9.8% |
| Whole state: | 6.3% |
Likely homosexual households (counted as self-reported same-sex unmarried-partner households)
- Lesbian couples: 0.4% of all households
- Gay men: 0.2% of all households
People in group quarters in Kankakee in 2010:
- 587 people in local jails and other municipal confinement facilities
- 564 people in residential treatment centers for adults
- 305 people in nursing facilities/skilled-nursing facilities
- 210 people in other noninstitutional facilities
- 67 people in group homes intended for adults
- 48 people in emergency and transitional shelters (with sleeping facilities) for people experiencing homelessness
- 29 people in mental (psychiatric) hospitals and psychiatric units in other hospitals
People in group quarters in Kankakee in 2000:
- 676 people in schools, hospitals, or wards for the intellectually disabled
- 302 people in nursing homes
- 140 people in local jails and other confinement facilities (including police lockups)
- 139 people in other noninstitutional group quarters
- 112 people in mental (psychiatric) hospitals or wards
- 23 people in homes for the mentally ill
- 22 people in orthopedic wards and institutions for the physically handicapped
- 21 people in homes for the mentally retarded
- 12 people in religious group quarters
Banks with most branches in Kankakee (2011 data):
- First Trust Bank of Illinois: First Trust Bank Of Illinois at 275 East Court Street, branch established on 1998/07/30; West Court Street Branch at 1500 West Court Street, branch established on 2000/09/01. Info updated 2006/11/03: Bank assets: $223.1 mil, Deposits: $175.2 mil, local headquarters, positive income, Commercial Lending Specialization, 4 total offices, Holding Company: First Trust Financial Corp.
- PNC Bank, National Association: Kankakee Dearborn Branch at 1 Dearborn Square, branch established on 1871/02/07; Dearborn Drive In Branch at 295 East Merchant, branch established on 2007/07/01. Info updated 2012/03/20: Bank assets: $263,309.6 mil, Deposits: $197,343.0 mil, headquarters in Wilmington, DE, positive income, Commercial Lending Specialization, 3085 total offices, Holding Company: Pnc Financial Services Group, Inc., The
- Peoples Bank of Kankakee County: Kankakee Branch at 333 East Court Street, branch established on 2005/01/18. Info updated 2006/11/03: Bank assets: $187.9 mil, Deposits: $159.8 mil, headquarters in Bourbonnais, IL, positive income, Commercial Lending Specialization, 2 total offices, Holding Company: Romy Hammes, Inc.
- State Bank of Herscher: Kankakee Branch at 5053 West Route 17, branch established on 2003/07/28. Info updated 2012/02/10: Bank assets: $193.8 mil, Deposits: $177.0 mil, headquarters in Herscher, IL, negative income in the last year, Commercial Lending Specialization, 2 total offices, Holding Company: Hershare Financial Corporation
- Woodforest National Bank: Kankakee Walmart Branch at 505 Riverstone Parkway, branch established on 2008/02/04. Info updated 2011/05/10: Bank assets: $3,488.9 mil, Deposits: $3,097.6 mil, headquarters in Houston, TX, positive income, Commercial Lending Specialization, 766 total offices, Holding Company: Woodforest Financial Group Employee Stock Ownership Plan (With 401(K) Provisions)
- First American Bank: Kankakee Branch at 101 Meadowview Center, branch established on 1962/08/10. Info updated 2010/01/19: Bank assets: $2,710.6 mil, Deposits: $2,213.4 mil, headquarters in Elk Grove Village, IL, negative income in the last year, Commercial Lending Specialization, 50 total offices, Holding Company: First American Bank Corporation
- Fifth Third Bank: Kanakee Bm Branch at 1200 N. Kennedy Dr., branch established on 2007/12/17. Info updated 2009/10/05: Bank assets: $114,540.4 mil, Deposits: $89,689.1 mil, headquarters in Cincinnati, OH, positive income, Commercial Lending Specialization, 1378 total offices, Holding Company: Fifth Third Bancorp
- Crescent Bank & Trust: , New Orleans, Louisiana Loan Production Office at 1 Dearborn Square, Suite 655, branch established on 2010/10/07. Info updated 2006/11/03: Bank assets: $624.5 mil, Deposits: $542.4 mil, headquarters in New Orleans, LA, positive income, Consumer Lending Specialization, 27 total offices, Holding Company: Cb&T Holding Corporation
- MainSource Bank: Mainsource Bank Of Illinois Branch at 2000 West Court Street, branch established on 1962/11/13. Info updated 2009/12/09: Bank assets: $2,729.1 mil, Deposits: $2,167.0 mil, headquarters in Greensburg, IN, positive income, 86 total offices, Holding Company: Mainsource Financial Group, Inc.
- 2 other banks with 2 local branches
For population 15 years and over in Kankakee:
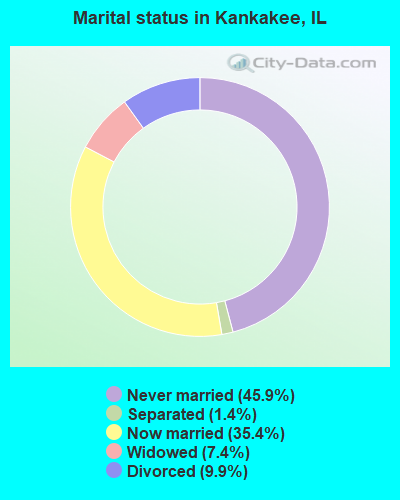
- Never married: 45.9%
- Now married: 35.4%
- Separated: 1.4%
- Widowed: 7.4%
- Divorced: 9.9%
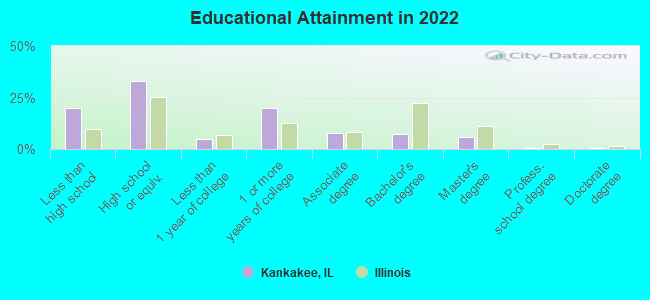
For population 25 years and over in Kankakee:
- High school or higher: 78.7%
- Bachelor's degree or higher: 13.1%
- Graduate or professional degree: 5.7%
- Unemployed: 10.0%
- Mean travel time to work (commute): 21.0 minutes
| Here: | 12.9 |
| Illinois average: | 12.5 |
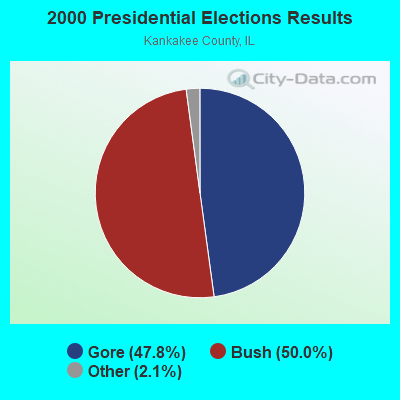
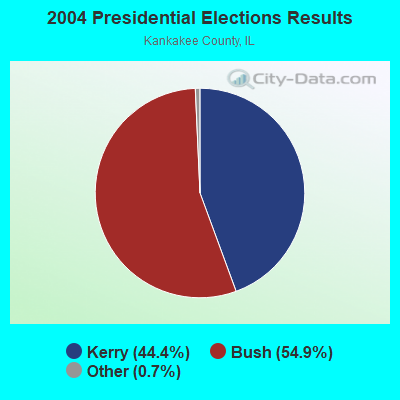
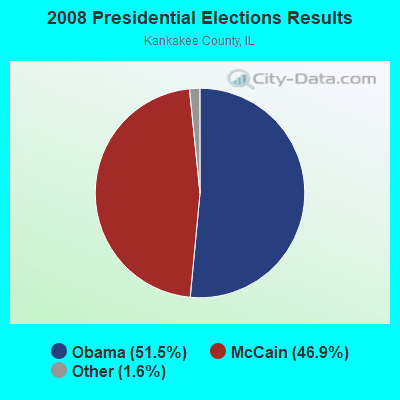
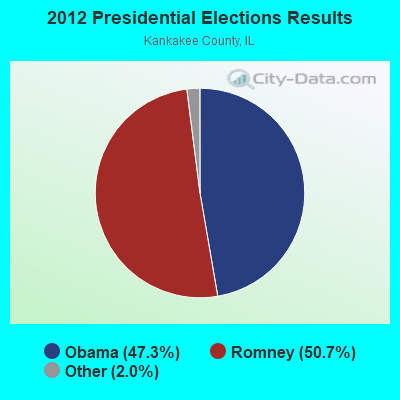
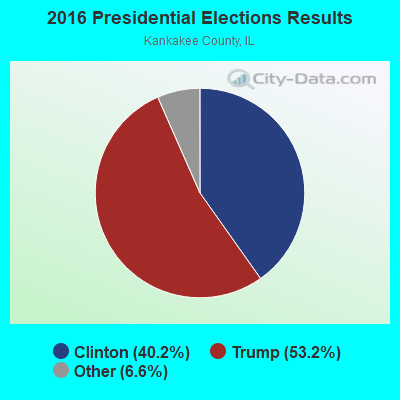
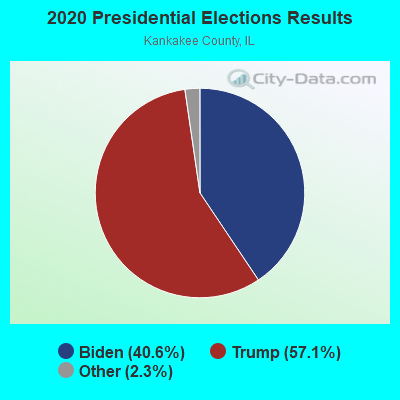
Graphs represent county-level data. Detailed 2008 Election Results
Religion statistics for Kankakee, IL (based on Kankakee County data)
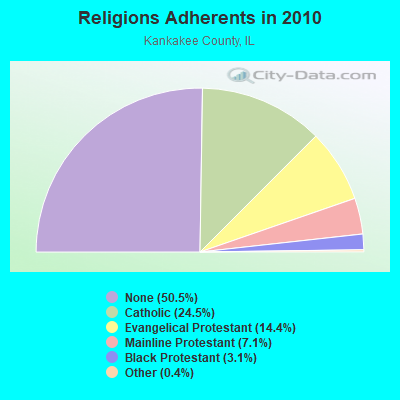
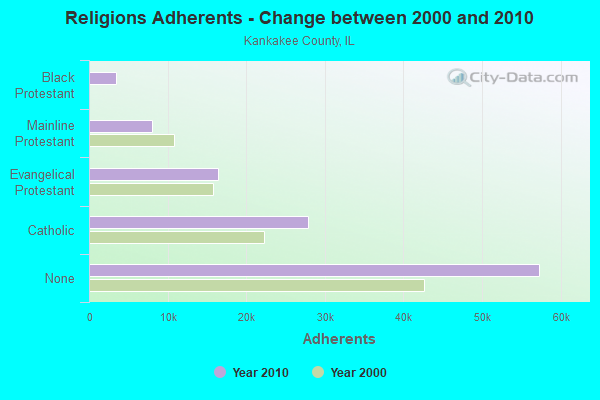
| Religion | Adherents | Congregations |
|---|---|---|
| Catholic | 27,840 | 18 |
| Evangelical Protestant | 16,364 | 67 |
| Mainline Protestant | 8,003 | 37 |
| Black Protestant | 3,480 | 9 |
| Other | 400 | 3 |
| Orthodox | 60 | 1 |
| None | 57,302 | - |
Food Environment Statistics:
| Kankakee County: | 2.15 / 10,000 pop. |
| Illinois: | 2.24 / 10,000 pop. |
| Kankakee County: | 0.09 / 10,000 pop. |
| State: | 0.08 / 10,000 pop. |
| Kankakee County: | 0.18 / 10,000 pop. |
| Illinois: | 0.75 / 10,000 pop. |
| This county: | 3.50 / 10,000 pop. |
| Illinois: | 2.61 / 10,000 pop. |
| Kankakee County: | 5.65 / 10,000 pop. |
| Illinois: | 6.86 / 10,000 pop. |
| Kankakee County: | 9.0% |
| Illinois: | 8.3% |
| This county: | 28.7% |
| Illinois: | 25.2% |
| Here: | 12.6% |
| Illinois: | 14.5% |
Health and Nutrition:
| Kankakee: | 46.8% |
| Illinois: | 49.5% |
| Here: | 43.0% |
| Illinois: | 47.2% |
| Here: | 29.2 |
| State: | 28.6 |
| Kankakee: | 21.5% |
| Illinois: | 20.5% |
| This city: | 12.3% |
| Illinois: | 10.8% |
| Kankakee: | 6.7 |
| Illinois: | 6.8 |
| This city: | 33.5% |
| Illinois: | 33.4% |
| Kankakee: | 52.9% |
| Illinois: | 56.4% |
| Kankakee: | 79.4% |
| Illinois: | 79.9% |
More about Health and Nutrition of Kankakee, IL Residents
| Local government employment and payroll (March 2022) | |||||
| Function | Full-time employees | Monthly full-time payroll | Average yearly full-time wage | Part-time employees | Monthly part-time payroll |
|---|---|---|---|---|---|
| Police Protection - Officers | 60 | $500,090 | $100,018 | 3 | $3,320 |
| Firefighters | 46 | $334,740 | $87,323 | 0 | $0 |
| Solid Waste Management | 27 | $166,116 | $73,829 | 0 | $0 |
| Sewerage | 16 | $114,955 | $86,216 | 0 | $0 |
| Local Libraries | 15 | $51,159 | $40,927 | 15 | $14,167 |
| Other Government Administration | 11 | $54,474 | $59,426 | 0 | $0 |
| Housing and Community Development (Local) | 10 | $45,486 | $54,583 | 0 | $0 |
| Other and Unallocable | 9 | $35,351 | $47,135 | 0 | $0 |
| Financial Administration | 5 | $30,661 | $73,586 | 0 | $0 |
| Police - Other | 4 | $16,377 | $49,131 | 9 | $4,012 |
| Fire - Other | 2 | $8,286 | $49,716 | 0 | $0 |
| Streets and Highways | 2 | $20,929 | $125,574 | 0 | $0 |
| Judicial and Legal | 2 | $8,173 | $49,038 | 0 | $0 |
| Totals for Government | 209 | $1,386,796 | $79,625 | 27 | $21,499 |
Kankakee government finances - Expenditure in 2021 (per resident):
- Construction - General - Other: $599,000 ($25.38)
Central Staff Services: $548,000 ($23.22)
Regular Highways: $169,000 ($7.16)
Local Fire Protection: $106,000 ($4.49)
Financial Administration: $4,000 ($0.17)
- Current Operations - General - Other: $14,100,000 ($597.41)
Police Protection: $11,146,000 ($472.25)
Local Fire Protection: $8,053,000 ($341.20)
Regular Highways: $6,979,000 ($295.70)
Financial Administration: $5,826,000 ($246.84)
Protective Inspection and Regulation - Other: $1,983,000 ($84.02)
Libraries: $1,925,000 ($81.56)
Housing and Community Development: $349,000 ($14.79)
Central Staff Services: $59,000 ($2.50)
Parks and Recreation: $18,000 ($0.76)
- General - Interest on Debt: $5,865,000 ($248.50)
- Other Capital Outlay - Solid Waste Management: $14,011,000 ($593.64)
Central Staff Services: $951,000 ($40.29)
- Total Salaries and Wages: $18,194,000 ($770.87)
Kankakee government finances - Revenue in 2021 (per resident):
- Charges - Sewerage: $16,363,000 ($693.29)
Solid Waste Management: $2,909,000 ($123.25)
Other: $1,384,000 ($58.64)
Parks and Recreation: $200,000 ($8.47)
- Federal Intergovernmental - Housing and Community Development: $3,012,000 ($127.62)
Public Welfare: $496,000 ($21.02)
- Local Intergovernmental - Other: $40,000 ($1.69)
- Miscellaneous - General Revenue - Other: $1,042,000 ($44.15)
Fines and Forfeits: $337,000 ($14.28)
Interest Earnings: $78,000 ($3.30)
- State Intergovernmental - General Local Government Support: $10,251,000 ($434.33)
Highways: $1,044,000 ($44.23)
Other: $18,000 ($0.76)
- Tax - Property: $18,265,000 ($773.88)
Public Utilities Sales: $3,889,000 ($164.77)
Other License: $1,688,000 ($71.52)
Other Selective Sales: $1,481,000 ($62.75)
Kankakee government finances - Debt in 2021 (per resident):
- Long Term Debt - Beginning Outstanding - Unspecified Public Purpose: $136,524,000 ($5784.43)
Outstanding Unspecified Public Purpose: $124,736,000 ($5284.98)
Retired Unspecified Public Purpose: $11,788,000 ($499.45)
Kankakee government finances - Cash and Securities in 2021 (per resident):
- Other Funds - Cash and Securities: $30,419,000 ($1288.83)
| Businesses in Kankakee, IL | ||||
| Name | Count | Name | Count | |
|---|---|---|---|---|
| ALDI | 1 | KFC | 1 | |
| Ace Hardware | 1 | La-Z-Boy | 1 | |
| Advance Auto Parts | 1 | Little Caesars Pizza | 1 | |
| AutoZone | 1 | McDonald's | 2 | |
| Blockbuster | 1 | New Balance | 1 | |
| Brunswick Bowling & Billiards | 1 | Penske | 1 | |
| Burger King | 1 | RadioShack | 1 | |
| CVS | 1 | Subway | 3 | |
| Circle K | 2 | T-Mobile | 2 | |
| ColorTyme | 1 | Taco Bell | 1 | |
| Dairy Queen | 2 | U-Haul | 3 | |
| Domino's Pizza | 2 | U.S. Cellular | 1 | |
| Dunkin Donuts | 1 | UPS | 6 | |
| FedEx | 5 | Walgreens | 3 | |
| H&R Block | 1 | Walmart | 1 | |
| Jewel-Osco | 1 | Wendy's | 1 | |
| Jimmy John's | 1 | YMCA | 1 | |
| Jones New York | 1 | |||
Strongest AM radio stations in Kankakee:
- WKAN (1320 AM; 1 kW; KANKAKEE, IL; Owner: STARADIO CORPORATION)
- WLS (890 AM; 50 kW; CHICAGO, IL; Owner: WLS, INC.)
- WYLL (1160 AM; 50 kW; CHICAGO, IL; Owner: SCA LICENSE CORPORATION)
- WSCR (670 AM; 50 kW; CHICAGO, IL; Owner: INFINITY BROADCASTING OPERATIONS, INC.)
- WMVP (1000 AM; 50 kW; CHICAGO, IL; Owner: ABC, INC.)
- WGN (720 AM; 50 kW; CHICAGO, IL; Owner: WGN CONTINENTAL BROADCASTING CO.)
- WBBM (780 AM; 50 kW; CHICAGO, IL; Owner: INFINITY BROADCASTING OPERATIONS, INC.)
- WVIV (1200 AM; 20 kW; CHICAGO, IL; Owner: WLXX-AM LICENSE CORP.)
- WTMJ (620 AM; 50 kW; MILWAUKEE, WI; Owner: JOURNAL BROADCAST CORPORATION)
- WIND (560 AM; 5 kW; CHICAGO, IL; Owner: TICHENOR LICENSE CORPORATION ("TLC"))
- WIBC (1070 AM; 50 kW; INDIANAPOLIS, IN; Owner: EMMIS RADIO LICENSE CORPORATION)
- WISN (1130 AM; 50 kW; MILWAUKEE, WI; Owner: CAPSTAR TX LIMITED PARTNERSHIP)
- WNTD (950 AM; 5 kW; CHICAGO, IL; Owner: RADIO UNICA OF CHICAGO LICENSE CORP.)
Strongest FM radio stations in Kankakee:
- WKIF (92.7 FM; KANKAKEE, IL; Owner: SPANISH BROADCASTING SYSTEM OF ILLINOIS, INC.)
- WONU (89.7 FM; KANKAKEE, IL; Owner: OLIVET NAZARENE UNIVERSITY)
- WKCC (91.1 FM; KANKAKEE, IL; Owner: KANKAKEE COMMUNITY COLLEGE)
- WAWF (88.3 FM; KANKAKEE, IL; Owner: AMERICAN FAMILY ASSOCIATION)
- WVLI (95.1 FM; KANKAKEE, IL; Owner: MILNER BROADCASTING COMPANY)
- W205AZ (88.9 FM; KANKAKEE, IL; Owner: PENSACOLA CHRISTIAN COLLEGE, INC.)
- WRZA (99.9 FM; PARK FOREST, IL; Owner: ENTRAVISION HOLDINGS, LLC)
- WYBA (102.3 FM; CRETE, IL; Owner: DONTRON INC.)
- WCKG (105.9 FM; ELMWOOD PARK, IL; Owner: INFINITY HOLDINGS CORPORATION OF ORLANDO)
- WLIT-FM (93.9 FM; CHICAGO, IL; Owner: AMFM RADIO LICENSES, L.L.C.)
- WJMK (104.3 FM; CHICAGO, IL; Owner: INFINITY BROADCASTING CORP. OF ILLINOIS)
- WNUA (95.5 FM; CHICAGO, IL; Owner: AMFM RADIO LICENSES, L.L.C.)
- WTMX (101.9 FM; SKOKIE, IL; Owner: BONNEVILLE HOLDING COMPANY)
- WBBM-FM (96.3 FM; CHICAGO, IL; Owner: INFINITY BROADCASTING OPERATIONS, INC.)
- WKSC-FM (103.5 FM; CHICAGO, IL; Owner: AMFM RADIO LICENSES, L.L.C.)
- WFMT (98.7 FM; CHICAGO, IL; Owner: WINDOW TO THE WORLD COMMUNICATIONS)
- WGCI-FM (107.5 FM; CHICAGO, IL; Owner: AMFM RADIO LICENSES, L.L.C.)
- WZZN (94.7 FM; CHICAGO, IL; Owner: ABC CHICAGO FM RADIO,INC.)
- WYKT (105.5 FM; WILMINGTON, IL; Owner: STARADIO CORPORATION)
- WRXQ (100.7 FM; COAL CITY, IL; Owner: NM LICENSING, LLC)
TV broadcast stations around Kankakee:
- WYIN (Channel 56; GARY, IN; Owner: NORTHWEST INDIANA PUBLIC BROADCASTING, INC.)
- WLS-TV (Channel 7; CHICAGO, IL; Owner: WLS TELEVISION, INC.)
- WMAQ-TV (Channel 5; CHICAGO, IL; Owner: NBC SUBSIDIARY (WMAQ-TV), INC.)
- W34CD (Channel 34; QUINCY, IL; Owner: MS COMMUNICATIONS, LLC)
- WTTW (Channel 11; CHICAGO, IL; Owner: WINDOW TO THE WORLD COMMUNICATIONS, INC.)
- WGN-TV (Channel 9; CHICAGO, IL; Owner: WGN CONTINENTAL BROADCASTING COMPANY)
- WGBO-TV (Channel 66; JOLIET, IL; Owner: WGBO LICENSE PARTNERSHIP, G.P.)
- WPWR-TV (Channel 50; GARY, IN; Owner: FOX TELEVISION STATIONS, INC.)
- WXFT (Channel 60; AURORA, IL; Owner: TELEFUTURA CHICAGO LLC)
- WCIU-TV (Channel 26; CHICAGO, IL; Owner: WCIU-TV LIMITED PARTNERSHIP)
- WCPX (Channel 38; CHICAGO, IL; Owner: PAXSON CHICAGO LICENSE, INC.)
- WFLD (Channel 32; CHICAGO, IL; Owner: FOX TELEVISION STATIONS, INC.)
- W68DO (Channel 68; PALATINE, IL; Owner: TRINITY BROADCASTING NETWORK)
- WFBT-CA (Channel 23; CHICAGO, IL; Owner: CHANNEL 23 LIMITED PARTNERSHIP)
- WSNS-TV (Channel 44; CHICAGO, IL; Owner: TELEMUNDO OF CHICAGO, INC.)
- WJYS (Channel 62; HAMMOND, IN; Owner: JOVON BROADCASTING CORPORATION)
- National Bridge Inventory (NBI) Statistics
- 54Number of bridges
- 755ft / 230mTotal length
- $20,244,000Total costs
- 525,960Total average daily traffic
- 100,588Total average daily truck traffic
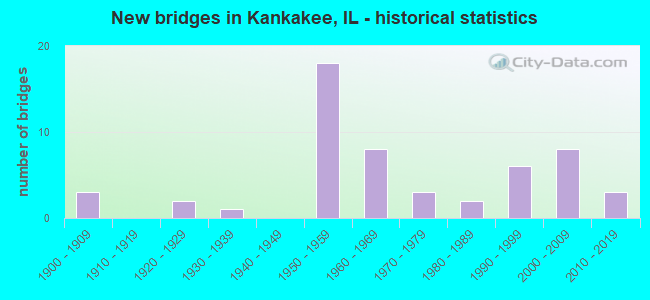
- New bridges - historical statistics
- 31900-1909
- 21920-1929
- 11930-1939
- 181950-1959
- 81960-1969
- 31970-1979
- 21980-1989
- 61990-1999
- 82000-2009
- 32010-2019
FCC Registered Antenna Towers: 188 (See the full list of FCC Registered Antenna Towers)
FCC Registered Commercial Land Mobile Towers: 3 (See the full list of FCC Registered Commercial Land Mobile Towers in Kankakee, IL)
FCC Registered Private Land Mobile Towers: 2 (See the full list of FCC Registered Private Land Mobile Towers)
FCC Registered Broadcast Land Mobile Towers: 42 (See the full list of FCC Registered Broadcast Land Mobile Towers)
FCC Registered Microwave Towers: 65 (See the full list of FCC Registered Microwave Towers in this town)
FCC Registered Paging Towers: 6 (See the full list of FCC Registered Paging Towers)
FCC Registered Maritime Coast & Aviation Ground Towers: 4 (See the full list of FCC Registered Maritime Coast & Aviation Ground Towers)
FCC Registered Amateur Radio Licenses: 93 (See the full list of FCC Registered Amateur Radio Licenses in Kankakee)
FAA Registered Aircraft Manufacturers and Dealers: 4 (See the full list of FAA Registered Manufacturers and Dealers in Kankakee)
FAA Registered Aircraft: 38 (See the full list of FAA Registered Aircraft)
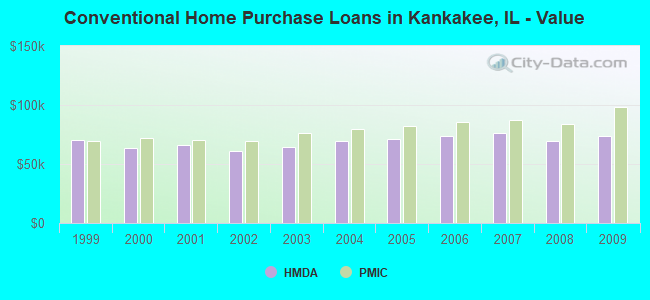
| Home Mortgage Disclosure Act Aggregated Statistics For Year 2009 (Based on 3 full and 7 partial tracts) | ||||||||||||
| A) FHA, FSA/RHS & VA Home Purchase Loans | B) Conventional Home Purchase Loans | C) Refinancings | D) Home Improvement Loans | F) Non-occupant Loans on < 5 Family Dwellings (A B C & D) | G) Loans On Manufactured Home Dwelling (A B C & D) | |||||||
|---|---|---|---|---|---|---|---|---|---|---|---|---|
| Number | Average Value | Number | Average Value | Number | Average Value | Number | Average Value | Number | Average Value | Number | Average Value | |
| LOANS ORIGINATED | 50 | $95,596 | 87 | $74,037 | 282 | $91,421 | 40 | $35,668 | 93 | $56,672 | 0 | $0 |
| APPLICATIONS APPROVED, NOT ACCEPTED | 3 | $111,283 | 5 | $92,134 | 36 | $84,832 | 6 | $33,782 | 5 | $42,474 | 0 | $0 |
| APPLICATIONS DENIED | 11 | $121,478 | 32 | $63,511 | 129 | $88,912 | 37 | $34,579 | 23 | $52,690 | 1 | $41,250 |
| APPLICATIONS WITHDRAWN | 1 | $101,940 | 4 | $213,242 | 68 | $101,135 | 4 | $25,898 | 6 | $86,237 | 0 | $0 |
| FILES CLOSED FOR INCOMPLETENESS | 2 | $103,800 | 2 | $85,165 | 6 | $119,345 | 1 | $15,000 | 1 | $60,000 | 0 | $0 |
Detailed mortgage data for all 10 tracts in Kankakee, IL
| Private Mortgage Insurance Companies Aggregated Statistics For Year 2009 (Based on 2 full and 7 partial tracts) | ||||||
| A) Conventional Home Purchase Loans | B) Refinancings | C) Non-occupant Loans on < 5 Family Dwellings (A & B) | ||||
|---|---|---|---|---|---|---|
| Number | Average Value | Number | Average Value | Number | Average Value | |
| LOANS ORIGINATED | 11 | $98,644 | 11 | $108,372 | 0 | $0 |
| APPLICATIONS APPROVED, NOT ACCEPTED | 4 | $99,245 | 7 | $100,637 | 1 | $84,980 |
| APPLICATIONS DENIED | 0 | $0 | 2 | $133,325 | 0 | $0 |
| APPLICATIONS WITHDRAWN | 2 | $55,000 | 2 | $129,625 | 0 | $0 |
| FILES CLOSED FOR INCOMPLETENESS | 1 | $128,320 | 0 | $0 | 0 | $0 |
2002 - 2018 National Fire Incident Reporting System (NFIRS) incidents
- Fire incident types reported to NFIRS in Kankakee, IL
- 2,44149.4%Structure Fires
- 1,64933.4%Outside Fires
- 70914.4%Mobile Property/Vehicle Fires
- 1382.8%Other
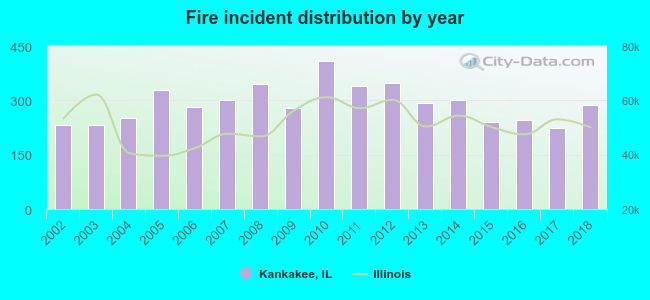 According to the data from the years 2002 - 2018 the average number of fires per year is 290. The highest number of fire incidents - 408 took place in 2010, and the least - 223 in 2017. The data has a rising trend.
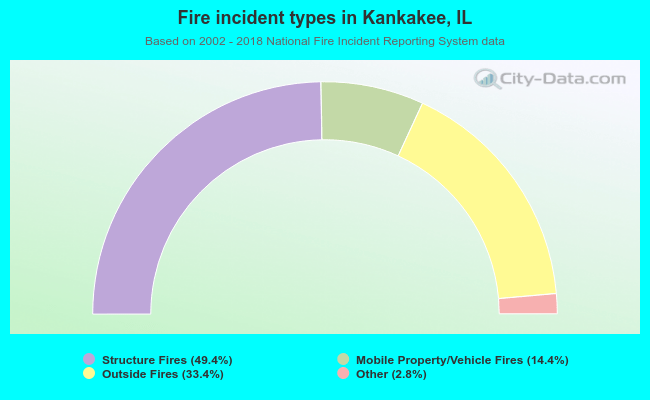 When looking into fire subcategories, the most reports belonged to: Structure Fires (49.4%), and Outside Fires (33.4%).
Fire-safe hotels and motels in Kankakee, Illinois:
- Avis Motel, 1225 E Court St, Kankakee, Illinois 60901 , Phone: (815) 933-1717
- Model Motel, 1245 S Washington Ave, Kankakee, Illinois 60901 , Phone: (815) 932-5013
- Knights Inn Motel, 1786 S Rt 45 At 52, Kankakee, Illinois 60901 , Phone: (815) 939-4551
- Hilton Garden Inn-Kankakee, 455 Riverstone Pkwy, Kankakee, Illinois 60901 , Phone: (815) 932-4444, Fax: (815) 932-9540
| Most common first names in Kankakee, IL among deceased individuals | ||
| Name | Count | Lived (average) |
|---|---|---|
| John | 620 | 74.0 years |
| William | 582 | 74.3 years |
| Mary | 536 | 78.7 years |
| James | 476 | 70.6 years |
| Robert | 452 | 69.1 years |
| Charles | 356 | 72.7 years |
| Joseph | 310 | 73.8 years |
| George | 308 | 73.4 years |
| Edward | 278 | 75.4 years |
| Dorothy | 238 | 76.7 years |
| Most common last names in Kankakee, IL among deceased individuals | ||
| Last name | Count | Lived (average) |
|---|---|---|
| Smith | 284 | 73.1 years |
| Johnson | 218 | 73.3 years |
| Williams | 172 | 67.0 years |
| Jones | 164 | 70.2 years |
| Anderson | 136 | 75.4 years |
| Miller | 132 | 75.6 years |
| Brown | 116 | 72.6 years |
| Jackson | 108 | 67.7 years |
| Davis | 106 | 68.4 years |
| Martin | 96 | 70.9 years |
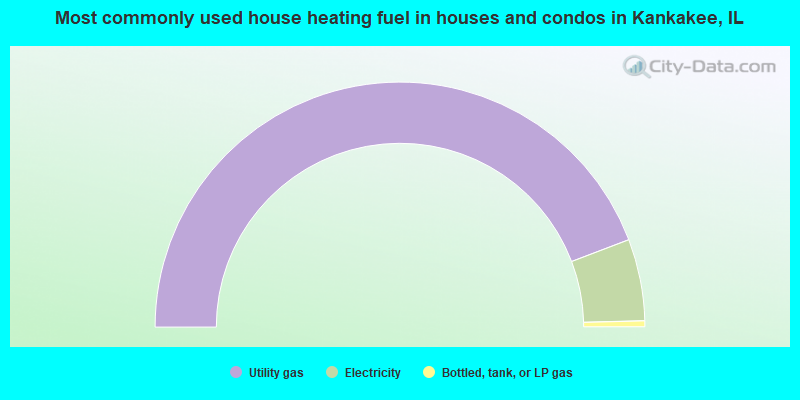
- 88.5%Utility gas
- 10.8%Electricity
- 0.8%Bottled, tank, or LP gas
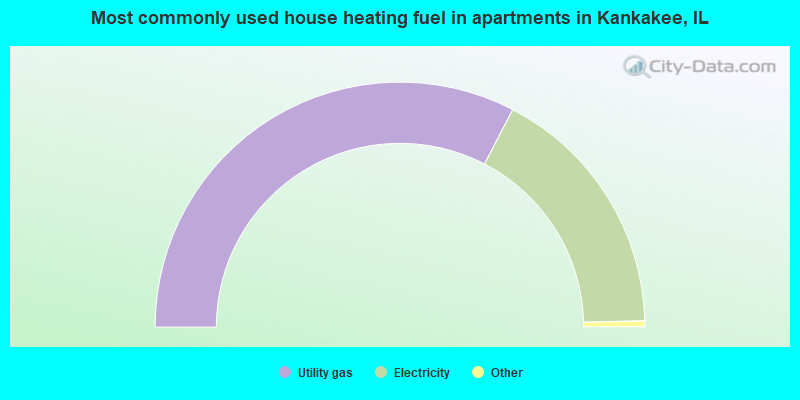
- 65.3%Utility gas
- 34.0%Electricity
- 0.3%Bottled, tank, or LP gas
- 0.2%Other fuel
- 0.2%No fuel used
- 0.1%Fuel oil, kerosene, etc.
Kankakee compared to Illinois state average:
- Median household income below state average.
- Median house value significantly below state average.
- Black race population percentage above state average.
- Median age below state average.
- Renting percentage above state average.
- Length of stay since moving in significantly above state average.
- Institutionalized population percentage above state average.
- Number of college students below state average.
- Percentage of population with a bachelor's degree or higher below state average.
Kankakee on our top lists:
- #28 on the list of "Top 101 cities with the largest percentage of people in schools, hospitals, or wards for the mentally retarded (population 1,000+)"
- #57 on the list of "Top 101 cities with the highest number of arson incidents per 100,000 residents, excludes tourist destinations and others with a lot of outsiders visiting based on city industries data (population 5,000+)"
- #62 on the list of "Top 101 counties with the largest decrease in the number of deaths per 1000 residents 2000-2006 to 2007-2013 (pop. 50,000+)"
- #94 on the list of "Top 101 counties with the largest decrease in the number of births per 1000 residents 2000-2006 to 2007-2013 (pop 50,000+)"
- #97 on the list of "Top 101 counties with the lowest percentage of residents relocating from other counties between 2010 and 2011 (pop. 50,000+)"

|
|
Total of 35 patent applications in 2008-2024.