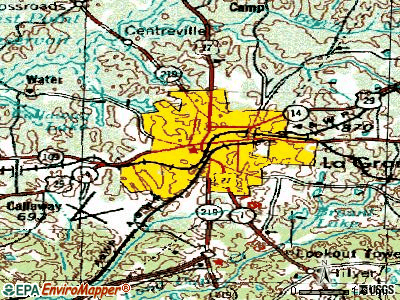
LaGrange, Georgia

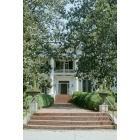
LaGrange: Hills and Dales Estate

LaGrange: Troup County Archives
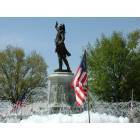
LaGrange: Down town LaGrange on the square picture of statue
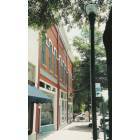
LaGrange: Down town LaGrange on the square

LaGrange: Hills and Dales Estate
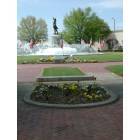
LaGrange: Square

LaGrange: Hills and Dales Estate
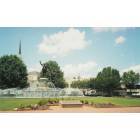
LaGrange: Lagrange Square
LaGrange: Historic Bellevue, Antebellum home of Sen. Benjamin H. Hill
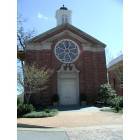
LaGrange: LaGrange College Chapel
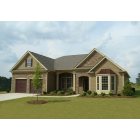
LaGrange: D.R. Horton's New Home Community RIVER MILL
- see
14
more - add
your
Submit your own pictures of this city and show them to the world
- OSM Map
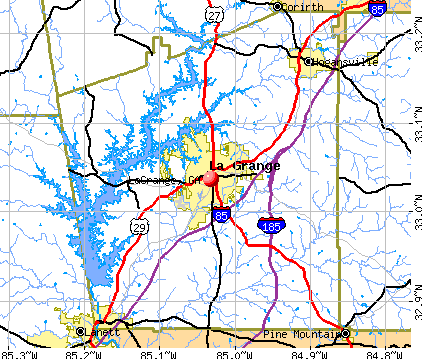
- General Map
- Google Map
- MSN Map
Population change since 2000: +22.2%
 |
| Males: 14,886 | |
| Females: 16,887 |
| Median resident age: | 35.1 years |
| Georgia median age: | 37.6 years |
Zip codes: 30240, 30241, 31833.
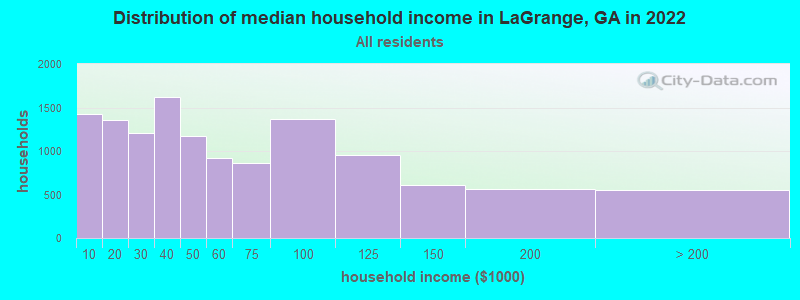
LaGrange Zip Code Map| LaGrange: | $44,390 |
| GA: | $72,837 |
Estimated per capita income in 2022: $31,845 (it was $16,640 in 2000)
LaGrange city income, earnings, and wages data
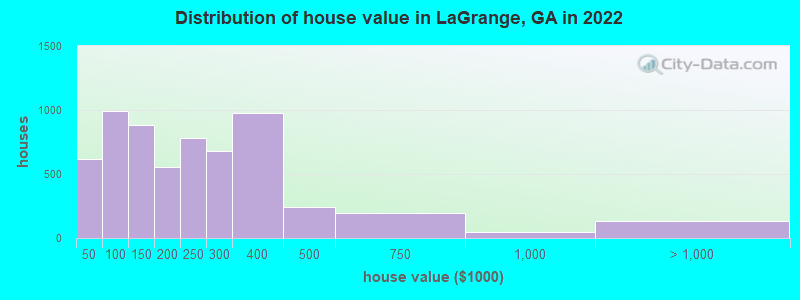
Estimated median house or condo value in 2022: $202,751 (it was $78,800 in 2000)
| LaGrange: | $202,751 |
| GA: | $297,400 |
Mean prices in 2022: all housing units: $256,498; detached houses: $250,620; townhouses or other attached units: $610,691; in 5-or-more-unit structures: $591,565; mobile homes: $28,608
Median gross rent in 2022: $1,041.
(15.9% for White Non-Hispanic residents, 33.6% for Black residents, 25.9% for Hispanic or Latino residents, 61.1% for American Indian residents, 50.4% for other race residents, 3.6% for two or more races residents)
Detailed information about poverty and poor residents in LaGrange, GA


- 16,39851.7%Black alone
- 11,09735.0%White alone
- 1,5604.9%Hispanic
- 1,2263.9%Two or more races
- 1,1513.6%Asian alone
- 1570.5%Other race alone
- 630.2%American Indian alone
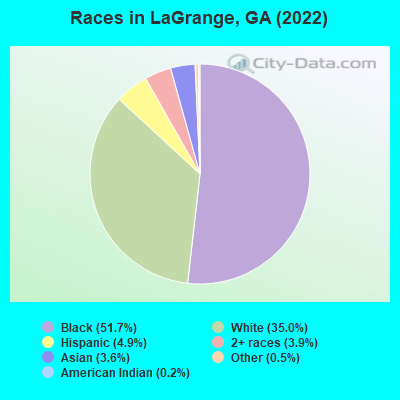
Races in LaGrange detailed stats: ancestries, foreign born residents, place of birth
According to our research of Georgia and other state lists, there were 327 registered sex offenders living in LaGrange, Georgia as of April 25, 2024.
The ratio of all residents to sex offenders in LaGrange is 95 to 1.
Type |
2009 |
2010 |
2011 |
2012 |
2013 |
2014 |
2015 |
2016 |
2017 |
2018 |
2019 |
2020 |
2021 |
2022 |
|---|---|---|---|---|---|---|---|---|---|---|---|---|---|---|
| Murders (per 100,000) | 5 (17.5) | 0 (0.0) | 4 (13.3) | 3 (9.9) | 4 (13.0) | 3 (9.8) | 3 (9.7) | 4 (12.9) | 0 (0.0) | 5 (16.3) | 1 (3.3) | 6 (19.7) | 6 (19.4) | 6 (18.7) |
| Rapes (per 100,000) | 12 (41.9) | 6 (20.3) | 9 (30.0) | 8 (26.5) | 5 (16.3) | 5 (16.3) | 5 (16.2) | 4 (12.9) | 4 (12.9) | 3 (9.8) | 4 (13.2) | 26 (85.5) | 21 (68.0) | 34 (105.8) |
| Robberies (per 100,000) | 73 (254.9) | 60 (202.8) | 71 (236.8) | 65 (215.1) | 43 (140.0) | 55 (179.3) | 64 (207.7) | 63 (203.7) | 29 (93.6) | 42 (137.2) | 12 (39.5) | 35 (115.1) | 36 (116.6) | 34 (105.8) |
| Assaults (per 100,000) | 67 (234.0) | 66 (223.1) | 52 (173.5) | 50 (165.4) | 46 (149.7) | 63 (205.4) | 73 (236.9) | 86 (278.0) | 20 (64.6) | 80 (261.3) | 38 (125.0) | 110 (361.8) | 125 (404.9) | 137 (426.2) |
| Burglaries (per 100,000) | 400 (1,397) | 382 (1,291) | 451 (1,504) | 462 (1,529) | 347 (1,129) | 368 (1,200) | 349 (1,133) | 291 (940.8) | 137 (442.2) | 149 (486.8) | 78 (256.6) | 194 (638.0) | 172 (557.1) | 199 (619.1) |
| Thefts (per 100,000) | 1,302 (4,547) | 1,248 (4,218) | 1,193 (3,980) | 1,248 (4,130) | 1,318 (4,290) | 1,337 (4,358) | 1,413 (4,586) | 1,255 (4,057) | 629 (2,030) | 1,199 (3,917) | 548 (1,803) | 1,430 (4,703) | 1,021 (3,307) | 1,109 (3,450) |
| Auto thefts (per 100,000) | 81 (282.9) | 76 (256.9) | 89 (296.9) | 74 (244.9) | 81 (263.6) | 72 (234.7) | 83 (269.4) | 87 (281.3) | 35 (113.0) | 60 (196.0) | 42 (138.2) | 118 (388.1) | 79 (255.9) | 96 (298.6) |
| Arson (per 100,000) | 8 (27.9) | 10 (33.8) | 1 (3.3) | 6 (19.9) | 6 (19.5) | 1 (3.3) | 3 (9.7) | 5 (16.2) | 4 (12.9) | 0 (0.0) | 1 (3.3) | 4 (13.2) | 4 (13.0) | 8 (24.9) |
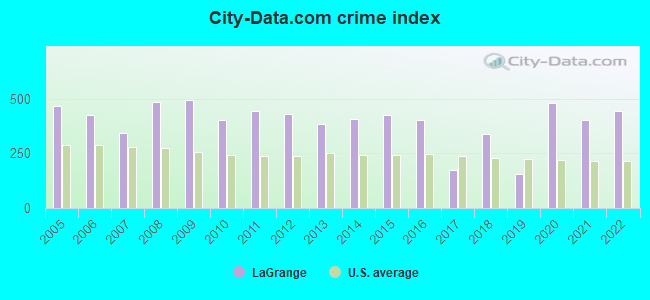
| City-Data.com crime index | 494.0 | 401.3 | 444.7 | 430.4 | 382.7 | 404.5 | 426.4 | 403.6 | 172.5 | 340.4 | 155.1 | 478.6 | 401.0 | 444.1 |
The City-Data.com crime index weighs serious crimes and violent crimes more heavily. Higher means more crime, U.S. average is 246.1. It adjusts for the number of visitors and daily workers commuting into cities.
Crime rate in LaGrange detailed stats: murders, rapes, robberies, assaults, burglaries, thefts, arson
Full-time law enforcement employees in 2021, including police officers: 105 (85 officers - 69 male; 16 female).
| Officers per 1,000 residents here: | 2.75 |
| Georgia average: | 2.45 |
 Recent articles from our blog. Our writers, many of them Ph.D. graduates or candidates, create easy-to-read articles on a wide variety of topics.


Latest news from LaGrange, GA collected exclusively by city-data.com from local newspapers, TV, and radio stations
Ancestries: American (7.3%), English (5.4%), German (4.5%), Irish (3.2%), African (1.8%).
Current Local Time: EST time zone
Land area: 29.0 square miles.
Population density: 1,097 people per square mile (low).
1,666 residents are foreign born (2.5% Asia, 2.2% Latin America).
| This city: | 5.3% |
| Georgia: | 10.4% |
Median real estate property taxes paid for housing units with mortgages in 2022: $2,001 (1.0%)
Median real estate property taxes paid for housing units with no mortgage in 2022: $1,609 (0.8%)
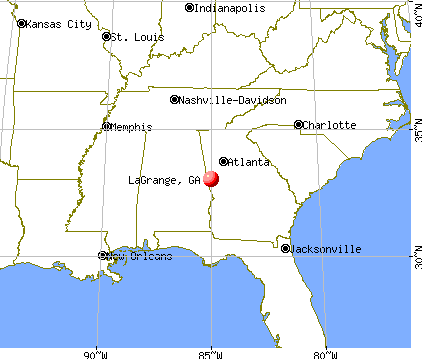
Nearest city with pop. 50,000+: Columbus, GA  (38.2 miles , pop. 185,781).
Nearest city with pop. 200,000+: Atlanta, GA (61.8 miles , pop. 416,474).
Nearest city with pop. 1,000,000+: Chicago, IL (626.0 miles , pop. 2,896,016).
Nearest cities:
), ), ), ), Latitude: 33.04 N, Longitude: 85.03 W
Daytime population change due to commuting: +8,702 (+27.7%)
Workers who live and work in this city: 9,075 (65.6%)
Area code commonly used in this area: 706

LaGrange, Georgia accommodation & food services, waste management - Economy and Business Data
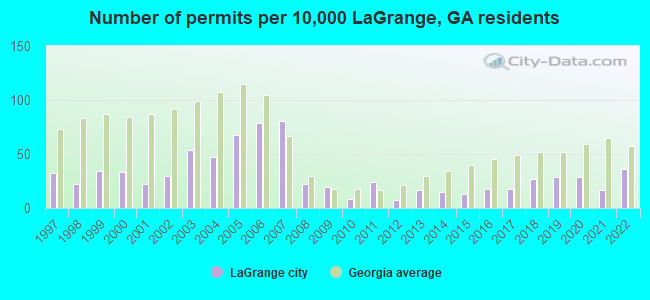
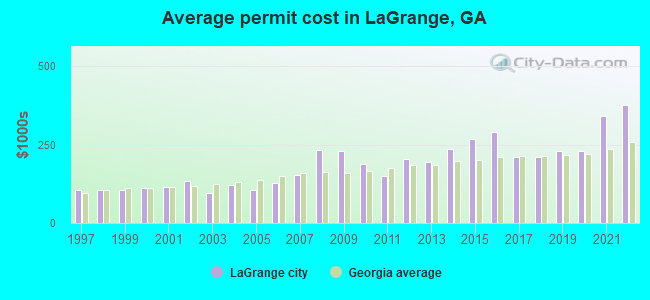
Single-family new house construction building permits:
- 2022: 93 buildings, average cost: $376,700
- 2021: 44 buildings, average cost: $341,700
- 2020: 76 buildings, average cost: $229,200
- 2019: 76 buildings, average cost: $229,200
- 2018: 70 buildings, average cost: $211,400
- 2017: 48 buildings, average cost: $211,000
- 2016: 46 buildings, average cost: $289,700
- 2015: 34 buildings, average cost: $266,700
- 2014: 38 buildings, average cost: $236,700
- 2013: 44 buildings, average cost: $193,000
- 2012: 17 buildings, average cost: $203,100
- 2011: 62 buildings, average cost: $150,600
- 2010: 21 buildings, average cost: $188,400
- 2009: 49 buildings, average cost: $228,200
- 2008: 58 buildings, average cost: $233,100
- 2007: 211 buildings, average cost: $153,300
- 2006: 206 buildings, average cost: $129,000
- 2005: 178 buildings, average cost: $104,100
- 2004: 121 buildings, average cost: $121,900
- 2003: 140 buildings, average cost: $97,000
- 2002: 77 buildings, average cost: $135,000
- 2001: 58 buildings, average cost: $115,000
- 2000: 87 buildings, average cost: $110,400
- 1999: 89 buildings, average cost: $104,500
- 1998: 58 buildings, average cost: $103,600
- 1997: 82 buildings, average cost: $104,000
| Here: | 2.7% |
| Georgia: | 2.9% |
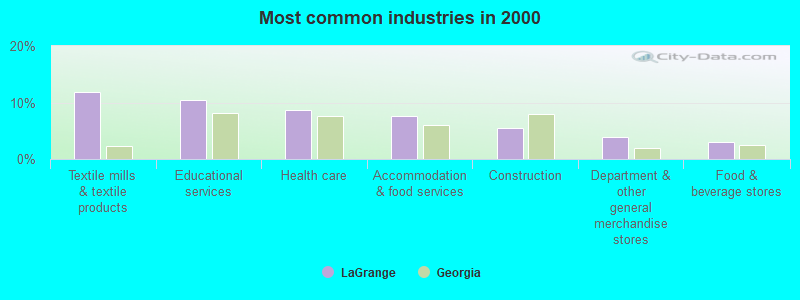
- Textile mills & textile products (11.8%)
- Educational services (10.4%)
- Health care (8.7%)
- Accommodation & food services (7.6%)
- Construction (5.6%)
- Department & other general merchandise stores (3.8%)
- Food & beverage stores (3.0%)
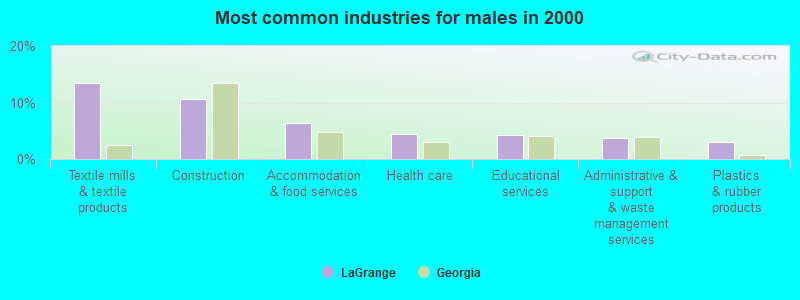
- Textile mills & textile products (13.5%)
- Construction (10.5%)
- Accommodation & food services (6.4%)
- Health care (4.4%)
- Educational services (4.3%)
- Administrative & support & waste management services (3.7%)
- Plastics & rubber products (3.0%)
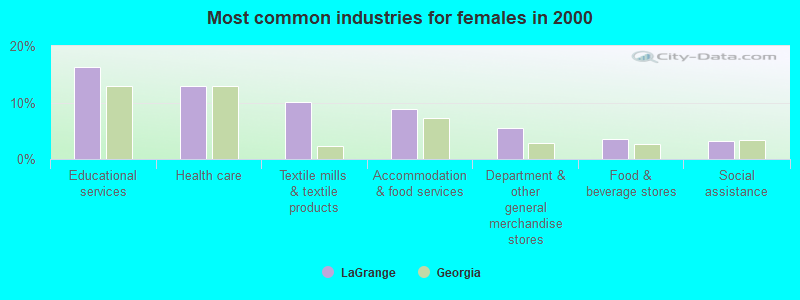
- Educational services (16.4%)
- Health care (12.9%)
- Textile mills & textile products (10.1%)
- Accommodation & food services (8.9%)
- Department & other general merchandise stores (5.5%)
- Food & beverage stores (3.6%)
- Social assistance (3.3%)
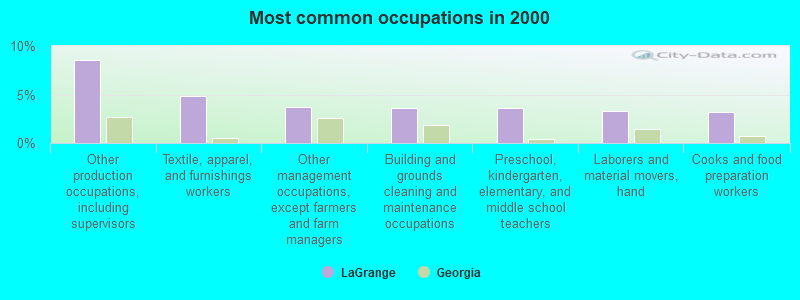
- Other production occupations, including supervisors (8.6%)
- Textile, apparel, and furnishings workers (4.9%)
- Other management occupations, except farmers and farm managers (3.7%)
- Building and grounds cleaning and maintenance occupations (3.7%)
- Preschool, kindergarten, elementary, and middle school teachers (3.6%)
- Laborers and material movers, hand (3.3%)
- Cooks and food preparation workers (3.2%)
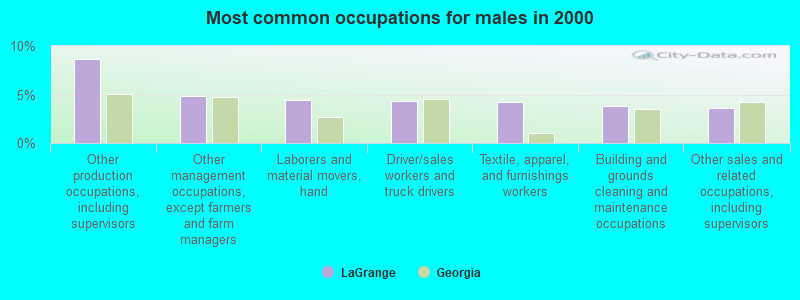
- Other production occupations, including supervisors (8.6%)
- Other management occupations, except farmers and farm managers (4.8%)
- Laborers and material movers, hand (4.5%)
- Driver/sales workers and truck drivers (4.3%)
- Textile, apparel, and furnishings workers (4.2%)
- Building and grounds cleaning and maintenance occupations (3.8%)
- Other sales and related occupations, including supervisors (3.6%)
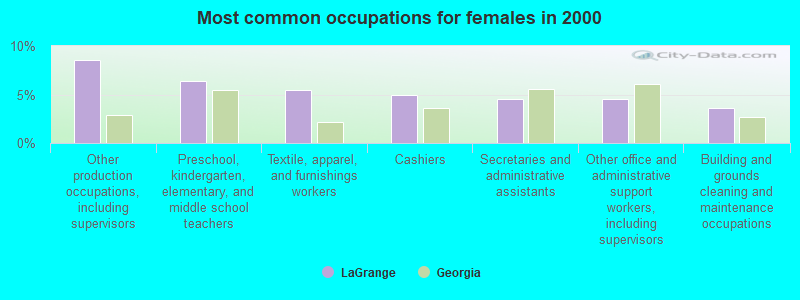
- Other production occupations, including supervisors (8.5%)
- Preschool, kindergarten, elementary, and middle school teachers (6.4%)
- Textile, apparel, and furnishings workers (5.5%)
- Cashiers (4.9%)
- Secretaries and administrative assistants (4.6%)
- Other office and administrative support workers, including supervisors (4.5%)
- Building and grounds cleaning and maintenance occupations (3.6%)
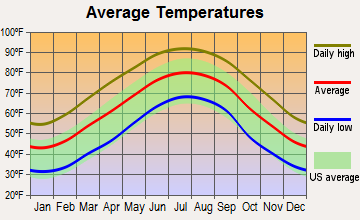
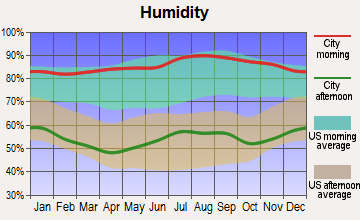
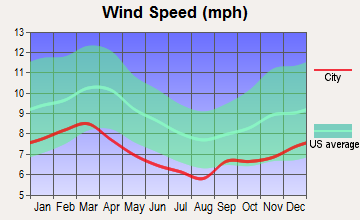
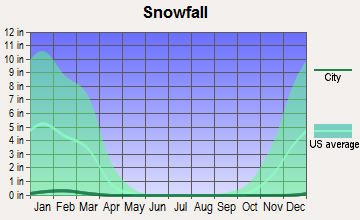
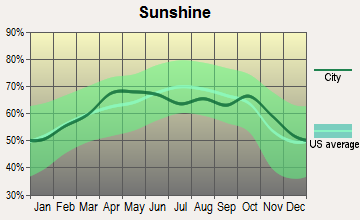
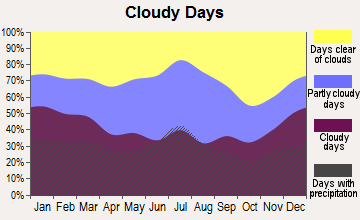
Average climate in LaGrange, Georgia
Based on data reported by over 4,000 weather stations

Tornado activity:
LaGrange-area historical tornado activity is slightly above Georgia state average. It is 51% greater than the overall U.S. average.
On 3/19/1970, a category F3 (max. wind speeds 158-206 mph) tornado 17.3 miles away from the LaGrange city center killed 2 people and injured 14 people and caused between $50,000 and $500,000 in damages.
On 3/5/1989, a category F3 tornado 20.5 miles away from the city center injured 23 people and caused between $5,000,000 and $50,000,000 in damages.
Earthquake activity:
LaGrange-area historical earthquake activity is significantly above Georgia state average. It is 52% greater than the overall U.S. average.On 4/29/2003 at 08:59:39, a magnitude 4.9 (4.4 MB, 4.6 MW, 4.9 LG, Class: Light, Intensity: IV - V) earthquake occurred 106.5 miles away from the city center
On 1/18/1999 at 07:00:53, a magnitude 4.8 (4.8 MB, 4.0 LG, Depth: 0.6 mi) earthquake occurred 131.1 miles away from LaGrange center
On 8/2/1974 at 08:52:09, a magnitude 4.9 (4.3 MB, 4.9 LG) earthquake occurred 157.8 miles away from the city center
On 4/29/2003 at 08:59:39, a magnitude 4.6 (4.6 MW, Depth: 12.3 mi) earthquake occurred 106.5 miles away from the city center
On 10/24/1997 at 08:35:17, a magnitude 4.9 (4.8 MB, 4.2 MS, 4.9 LG, Depth: 6.2 mi) earthquake occurred 186.4 miles away from the city center
On 11/30/1973 at 07:48:41, a magnitude 4.7 (4.7 MB, 4.6 ML) earthquake occurred 200.6 miles away from LaGrange center
Magnitude types: regional Lg-wave magnitude (LG), body-wave magnitude (MB), local magnitude (ML), surface-wave magnitude (MS), moment magnitude (MW)
Natural disasters:
The number of natural disasters in Troup County (8) is smaller than the US average (15).Major Disasters (Presidential) Declared: 4
Emergencies Declared: 3
Causes of natural disasters: Floods: 3, Hurricanes: 2, Storms: 2, Tornadoes: 2, Drought: 1, Heavy Rain: 1, Tropical Storm: 1, Wind: 1, Winter Storm: 1, Other: 1 (Note: some incidents may be assigned to more than one category).
Hospitals in LaGrange:
- ANGELS OF HOPE (1605 VERNON ROAD, SUITE 1000)
- WEST GEORGIA HOSPICE (1510 VERNON ROAD)
- WEST GEORGIA MEDICAL CENTER (Government - Hospital District or Authority, 1514 VERNON ROAD)
Nursing Homes in LaGrange:
- BRIAN CENTER OF NURSING CARE LAGRANGE (PO BOX 280)
- FLORENCE HAND HOME (200 MEDICAL DRIVE)
- LAGRANGE NURSING AND REHAB CENTER (2111 WEST POINT ROAD)
- NEGRO OLD FOLKS HOME INC (609 UNION ST)
- ROYAL ELAINE ICF (1400 HOGANSVILLE RD)
- TWIN FOUNTAINS HOME (1400 HOGANSVILLE ROAD)
Dialysis Facilities in LaGrange:
Home Health Centers in LaGrange:
Airports and heliports located in LaGrange:
- Lagrange-Callaway Airport (LGC) (Runways: 2, Itinerant Ops: 10,000, Local Ops: 7,000, Military Ops: 100)
- Grayhill Airport (GA98) (Runways: 1)
- Richards Airport (GA44) (Runways: 1)
- West Georgia Medical Center Heliport (GA33)
College/University in LaGrange:
Colleges/universities with over 2000 students nearest to LaGrange:
- Southern Union State Community College (about 33 miles; Wadley, AL; Full-time enrollment: 4,120)
- Columbus Technical College (about 37 miles; Columbus, GA; FT enrollment: 3,241)
- Columbus State University (about 38 miles; Columbus, GA; FT enrollment: 6,876)
- University of West Georgia (about 38 miles; Carrollton, GA; FT enrollment: 10,358)
- Auburn University (about 41 miles; Auburn University, AL; FT enrollment: 22,741)
- Southern Crescent Technical College (about 46 miles; Griffin, GA; FT enrollment: 4,168)
- West Georgia Technical College (about 47 miles; Waco, GA; FT enrollment: 4,768)
Public high schools in LaGrange:
- LAGRANGE HIGH SCHOOL (Students: 1,294, Location: 516 N GREENWOOD ST, Grades: 9-12)
- TROUP COUNTY HIGH SCHOOL (Students: 1,266, Location: 1920 HAMILTON RD, Grades: 9-12)
- BRADFIELD CENTER - AULT ACADEMY (Location: 1022 E DEPOT ST, Grades: 6-11)
Private high schools in LaGrange:
- LAFAYETTE CHRISTIAN SCHOOL (Students: 345, Location: 1904 HAMILTON RD, Grades: PK-12)
- LAGRANGE ACADEMY (Students: 189, Location: 1501 VERNON RD, Grades: KG-12)
- DAWSON STREET CHRISTIAN SCHOOL (Students: 88, Location: 200 N DAWSON ST, Grades: PK-12)
- SOUND DOCTRINE CHRISTIAN ACADEMY (Students: 44, Location: 202 W BROOME ST, Grades: 1-12)
- AULT ACADEMY (Students: 34, Location: 1022 E DEPOT ST, Grades: 6-11, Boys only)
- WELCOME CHRISTIAN SCHOOL (Students: 6, Location: 15 IRIS DR, Grades: 1-11)
Biggest public elementary/middle schools in LaGrange:
- LONG CANE MIDDLE SCHOOL (Students: 982, Location: 326 LONG CANE RD, Grades: 6-8)
- CALLAWAY MIDDLE SCHOOL (Students: 629, Location: 2244 HAMMETT RD, Grades: 6-8)
- ROSEMONT ELEMENTARY SCHOOL (Students: 527, Location: 4679 HAMILTON RD, Grades: PK-5)
- FRANKLIN FOREST ELEMENTARY (Students: 504, Location: 1 SCHOLAR LN, Grades: PK-5)
- ETHEL KIGHT MAGNET ELEMENTARY SCHOOL (Students: 503, Location: 80 N KIGHT DR, Grades: PK-5)
- LONG CANE ELEMENTARY SCHOOL (Students: 502, Location: 238 LONG CANE RD, Grades: PK-5)
- WHITESVILLE ROAD ELEMENTARY SCHOOL (Students: 471, Location: 1700 WHITESVILLE RD, Grades: PK-5)
- HOLLIS HAND ELEMENTARY SCHOOL (Students: 469, Location: 641 COUNTRY CLUB RD, Grades: PK-5)
- HILLCREST ELEMENTARY SCHOOL (Students: 423, Location: 3116 NEW FRANKLIN RD, Grades: PK-5)
- BERTA WEATHERSBEE ELEMENTARY SCHOOL (Students: 354, Location: 1200 FORREST AVE, Grades: PK-5)
User-submitted facts and corrections:
- LaGrange College's new website is www.lagrange.edu. Their average full time enrollment for 2006-2007 was 1137
- More pro athletes John Johnson San Fran 49ers , Nate Hill Auburn Tigers Miami Dolphins , Tony Stargell Kansas City Chiefs , BusterOwens Dallas Cowboys , Dernell Stenson Cin Reds
Points of interest:
Notable locations in LaGrange: American Legion Golf Club (A), La Grange Waterworks (B), Highlands Country Club (C), Callaway Center (D), Callaway Memorial Tower (E), Bellevue (F), William H Turner Hall (G), Smith Hall (H), Samuel C Dobbs Hall (I), Pitts Hall (J), Louise Anderson Manget Hall (K), La Grange Memorial Library (L), Lagrange Fire Department Station 3 (M), Lagrange Fire Department Station 2 (N), Coleman Library (O), William Banks Library (P), Troup County Jail (Q), Troup County Courthouse (R), La Grange City Hall (S), Lagrange Fire Department Station 1 (T). Display/hide their locations on the map
Shopping Centers: West Georgia Commons Shopping Center (1), Lees Crossing Shopping Center (2). Display/hide their locations on the map
Churches in LaGrange include: Sunnyside Church (A), Whitesville Street Methodist Church (B), Warren Temple Methodist Episcopal Church (C), Ware Street Baptist Church (D), Ward Chapel (E), Valley Grove Baptist Church (F), Unity Methodist Church (G), Unity Baptist Church (H), United Congregational Christian Church (I). Display/hide their locations on the map
Cemeteries: Rogers Cemetery (1), South View Cemetery (2), Mount Beulah Cemetery (3), Newsom Cemetery (4), East View Cemetery (5), Shadowlawn Cemetery (6), Hill View Cemetery (7). Display/hide their locations on the map
Reservoirs: Newnan Development Lake North (A), Newnan Development Lake South (B), Newmans Pond (C), Hutchins Lake (D), Piney Woods Lake (E). Display/hide their locations on the map
Parks in LaGrange include: Callaway Park (1), Unity Park (2), Broad Street Historic District (3), Granger Park (4), Ogletree Park (5), Sunny Point Recreation Area (6), Pepperell Park (7), Callaway Stadium (8). Display/hide their locations on the map
Birthplace of: Howard Callaway - Politician and businessman, Dialleo Burks - Football player, Bubba Sparxxx - Rapper, J. Paul Austin - Business executive, Sam Olajubutu - Player of and football, Wynona Lipman - Politician, James M. Sprayberry - Army Medal of Honor recipient, Bruce Thornton - 2005 NFL player (Dallas Cowboys, born: Jan 31, 1980), Chips Moman - Record producer, James H. Daughdrill, Jr. - Educator.
| This city: | 2.5 people |
| Georgia: | 2.6 people |
| This city: | 64.6% |
| Whole state: | 68.5% |
| This city: | 6.8% |
| Whole state: | 5.9% |
Likely homosexual households (counted as self-reported same-sex unmarried-partner households)
- Lesbian couples: 0.3% of all households
- Gay men: 0.3% of all households
People in group quarters in LaGrange in 2010:
- 496 people in college/university student housing
- 381 people in nursing facilities/skilled-nursing facilities
- 154 people in correctional residential facilities
- 69 people in group homes for juveniles (non-correctional)
- 57 people in other noninstitutional facilities
- 53 people in emergency and transitional shelters (with sleeping facilities) for people experiencing homelessness
- 14 people in in-patient hospice facilities
- 9 people in residential treatment centers for juveniles (non-correctional)
- 5 people in residential treatment centers for adults
- 4 people in group homes intended for adults
People in group quarters in LaGrange in 2000:
- 362 people in college dormitories (includes college quarters off campus)
- 243 people in hospitals/wards and hospices for chronically ill
- 243 people in other hospitals or wards for chronically ill
- 139 people in nursing homes
- 104 people in other noninstitutional group quarters
- 47 people in residential treatment centers for emotionally disturbed children
For population 15 years and over in LaGrange:
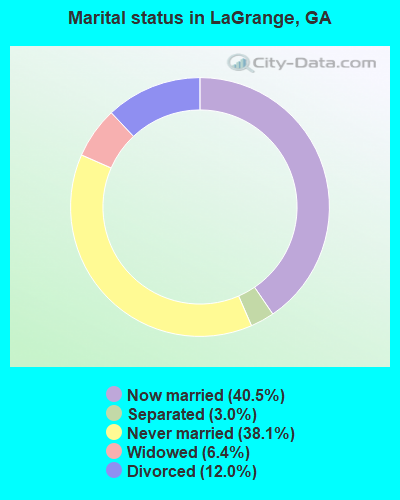
- Never married: 38.1%
- Now married: 40.5%
- Separated: 3.0%
- Widowed: 6.4%
- Divorced: 12.0%
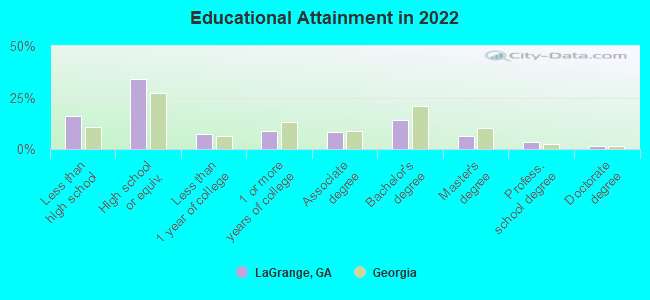
For population 25 years and over in LaGrange:
- High school or higher: 86.7%
- Bachelor's degree or higher: 23.1%
- Graduate or professional degree: 9.9%
- Unemployed: 5.4%
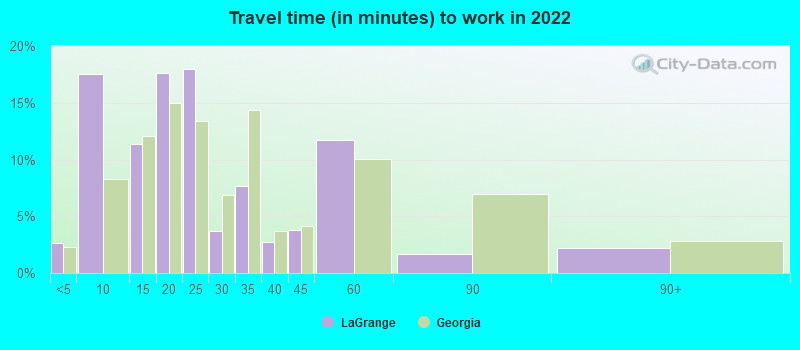
- Mean travel time to work (commute): 16.5 minutes
| Here: | 13.5 |
| Georgia average: | 12.2 |
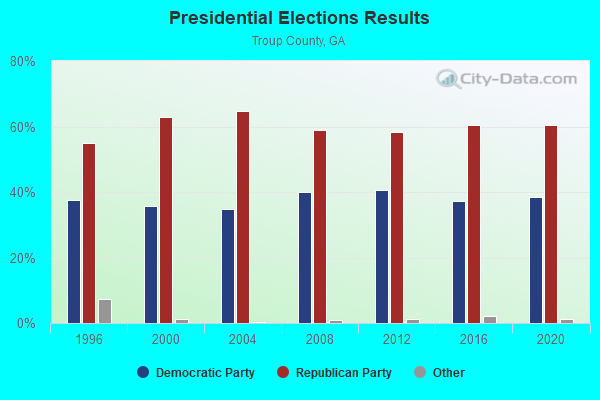
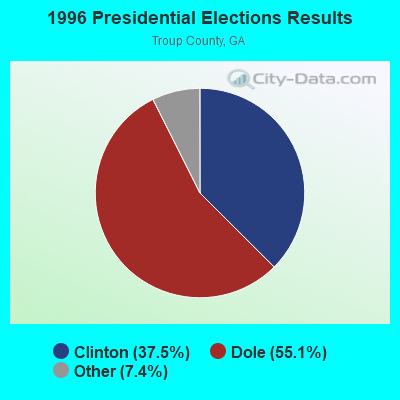
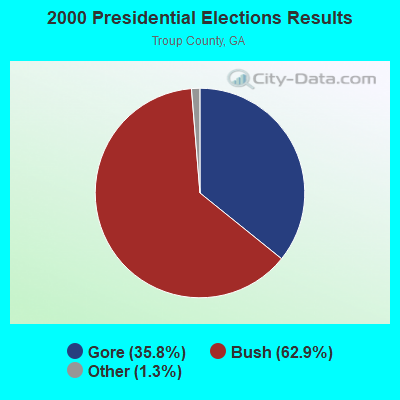

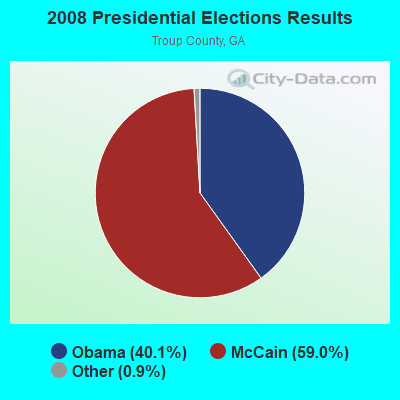
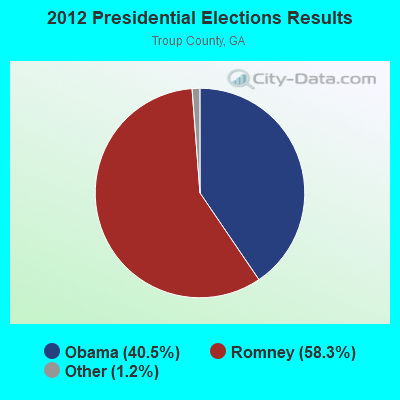

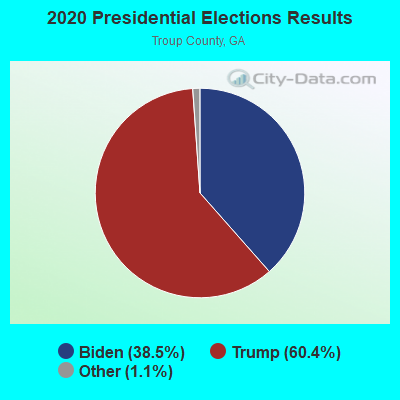
Graphs represent county-level data. Detailed 2008 Election Results
Religion statistics for LaGrange, GA (based on Troup County data)
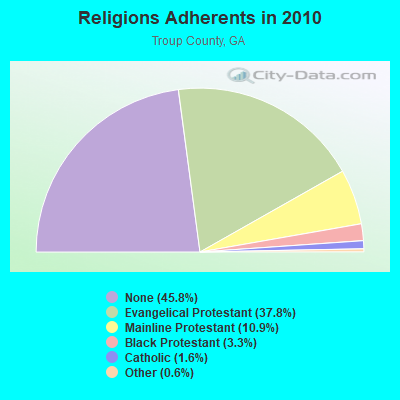
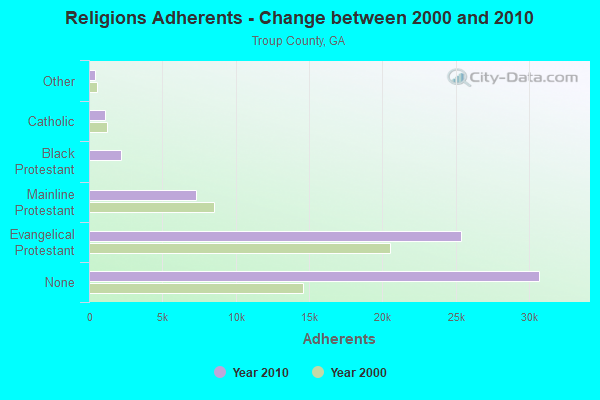
| Religion | Adherents | Congregations |
|---|---|---|
| Evangelical Protestant | 25,373 | 88 |
| Mainline Protestant | 7,308 | 42 |
| Black Protestant | 2,195 | 9 |
| Catholic | 1,064 | 1 |
| Other | 397 | 3 |
| None | 30,707 | - |
Food Environment Statistics:
| Troup County: | 2.21 / 10,000 pop. |
| Georgia: | 1.91 / 10,000 pop. |
| Here: | 1.74 / 10,000 pop. |
| State: | 0.86 / 10,000 pop. |
| Troup County: | 8.05 / 10,000 pop. |
| Georgia: | 5.12 / 10,000 pop. |
| Troup County: | 8.05 / 10,000 pop. |
| State: | 7.41 / 10,000 pop. |
| Troup County: | 11.8% |
| Georgia: | 10.4% |
| This county: | 30.2% |
| Georgia: | 27.8% |
| Here: | 12.1% |
| State: | 14.6% |
Health and Nutrition:
| Here: | 48.0% |
| State: | 48.9% |
| LaGrange: | 44.6% |
| State: | 46.5% |
| Here: | 29.4 |
| Georgia: | 28.9 |
| LaGrange: | 20.4% |
| Georgia: | 20.4% |
| LaGrange: | 12.8% |
| State: | 10.8% |
| This city: | 6.8 |
| State: | 6.7 |
| Here: | 34.7% |
| Georgia: | 33.5% |
| Here: | 53.6% |
| Georgia: | 56.2% |
| LaGrange: | 80.0% |
| State: | 80.8% |
More about Health and Nutrition of LaGrange, GA Residents
| Local government employment and payroll (March 2022) | |||||
| Function | Full-time employees | Monthly full-time payroll | Average yearly full-time wage | Part-time employees | Monthly part-time payroll |
|---|---|---|---|---|---|
| Police Protection - Officers | 88 | $561,603 | $76,582 | 0 | $0 |
| Firefighters | 62 | $316,727 | $61,302 | 0 | $0 |
| Other and Unallocable | 60 | $325,535 | $65,107 | 3 | $1,506 |
| Water Supply | 31 | $149,796 | $57,986 | 0 | $0 |
| Sewerage | 31 | $147,398 | $57,057 | 0 | $0 |
| Solid Waste Management | 28 | $114,817 | $49,207 | 0 | $0 |
| Streets and Highways | 24 | $102,973 | $51,487 | 0 | $0 |
| Electric Power | 23 | $144,792 | $75,544 | 0 | $0 |
| Police - Other | 20 | $77,124 | $46,274 | 10 | $11,322 |
| Parks and Recreation | 19 | $77,066 | $48,673 | 0 | $0 |
| Financial Administration | 10 | $61,847 | $74,216 | 0 | $0 |
| Judicial and Legal | 8 | $42,953 | $64,430 | 1 | $2,214 |
| Gas Supply | 8 | $49,908 | $74,862 | 0 | $0 |
| Health | 4 | $18,407 | $55,221 | 0 | $0 |
| Fire - Other | 3 | $12,482 | $49,928 | 1 | $529 |
| Other Government Administration | 0 | $0 | 14 | $11,330 | |
| Totals for Government | 419 | $2,203,429 | $63,105 | 29 | $26,900 |
LaGrange government finances - Expenditure in 2021 (per resident):
- Construction - Parks and Recreation: $50,000 ($1.57)
- Current Operations - Electric Utilities: $48,186,000 ($1516.57)
Gas Utilities: $13,434,000 ($422.81)
Police Protection: $11,642,000 ($366.41)
Water Utilities: $11,247,000 ($353.98)
Sewerage: $7,798,000 ($245.43)
General - Other: $6,750,000 ($212.44)
Local Fire Protection: $5,976,000 ($188.08)
Solid Waste Management: $3,903,000 ($122.84)
Regular Highways: $2,919,000 ($91.87)
Central Staff Services: $2,762,000 ($86.93)
Parks and Recreation: $1,961,000 ($61.72)
Financial Administration: $1,561,000 ($49.13)
Judicial and Legal Services: $729,000 ($22.94)
Health - Other: $586,000 ($18.44)
General Public Buildings: $228,000 ($7.18)
Miscellaneous Commercial Activities - Other: $201,000 ($6.33)
Libraries: $25,000 ($0.79)
- General - Interest on Debt: $561,000 ($17.66)
- Intergovernmental to Local - Other - Correctional Institutions: $48,000 ($1.51)
Other - General - Other: $30,000 ($0.94)
- Other Capital Outlay - Financial Administration: $201,000 ($6.33)
Police Protection: $43,000 ($1.35)
Local Fire Protection: $34,000 ($1.07)
Parks and Recreation: $27,000 ($0.85)
Miscellaneous Commercial Activities - Other: $2,000 ($0.06)
Central Staff Services: $2,000 ($0.06)
- Total Salaries and Wages: $323,000 ($10.17)
- Water Utilities - Interest on Debt: $121,000 ($3.81)
LaGrange government finances - Revenue in 2021 (per resident):
- Charges - Sewerage: $11,436,000 ($359.93)
Miscellaneous Commercial Activities: $3,253,000 ($102.38)
Solid Waste Management: $2,654,000 ($83.53)
Other: $1,522,000 ($47.90)
- Federal Intergovernmental - Other: $1,586,000 ($49.92)
- Local Intergovernmental - Other: $8,911,000 ($280.46)
General Local Government Support: $6,378,000 ($200.74)
Gas Utilities: $1,193,000 ($37.55)
- Miscellaneous - Rents: $857,000 ($26.97)
Fines and Forfeits: $766,000 ($24.11)
General Revenue - Other: $646,000 ($20.33)
Donations From Private Sources: $67,000 ($2.11)
Interest Earnings: $61,000 ($1.92)
- Revenue - Electric Utilities: $47,360,000 ($1490.57)
Gas Utilities: $12,640,000 ($397.82)
Water Utilities: $6,276,000 ($197.53)
- State Intergovernmental - Other: $435,000 ($13.69)
General Local Government Support: $25,000 ($0.79)
- Tax - Other Selective Sales: $3,098,000 ($97.50)
Insurance Premiums Sales: $2,356,000 ($74.15)
Public Utilities Sales: $1,042,000 ($32.80)
Property: $942,000 ($29.65)
Alcoholic Beverage Sales: $770,000 ($24.23)
Occupation and Business License - Other: $423,000 ($13.31)
Alcoholic Beverage License: $404,000 ($12.72)
Other License: $209,000 ($6.58)
Other: $188,000 ($5.92)
LaGrange government finances - Debt in 2021 (per resident):
- Long Term Debt - Beginning Outstanding - Unspecified Public Purpose: $99,701,000 ($3137.92)
Outstanding Unspecified Public Purpose: $89,706,000 ($2823.34)
Retired Unspecified Public Purpose: $9,995,000 ($314.58)
Beginning Outstanding - Public Debt for Private Purpose: $1,771,000 ($55.74)
Retired Nonguaranteed - Public Debt for Private Purpose: $1,771,000 ($55.74)
LaGrange government finances - Cash and Securities in 2021 (per resident):
- Bond Funds - Cash and Securities: $26,392,000 ($830.64)
- Other Funds - Cash and Securities: $60,650,000 ($1908.85)
| Businesses in LaGrange, GA | ||||
| Name | Count | Name | Count | |
|---|---|---|---|---|
| AT&T | 1 | Kroger | 1 | |
| Ace Hardware | 1 | La-Z-Boy | 1 | |
| Advance Auto Parts | 1 | Lane Furniture | 2 | |
| Applebee's | 1 | Little Caesars Pizza | 1 | |
| Ashley Furniture | 1 | Maurices | 1 | |
| AutoZone | 1 | McDonald's | 3 | |
| Baymont Inn | 1 | Nike | 2 | |
| Best Western | 1 | Nissan | 1 | |
| Burger King | 3 | Penske | 2 | |
| Chevrolet | 1 | Pizza Hut | 1 | |
| Chick-Fil-A | 3 | Publix Super Markets | 1 | |
| Church's Chicken | 2 | Quiznos | 1 | |
| Circle K | 2 | RadioShack | 1 | |
| Comfort Inn | 1 | Red Roof Inn | 1 | |
| Cracker Barrel | 1 | Rite Aid | 1 | |
| Curves | 1 | Rue21 | 1 | |
| Dairy Queen | 1 | Ryan's Grill | 1 | |
| Domino's Pizza | 3 | Sears | 1 | |
| FedEx | 8 | Sprint Nextel | 1 | |
| GNC | 1 | Staples | 1 | |
| GameStop | 1 | Subway | 3 | |
| H&R Block | 3 | T-Mobile | 3 | |
| Haworth | 1 | Taco Bell | 1 | |
| Hilton | 1 | The Room Place | 1 | |
| Holiday Inn | 1 | UPS | 10 | |
| Home Depot | 1 | Vans | 1 | |
| Honda | 1 | Verizon Wireless | 2 | |
| Hyundai | 1 | Waffle House | 3 | |
| JCPenney | 1 | Walgreens | 1 | |
| KFC | 1 | Wingate | 1 | |
Strongest AM radio stations in LaGrange:
- WLAG (1240 AM; 1 kW; LA GRANGE, GA; Owner: EAGLE'S NEST, INC)
- WTRP (620 AM; 1 kW; LA GRANGE, GA; Owner: CASEY NETWORK, LLC)
- WGSE (720 AM; daytime; 8 kW; HOGANSVILLE, GA; Owner: CITICASTERS LICENSES, L.P.)
- WGST (640 AM; 50 kW; ATLANTA, GA; Owner: CITICASTERS LICENSES, L.P.)
- WKNG (1060 AM; daytime; 50 kW; TALLAPOOSA, GA; Owner: WKNG, INC.)
- WSB (750 AM; 50 kW; ATLANTA, GA; Owner: CXR HOLDINGS, INC.)
- WGUN (1010 AM; 50 kW; ATLANTA, GA; Owner: WGUN, INC.)
- WNSI (810 AM; 50 kW; JACKSONVILLE, AL; Owner: UNITED BROADCASTING NETWORK, INC.)
- WMLB (1160 AM; 50 kW; EAST POINT, GA; Owner: ATLANTA AREA BROADCASTING, INC.)
- WCNN (680 AM; 50 kW; NORTH ATLANTA, GA; Owner: DICKEY BROADCASTING COMPANY)
- WAOK (1380 AM; 50 kW; ATLANTA, GA; Owner: INFINITY BROADCASTING OPERATIONS, INC.)
- WFTD (1080 AM; daytime; 50 kW; MARIETTA, GA; Owner: PRIETO ENTERPRISES, INC.)
- WMAC (940 AM; 50 kW; MACON, GA; Owner: CUMULUS LICENSING CORP.)
Strongest FM radio stations in LaGrange:
- W220AN (91.9 FM; LA GRANGE, ETC., GA; Owner: FAMILY STATIONS, INC.)
- WMGP (98.1 FM; HOGANSVILLE, GA; Owner: CITICASTERS LICENSES, L.P.)
- WOAK (90.9 FM; LA GRANGE, GA; Owner: OAKSIDE CHRISTIAN SCHOOL)
- W212BL (90.3 FM; LAGRANGE, GA; Owner: FAMILY WORSHIP CENTER CHURCH, INC.)
- WVFJ-FM (93.3 FM; MANCHESTER, GA; Owner: PROVIDENT BROADCASTING COMPANY)
- WALR-FM (104.1 FM; LA GRANGE, GA; Owner: CXR HOLDINGS, INC.)
- WJSP-FM (88.1 FM; WARM SPRINGS, GA; Owner: GEORGIA PUBLIC TELECOMMUNICATIONS COMMISSION)
- WKZJ (95.7 FM; GREENVILLE, GA; Owner: DAVIS B/CASTING OF COLUMBUS, INC)
- WCJM-FM (100.9 FM; WEST POINT, GA; Owner: QANTUM OF AUBURN LICENSE COMPANY, LLC)
- WMAX-FM (105.3 FM; BOWDON, GA; Owner: CLEAR CHANNEL BROADCASTING LICENSES, INC.)
- WSTH-FM (106.1 FM; ALEXANDER CITY, AL; Owner: CLEAR CHANNEL BROADCASTING LICENSES, INC.)
- WTBJ (91.3 FM; OXFORD, AL; Owner: TRINITY CHRISTIAN ACADEMY)
- WCGQ (107.3 FM; COLUMBUS, GA; Owner: ABG GEORGIA, LLC)
- WELR-FM (102.3 FM; ROANOKE, AL; Owner: EAGLE'S NEST, INC.)
- WKEU-FM (88.9 FM; THE ROCK, GA; Owner: GEORGIA FOUNDATION OF PUBLIC BROADCASTING, INC.)
- WYFK (89.5 FM; COLUMBUS, GA; Owner: BIBLE BROADCASTING NETWORK, INC.)
- WRLD-FM (95.3 FM; VALLEY, AL; Owner: ABG GEORGIA, LLC)
TV broadcast stations around LaGrange:
- WCAG-LP (Channel 33; LA GRANGE, GA; Owner: GEORGIA-ALABAMA BROADCASTING, INC.)
- WJSP-TV (Channel 28; COLUMBUS, GA; Owner: GEORGIA PUBLIC TELECOMMUNICATIONS COMMISSION)
- WSWS-TV (Channel 66; OPELIKA, AL; Owner: PAPPAS TELECASTING OF OPELIKA)
- W04DB (Channel 4; ATLANTA, GA; Owner: VVILPTV, INC.)
- WTVM (Channel 9; COLUMBUS, GA; Owner: RAYCOM AMERICA, INC.)
- WRBL (Channel 3; COLUMBUS, GA; Owner: MEDIA GENERAL BROADCASTING OF SO. CAROLINA HOLDINGS, INC.)
- WLTZ (Channel 38; COLUMBUS, GA; Owner: LEWIS BROADCASTING CORPORATION)
- WXTX (Channel 54; COLUMBUS, GA; Owner: FISHER BROADCASTING - GEORGIA, L.L.C.)
- WCGT-LP (Channel 16; COLUMBUS, GA; Owner: COLUMBUS TELEVISION, INC.)
Medal of Honor Recipients
Medal of Honor Recipients born in LaGrange: Hammett L., Jr. Bowen, James M . Sprayberry.
- National Bridge Inventory (NBI) Statistics
- 115Number of bridges
- 1,699ft / 518mTotal length
- $207,586,000Total costs
- 1,138,270Total average daily traffic
- 80,239Total average daily truck traffic
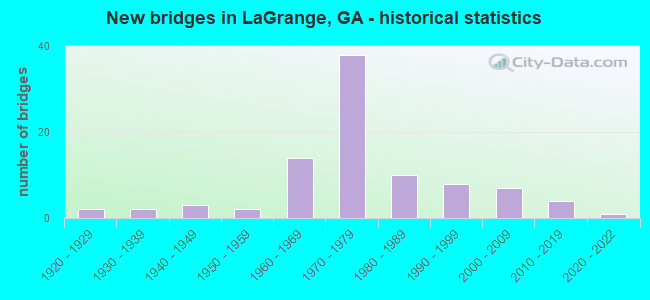
- New bridges - historical statistics
- 21920-1929
- 21930-1939
- 31940-1949
- 21950-1959
- 141960-1969
- 381970-1979
- 101980-1989
- 81990-1999
- 72000-2009
- 42010-2019
- 12020-2022
FCC Registered Antenna Towers: 262 (See the full list of FCC Registered Antenna Towers)
FCC Registered Private Land Mobile Towers: 2 (See the full list of FCC Registered Private Land Mobile Towers in LaGrange, GA)
FCC Registered Broadcast Land Mobile Towers: 36 (See the full list of FCC Registered Broadcast Land Mobile Towers)
FCC Registered Microwave Towers: 14 (See the full list of FCC Registered Microwave Towers in this town)
FCC Registered Paging Towers: 3 (See the full list of FCC Registered Paging Towers)
FCC Registered Maritime Coast & Aviation Ground Towers: 4 (See the full list of FCC Registered Maritime Coast & Aviation Ground Towers)
FCC Registered Amateur Radio Licenses: 106 (See the full list of FCC Registered Amateur Radio Licenses in LaGrange)
FAA Registered Aircraft: 40 (See the full list of FAA Registered Aircraft in LaGrange)
2002 - 2018 National Fire Incident Reporting System (NFIRS) incidents
- Fire incident types reported to NFIRS in LaGrange, GA
- 2,19342.0%Outside Fires
- 1,79034.3%Structure Fires
- 92917.8%Mobile Property/Vehicle Fires
- 3085.9%Other
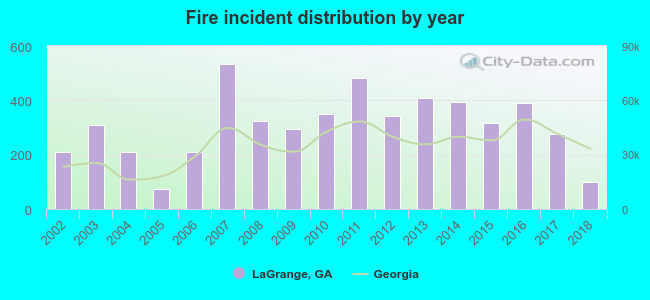 Based on the data from the years 2002 - 2018 the average number of fires per year is 307. The highest number of reported fires - 532 took place in 2007, and the least - 74 in 2005. The data has a decreasing trend.
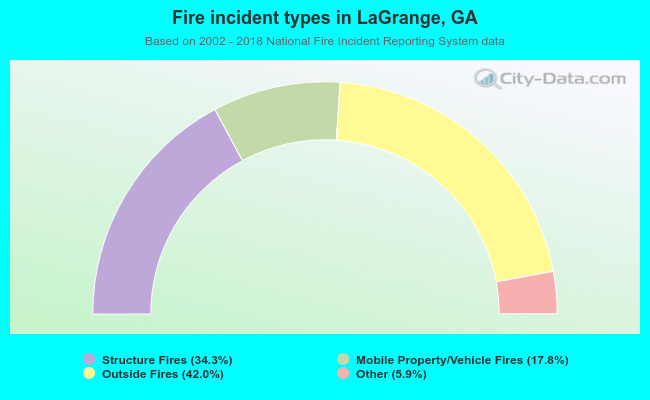 When looking into fire subcategories, the most incidents belonged to: Outside Fires (42.0%), and Structure Fires (34.3%).
Fire-safe hotels and motels in LaGrange, Georgia:
- Quality Inn, 110 Jameson Dr, Lagrange, Georgia 30241 , Phone: (706) 882-8700
- Baymont Inn & Suites, 107 Hoffman Dr, Lagrange, Georgia 30241 , Phone: (706) 885-9002, Fax: (706) 885-1977
- Red Roof Inn, 1601 Lafayette Pkwy, Lagrange, Georgia 30241 , Phone: (706) 882-9540, Fax: (706) 882-3929
- La Quinta Inn & Suites, 111 Hoffman Dr, Lagrange, Georgia 30241 , Phone: (706) 812-8000, Fax: (706) 812-8208
- Comfort Inn & Suites Lagrange, 1512 Lafayette Pkwy, Lagrange, Georgia 30241 , Phone: (706) 882-7700, Fax: (706) 882-5228
- Super 8, 29 Patillo Rd, Lagrange, Georgia 30241 , Phone: (706) 845-9093, Fax: (706) 884-1106
- Hampton Inn Lagrange, 100 Willis Cir, Lagrange, Georgia 30240 , Phone: (706) 845-1115, Fax: (706) 845-8010
- Holiday Inn Express & Suites, 205 Cotton Rd, Lagrange, Georgia 30241 , Phone: (706) 298-4571, Fax: (706) 298-4578
- 2 other hotels and motels
| Most common first names in LaGrange, GA among deceased individuals | ||
| Name | Count | Lived (average) |
|---|---|---|
| Mary | 469 | 78.1 years |
| James | 419 | 70.3 years |
| John | 334 | 74.2 years |
| William | 323 | 72.8 years |
| Willie | 285 | 72.2 years |
| Robert | 217 | 70.9 years |
| Annie | 181 | 80.9 years |
| Charlie | 181 | 72.8 years |
| George | 153 | 72.1 years |
| Charles | 122 | 67.8 years |
| Most common last names in LaGrange, GA among deceased individuals | ||
| Last name | Count | Lived (average) |
|---|---|---|
| Smith | 305 | 75.7 years |
| Johnson | 163 | 74.0 years |
| Williams | 163 | 74.3 years |
| Jones | 135 | 72.8 years |
| Brown | 131 | 75.0 years |
| Davis | 122 | 74.4 years |
| Harris | 91 | 70.4 years |
| Freeman | 87 | 76.2 years |
| Thompson | 81 | 98.1 years |
| Allen | 78 | 74.0 years |
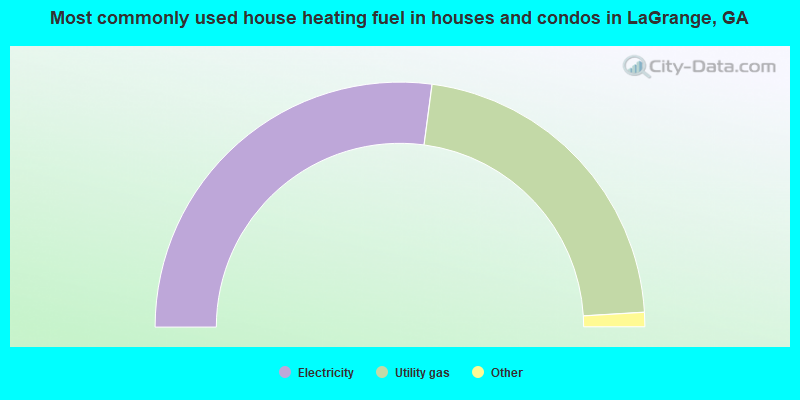
- 54.2%Electricity
- 43.9%Utility gas
- 0.9%Wood
- 0.7%Bottled, tank, or LP gas
- 0.3%No fuel used
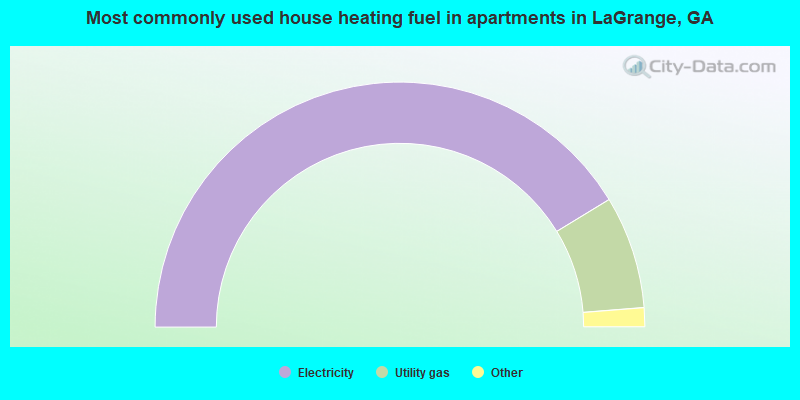
- 82.6%Electricity
- 14.9%Utility gas
- 1.7%Bottled, tank, or LP gas
- 0.6%Wood
- 0.2%No fuel used
LaGrange compared to Georgia state average:
- Median household income below state average.
- Unemployed percentage below state average.
- Black race population percentage above state average.
- Hispanic race population percentage below state average.
- Median age below state average.
- Foreign-born population percentage below state average.
- Renting percentage above state average.
- Length of stay since moving in significantly above state average.
LaGrange on our top lists:
- #9 on the list of "Top 101 cities with the most people taking a taxi to work (population 5,000+)"
- #36 on the list of "Top 101 cities with largest percentage of females in occupations: production occupations (population 5,000+)"
- #44 on the list of "Top 101 cities with the largest percentage of people in other hospitals or wards for chronically ill (population 1,000+)"
- #52 on the list of "Top 101 cities with the largest percentage of people in hospitals/wards and hospices for chronically ill (population 1,000+)"
- #56 on the list of "Top 101 cities with largest percentage of females in industries: manufacturing (population 5,000+)"
- #61 on the list of "Top 101 cities with the most residents born in Syria (population 500+)"
- #78 on the list of "Top 101 cities with the largest percentage of people in residential treatment centers for emotionally disturbed children (population 1,000+)"
- #87 on the list of "Top 101 cities with the most people below the poverty level, excluding cities with 15% or more of residents in college and with the median age below 28 (population 5,000+)"
- #35 on the list of "Top 101 counties with the largest decrease in the number of deaths per 1000 residents 2000-2006 to 2007-2013 (pop. 50,000+)"
- #85 on the list of "Top 101 counties with the lowest ground withdrawal of fresh water for public supply"