Lansing, Illinois Submit your own pictures of this village and show them to the world
OSM Map
General Map
Google Map
MSN Map
OSM Map
General Map
Google Map
MSN Map
OSM Map
General Map
Google Map
MSN Map
OSM Map
General Map
Google Map
MSN Map
Please wait while loading the map...
Population in 2022: 28,000 (100% urban, 0% rural). Population change since 2000: -1.2%Males: 13,630 Females: 14,370
March 2022 cost of living index in Lansing: 99.5 (near average, U.S. average is 100) Percentage of residents living in poverty in 2022: 16.5%for White Non-Hispanic residents , 19.9% for Black residents , 18.7% for Hispanic or Latino residents , 1.1% for other race residents , 23.5% for two or more races residents )
Profiles of local businesses
Business Search - 14 Million verified businesses
Data:
Median household income ($)
Median household income (% change since 2000)
Household income diversity
Ratio of average income to average house value (%)
Ratio of average income to average rent
Median household income ($) - White
Median household income ($) - Black or African American
Median household income ($) - Asian
Median household income ($) - Hispanic or Latino
Median household income ($) - American Indian and Alaska Native
Median household income ($) - Multirace
Median household income ($) - Other Race
Median household income for houses/condos with a mortgage ($)
Median household income for apartments without a mortgage ($)
Races - White alone (%)
Races - White alone (% change since 2000)
Races - Black alone (%)
Races - Black alone (% change since 2000)
Races - American Indian alone (%)
Races - American Indian alone (% change since 2000)
Races - Asian alone (%)
Races - Asian alone (% change since 2000)
Races - Hispanic (%)
Races - Hispanic (% change since 2000)
Races - Native Hawaiian and Other Pacific Islander alone (%)
Races - Native Hawaiian and Other Pacific Islander alone (% change since 2000)
Races - Two or more races (%)
Races - Two or more races (% change since 2000)
Races - Other race alone (%)
Races - Other race alone (% change since 2000)
Racial diversity
Unemployment (%)
Unemployment (% change since 2000)
Unemployment (%) - White
Unemployment (%) - Black or African American
Unemployment (%) - Asian
Unemployment (%) - Hispanic or Latino
Unemployment (%) - American Indian and Alaska Native
Unemployment (%) - Multirace
Unemployment (%) - Other Race
Population density (people per square mile)
Population - Males (%)
Population - Females (%)
Population - Males (%) - White
Population - Males (%) - Black or African American
Population - Males (%) - Asian
Population - Males (%) - Hispanic or Latino
Population - Males (%) - American Indian and Alaska Native
Population - Males (%) - Multirace
Population - Males (%) - Other Race
Population - Females (%) - White
Population - Females (%) - Black or African American
Population - Females (%) - Asian
Population - Females (%) - Hispanic or Latino
Population - Females (%) - American Indian and Alaska Native
Population - Females (%) - Multirace
Population - Females (%) - Other Race
Coronavirus confirmed cases (Apr 27, 2024)
Deaths caused by coronavirus (Apr 27, 2024)
Coronavirus confirmed cases (per 100k population) (Apr 27, 2024)
Deaths caused by coronavirus (per 100k population) (Apr 27, 2024)
Daily increase in number of cases (Apr 27, 2024)
Weekly increase in number of cases (Apr 27, 2024)
Cases doubled (in days) (Apr 27, 2024)
Hospitalized patients (Apr 18, 2022)
Negative test results (Apr 18, 2022)
Total test results (Apr 18, 2022)
COVID Vaccine doses distributed (per 100k population) (Sep 19, 2023)
COVID Vaccine doses administered (per 100k population) (Sep 19, 2023)
COVID Vaccine doses distributed (Sep 19, 2023)
COVID Vaccine doses administered (Sep 19, 2023)
Likely homosexual households (%)
Likely homosexual households (% change since 2000)
Likely homosexual households - Lesbian couples (%)
Likely homosexual households - Lesbian couples (% change since 2000)
Likely homosexual households - Gay men (%)
Likely homosexual households - Gay men (% change since 2000)
Cost of living index
Median gross rent ($)
Median contract rent ($)
Median monthly housing costs ($)
Median house or condo value ($)
Median house or condo value ($ change since 2000)
Mean house or condo value by units in structure - 1, detached ($)
Mean house or condo value by units in structure - 1, attached ($)
Mean house or condo value by units in structure - 2 ($)
Mean house or condo value by units in structure by units in structure - 3 or 4 ($)
Mean house or condo value by units in structure - 5 or more ($)
Mean house or condo value by units in structure - Boat, RV, van, etc. ($)
Mean house or condo value by units in structure - Mobile home ($)
Median house or condo value ($) - White
Median house or condo value ($) - Black or African American
Median house or condo value ($) - Asian
Median house or condo value ($) - Hispanic or Latino
Median house or condo value ($) - American Indian and Alaska Native
Median house or condo value ($) - Multirace
Median house or condo value ($) - Other Race
Median resident age
Resident age diversity
Median resident age - Males
Median resident age - Females
Median resident age - White
Median resident age - Black or African American
Median resident age - Asian
Median resident age - Hispanic or Latino
Median resident age - American Indian and Alaska Native
Median resident age - Multirace
Median resident age - Other Race
Median resident age - Males - White
Median resident age - Males - Black or African American
Median resident age - Males - Asian
Median resident age - Males - Hispanic or Latino
Median resident age - Males - American Indian and Alaska Native
Median resident age - Males - Multirace
Median resident age - Males - Other Race
Median resident age - Females - White
Median resident age - Females - Black or African American
Median resident age - Females - Asian
Median resident age - Females - Hispanic or Latino
Median resident age - Females - American Indian and Alaska Native
Median resident age - Females - Multirace
Median resident age - Females - Other Race
Commute - mean travel time to work (minutes)
Travel time to work - Less than 5 minutes (%)
Travel time to work - Less than 5 minutes (% change since 2000)
Travel time to work - 5 to 9 minutes (%)
Travel time to work - 5 to 9 minutes (% change since 2000)
Travel time to work - 10 to 19 minutes (%)
Travel time to work - 10 to 19 minutes (% change since 2000)
Travel time to work - 20 to 29 minutes (%)
Travel time to work - 20 to 29 minutes (% change since 2000)
Travel time to work - 30 to 39 minutes (%)
Travel time to work - 30 to 39 minutes (% change since 2000)
Travel time to work - 40 to 59 minutes (%)
Travel time to work - 40 to 59 minutes (% change since 2000)
Travel time to work - 60 to 89 minutes (%)
Travel time to work - 60 to 89 minutes (% change since 2000)
Travel time to work - 90 or more minutes (%)
Travel time to work - 90 or more minutes (% change since 2000)
Marital status - Never married (%)
Marital status - Now married (%)
Marital status - Separated (%)
Marital status - Widowed (%)
Marital status - Divorced (%)
Median family income ($)
Median family income (% change since 2000)
Median non-family income ($)
Median non-family income (% change since 2000)
Median per capita income ($)
Median per capita income (% change since 2000)
Median family income ($) - White
Median family income ($) - Black or African American
Median family income ($) - Asian
Median family income ($) - Hispanic or Latino
Median family income ($) - American Indian and Alaska Native
Median family income ($) - Multirace
Median family income ($) - Other Race
Median year house/condo built
Median year apartment built
Year house built - Built 2005 or later (%)
Year house built - Built 2000 to 2004 (%)
Year house built - Built 1990 to 1999 (%)
Year house built - Built 1980 to 1989 (%)
Year house built - Built 1970 to 1979 (%)
Year house built - Built 1960 to 1969 (%)
Year house built - Built 1950 to 1959 (%)
Year house built - Built 1940 to 1949 (%)
Year house built - Built 1939 or earlier (%)
Average household size
Household density (households per square mile)
Average household size - White
Average household size - Black or African American
Average household size - Asian
Average household size - Hispanic or Latino
Average household size - American Indian and Alaska Native
Average household size - Multirace
Average household size - Other Race
Occupied housing units (%)
Vacant housing units (%)
Owner occupied housing units (%)
Renter occupied housing units (%)
Vacancy status - For rent (%)
Vacancy status - For sale only (%)
Vacancy status - Rented or sold, not occupied (%)
Vacancy status - For seasonal, recreational, or occasional use (%)
Vacancy status - For migrant workers (%)
Vacancy status - Other vacant (%)
Residents with income below the poverty level (%)
Residents with income below 50% of the poverty level (%)
Children below poverty level (%)
Poor families by family type - Married-couple family (%)
Poor families by family type - Male, no wife present (%)
Poor families by family type - Female, no husband present (%)
Poverty status for native-born residents (%)
Poverty status for foreign-born residents (%)
Poverty among high school graduates not in families (%)
Poverty among people who did not graduate high school not in families (%)
Residents with income below the poverty level (%) - White
Residents with income below the poverty level (%) - Black or African American
Residents with income below the poverty level (%) - Asian
Residents with income below the poverty level (%) - Hispanic or Latino
Residents with income below the poverty level (%) - American Indian and Alaska Native
Residents with income below the poverty level (%) - Multirace
Residents with income below the poverty level (%) - Other Race
Air pollution - Air Quality Index (AQI)
Air pollution - CO
Air pollution - NO2
Air pollution - SO2
Air pollution - Ozone
Air pollution - PM10
Air pollution - PM25
Air pollution - Pb
Crime - Murders per 100,000 population
Crime - Rapes per 100,000 population
Crime - Robberies per 100,000 population
Crime - Assaults per 100,000 population
Crime - Burglaries per 100,000 population
Crime - Thefts per 100,000 population
Crime - Auto thefts per 100,000 population
Crime - Arson per 100,000 population
Crime - City-data.com crime index
Crime - Violent crime index
Crime - Property crime index
Crime - Murders per 100,000 population (5 year average)
Crime - Rapes per 100,000 population (5 year average)
Crime - Robberies per 100,000 population (5 year average)
Crime - Assaults per 100,000 population (5 year average)
Crime - Burglaries per 100,000 population (5 year average)
Crime - Thefts per 100,000 population (5 year average)
Crime - Auto thefts per 100,000 population (5 year average)
Crime - Arson per 100,000 population (5 year average)
Crime - City-data.com crime index (5 year average)
Crime - Violent crime index (5 year average)
Crime - Property crime index (5 year average)
1996 Presidential Elections Results (%) - Democratic Party (Clinton)
1996 Presidential Elections Results (%) - Republican Party (Dole)
1996 Presidential Elections Results (%) - Other
2000 Presidential Elections Results (%) - Democratic Party (Gore)
2000 Presidential Elections Results (%) - Republican Party (Bush)
2000 Presidential Elections Results (%) - Other
2004 Presidential Elections Results (%) - Democratic Party (Kerry)
2004 Presidential Elections Results (%) - Republican Party (Bush)
2004 Presidential Elections Results (%) - Other
2008 Presidential Elections Results (%) - Democratic Party (Obama)
2008 Presidential Elections Results (%) - Republican Party (McCain)
2008 Presidential Elections Results (%) - Other
2012 Presidential Elections Results (%) - Democratic Party (Obama)
2012 Presidential Elections Results (%) - Republican Party (Romney)
2012 Presidential Elections Results (%) - Other
2016 Presidential Elections Results (%) - Democratic Party (Clinton)
2016 Presidential Elections Results (%) - Republican Party (Trump)
2016 Presidential Elections Results (%) - Other
2020 Presidential Elections Results (%) - Democratic Party (Biden)
2020 Presidential Elections Results (%) - Republican Party (Trump)
2020 Presidential Elections Results (%) - Other
Ancestries Reported - Arab (%)
Ancestries Reported - Czech (%)
Ancestries Reported - Danish (%)
Ancestries Reported - Dutch (%)
Ancestries Reported - English (%)
Ancestries Reported - French (%)
Ancestries Reported - French Canadian (%)
Ancestries Reported - German (%)
Ancestries Reported - Greek (%)
Ancestries Reported - Hungarian (%)
Ancestries Reported - Irish (%)
Ancestries Reported - Italian (%)
Ancestries Reported - Lithuanian (%)
Ancestries Reported - Norwegian (%)
Ancestries Reported - Polish (%)
Ancestries Reported - Portuguese (%)
Ancestries Reported - Russian (%)
Ancestries Reported - Scotch-Irish (%)
Ancestries Reported - Scottish (%)
Ancestries Reported - Slovak (%)
Ancestries Reported - Subsaharan African (%)
Ancestries Reported - Swedish (%)
Ancestries Reported - Swiss (%)
Ancestries Reported - Ukrainian (%)
Ancestries Reported - United States (%)
Ancestries Reported - Welsh (%)
Ancestries Reported - West Indian (%)
Ancestries Reported - Other (%)
Educational Attainment - No schooling completed (%)
Educational Attainment - Less than high school (%)
Educational Attainment - High school or equivalent (%)
Educational Attainment - Less than 1 year of college (%)
Educational Attainment - 1 or more years of college (%)
Educational Attainment - Associate degree (%)
Educational Attainment - Bachelor's degree (%)
Educational Attainment - Master's degree (%)
Educational Attainment - Professional school degree (%)
Educational Attainment - Doctorate degree (%)
School Enrollment - Nursery, preschool (%)
School Enrollment - Kindergarten (%)
School Enrollment - Grade 1 to 4 (%)
School Enrollment - Grade 5 to 8 (%)
School Enrollment - Grade 9 to 12 (%)
School Enrollment - College undergrad (%)
School Enrollment - Graduate or professional (%)
School Enrollment - Not enrolled in school (%)
School enrollment - Public schools (%)
School enrollment - Private schools (%)
School enrollment - Not enrolled (%)
Median number of rooms in houses and condos
Median number of rooms in apartments
Housing units lacking complete plumbing facilities (%)
Housing units lacking complete kitchen facilities (%)
Density of houses
Urban houses (%)
Rural houses (%)
Households with people 60 years and over (%)
Households with people 65 years and over (%)
Households with people 75 years and over (%)
Households with one or more nonrelatives (%)
Households with no nonrelatives (%)
Population in households (%)
Family households (%)
Nonfamily households (%)
Population in families (%)
Family households with own children (%)
Median number of bedrooms in owner occupied houses
Mean number of bedrooms in owner occupied houses
Median number of bedrooms in renter occupied houses
Mean number of bedrooms in renter occupied houses
Median number of vehichles in owner occupied houses
Mean number of vehichles in owner occupied houses
Median number of vehichles in renter occupied houses
Mean number of vehichles in renter occupied houses
Mortgage status - with mortgage (%)
Mortgage status - with second mortgage (%)
Mortgage status - with home equity loan (%)
Mortgage status - with both second mortgage and home equity loan (%)
Mortgage status - without a mortgage (%)
Average family size
Average family size - White
Average family size - Black or African American
Average family size - Asian
Average family size - Hispanic or Latino
Average family size - American Indian and Alaska Native
Average family size - Multirace
Average family size - Other Race
Geographical mobility - Same house 1 year ago (%)
Geographical mobility - Moved within same county (%)
Geographical mobility - Moved from different county within same state (%)
Geographical mobility - Moved from different state (%)
Geographical mobility - Moved from abroad (%)
Place of birth - Born in state of residence (%)
Place of birth - Born in other state (%)
Place of birth - Native, outside of US (%)
Place of birth - Foreign born (%)
Housing units in structures - 1, detached (%)
Housing units in structures - 1, attached (%)
Housing units in structures - 2 (%)
Housing units in structures - 3 or 4 (%)
Housing units in structures - 5 to 9 (%)
Housing units in structures - 10 to 19 (%)
Housing units in structures - 20 to 49 (%)
Housing units in structures - 50 or more (%)
Housing units in structures - Mobile home (%)
Housing units in structures - Boat, RV, van, etc. (%)
House/condo owner moved in on average (years ago)
Renter moved in on average (years ago)
Year householder moved into unit - Moved in 1999 to March 2000 (%)
Year householder moved into unit - Moved in 1995 to 1998 (%)
Year householder moved into unit - Moved in 1990 to 1994 (%)
Year householder moved into unit - Moved in 1980 to 1989 (%)
Year householder moved into unit - Moved in 1970 to 1979 (%)
Year householder moved into unit - Moved in 1969 or earlier (%)
Means of transportation to work - Drove car alone (%)
Means of transportation to work - Carpooled (%)
Means of transportation to work - Public transportation (%)
Means of transportation to work - Bus or trolley bus (%)
Means of transportation to work - Streetcar or trolley car (%)
Means of transportation to work - Subway or elevated (%)
Means of transportation to work - Railroad (%)
Means of transportation to work - Ferryboat (%)
Means of transportation to work - Taxicab (%)
Means of transportation to work - Motorcycle (%)
Means of transportation to work - Bicycle (%)
Means of transportation to work - Walked (%)
Means of transportation to work - Other means (%)
Working at home (%)
Industry diversity
Most Common Industries - Agriculture, forestry, fishing and hunting, and mining (%)
Most Common Industries - Agriculture, forestry, fishing and hunting (%)
Most Common Industries - Mining, quarrying, and oil and gas extraction (%)
Most Common Industries - Construction (%)
Most Common Industries - Manufacturing (%)
Most Common Industries - Wholesale trade (%)
Most Common Industries - Retail trade (%)
Most Common Industries - Transportation and warehousing, and utilities (%)
Most Common Industries - Transportation and warehousing (%)
Most Common Industries - Utilities (%)
Most Common Industries - Information (%)
Most Common Industries - Finance and insurance, and real estate and rental and leasing (%)
Most Common Industries - Finance and insurance (%)
Most Common Industries - Real estate and rental and leasing (%)
Most Common Industries - Professional, scientific, and management, and administrative and waste management services (%)
Most Common Industries - Professional, scientific, and technical services (%)
Most Common Industries - Management of companies and enterprises (%)
Most Common Industries - Administrative and support and waste management services (%)
Most Common Industries - Educational services, and health care and social assistance (%)
Most Common Industries - Educational services (%)
Most Common Industries - Health care and social assistance (%)
Most Common Industries - Arts, entertainment, and recreation, and accommodation and food services (%)
Most Common Industries - Arts, entertainment, and recreation (%)
Most Common Industries - Accommodation and food services (%)
Most Common Industries - Other services, except public administration (%)
Most Common Industries - Public administration (%)
Occupation diversity
Most Common Occupations - Management, business, science, and arts occupations (%)
Most Common Occupations - Management, business, and financial occupations (%)
Most Common Occupations - Management occupations (%)
Most Common Occupations - Business and financial operations occupations (%)
Most Common Occupations - Computer, engineering, and science occupations (%)
Most Common Occupations - Computer and mathematical occupations (%)
Most Common Occupations - Architecture and engineering occupations (%)
Most Common Occupations - Life, physical, and social science occupations (%)
Most Common Occupations - Education, legal, community service, arts, and media occupations (%)
Most Common Occupations - Community and social service occupations (%)
Most Common Occupations - Legal occupations (%)
Most Common Occupations - Education, training, and library occupations (%)
Most Common Occupations - Arts, design, entertainment, sports, and media occupations (%)
Most Common Occupations - Healthcare practitioners and technical occupations (%)
Most Common Occupations - Health diagnosing and treating practitioners and other technical occupations (%)
Most Common Occupations - Health technologists and technicians (%)
Most Common Occupations - Service occupations (%)
Most Common Occupations - Healthcare support occupations (%)
Most Common Occupations - Protective service occupations (%)
Most Common Occupations - Fire fighting and prevention, and other protective service workers including supervisors (%)
Most Common Occupations - Law enforcement workers including supervisors (%)
Most Common Occupations - Food preparation and serving related occupations (%)
Most Common Occupations - Building and grounds cleaning and maintenance occupations (%)
Most Common Occupations - Personal care and service occupations (%)
Most Common Occupations - Sales and office occupations (%)
Most Common Occupations - Sales and related occupations (%)
Most Common Occupations - Office and administrative support occupations (%)
Most Common Occupations - Natural resources, construction, and maintenance occupations (%)
Most Common Occupations - Farming, fishing, and forestry occupations (%)
Most Common Occupations - Construction and extraction occupations (%)
Most Common Occupations - Installation, maintenance, and repair occupations (%)
Most Common Occupations - Production, transportation, and material moving occupations (%)
Most Common Occupations - Production occupations (%)
Most Common Occupations - Transportation occupations (%)
Most Common Occupations - Material moving occupations (%)
People in Group quarters - Institutionalized population (%)
People in Group quarters - Correctional institutions (%)
People in Group quarters - Federal prisons and detention centers (%)
People in Group quarters - Halfway houses (%)
People in Group quarters - Local jails and other confinement facilities (including police lockups) (%)
People in Group quarters - Military disciplinary barracks (%)
People in Group quarters - State prisons (%)
People in Group quarters - Other types of correctional institutions (%)
People in Group quarters - Nursing homes (%)
People in Group quarters - Hospitals/wards, hospices, and schools for the handicapped (%)
People in Group quarters - Hospitals/wards and hospices for chronically ill (%)
People in Group quarters - Hospices or homes for chronically ill (%)
People in Group quarters - Military hospitals or wards for chronically ill (%)
People in Group quarters - Other hospitals or wards for chronically ill (%)
People in Group quarters - Hospitals or wards for drug/alcohol abuse (%)
People in Group quarters - Mental (Psychiatric) hospitals or wards (%)
People in Group quarters - Schools, hospitals, or wards for the mentally retarded (%)
People in Group quarters - Schools, hospitals, or wards for the physically handicapped (%)
People in Group quarters - Institutions for the deaf (%)
People in Group quarters - Institutions for the blind (%)
People in Group quarters - Orthopedic wards and institutions for the physically handicapped (%)
People in Group quarters - Wards in general hospitals for patients who have no usual home elsewhere (%)
People in Group quarters - Wards in military hospitals for patients who have no usual home elsewhere (%)
People in Group quarters - Juvenile institutions (%)
People in Group quarters - Long-term care (%)
People in Group quarters - Homes for abused, dependent, and neglected children (%)
People in Group quarters - Residential treatment centers for emotionally disturbed children (%)
People in Group quarters - Training schools for juvenile delinquents (%)
People in Group quarters - Short-term care, detention or diagnostic centers for delinquent children (%)
People in Group quarters - Type of juvenile institution unknown (%)
People in Group quarters - Noninstitutionalized population (%)
People in Group quarters - College dormitories (includes college quarters off campus) (%)
People in Group quarters - Military quarters (%)
People in Group quarters - On base (%)
People in Group quarters - Barracks, unaccompanied personnel housing (UPH), (Enlisted/Officer), ;and similar group living quarters for military personnel (%)
People in Group quarters - Transient quarters for temporary residents (%)
People in Group quarters - Military ships (%)
People in Group quarters - Group homes (%)
People in Group quarters - Homes or halfway houses for drug/alcohol abuse (%)
People in Group quarters - Homes for the mentally ill (%)
People in Group quarters - Homes for the mentally retarded (%)
People in Group quarters - Homes for the physically handicapped (%)
People in Group quarters - Other group homes (%)
People in Group quarters - Religious group quarters (%)
People in Group quarters - Dormitories (%)
People in Group quarters - Agriculture workers' dormitories on farms (%)
People in Group quarters - Job Corps and vocational training facilities (%)
People in Group quarters - Other workers' dormitories (%)
People in Group quarters - Crews of maritime vessels (%)
People in Group quarters - Other nonhousehold living situations (%)
People in Group quarters - Other noninstitutional group quarters (%)
Residents speaking English at home (%)
Residents speaking English at home - Born in the United States (%)
Residents speaking English at home - Native, born elsewhere (%)
Residents speaking English at home - Foreign born (%)
Residents speaking Spanish at home (%)
Residents speaking Spanish at home - Born in the United States (%)
Residents speaking Spanish at home - Native, born elsewhere (%)
Residents speaking Spanish at home - Foreign born (%)
Residents speaking other language at home (%)
Residents speaking other language at home - Born in the United States (%)
Residents speaking other language at home - Native, born elsewhere (%)
Residents speaking other language at home - Foreign born (%)
Class of Workers - Employee of private company (%)
Class of Workers - Self-employed in own incorporated business (%)
Class of Workers - Private not-for-profit wage and salary workers (%)
Class of Workers - Local government workers (%)
Class of Workers - State government workers (%)
Class of Workers - Federal government workers (%)
Class of Workers - Self-employed workers in own not incorporated business and Unpaid family workers (%)
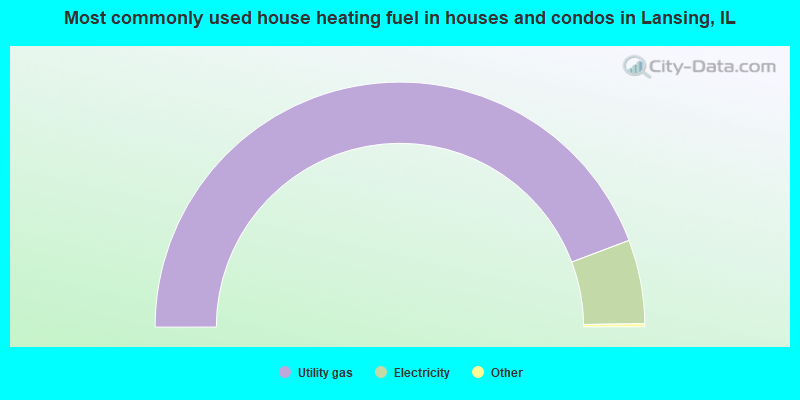
House heating fuel used in houses and condos - Utility gas (%)
House heating fuel used in houses and condos - Bottled, tank, or LP gas (%)
House heating fuel used in houses and condos - Electricity (%)
House heating fuel used in houses and condos - Fuel oil, kerosene, etc. (%)
House heating fuel used in houses and condos - Coal or coke (%)
House heating fuel used in houses and condos - Wood (%)
House heating fuel used in houses and condos - Solar energy (%)
House heating fuel used in houses and condos - Other fuel (%)
House heating fuel used in houses and condos - No fuel used (%)
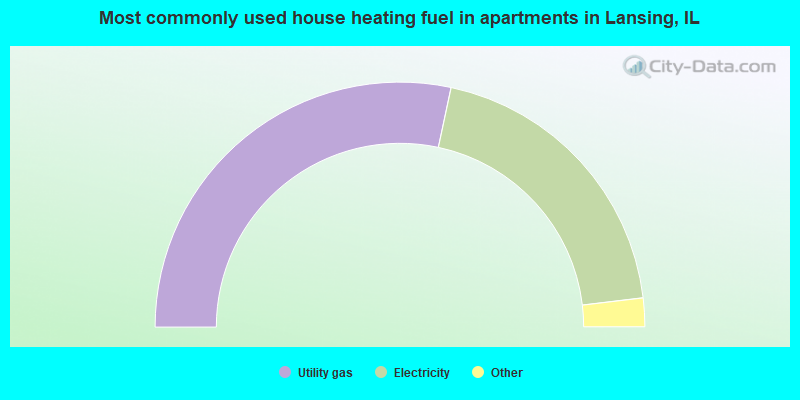
House heating fuel used in apartments - Utility gas (%)
House heating fuel used in apartments - Bottled, tank, or LP gas (%)
House heating fuel used in apartments - Electricity (%)
House heating fuel used in apartments - Fuel oil, kerosene, etc. (%)
House heating fuel used in apartments - Coal or coke (%)
House heating fuel used in apartments - Wood (%)
House heating fuel used in apartments - Solar energy (%)
House heating fuel used in apartments - Other fuel (%)
House heating fuel used in apartments - No fuel used (%)
Armed forces status - In Armed Forces (%)
Armed forces status - Civilian (%)
Armed forces status - Civilian - Veteran (%)
Armed forces status - Civilian - Nonveteran (%)
Fatal accidents locations in years 2005-2021
Fatal accidents locations in 2005
Fatal accidents locations in 2006
Fatal accidents locations in 2007
Fatal accidents locations in 2008
Fatal accidents locations in 2009
Fatal accidents locations in 2010
Fatal accidents locations in 2011
Fatal accidents locations in 2012
Fatal accidents locations in 2013
Fatal accidents locations in 2014
Fatal accidents locations in 2015
Fatal accidents locations in 2016
Fatal accidents locations in 2017
Fatal accidents locations in 2018
Fatal accidents locations in 2019
Fatal accidents locations in 2020
Fatal accidents locations in 2021
Alcohol use - People drinking some alcohol every month (%)
Alcohol use - People not drinking at all (%)
Alcohol use - Average days/month drinking alcohol
Alcohol use - Average drinks/week
Alcohol use - Average days/year people drink much
Audiometry - Average condition of hearing (%)
Audiometry - People that can hear a whisper from across a quiet room (%)
Audiometry - People that can hear normal voice from across a quiet room (%)
Audiometry - Ears ringing, roaring, buzzing (%)
Audiometry - Had a job exposure to loud noise (%)
Audiometry - Had off-work exposure to loud noise (%)
Blood Pressure & Cholesterol - Has high blood pressure (%)
Blood Pressure & Cholesterol - Checking blood pressure at home (%)
Blood Pressure & Cholesterol - Frequently checking blood cholesterol (%)
Blood Pressure & Cholesterol - Has high cholesterol level (%)
Consumer Behavior - Money monthly spent on food at supermarket/grocery store
Consumer Behavior - Money monthly spent on food at other stores
Consumer Behavior - Money monthly spent on eating out
Consumer Behavior - Money monthly spent on carryout/delivered foods
Consumer Behavior - Income spent on food at supermarket/grocery store (%)
Consumer Behavior - Income spent on food at other stores (%)
Consumer Behavior - Income spent on eating out (%)
Consumer Behavior - Income spent on carryout/delivered foods (%)
Current Health Status - General health condition (%)
Current Health Status - Blood donors (%)
Current Health Status - Has blood ever tested for HIV virus (%)
Current Health Status - Left-handed people (%)
Dermatology - People using sunscreen (%)
Diabetes - Diabetics (%)
Diabetes - Had a blood test for high blood sugar (%)
Diabetes - People taking insulin (%)
Diet Behavior & Nutrition - Diet health (%)
Diet Behavior & Nutrition - Milk product consumption (# of products/month)
Diet Behavior & Nutrition - Meals not home prepared (#/week)
Diet Behavior & Nutrition - Meals from fast food or pizza place (#/week)
Diet Behavior & Nutrition - Ready-to-eat foods (#/month)
Diet Behavior & Nutrition - Frozen meals/pizza (#/month)
Drug Use - People that ever used marijuana or hashish (%)
Drug Use - Ever used hard drugs (%)
Drug Use - Ever used any form of cocaine (%)
Drug Use - Ever used heroin (%)
Drug Use - Ever used methamphetamine (%)
Health Insurance - People covered by health insurance (%)
Kidney Conditions-Urology - Avg. # of times urinating at night
Medical Conditions - People with asthma (%)
Medical Conditions - People with anemia (%)
Medical Conditions - People with psoriasis (%)
Medical Conditions - People with overweight (%)
Medical Conditions - Elderly people having difficulties in thinking or remembering (%)
Medical Conditions - People who ever received blood transfusion (%)
Medical Conditions - People having trouble seeing even with glass/contacts (%)
Medical Conditions - People with arthritis (%)
Medical Conditions - People with gout (%)
Medical Conditions - People with congestive heart failure (%)
Medical Conditions - People with coronary heart disease (%)
Medical Conditions - People with angina pectoris (%)
Medical Conditions - People who ever had heart attack (%)
Medical Conditions - People who ever had stroke (%)
Medical Conditions - People with emphysema (%)
Medical Conditions - People with thyroid problem (%)
Medical Conditions - People with chronic bronchitis (%)
Medical Conditions - People with any liver condition (%)
Medical Conditions - People who ever had cancer or malignancy (%)
Mental Health - People who have little interest in doing things (%)
Mental Health - People feeling down, depressed, or hopeless (%)
Mental Health - People who have trouble sleeping or sleeping too much (%)
Mental Health - People feeling tired or having little energy (%)
Mental Health - People with poor appetite or overeating (%)
Mental Health - People feeling bad about themself (%)
Mental Health - People who have trouble concentrating on things (%)
Mental Health - People moving or speaking slowly or too fast (%)
Mental Health - People having thoughts they would be better off dead (%)
Oral Health - Average years since last visit a dentist
Oral Health - People embarrassed because of mouth (%)
Oral Health - People with gum disease (%)
Oral Health - General health of teeth and gums (%)
Oral Health - Average days a week using dental floss/device
Oral Health - Average days a week using mouthwash for dental problem
Oral Health - Average number of teeth
Pesticide Use - Households using pesticides to control insects (%)
Pesticide Use - Households using pesticides to kill weeds (%)
Physical Activity - People doing vigorous-intensity work activities (%)
Physical Activity - People doing moderate-intensity work activities (%)
Physical Activity - People walking or bicycling (%)
Physical Activity - People doing vigorous-intensity recreational activities (%)
Physical Activity - People doing moderate-intensity recreational activities (%)
Physical Activity - Average hours a day doing sedentary activities
Physical Activity - Average hours a day watching TV or videos
Physical Activity - Average hours a day using computer
Physical Functioning - People having limitations keeping them from working (%)
Physical Functioning - People limited in amount of work they can do (%)
Physical Functioning - People that need special equipment to walk (%)
Physical Functioning - People experiencing confusion/memory problems (%)
Physical Functioning - People requiring special healthcare equipment (%)
Prescription Medications - Average number of prescription medicines taking
Preventive Aspirin Use - Adults 40+ taking low-dose aspirin (%)
Reproductive Health - Vaginal deliveries (%)
Reproductive Health - Cesarean deliveries (%)
Reproductive Health - Deliveries resulted in a live birth (%)
Reproductive Health - Pregnancies resulted in a delivery (%)
Reproductive Health - Women breastfeeding newborns (%)
Reproductive Health - Women that had a hysterectomy (%)
Reproductive Health - Women that had both ovaries removed (%)
Reproductive Health - Women that have ever taken birth control pills (%)
Reproductive Health - Women taking birth control pills (%)
Reproductive Health - Women that have ever used Depo-Provera or injectables (%)
Reproductive Health - Women that have ever used female hormones (%)
Sexual Behavior - People 18+ that ever had sex (vaginal, anal, or oral) (%)
Sexual Behavior - Males 18+ that ever had vaginal sex with a woman (%)
Sexual Behavior - Males 18+ that ever performed oral sex on a woman (%)
Sexual Behavior - Males 18+ that ever had anal sex with a woman (%)
Sexual Behavior - Males 18+ that ever had any sex with a man (%)
Sexual Behavior - Females 18+ that ever had vaginal sex with a man (%)
Sexual Behavior - Females 18+ that ever performed oral sex on a man (%)
Sexual Behavior - Females 18+ that ever had anal sex with a man (%)
Sexual Behavior - Females 18+ that ever had any kind of sex with a woman (%)
Sexual Behavior - Average age people first had sex
Sexual Behavior - Average number of female sex partners in lifetime (males 18+)
Sexual Behavior - Average number of female vaginal sex partners in lifetime (males 18+)
Sexual Behavior - Average age people first performed oral sex on a woman (18+)
Sexual Behavior - Average number of woman performed oral sex on in lifetime (18+)
Sexual Behavior - Average number of male sex partners in lifetime (males 18+)
Sexual Behavior - Average number of male anal sex partners in lifetime (males 18+)
Sexual Behavior - Average age people first performed oral sex on a man (18+)
Sexual Behavior - Average number of male oral sex partners in lifetime (18+)
Sexual Behavior - People using protection when performing oral sex (%)
Sexual Behavior - Average number of times people have vaginal or anal sex a year
Sexual Behavior - People having sex without condom (%)
Sexual Behavior - Average number of male sex partners in lifetime (females 18+)
Sexual Behavior - Average number of male vaginal sex partners in lifetime (females 18+)
Sexual Behavior - Average number of female sex partners in lifetime (females 18+)
Sexual Behavior - Circumcised males 18+ (%)
Sleep Disorders - Average hours sleeping at night
Sleep Disorders - People that has trouble sleeping (%)
Smoking-Cigarette Use - People smoking cigarettes (%)
Taste & Smell - People 40+ having problems with smell (%)
Taste & Smell - People 40+ having problems with taste (%)
Taste & Smell - People 40+ that ever had wisdom teeth removed (%)
Taste & Smell - People 40+ that ever had tonsils teeth removed (%)
Taste & Smell - People 40+ that ever had a loss of consciousness because of a head injury (%)
Taste & Smell - People 40+ that ever had a broken nose or other serious injury to face or skull (%)
Taste & Smell - People 40+ that ever had two or more sinus infections (%)
Weight - Average height (inches)
Weight - Average weight (pounds)
Weight - Average BMI
Weight - People that are obese (%)
Weight - People that ever were obese (%)
Weight - People trying to lose weight (%)
According to our research of Illinois and other state lists, there were 35 registered sex offenders living in Lansing, Illinois as of April 26, 2024 . The ratio of all residents to sex offenders in Lansing is 807 to 1.The ratio of registered sex offenders to all residents in this city is near the state average.
Officers per 1,000 residents here:
2.05Illinois average:
3.04
Latest news from Lansing, IL collected exclusively by city-data.com from local newspapers, TV, and radio stations
Ancestries: Polish (3.7%), Dutch (2.3%), German (1.9%), Nigerian (1.5%), African (1.5%), Italian (1.4%).
Current Local Time:
Incorporated on 03/30/1893
Land area: 6.76 square miles.
Population density: 4,140 people per square mile (average).
2,934 residents are foreign born (6.1% Latin America , 2.0% Asia , 1.5% Africa ).
This village:
10.5%Illinois:
14.1%
Median real estate property taxes paid for housing units with mortgages in 2022: $4,429 (2.7%)Median real estate property taxes paid for housing units with no mortgage in 2022: $4,590 (2.8%)
Nearest city with pop. 50,000+: Hammond, IN
Nearest city with pop. 200,000+: Chicago, IL
Nearest cities:
Latitude: 41.57 N, Longitude: 87.55 W
Daytime population change due to commuting: -5,370 (-19.1%)Workers who live and work in this village: 2,569 (19.4%)
Single-family new house construction building permits:
2009: 2 buildings , average cost: $135,4002008: 7 buildings , average cost: $60,8002007: 11 buildings , average cost: $112,8002006: 8 buildings , average cost: $205,1002005: 35 buildings , average cost: $167,1002004: 29 buildings , average cost: $139,2002003: 23 buildings , average cost: $139,9002002: 59 buildings , average cost: $124,1002001: 22 buildings , average cost: $126,9002000: 6 buildings , average cost: $209,2001999: 22 buildings , average cost: $73,0001998: 21 buildings , average cost: $98,5001997: 17 buildings , average cost: $102,900Unemployment in December 2023:
Population change in the 1990s: +144 (+0.5%).
Most common industries in Lansing, IL (%)
Both Males Females
Health care (9.7%)
Construction (9.0%)
Educational services (7.6%)
Professional, scientific, technical services (5.7%)
Finance & insurance (5.1%)
Public administration (4.9%)
Metal & metal products (4.7%)
Construction (15.1%)
Metal & metal products (7.5%)
Public administration (6.5%)
Educational services (4.4%)
Accommodation & food services (4.2%)
Truck transportation (4.0%)
Professional, scientific, technical services (3.9%)
Health care (16.8%)
Educational services (11.1%)
Finance & insurance (8.0%)
Professional, scientific, technical services (7.7%)
Accommodation & food services (5.0%)
Social assistance (3.5%)
Religious, grantmaking, civic, professional, similar organizations (3.0%)
Most common occupations in Lansing, IL (%)
Both Males Females
Other office and administrative support workers, including supervisors (5.2%)
Secretaries and administrative assistants (4.5%)
Other management occupations, except farmers and farm managers (4.0%)
Other sales and related occupations, including supervisors (3.7%)
Electrical equipment mechanics and other installation, maintenance, and repair workers, including supervisors (3.6%)
Other production occupations, including supervisors (3.3%)
Driver/sales workers and truck drivers (3.1%)
Electrical equipment mechanics and other installation, maintenance, and repair workers, including supervisors (6.4%)
Driver/sales workers and truck drivers (5.7%)
Other production occupations, including supervisors (5.3%)
Other management occupations, except farmers and farm managers (4.5%)
Material recording, scheduling, dispatching, and distributing workers (3.6%)
Law enforcement workers, including supervisors (3.4%)
Other sales and related occupations, including supervisors (3.4%)
Secretaries and administrative assistants (9.6%)
Other office and administrative support workers, including supervisors (8.4%)
Preschool, kindergarten, elementary, and middle school teachers (5.0%)
Registered nurses (5.0%)
Information and record clerks, except customer service representatives (4.3%)
Other sales and related occupations, including supervisors (4.0%)
Cashiers (3.7%)
Tornado activity:
Lansing-area historical tornado activity is near Illinois state average. It is 60% greater than the overall U.S. average.
On 8/28/1990, a category F5 (max. wind speeds 261-318 mph) tornado 28.9 miles away from the Lansing village center killed 29 people and injured 350 people and caused between $50,000 and $500,000 in damages.
On 4/21/1967, a category F4 (max. wind speeds 207-260 mph) tornado 11.4 miles away from the village center killed 33 people and injured 500 people and caused between $5,000,000 and $50,000,000 in damages.
Earthquake activity:
Lansing-area historical earthquake activity is significantly above Illinois state average. It is 42% greater than the overall U.S. average. On 4/18/2008 at 09:36:59, a magnitude 5.4 (5.1 MB, 4.8 MS, 5.4 MW, 5.2 MW, Class: Moderate, Intensity: VI - VII) earthquake occurred 216.1 miles away from Lansing center On 6/10/1987 at 23:48:54, a magnitude 5.1 (4.9 MB, 4.4 MS, 4.6 MS, 5.1 LG) earthquake occurred 190.7 miles away from Lansing center On 4/18/2008 at 09:36:59, a magnitude 5.2 (5.2 MW, Depth: 8.9 mi) earthquake occurred 216.2 miles away from the city center On 6/28/2004 at 06:10:52, a magnitude 4.2 (4.2 MW, Depth: 6.2 mi, Class: Light, Intensity: IV - V) earthquake occurred 70.5 miles away from Lansing center On 6/18/2002 at 17:37:15, a magnitude 5.0 (4.3 MB, 4.6 MW, 5.0 LG) earthquake occurred 247.8 miles away from the city center On 4/18/2008 at 15:14:16, a magnitude 4.8 (4.5 MB, 4.8 MW, 4.6 MW) earthquake occurred 214.3 miles away from Lansing center Magnitude types: regional Lg-wave magnitude (LG), body-wave magnitude (MB), surface-wave magnitude (MS), moment magnitude (MW) Natural disasters: The number of natural disasters in Cook County (20) is greater than the US average (15).Major Disasters (Presidential) Declared: 15Emergencies Declared: 4Floods: 13, Storms: 12, Tornadoes: 3, Snowstorms: 2, Winter Storms: 2, Blizzard: 1, Hurricane: 1, Snow: 1, Wind: 1, Other: 1 (Note: some incidents may be assigned to more than one category). Hospitals and medical centers in Lansing: BLUE SKIES HOSPICE OF ILLINOIS (17825 WENTWORTH) HOSPICE OF THE CALUMET AREA IN (3224 RIDGE ROAD, SUITE 202 AND 203) A AND Z HOME HEALTH CARE, INC (3232 RIDGE ROAD, SUITE 1)
ALLCARE HOME HEALTH, INC. (1905 BERNICE ROAD SUITE 1)
ANREX HEALTH CARE (3601 RIDGE ROAD)
DOMINION HOME HEALTH CARE, INC (3043 RIDGE ROAD, STE 102)
HEART AT HOME HEALTH CARE OF THE MIDWEST, LLC (3365 RIDGE ROAD, STE 3)
QUALITY HOME HEALTH, LLC (18525 TORRENCE AVENUE SUITE C5)
SAINT MARGARET MERCY HOME CARE (3224 RIDGE ROAD SUITE 202 203)
TRI-STATE NURSING AND REHAB CTR (2500 EAST 175TH STREET)
Amtrak stations near Lansing: 5 miles: DYER (SHEFFIELD RD.) Services: enclosed waiting area, public payphones, free short-term parking, free long-term parking.
7 miles: HOMEWOOD (181 1ST ST. & PARK AVE.) Services: ticket office, enclosed waiting area, public restrooms, public payphones, paid short-term parking, paid long-term parking, public transit connection.
10 miles: HAMMOND-WHITING (HAMMOND, 1135 CALUMET AVE.) Services: ticket office, partially wheelchair accessible, enclosed waiting area, public restrooms, public payphones, free short-term parking, free long-term parking, call for taxi service.
Colleges/universities with over 2000 students nearest to Lansing:
Purdue University-Calumet Campus (about 4 miles; Hammond, IN ; Full-time enrollment: 7,343)
South Suburban College (about 5 miles; South Holland, IL ; FT enrollment: 3,972)
Prairie State College (about 6 miles; Chicago Heights, IL ; FT enrollment: 4,050)
City Colleges of Chicago-Olive-Harvey College (about 11 miles; Chicago, IL ; FT enrollment: 4,110)
Indiana University-Northwest (about 11 miles; Gary, IN ; FT enrollment: 4,390)
Chicago State University (about 12 miles; Chicago, IL ; FT enrollment: 4,352)
Governors State University (about 13 miles; University Park, IL ; FT enrollment: 4,043)
Public high school in Lansing:
Private high schools in Lansing: ILLIANA CHRISTIAN HIGH SCHOOL Students: 584, Location: 2261 INDIANA AVE, Grades: 9-12)
LUTHER EAST HIGH SCHOOL Students: 62, Location: 2750 GLENWOOD LANSING RD, Grades: 9-12)
Public elementary/middle schools in Lansing: MEMORIAL JR HIGH SCHOOL Students: 913, Location: 2721 RIDGE RD, Grades: 6-8)COOLIDGE ELEMENTARY SCHOOL Students: 672, Location: 17845 HENRY ST, Grades: KG-5)NATHAN HALE ELEM SCHOOL Students: 592, Location: 19055 BURNHAM AVE, Grades: PK-4)OAK GLEN ELEM SCHOOL Students: 480, Location: 2101 182ND ST, Grades: KG-5)REAVIS ELEM SCHOOL Students: 328, Location: 17121 ROY ST, Grades: KG-5)LESTER CRAWL PRIMARY CTR Students: 76, Location: 18300 GREENBAY AVE, Grades: PK-1)HERITAGE MIDDLE SCHOOL Location: 19250 BURNHAM AVE, Grades: 5-8)
Private elementary/middle schools in Lansing: LANSING CHRISTIAN SCHOOL Students: 304, Location: 3660 RANDOLPH ST, Grades: PK-8)
ST ANN ELEMENTARY SCHOOL Students: 229, Location: 3014 RIDGE RD, Grades: PK-8)
TRINITY LUTHERAN SCHOOL Students: 122, Location: 18144 GLEN TER, Grades: PK-8)
See full list of schools located in Lansing Library in Lansing: LANSING PUBLIC LIBRARY Operating income: $1,817,050; Location: 2750 INDIANA AVENUE; 120,049 books ; 5,192 audio materials ; 3,418 video materials ; 2 local licensed databases ; 17 state licensed databases ; 2 other licensed databases ; 241 print serial subscriptions ; 2 electronic serial subscriptions )
User-submitted facts and corrections:
Please add the official Village of Laning web site to your listing. www.villageoflansing.com
Notable locations in Lansing: (A) , Lansing Fire Department Station 2 (B) , Lansing Fire Department Station 4 (C) , Lansing Fire Department Station 1 (D) , Lansing Fire Department Station 3 (E) , Lewis O Flom Lansing Public Library (F) . Display/hide their locations on the map
Shopping Centers: (1) , The Landings Shopping Center (2) , Lansing Square Shopping Center (3) . Display/hide their locations on the map
Churches in Lansing include: (A) , First Christian Church of Lansing (B) , First Christian Reformed Church (C) , First Reformed Church of Lansing (D) , First United Methodist Church (E) , Lansing Assembly of God Church (F) , Lansing Bible Church (G) , Lansing Church of Christ (H) , Lansing Gospel Chapel (I) . Display/hide their locations on the map
Cemeteries: (1) , First Reformed of Lansing Cemetery (2) , Glen Oak Cemetery (3) . Display/hide their locations on the map
Parks in Lansing include: (1) , Jaycee Park (2) , Oakley Playlot (3) , Rotary Park (4) , Whitman Park (5) , Winterhoff Park (6) , Lan-Oak Park (7) , Potts Park (8) , Bock Park (9) . Display/hide their locations on the map
Tourist attraction:
Hotels:
Birthplace of: Harry Smith (television) - Journalist.
Cook County has a predicted average indoor radon screening level between 2 and 4 pCi/L (pico curies per liter) - Moderate Potential Average household size: This village:
2.6 peopleIllinois:
2.6 people
Percentage of family households: This village:
68.2%Whole state:
65.8%
Percentage of households with unmarried partners: This village:
5.7%Whole state:
6.3%
Likely homosexual households (counted as self-reported same-sex unmarried-partner households)
Lesbian couples: 0.4% of all households Gay men: 0.3% of all households
83 people in nursing facilities/skilled-nursing facilities in 2010people in group homes intended for adults in 2010
Banks with branches in Lansing (2011 data):
JPMorgan Chase Bank, National Association: The Landings Branch, Lansing Torrence Branch, Lansing Ridge Branch. Info updated 2011/11/10: Bank assets: $1,811,678.0 mil, Deposits: $1,190,738.0 mil, headquarters in Columbus, OH, positive income , International Specialization, 5577 total offices , Holding Company: Jpmorgan Chase & Co.
Great Lakes Bank, National Association: Lansing Branch at 18120 South Torrence Avenue, branch established on 1994/11/21. Info updated 2007/12/05: Bank assets: $627.2 mil, Deposits: $501.8 mil, headquarters in Blue Island, IL, positive income , Commercial Lending Specialization, 8 total offices , Holding Company: Great Lakes Financial Resources, Inc. Employee Stock Ownership Plan
First National Bank of Illinois: First National Bank Of Illinois at 3256 Ridge Road, branch established on 1945/09/08. Info updated 2006/11/03: Bank assets: $376.2 mil, Deposits: $333.5 mil, local headquarters , positive income , Commercial Lending Specialization, 8 total offices , Holding Company: First Lansing Bancorp, Inc.
First Savings Bank of Hegewisch: 18207 Burnham Avenue Branch at 18207 Burnham Avenue, branch established on 1927/01/01. Info updated 2006/11/03: Bank assets: $549.7 mil, Deposits: $487.5 mil, headquarters in Chicago, IL, positive income , Mortgage Lending Specialization, 9 total offices
U.S. Bank National Association: Lansing Branch at 17150 Torrence Avenue, branch established on 1986/06/30. Info updated 2012/01/30: Bank assets: $330,470.8 mil, Deposits: $236,091.5 mil, headquarters in Cincinnati, OH, positive income , 3121 total offices , Holding Company: U.S. Bancorp
Fifth Third Bank: Lansing Bm Branch at 16831 Torrence Ave, branch established on 2008/01/07. Info updated 2009/10/05: Bank assets: $114,540.4 mil, Deposits: $89,689.1 mil, headquarters in Cincinnati, OH, positive income , Commercial Lending Specialization, 1378 total offices , Holding Company: Fifth Third Bancorp
For population 15 years and over in Lansing:
Never married: 48.0%Now married: 36.1%Separated: 1.2%Widowed: 5.2%Divorced: 9.5% For population 25 years and over in Lansing:
High school or higher: 92.2%Bachelor's degree or higher: 25.3%Graduate or professional degree: 9.6%Unemployed: 4.6%Mean travel time to work (commute): 26.3 minutes
Education Gini index (Inequality in education) Here:
10.6Illinois average:
12.5
Religion statistics for Lansing, IL (based on Cook County data)
Religion Adherents Congregations Catholic 1,947,223 376 Evangelical Protestant 432,975 1,484 Other 312,636 403 Mainline Protestant 202,114 630 Black Protestant 148,895 395 Orthodox 53,276 66 None 2,097,556 -
Source: Clifford Grammich, Kirk Hadaway, Richard Houseal, Dale E.Jones, Alexei Krindatch, Richie Stanley and Richard H.Taylor. 2012. 2010 U.S.Religion Census: Religious Congregations & Membership Study. Association of Statisticians of American Religious Bodies. Jones, Dale E., et al. 2002. Congregations and Membership in the United States 2000. Nashville, TN: Glenmary Research Center. Graphs represent county-level data
Food Environment Statistics: Number of grocery stores : 1,460Here :
2.77 / 10,000 pop.Illinois :
2.24 / 10,000 pop.
Number of supercenters and club stores : 23Here :
0.04 / 10,000 pop.Illinois :
0.08 / 10,000 pop.
Number of convenience stores (no gas) : 490Cook County :
0.93 / 10,000 pop.State :
0.75 / 10,000 pop.
Number of convenience stores (with gas) : 806This county :
1.53 / 10,000 pop.Illinois :
2.61 / 10,000 pop.
Number of full-service restaurants : 3,516Here :
6.67 / 10,000 pop.Illinois :
6.86 / 10,000 pop.
Adult diabetes rate : Cook County :
8.4%Illinois :
8.3%
Adult obesity rate : Cook County :
23.5%State :
25.2%
Low-income preschool obesity rate : This county :
16.3%Illinois :
14.5%
Health and Nutrition: Healthy diet rate : Lansing:
49.5%Illinois:
49.5%
Average overall health of teeth and gums : Lansing:
46.3%Illinois:
47.2%
People feeling badly about themselves : People not drinking alcohol at all : This city:
11.2%Illinois:
10.8%
Average hours sleeping at night : Overweight people : Lansing:
34.9%Illinois:
33.4%
General health condition : Lansing:
55.5%Illinois:
56.4%
Average condition of hearing : More about Health and Nutrition of Lansing, IL Residents
Local government employment and payroll (March 2022)
Function
Full-time employees
Monthly full-time payroll
Average yearly full-time wage
Part-time employees
Monthly part-time payroll
Police Protection - Officers
60 $500,389 $100,078 0 $0 Firefighters
29 $271,383 $112,296 0 $0 Police - Other
17 $85,080 $60,056 26 $8,670 Local Libraries
16 $63,975 $47,981 21 $25,506 Streets and Highways
14 $63,749 $54,642 0 $0 Financial Administration
11 $52,069 $56,803 0 $0 Water Supply
11 $51,137 $55,786 0 $0 Other Government Administration
10 $50,333 $60,400 7 $11,497 Welfare
7 $12,435 $21,317 0 $0 Other and Unallocable
7 $26,897 $46,109 0 $0 Sewerage
4 $19,455 $58,365 0 $0 Fire - Other
4 $26,341 $79,023 0 $0 Airports
3 $14,196 $56,784 0 $0
Totals for Government
193 $1,237,438 $76,939 54 $45,673
Lansing government finances - Expenditure in 2018 (per resident):
Construction - Central Staff Services: $4,918,000 ($175.64)
Water Utilities: $542,000 ($19.36)Current Operations - Police Protection: $12,987,000 ($463.82)
Local Fire Protection: $5,522,000 ($197.21)Water Utilities: $4,823,000 ($172.25)Regular Highways: $3,582,000 ($127.93)Central Staff Services: $2,530,000 ($90.36)Libraries: $1,875,000 ($66.96)General - Other: $1,727,000 ($61.68)Financial Administration: $1,478,000 ($52.79)General - Interest on Debt: $4,255,000 ($151.96)
Other Capital Outlay - Water Utilities: $1,601,000 ($57.18)
Central Staff Services: $1,320,000 ($47.14)General - Other: $382,000 ($13.64)Total Salaries and Wages: $12,731,000 ($454.68)
Lansing government finances - Revenue in 2018 (per resident):
Charges - Solid Waste Management: $2,379,000 ($84.96)
Other: $1,458,000 ($52.07)Federal Intergovernmental - Other: $139,000 ($4.96)
Highways: $131,000 ($4.68)General Local Government Support: $1,000 ($0.04)Miscellaneous - General Revenue - Other: $1,643,000 ($58.68)
Fines and Forfeits: $1,316,000 ($47.00)Interest Earnings: $67,000 ($2.39)Revenue - Water Utilities: $6,421,000 ($229.32)
State Intergovernmental - General Local Government Support: $7,345,000 ($262.32)
Highways: $723,000 ($25.82)Other: $309,000 ($11.04)Tax - Property: $17,829,000 ($636.75)
General Sales and Gross Receipts: $1,832,000 ($65.43)Other Selective Sales: $1,815,000 ($64.82)Public Utilities Sales: $1,445,000 ($51.61)Other License: $843,000 ($30.11)
Lansing government finances - Debt in 2018 (per resident):
Long Term Debt - Beginning Outstanding - Unspecified Public Purpose: $106,383,000 ($3799.39)
Outstanding Unspecified Public Purpose: $105,891,000 ($3781.82)Retired Unspecified Public Purpose: $19,410,000 ($693.21)Issue, Unspecified Public Purpose: $18,918,000 ($675.64)
Lansing government finances - Cash and Securities in 2018 (per resident):
Other Funds - Cash and Securities: $24,452,000 ($873.29)
3.53% of this county's 2021 resident taxpayers lived in other counties in 2020 ($82,405 average adjusted gross income )
Here:
3.53%Illinois average:
5.09%
0.01% of residents moved from foreign countries ($114 average AGI )Cook County:
0.01%Illinois average:
0.01%
Top counties from which taxpayers relocated into this county between 2020 and 2021:
5.44% of this county's 2020 resident taxpayers moved to other counties in 2021 ($120,340 average adjusted gross income )
Here:
5.44%Illinois average:
6.10%
0.01% of residents moved to foreign countries ($140 average AGI )Cook County:
0.01%Illinois average:
0.01%
Top counties to which taxpayers relocated from this county between 2020 and 2021:
Businesses in Lansing, IL
Name Count Name Count
ALDI 1 IHOP 1 AT&T 1 Just Tires 1 Ace Hardware 1 Kincaid 1 Advance Auto Parts 1 Kmart 1 AutoZone 1 LA Fitness 1 Bakers Square 1 McDonald's 1 Baskin-Robbins 1 New Balance 1 Blockbuster 1 Nike 1 Buffalo Wild Wings 1 Old Country Buffet 1 Burger King 2 Olive Garden 1 Burlington Coat Factory 1 Payless 1 Casual Male XL 1 PetSmart 1 Chevrolet 1 Pier 1 Imports 1 Comfort Suites 1 RadioShack 1 Cricket Wireless 2 Red Roof Inn 1 Curves 1 SAS Shoes 1 Dairy Queen 1 Sears 1 Days Inn 1 Sleep Inn 1 Domino's Pizza 1 Sprint Nextel 1 Dunkin Donuts 1 Subway 3 Extended Stay America 1 Super 8 1 FedEx 6 T-Mobile 2 Firestone Complete Auto Care 1 U-Haul 1 H&R Block 1 UPS 6 Holiday Inn 1 Walgreens 2 Honda 1 Walmart 1 Howard Johnson 1 Wendy's 1
Strongest AM radio stations in Lansing:
WVIV (1200 AM; 20 kW; CHICAGO, IL; Owner: WLXX-AM LICENSE CORP.)
WLS (890 AM; 50 kW; CHICAGO, IL; Owner: WLS, INC.)
WNTD (950 AM; 5 kW; CHICAGO, IL; Owner: RADIO UNICA OF CHICAGO LICENSE CORP.)
WIND (560 AM; 5 kW; CHICAGO, IL; Owner: TICHENOR LICENSE CORPORATION ("TLC"))
WYLL (1160 AM; 50 kW; CHICAGO, IL; Owner: SCA LICENSE CORPORATION)
WMVP (1000 AM; 50 kW; CHICAGO, IL; Owner: ABC, INC.)
WSCR (670 AM; 50 kW; CHICAGO, IL; Owner: INFINITY BROADCASTING OPERATIONS, INC.)
WNWI (1080 AM; 3 kW; OAK LAWN, IL; Owner: BIRACH BROADCASTING CORPORATION)
WJOB (1230 AM; 1 kW; HAMMOND, IN; Owner: ST. GEORGE BROADCASTING, LLC, ROBERT J. MACCINI, RECEIVER)
WCGO (1600 AM; 1 kW; CHICAGO HEIGHTS, IL)
WBBM (780 AM; 50 kW; CHICAGO, IL; Owner: INFINITY BROADCASTING OPERATIONS, INC.)
WGN (720 AM; 50 kW; CHICAGO, IL; Owner: WGN CONTINENTAL BROADCASTING CO.)
WRDZ (1300 AM; 4 kW; LA GRANGE, IL; Owner: ABC, INC.)
Strongest FM radio stations in Lansing:
WYCA (106.3 FM; LANSING, IL; Owner: DONTRON, INC.)
WPWX (92.3 FM; HAMMOND, IN; Owner: DONTRON, INC.)
WCKG (105.9 FM; ELMWOOD PARK, IL; Owner: INFINITY HOLDINGS CORPORATION OF ORLANDO)
WLIT-FM (93.9 FM; CHICAGO, IL; Owner: AMFM RADIO LICENSES, L.L.C.)
WJMK (104.3 FM; CHICAGO, IL; Owner: INFINITY BROADCASTING CORP. OF ILLINOIS)
WNUA (95.5 FM; CHICAGO, IL; Owner: AMFM RADIO LICENSES, L.L.C.)
WTMX (101.9 FM; SKOKIE, IL; Owner: BONNEVILLE HOLDING COMPANY)
WBBM-FM (96.3 FM; CHICAGO, IL; Owner: INFINITY BROADCASTING OPERATIONS, INC.)
WKSC-FM (103.5 FM; CHICAGO, IL; Owner: AMFM RADIO LICENSES, L.L.C.)
WFMT (98.7 FM; CHICAGO, IL; Owner: WINDOW TO THE WORLD COMMUNICATIONS)
WZZN (94.7 FM; CHICAGO, IL; Owner: ABC CHICAGO FM RADIO,INC.)
WGCI-FM (107.5 FM; CHICAGO, IL; Owner: AMFM RADIO LICENSES, L.L.C.)
WDRV (97.1 FM; CHICAGO, IL; Owner: BONNEVILLE HOLDING COMPANY)
WBEZ (91.5 FM; CHICAGO, IL; Owner: THE WBEZ ALLIANCE, INC.)
WKQX (101.1 FM; CHICAGO, IL; Owner: EMMIS RADIO LICENSE CORPORATION)
WLUP-FM (97.9 FM; CHICAGO, IL; Owner: BONNEVILLE HOLDING COMPANY)
WNND (100.3 FM; CHICAGO, IL; Owner: BONNEVILLE HOLDING COMPANY)
WOJO (105.1 FM; EVANSTON, IL; Owner: TICHENOR LICENSE CORPORATION ("TLC"))
WUSN (99.5 FM; CHICAGO, IL; Owner: INFINITY BROADCASTING CORPORATION OF CHICAGO)
WVAZ (102.7 FM; OAK PARK, IL; Owner: AMFM RADIO LICENSES, L.L.C.)
TV broadcast stations around Lansing:
WYIN (Channel 56; GARY, IN; Owner: NORTHWEST INDIANA PUBLIC BROADCASTING, INC.)
WLS-TV (Channel 7; CHICAGO, IL; Owner: WLS TELEVISION, INC.)
WMAQ-TV (Channel 5; CHICAGO, IL; Owner: NBC SUBSIDIARY (WMAQ-TV), INC.)
WTTW (Channel 11; CHICAGO, IL; Owner: WINDOW TO THE WORLD COMMUNICATIONS, INC.)
WGN-TV (Channel 9; CHICAGO, IL; Owner: WGN CONTINENTAL BROADCASTING COMPANY)
WGBO-TV (Channel 66; JOLIET, IL; Owner: WGBO LICENSE PARTNERSHIP, G.P.)
WBBM-TV (Channel 2; CHICAGO, IL; Owner: CBS BROADCASTING INC.)
WPWR-TV (Channel 50; GARY, IN; Owner: FOX TELEVISION STATIONS, INC.)
WXFT (Channel 60; AURORA, IL; Owner: TELEFUTURA CHICAGO LLC)
WCPX (Channel 38; CHICAGO, IL; Owner: PAXSON CHICAGO LICENSE, INC.)
WCIU-TV (Channel 26; CHICAGO, IL; Owner: WCIU-TV LIMITED PARTNERSHIP)
WFLD (Channel 32; CHICAGO, IL; Owner: FOX TELEVISION STATIONS, INC.)
W68DO (Channel 68; PALATINE, IL; Owner: TRINITY BROADCASTING NETWORK)
WFBT-CA (Channel 23; CHICAGO, IL; Owner: CHANNEL 23 LIMITED PARTNERSHIP)
WJYS (Channel 62; HAMMOND, IN; Owner: JOVON BROADCASTING CORPORATION)
WSNS-TV (Channel 44; CHICAGO, IL; Owner: TELEMUNDO OF CHICAGO, INC.)
WOCH-LP (Channel 28; CHICAGO, IL; Owner: KM LPTV OF CHICAGO-28, L.L.C.)
WYCC (Channel 20; CHICAGO, IL; Owner: COLLEGE DIST. #508, COUNTY OF COOK)
WOCK-CA (Channel 13; CHICAGO, IL; Owner: KM LPTV OF CHICAGO-13, L.L.C.)
W34CK (Channel 34; ARLINGTON HEIGHTS, IL; Owner: FIRST UNITED, INC.)
W54AP (Channel 54; BLUE ISLAND, IL; Owner: CATHOLIC VIEWS BROADCASTS, INC.)
W18AT (Channel 18; GARY, IN; Owner: LESEA BROADCASTING CORPORATION)
W24AW (Channel 24; VALPARAISO, IN; Owner: LESEA BROADCASTING CORPORATION)
W54BK (Channel 54; CHESTERTON, IN; Owner: LESEA BROADCASTING CORPORATION)
National Bridge Inventory (NBI) Statistics 24 Number of bridges489ft / 149m Total length $1,637,000 Total costs1,228,550 Total average daily traffic280,917 Total average daily truck traffic
New bridges - historical statistics
1 1940-1949 1 1960-1969 1 1970-1979 19 2000-2009 2 2010-2019
See full National Bridge Inventory statistics for Lansing, IL
Home Mortgage Disclosure Act Aggregated Statistics For Year 2009(Based on 3 full and 4 partial tracts) A) FHA, FSA/RHS & VA B) Conventional C) Refinancings D) Home Improvement Loans E) Loans on Dwellings For 5+ Families F) Non-occupant Loans on G) Loans On Manufactured Number Average Value Number Average Value Number Average Value Number Average Value Number Average Value Number Average Value Number Average Value
LOANS ORIGINATED 102 $125,028 50 $95,605 311 $132,853 15 $61,769 3 $531,193 31 $84,252 1 $233,000 APPLICATIONS APPROVED, NOT ACCEPTED 4 $168,365 8 $94,135 51 $141,598 6 $39,370 0 $0 2 $58,210 0 $0 APPLICATIONS DENIED 25 $135,563 20 $78,224 191 $147,311 27 $43,371 0 $0 13 $82,451 1 $74,000 APPLICATIONS WITHDRAWN 6 $136,647 1 $94,440 75 $141,294 5 $61,008 0 $0 7 $74,300 0 $0 FILES CLOSED FOR INCOMPLETENESS 2 $183,620 2 $86,860 37 $156,941 2 $69,720 0 $0 1 $100,310 0 $0
Aggregated Statistics For Year 2008(Based on 3 full and 4 partial tracts) A) FHA, FSA/RHS & VA B) Conventional C) Refinancings D) Home Improvement Loans E) Loans on Dwellings For 5+ Families F) Non-occupant Loans on G) Loans On Manufactured Number Average Value Number Average Value Number Average Value Number Average Value Number Average Value Number Average Value Number Average Value
LOANS ORIGINATED 80 $144,060 95 $110,874 288 $146,466 42 $53,310 6 $427,345 27 $122,660 1 $19,000 APPLICATIONS APPROVED, NOT ACCEPTED 7 $134,796 11 $132,575 59 $148,913 8 $41,075 0 $0 5 $179,448 0 $0 APPLICATIONS DENIED 21 $154,821 36 $137,568 309 $158,905 53 $39,786 0 $0 12 $93,302 1 $141,790 APPLICATIONS WITHDRAWN 11 $140,955 17 $140,616 88 $153,534 1 $23,550 0 $0 6 $100,145 0 $0 FILES CLOSED FOR INCOMPLETENESS 1 $114,000 6 $145,852 36 $157,442 4 $88,382 1 $1,050,000 5 $80,950 0 $0
Aggregated Statistics For Year 2007(Based on 3 full and 4 partial tracts) A) FHA, FSA/RHS & VA B) Conventional C) Refinancings D) Home Improvement Loans E) Loans on Dwellings For 5+ Families F) Non-occupant Loans on G) Loans On Manufactured Number Average Value Number Average Value Number Average Value Number Average Value Number Average Value Number Average Value Number Average Value
LOANS ORIGINATED 36 $155,149 310 $134,547 422 $138,903 66 $51,992 7 $634,600 56 $121,882 1 $60,180 APPLICATIONS APPROVED, NOT ACCEPTED 1 $116,000 60 $130,363 97 $149,757 16 $43,652 0 $0 12 $107,266 0 $0 APPLICATIONS DENIED 12 $170,666 128 $139,495 404 $159,287 93 $46,400 3 $226,037 38 $123,784 3 $35,393 APPLICATIONS WITHDRAWN 1 $162,530 39 $145,091 117 $148,881 5 $50,448 1 $323,000 6 $126,118 0 $0 FILES CLOSED FOR INCOMPLETENESS 2 $175,690 22 $140,548 72 $164,340 7 $82,263 0 $0 2 $145,050 0 $0
Aggregated Statistics For Year 2006(Based on 3 full and 4 partial tracts) A) FHA, FSA/RHS & VA B) Conventional C) Refinancings D) Home Improvement Loans E) Loans on Dwellings For 5+ Families F) Non-occupant Loans on G) Loans On Manufactured Number Average Value Number Average Value Number Average Value Number Average Value Number Average Value Number Average Value Number Average Value
LOANS ORIGINATED 45 $155,077 664 $109,000 556 $133,272 81 $56,078 11 $1,166,150 100 $104,534 1 $11,950 APPLICATIONS APPROVED, NOT ACCEPTED 6 $160,083 102 $104,067 130 $127,745 24 $53,116 0 $0 29 $105,736 0 $0 APPLICATIONS DENIED 8 $97,649 218 $120,196 400 $146,376 89 $62,163 0 $0 55 $129,029 0 $0 APPLICATIONS WITHDRAWN 2 $231,375 108 $109,783 163 $139,765 10 $139,761 1 $200,000 23 $86,390 0 $0 FILES CLOSED FOR INCOMPLETENESS 1 $190,280 29 $97,978 75 $145,986 1 $35,000 0 $0 5 $114,516 0 $0
Aggregated Statistics For Year 2005(Based on 3 full and 4 partial tracts) A) FHA, FSA/RHS & VA B) Conventional C) Refinancings D) Home Improvement Loans E) Loans on Dwellings For 5+ Families F) Non-occupant Loans on G) Loans On Manufactured Number Average Value Number Average Value Number Average Value Number Average Value Number Average Value Number Average Value Number Average Value
LOANS ORIGINATED 59 $146,247 657 $107,900 681 $123,200 75 $38,613 9 $295,117 117 $111,431 1 $53,240 APPLICATIONS APPROVED, NOT ACCEPTED 2 $160,755 93 $112,823 128 $124,797 15 $51,431 0 $0 19 $83,690 0 $0 APPLICATIONS DENIED 11 $119,415 225 $108,564 462 $134,520 75 $44,732 0 $0 54 $99,146 2 $88,500 APPLICATIONS WITHDRAWN 3 $147,913 97 $100,283 224 $145,273 16 $192,603 0 $0 22 $114,864 1 $15,430 FILES CLOSED FOR INCOMPLETENESS 1 $167,000 33 $102,907 90 $141,892 1 $126,160 0 $0 6 $90,218 0 $0
Aggregated Statistics For Year 2004(Based on 3 full and 4 partial tracts) A) FHA, FSA/RHS & VA B) Conventional C) Refinancings D) Home Improvement Loans E) Loans on Dwellings For 5+ Families F) Non-occupant Loans on G) Loans On Manufactured Number Average Value Number Average Value Number Average Value Number Average Value Number Average Value Number Average Value Number Average Value
LOANS ORIGINATED 73 $127,543 498 $109,662 609 $115,696 58 $40,422 10 $311,716 86 $102,203 1 $58,120 APPLICATIONS APPROVED, NOT ACCEPTED 4 $108,210 77 $115,195 120 $119,749 7 $61,171 2 $529,230 17 $95,804 0 $0 APPLICATIONS DENIED 14 $125,580 116 $108,685 365 $126,225 75 $38,253 2 $419,435 23 $104,799 2 $31,635 APPLICATIONS WITHDRAWN 1 $305,000 53 $115,765 193 $133,614 11 $80,648 0 $0 17 $101,755 0 $0 FILES CLOSED FOR INCOMPLETENESS 3 $90,563 24 $139,175 69 $137,975 4 $51,670 0 $0 3 $76,533 0 $0
Aggregated Statistics For Year 2003(Based on 3 full and 4 partial tracts) A) FHA, FSA/RHS & VA B) Conventional C) Refinancings D) Home Improvement Loans E) Loans on Dwellings For 5+ Families F) Non-occupant Loans on Number Average Value Number Average Value Number Average Value Number Average Value Number Average Value Number Average Value
LOANS ORIGINATED 127 $117,647 391 $117,577 1,199 $103,280 50 $24,980 20 $732,998 77 $94,626 APPLICATIONS APPROVED, NOT ACCEPTED 6 $101,592 84 $115,163 174 $106,878 11 $32,903 0 $0 9 $58,042 APPLICATIONS DENIED 9 $151,856 98 $112,603 419 $108,128 47 $22,773 0 $0 30 $108,277 APPLICATIONS WITHDRAWN 9 $133,368 42 $122,973 181 $113,559 3 $41,250 1 $230,000 7 $87,809 FILES CLOSED FOR INCOMPLETENESS 6 $128,333 15 $111,035 45 $103,619 1 $52,040 0 $0 0 $0
Aggregated Statistics For Year 2002(Based on 3 full and 4 partial tracts) A) FHA, FSA/RHS & VA B) Conventional C) Refinancings D) Home Improvement Loans E) Loans on Dwellings For 5+ Families F) Non-occupant Loans on Number Average Value Number Average Value Number Average Value Number Average Value Number Average Value Number Average Value
LOANS ORIGINATED 110 $111,190 347 $112,542 736 $101,362 56 $24,860 15 $260,404 50 $94,251 APPLICATIONS APPROVED, NOT ACCEPTED 1 $98,000 36 $133,392 121 $97,629 9 $13,157 2 $257,780 6 $95,677 APPLICATIONS DENIED 14 $108,155 63 $118,593 199 $94,841 27 $14,243 1 $199,500 18 $93,921 APPLICATIONS WITHDRAWN 7 $117,509 41 $126,343 116 $111,169 9 $15,719 1 $264,560 7 $129,230 FILES CLOSED FOR INCOMPLETENESS 2 $131,615 18 $143,867 107 $98,671 1 $30,000 0 $0 3 $105,730
Aggregated Statistics For Year 2001(Based on 3 full and 4 partial tracts) A) FHA, FSA/RHS & VA B) Conventional C) Refinancings D) Home Improvement Loans E) Loans on Dwellings For 5+ Families F) Non-occupant Loans on Number Average Value Number Average Value Number Average Value Number Average Value Number Average Value Number Average Value
LOANS ORIGINATED 146 $115,579 297 $96,253 623 $95,348 62 $18,645 8 $393,770 31 $82,813 APPLICATIONS APPROVED, NOT ACCEPTED 1 $137,140 29 $108,994 77 $91,523 13 $26,630 0 $0 8 $109,508 APPLICATIONS DENIED 20 $114,308 46 $107,232 256 $89,201 39 $14,674 3 $212,667 7 $74,131 APPLICATIONS WITHDRAWN 7 $118,449 28 $105,909 105 $103,186 19 $22,105 1 $232,000 7 $123,416 FILES CLOSED FOR INCOMPLETENESS 1 $106,000 12 $102,415 38 $90,620 1 $33,630 0 $0 1 $130,000
Aggregated Statistics For Year 2000(Based on 3 full and 4 partial tracts) A) FHA, FSA/RHS & VA B) Conventional C) Refinancings D) Home Improvement Loans E) Loans on Dwellings For 5+ Families F) Non-occupant Loans on Number Average Value Number Average Value Number Average Value Number Average Value Number Average Value Number Average Value
LOANS ORIGINATED 135 $105,745 243 $92,167 173 $69,108 88 $22,550 3 $425,577 26 $83,874 APPLICATIONS APPROVED, NOT ACCEPTED 10 $116,676 23 $101,123 50 $84,311 16 $23,226 2 $294,350 1 $69,000 APPLICATIONS DENIED 17 $117,089 60 $90,422 162 $81,404 56 $19,965 2 $941,050 8 $117,239 APPLICATIONS WITHDRAWN 6 $125,367 34 $122,192 75 $71,465 12 $38,537 0 $0 2 $99,270 FILES CLOSED FOR INCOMPLETENESS 3 $94,900 5 $123,060 41 $81,358 1 $50,000 0 $0 2 $78,500
Aggregated Statistics For Year 1999(Based on 3 full and 4 partial tracts) A) FHA, FSA/RHS & VA B) Conventional C) Refinancings D) Home Improvement Loans E) Loans on Dwellings For 5+ Families F) Non-occupant Loans on Number Average Value Number Average Value Number Average Value Number Average Value Number Average Value Number Average Value
LOANS ORIGINATED 159 $99,129 272 $88,837 409 $81,368 85 $19,130 15 $234,602 43 $76,354 APPLICATIONS APPROVED, NOT ACCEPTED 4 $100,055 30 $104,406 62 $73,999 15 $18,798 2 $173,765 5 $143,478 APPLICATIONS DENIED 11 $92,790 72 $88,593 154 $84,853 53 $20,688 0 $0 13 $122,245 APPLICATIONS WITHDRAWN 12 $99,552 31 $89,417 114 $83,553 15 $46,825 0 $0 6 $77,260 FILES CLOSED FOR INCOMPLETENESS 1 $59,750 6 $98,027 38 $86,661 1 $30,300 0 $0 2 $36,785
Detailed HMDA statistics for the following Tracts:
8279.01
, 8279.02 , 8280.00 , 8281.00 , 8282.01 , 8282.02 , 8285.05
Private Mortgage Insurance Companies Aggregated Statistics For Year 2009(Based on 3 full and 4 partial tracts) A) Conventional B) Refinancings C) Non-occupant Loans on Number Average Value Number Average Value Number Average Value
LOANS ORIGINATED 9 $127,593 2 $157,740 1 $117,000 APPLICATIONS APPROVED, NOT ACCEPTED 7 $108,769 5 $146,782 0 $0 APPLICATIONS DENIED 4 $115,575 3 $124,333 0 $0 APPLICATIONS WITHDRAWN 0 $0 2 $103,980 0 $0 FILES CLOSED FOR INCOMPLETENESS 0 $0 0 $0 0 $0
Aggregated Statistics For Year 2008(Based on 3 full and 4 partial tracts) A) Conventional B) Refinancings C) Non-occupant Loans on Number Average Value Number Average Value Number Average Value
LOANS ORIGINATED 53 $132,357 41 $165,212 3 $148,483 APPLICATIONS APPROVED, NOT ACCEPTED 21 $156,326 30 $193,492 3 $98,667 APPLICATIONS DENIED 4 $127,232 5 $167,238 0 $0 APPLICATIONS WITHDRAWN 2 $191,325 3 $152,813 1 $134,000 FILES CLOSED FOR INCOMPLETENESS 4 $104,840 1 $167,000 2 $68,000
Aggregated Statistics For Year 2007(Based on 3 full and 4 partial tracts) A) Conventional B) Refinancings C) Non-occupant Loans on Number Average Value Number Average Value Number Average Value
LOANS ORIGINATED 187 $149,470 73 $161,627 14 $114,507 APPLICATIONS APPROVED, NOT ACCEPTED 24 $161,279 21 $166,448 3 $116,500 APPLICATIONS DENIED 9 $188,847 2 $145,950 0 $0 APPLICATIONS WITHDRAWN 9 $168,423 6 $181,045 0 $0 FILES CLOSED FOR INCOMPLETENESS 0 $0 1 $105,820 0 $0
Aggregated Statistics For Year 2006(Based on 3 full and 4 partial tracts) A) Conventional B) Refinancings C) Non-occupant Loans on Number Average Value Number Average Value Number Average Value
LOANS ORIGINATED 113 $136,414 52 $159,517 7 $141,973 APPLICATIONS APPROVED, NOT ACCEPTED 11 $149,918 9 $164,513 0 $0 APPLICATIONS DENIED 1 $136,910 1 $174,000 0 $0 APPLICATIONS WITHDRAWN 3 $174,380 2 $182,020 1 $116,000 FILES CLOSED FOR INCOMPLETENESS 0 $0 0 $0 0 $0
Aggregated Statistics For Year 2005(Based on 3 full and 4 partial tracts) A) Conventional B) Refinancings C) Non-occupant Loans on Number Average Value Number Average Value Number Average Value
LOANS ORIGINATED 86 $142,392 67 $138,220 11 $103,149 APPLICATIONS APPROVED, NOT ACCEPTED 20 $131,810 13 $152,887 1 $48,610 APPLICATIONS DENIED 1 $91,930 0 $0 1 $41,000 APPLICATIONS WITHDRAWN 4 $187,605 6 $167,053 0 $0 FILES CLOSED FOR INCOMPLETENESS 0 $0 1 $140,560 1 $105,820
Aggregated Statistics For Year 2004(Based on 3 full and 4 partial tracts) A) Conventional B) Refinancings C) Non-occupant Loans on Number Average Value Number Average Value Number Average Value
LOANS ORIGINATED 117 $122,998 68 $129,771 10 $101,471 APPLICATIONS APPROVED, NOT ACCEPTED 21 $137,550 18 $138,501 3 $81,667 APPLICATIONS DENIED 4 $124,565 1 $108,000 1 $98,000 APPLICATIONS WITHDRAWN 7 $99,431 4 $99,125 3 $83,940 FILES CLOSED FOR INCOMPLETENESS 0 $0 1 $108,000 0 $0
Aggregated Statistics For Year 2003(Based on 3 full and 4 partial tracts) A) Conventional B) Refinancings C) Non-occupant Loans on Number Average Value Number Average Value Number Average Value
LOANS ORIGINATED 164 $128,377 162 $123,769 10 $83,492 APPLICATIONS APPROVED, NOT ACCEPTED 27 $148,505 30 $132,035 2 $52,500 APPLICATIONS DENIED 3 $197,367 4 $131,318 1 $228,510 APPLICATIONS WITHDRAWN 9 $164,119 6 $149,800 0 $0 FILES CLOSED FOR INCOMPLETENESS 1 $136,840 3 $109,000 0 $0
Aggregated Statistics For Year 2002(Based on 3 full and 4 partial tracts) A) Conventional B) Refinancings C) Non-occupant Loans on Number Average Value Number Average Value Number Average Value
LOANS ORIGINATED 171 $117,673 99 $119,426 9 $78,589 APPLICATIONS APPROVED, NOT ACCEPTED 27 $147,596 19 $125,253 1 $95,000 APPLICATIONS DENIED 3 $107,427 6 $98,282 3 $83,000 APPLICATIONS WITHDRAWN 5 $157,278 6 $128,260 0 $0 FILES CLOSED FOR INCOMPLETENESS 1 $81,000 0 $0 0 $0
Aggregated Statistics For Year 2001(Based on 3 full and 4 partial tracts) A) Conventional B) Refinancings C) Non-occupant Loans on Number Average Value Number Average Value Number Average Value
LOANS ORIGINATED 125 $103,261 76 $116,589 8 $68,690 APPLICATIONS APPROVED, NOT ACCEPTED 21 $104,981 18 $110,329 3 $58,590 APPLICATIONS DENIED 6 $117,242 3 $141,607 2 $120,360 APPLICATIONS WITHDRAWN 4 $107,860 2 $103,000 0 $0 FILES CLOSED FOR INCOMPLETENESS 0 $0 0 $0 0 $0
Aggregated Statistics For Year 2000(Based on 3 full and 4 partial tracts) A) Conventional B) Refinancings C) Non-occupant Loans on Number Average Value Number Average Value Number Average Value
LOANS ORIGINATED 98 $101,007 16 $108,029 7 $127,240 APPLICATIONS APPROVED, NOT ACCEPTED 3 $118,240 4 $77,750 0 $0 APPLICATIONS DENIED 6 $102,548 2 $191,815 1 $47,000 APPLICATIONS WITHDRAWN 3 $61,013 1 $131,050 1 $108,000 FILES CLOSED FOR INCOMPLETENESS 1 $156,260 0 $0 0 $0
Aggregated Statistics For Year 1999(Based on 3 full and 4 partial tracts) A) Conventional B) Refinancings C) Non-occupant Loans on Number Average Value Number Average Value Number Average Value
LOANS ORIGINATED 98 $90,452 42 $107,772 6 $80,910 APPLICATIONS APPROVED, NOT ACCEPTED 10 $115,379 10 $121,084 1 $91,690 APPLICATIONS DENIED 9 $88,956 2 $184,530 2 $63,395 APPLICATIONS WITHDRAWN 1 $125,270 3 $89,527 1 $125,270 FILES CLOSED FOR INCOMPLETENESS 1 $144,140 1 $128,460 0 $0
Detailed PMIC statistics for the following Tracts:
8279.01
, 8279.02 , 8280.00 , 8281.00 , 8282.01 , 8282.02 , 8285.05 Fire-safe hotels and motels in Lansing, Illinois:
Howard Johnson, 17301 Oak Ave, Lansing, Illinois 60438 Phone: (708) 474-6900, Fax: (708) 474-6908
Holiday Inn Of Lansing, 17356 Torrence Ave, Lansing, Illinois 60438 Phone: (708) 474-6300, Fax: (708) 474-9695
Super 8 Motel Lansing, 2151 Bernice Rd, Lansing, Illinois 60438 Phone: (708) 418-8884, Fax: (708) 418-8896
Extended Stay America - Chicago - Lansing, 2520 173 Rd St, Lansing, Illinois 60438 Phone: (708) 895-6402, Fax: (708) 895-9259
Comfort Suites, 2235 W 173rd St, Lansing, Illinois 60438 Phone: (708) 418-3337, Fax: (708) 418-4340
Holiday Inn Express Hotel & Suites, 2323 172nd St, Lansing, Illinois 60438 Phone: (708) 418-1188
All 6 fire-safe hotels and motels in Lansing, Illinois
Most common first names in Lansing, IL among deceased individuals Name Count Lived (average)
John 293 74.7 years Mary 174 79.8 years William 166 72.2 years Joseph 156 75.4 years George 133 75.4 years Robert 133 69.5 years Edward 127 75.0 years James 104 68.2 years Helen 101 80.0 years Frank 95 77.3 years
Most common last names in Lansing, IL among deceased individuals Last name Count Lived (average)
Johnson 50 76.0 years Schultz 40 77.9 years Smith 37 74.6 years Carlson 25 72.0 years Miller 22 73.2 years Anderson 22 74.4 years Brown 22 78.3 years Davis 22 72.4 years Martin 20 74.7 years Thomas 19 73.3 years
Lansing compared to Illinois state average:
Median house value below state average. Unemployed percentage significantly below state average. Black race population percentage significantly above state average. Length of stay since moving in above state average.
Top Patent Applicants
Michael J. Vermeer (5)
Benjamin S. Novak (3)
Bernard Chukwulebe (2)
Mark B. Eenigenburg (2)
Michael Moriarity (2)
Anthony C. Onicha (2)
Joel Houck (2)
Crystal Williams (2)
Robert Wilcox (1)
Stanley Wohadlo (1)
Total of 33 patent applications in 2008-2024.
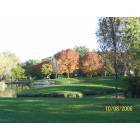
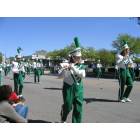
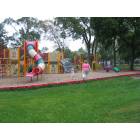

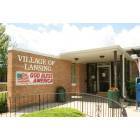
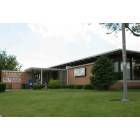
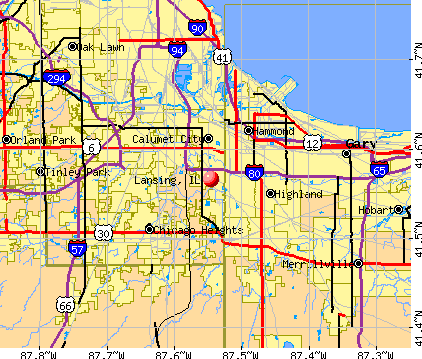


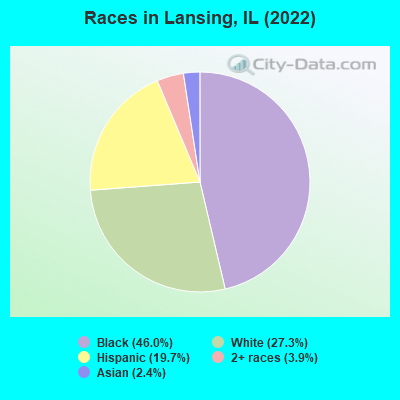
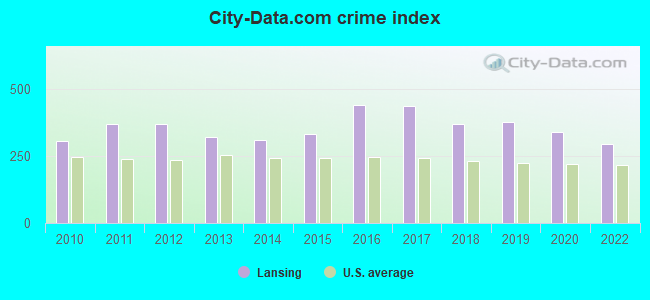
 Recent articles from our blog. Our writers, many of them Ph.D. graduates or candidates, create easy-to-read articles on a wide variety of topics.

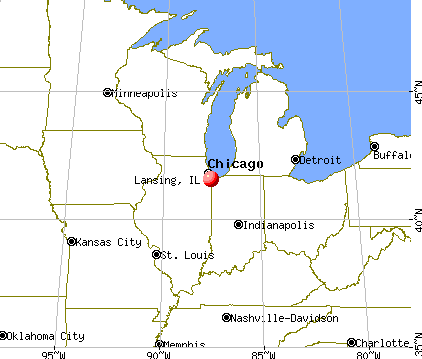
 (4.2 miles
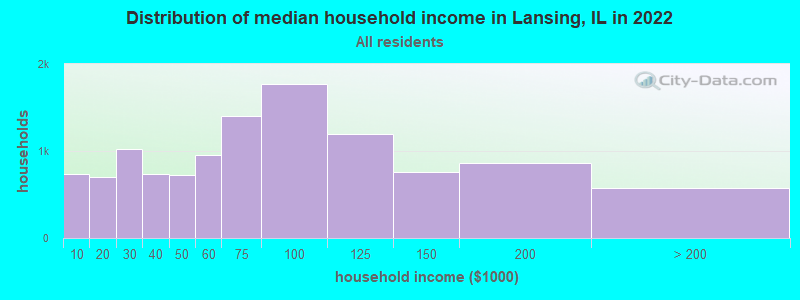
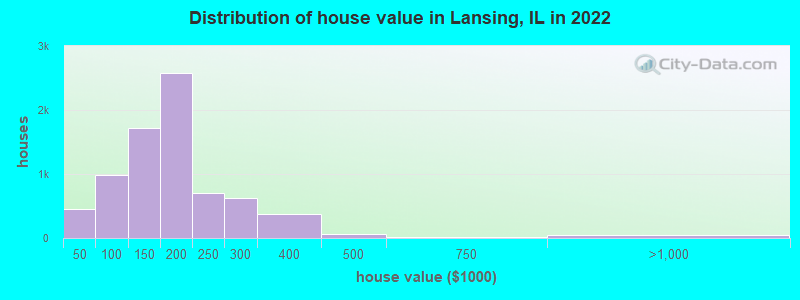
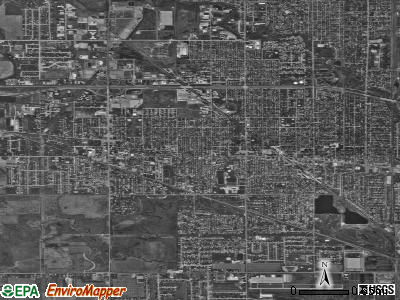
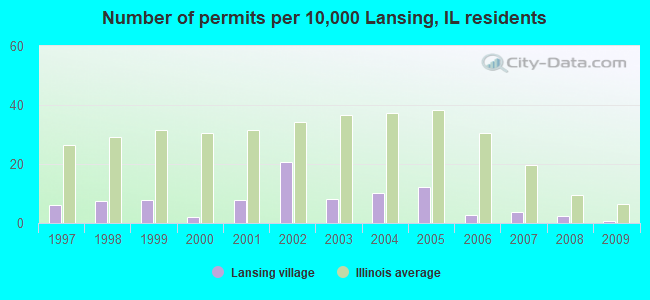
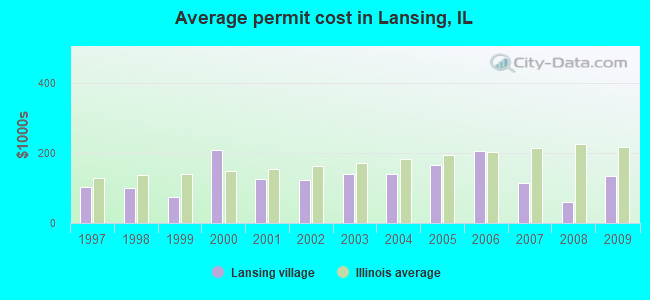
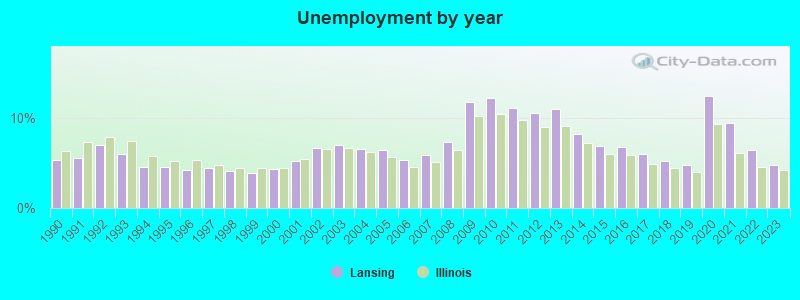
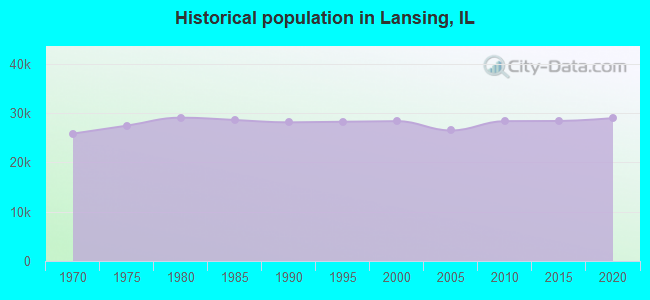
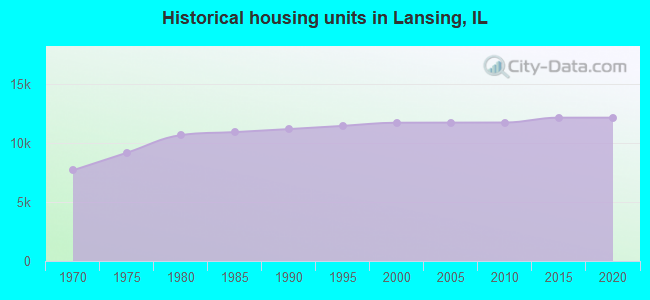
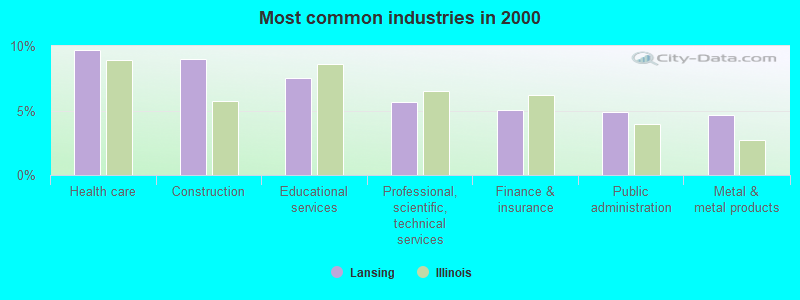
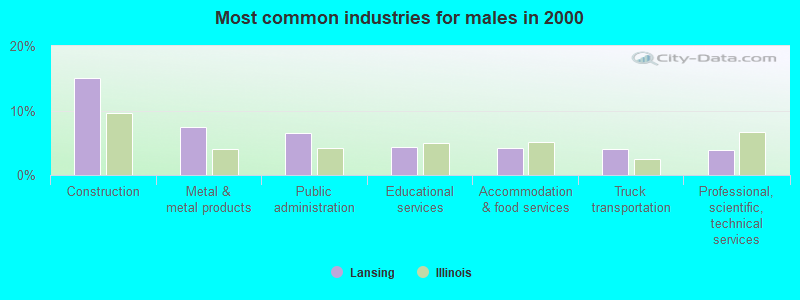
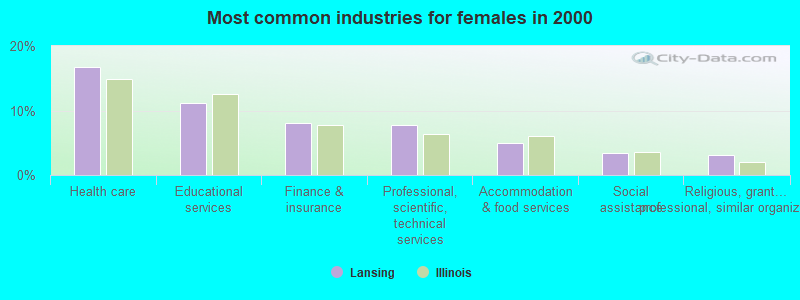
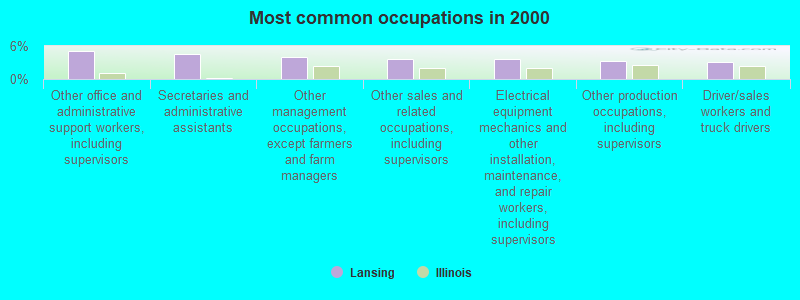
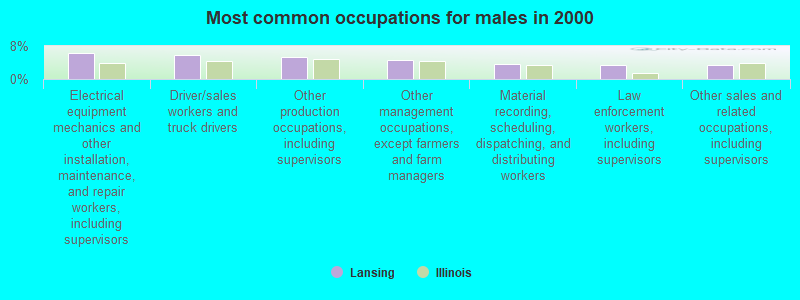
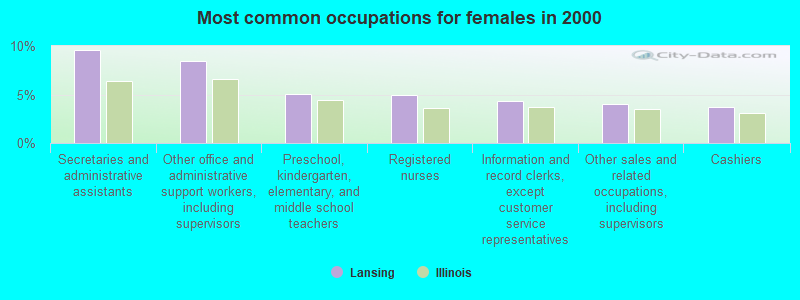
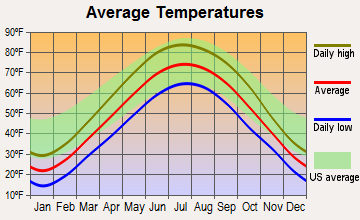
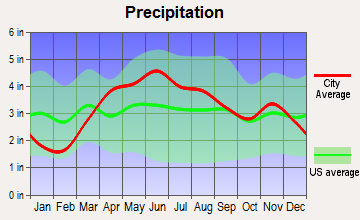
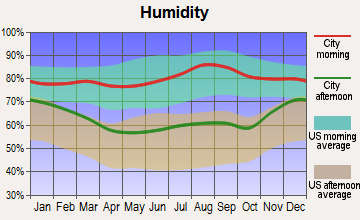
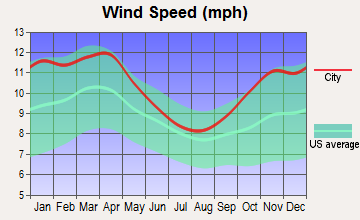
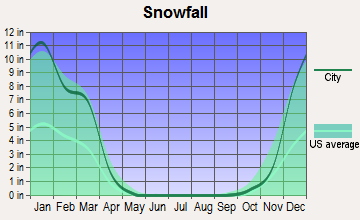
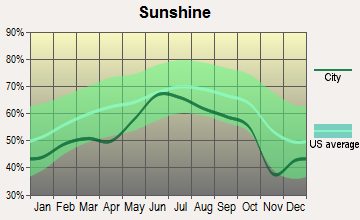
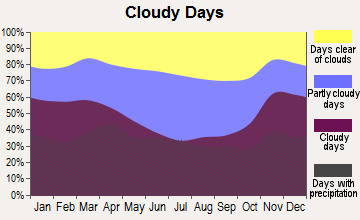
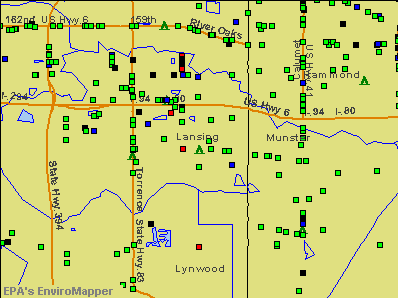

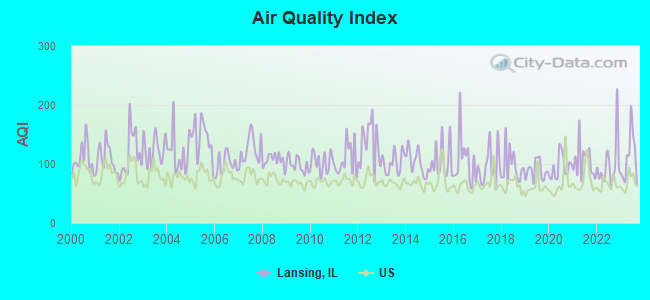
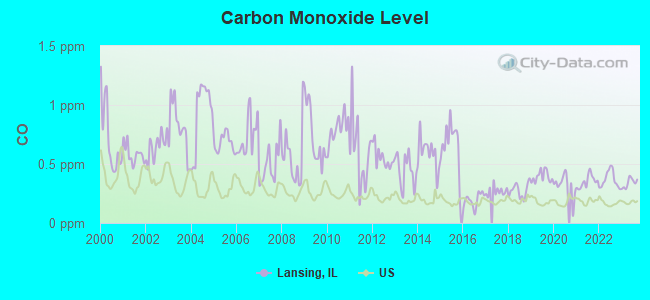
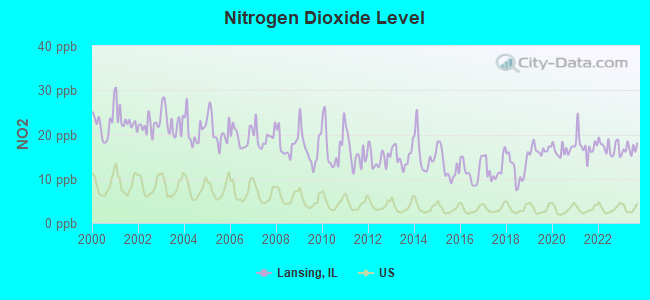
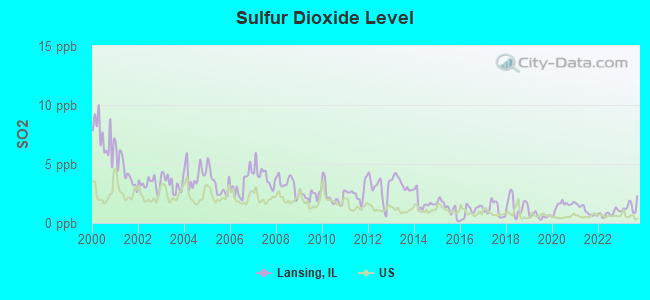

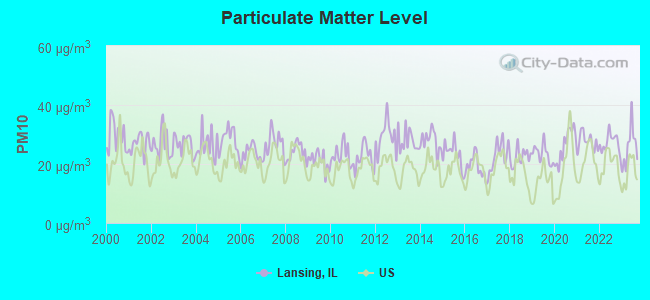
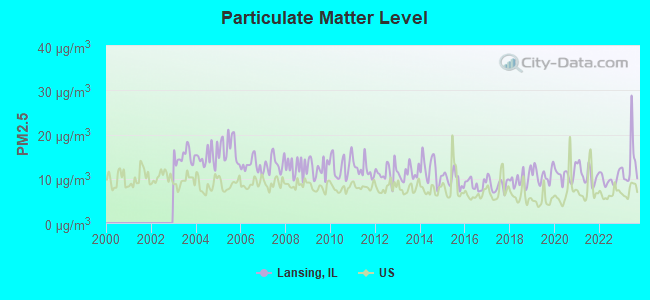
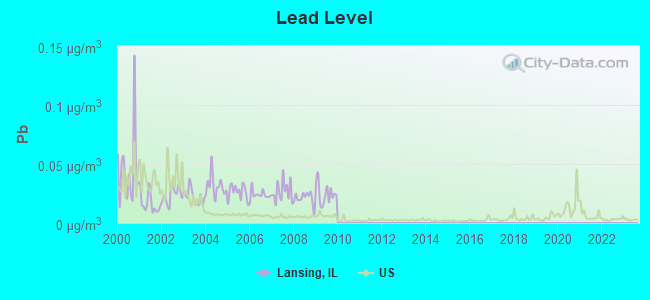
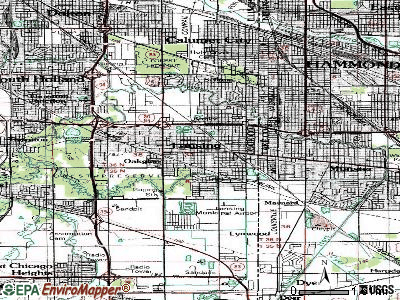
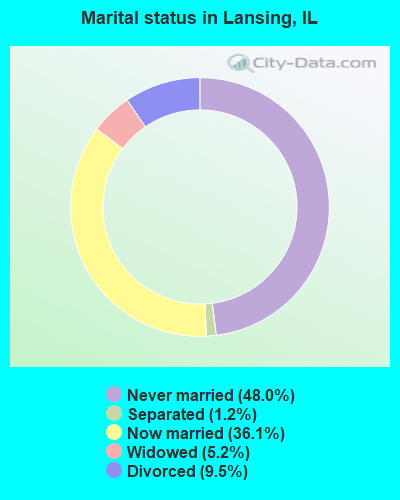
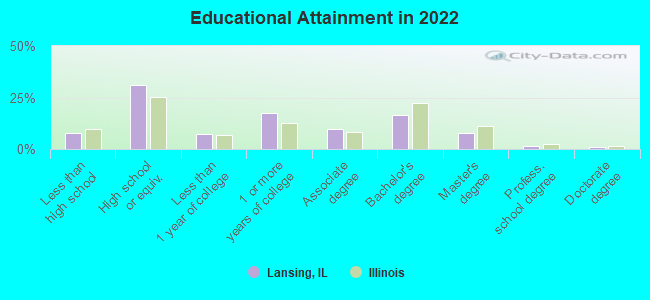
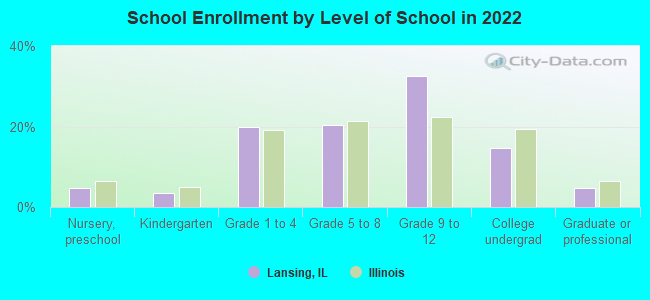
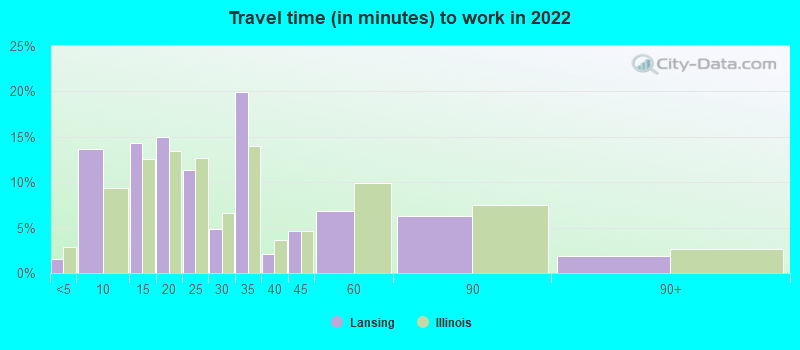
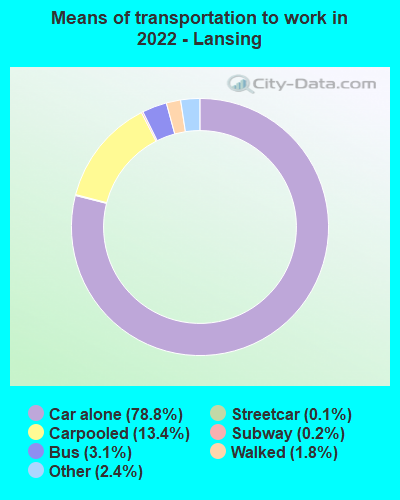


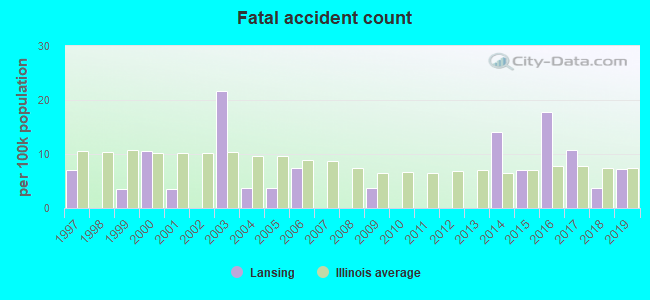
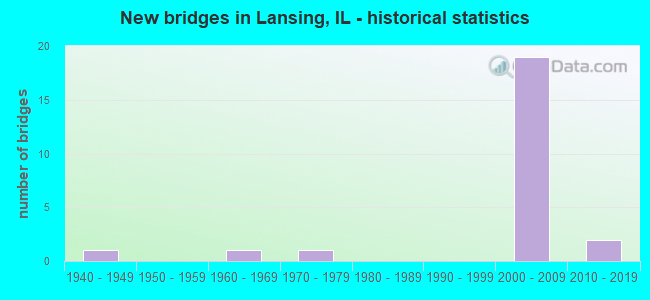
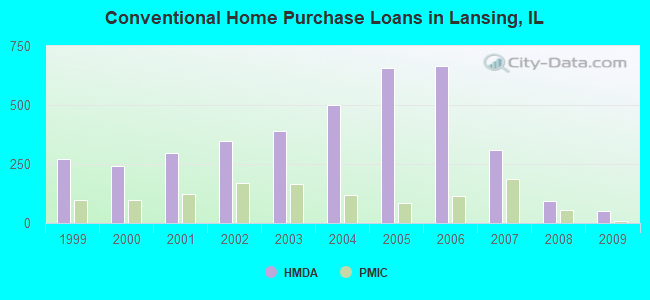
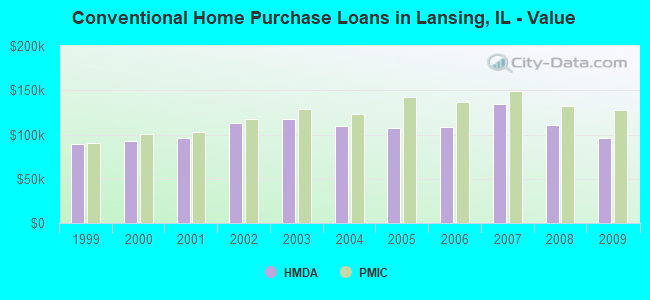
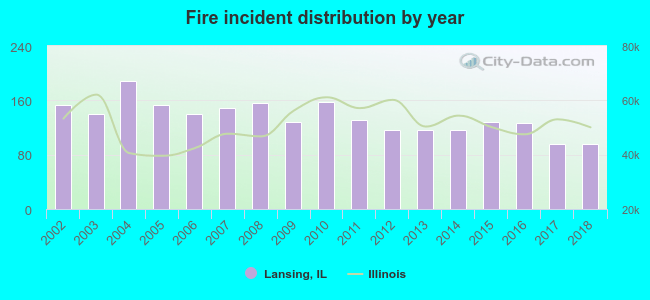 According to the data from the years 2002 - 2018 the average number of fire incidents per year is 135. The highest number of fires - 188 took place in 2004, and the least - 95 in 2018. The data has a declining trend.
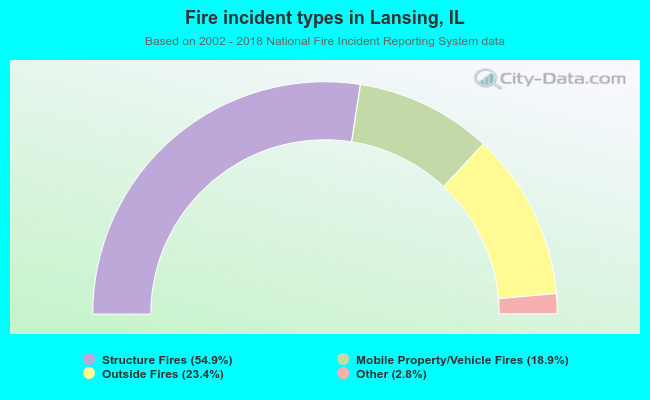 When looking into fire subcategories, the most incidents belonged to: Structure Fires (54.9%), and Outside Fires (23.4%).