Louisville, Colorado Submit your own pictures of this city and show them to the world
OSM Map
General Map
Google Map
MSN Map
OSM Map
General Map
Google Map
MSN Map
OSM Map
General Map
Google Map
MSN Map
OSM Map
General Map
Google Map
MSN Map
Please wait while loading the map...
Population in 2022: 20,560 (99% urban, 1% rural). Population change since 2000: +8.6%Males: 10,344 Females: 10,216
March 2022 cost of living index in Louisville: 114.1 (more than average, U.S. average is 100) Percentage of residents living in poverty in 2022: 5.4%for White Non-Hispanic residents , 30.3% for Black residents , 7.5% for Hispanic or Latino residents , 10.6% for other race residents , 2.4% for two or more races residents )
Profiles of local businesses
Business Search - 14 Million verified businesses
Data:
Median household income ($)
Median household income (% change since 2000)
Household income diversity
Ratio of average income to average house value (%)
Ratio of average income to average rent
Median household income ($) - White
Median household income ($) - Black or African American
Median household income ($) - Asian
Median household income ($) - Hispanic or Latino
Median household income ($) - American Indian and Alaska Native
Median household income ($) - Multirace
Median household income ($) - Other Race
Median household income for houses/condos with a mortgage ($)
Median household income for apartments without a mortgage ($)
Races - White alone (%)
Races - White alone (% change since 2000)
Races - Black alone (%)
Races - Black alone (% change since 2000)
Races - American Indian alone (%)
Races - American Indian alone (% change since 2000)
Races - Asian alone (%)
Races - Asian alone (% change since 2000)
Races - Hispanic (%)
Races - Hispanic (% change since 2000)
Races - Native Hawaiian and Other Pacific Islander alone (%)
Races - Native Hawaiian and Other Pacific Islander alone (% change since 2000)
Races - Two or more races (%)
Races - Two or more races (% change since 2000)
Races - Other race alone (%)
Races - Other race alone (% change since 2000)
Racial diversity
Unemployment (%)
Unemployment (% change since 2000)
Unemployment (%) - White
Unemployment (%) - Black or African American
Unemployment (%) - Asian
Unemployment (%) - Hispanic or Latino
Unemployment (%) - American Indian and Alaska Native
Unemployment (%) - Multirace
Unemployment (%) - Other Race
Population density (people per square mile)
Population - Males (%)
Population - Females (%)
Population - Males (%) - White
Population - Males (%) - Black or African American
Population - Males (%) - Asian
Population - Males (%) - Hispanic or Latino
Population - Males (%) - American Indian and Alaska Native
Population - Males (%) - Multirace
Population - Males (%) - Other Race
Population - Females (%) - White
Population - Females (%) - Black or African American
Population - Females (%) - Asian
Population - Females (%) - Hispanic or Latino
Population - Females (%) - American Indian and Alaska Native
Population - Females (%) - Multirace
Population - Females (%) - Other Race
Coronavirus confirmed cases (Apr 27, 2024)
Deaths caused by coronavirus (Apr 27, 2024)
Coronavirus confirmed cases (per 100k population) (Apr 27, 2024)
Deaths caused by coronavirus (per 100k population) (Apr 27, 2024)
Daily increase in number of cases (Apr 27, 2024)
Weekly increase in number of cases (Apr 27, 2024)
Cases doubled (in days) (Apr 27, 2024)
Hospitalized patients (Apr 18, 2022)
Negative test results (Apr 18, 2022)
Total test results (Apr 18, 2022)
COVID Vaccine doses distributed (per 100k population) (Sep 19, 2023)
COVID Vaccine doses administered (per 100k population) (Sep 19, 2023)
COVID Vaccine doses distributed (Sep 19, 2023)
COVID Vaccine doses administered (Sep 19, 2023)
Likely homosexual households (%)
Likely homosexual households (% change since 2000)
Likely homosexual households - Lesbian couples (%)
Likely homosexual households - Lesbian couples (% change since 2000)
Likely homosexual households - Gay men (%)
Likely homosexual households - Gay men (% change since 2000)
Cost of living index
Median gross rent ($)
Median contract rent ($)
Median monthly housing costs ($)
Median house or condo value ($)
Median house or condo value ($ change since 2000)
Mean house or condo value by units in structure - 1, detached ($)
Mean house or condo value by units in structure - 1, attached ($)
Mean house or condo value by units in structure - 2 ($)
Mean house or condo value by units in structure by units in structure - 3 or 4 ($)
Mean house or condo value by units in structure - 5 or more ($)
Mean house or condo value by units in structure - Boat, RV, van, etc. ($)
Mean house or condo value by units in structure - Mobile home ($)
Median house or condo value ($) - White
Median house or condo value ($) - Black or African American
Median house or condo value ($) - Asian
Median house or condo value ($) - Hispanic or Latino
Median house or condo value ($) - American Indian and Alaska Native
Median house or condo value ($) - Multirace
Median house or condo value ($) - Other Race
Median resident age
Resident age diversity
Median resident age - Males
Median resident age - Females
Median resident age - White
Median resident age - Black or African American
Median resident age - Asian
Median resident age - Hispanic or Latino
Median resident age - American Indian and Alaska Native
Median resident age - Multirace
Median resident age - Other Race
Median resident age - Males - White
Median resident age - Males - Black or African American
Median resident age - Males - Asian
Median resident age - Males - Hispanic or Latino
Median resident age - Males - American Indian and Alaska Native
Median resident age - Males - Multirace
Median resident age - Males - Other Race
Median resident age - Females - White
Median resident age - Females - Black or African American
Median resident age - Females - Asian
Median resident age - Females - Hispanic or Latino
Median resident age - Females - American Indian and Alaska Native
Median resident age - Females - Multirace
Median resident age - Females - Other Race
Commute - mean travel time to work (minutes)
Travel time to work - Less than 5 minutes (%)
Travel time to work - Less than 5 minutes (% change since 2000)
Travel time to work - 5 to 9 minutes (%)
Travel time to work - 5 to 9 minutes (% change since 2000)
Travel time to work - 10 to 19 minutes (%)
Travel time to work - 10 to 19 minutes (% change since 2000)
Travel time to work - 20 to 29 minutes (%)
Travel time to work - 20 to 29 minutes (% change since 2000)
Travel time to work - 30 to 39 minutes (%)
Travel time to work - 30 to 39 minutes (% change since 2000)
Travel time to work - 40 to 59 minutes (%)
Travel time to work - 40 to 59 minutes (% change since 2000)
Travel time to work - 60 to 89 minutes (%)
Travel time to work - 60 to 89 minutes (% change since 2000)
Travel time to work - 90 or more minutes (%)
Travel time to work - 90 or more minutes (% change since 2000)
Marital status - Never married (%)
Marital status - Now married (%)
Marital status - Separated (%)
Marital status - Widowed (%)
Marital status - Divorced (%)
Median family income ($)
Median family income (% change since 2000)
Median non-family income ($)
Median non-family income (% change since 2000)
Median per capita income ($)
Median per capita income (% change since 2000)
Median family income ($) - White
Median family income ($) - Black or African American
Median family income ($) - Asian
Median family income ($) - Hispanic or Latino
Median family income ($) - American Indian and Alaska Native
Median family income ($) - Multirace
Median family income ($) - Other Race
Median year house/condo built
Median year apartment built
Year house built - Built 2005 or later (%)
Year house built - Built 2000 to 2004 (%)
Year house built - Built 1990 to 1999 (%)
Year house built - Built 1980 to 1989 (%)
Year house built - Built 1970 to 1979 (%)
Year house built - Built 1960 to 1969 (%)
Year house built - Built 1950 to 1959 (%)
Year house built - Built 1940 to 1949 (%)
Year house built - Built 1939 or earlier (%)
Average household size
Household density (households per square mile)
Average household size - White
Average household size - Black or African American
Average household size - Asian
Average household size - Hispanic or Latino
Average household size - American Indian and Alaska Native
Average household size - Multirace
Average household size - Other Race
Occupied housing units (%)
Vacant housing units (%)
Owner occupied housing units (%)
Renter occupied housing units (%)
Vacancy status - For rent (%)
Vacancy status - For sale only (%)
Vacancy status - Rented or sold, not occupied (%)
Vacancy status - For seasonal, recreational, or occasional use (%)
Vacancy status - For migrant workers (%)
Vacancy status - Other vacant (%)
Residents with income below the poverty level (%)
Residents with income below 50% of the poverty level (%)
Children below poverty level (%)
Poor families by family type - Married-couple family (%)
Poor families by family type - Male, no wife present (%)
Poor families by family type - Female, no husband present (%)
Poverty status for native-born residents (%)
Poverty status for foreign-born residents (%)
Poverty among high school graduates not in families (%)
Poverty among people who did not graduate high school not in families (%)
Residents with income below the poverty level (%) - White
Residents with income below the poverty level (%) - Black or African American
Residents with income below the poverty level (%) - Asian
Residents with income below the poverty level (%) - Hispanic or Latino
Residents with income below the poverty level (%) - American Indian and Alaska Native
Residents with income below the poverty level (%) - Multirace
Residents with income below the poverty level (%) - Other Race
Air pollution - Air Quality Index (AQI)
Air pollution - CO
Air pollution - NO2
Air pollution - SO2
Air pollution - Ozone
Air pollution - PM10
Air pollution - PM25
Air pollution - Pb
Crime - Murders per 100,000 population
Crime - Rapes per 100,000 population
Crime - Robberies per 100,000 population
Crime - Assaults per 100,000 population
Crime - Burglaries per 100,000 population
Crime - Thefts per 100,000 population
Crime - Auto thefts per 100,000 population
Crime - Arson per 100,000 population
Crime - City-data.com crime index
Crime - Violent crime index
Crime - Property crime index
Crime - Murders per 100,000 population (5 year average)
Crime - Rapes per 100,000 population (5 year average)
Crime - Robberies per 100,000 population (5 year average)
Crime - Assaults per 100,000 population (5 year average)
Crime - Burglaries per 100,000 population (5 year average)
Crime - Thefts per 100,000 population (5 year average)
Crime - Auto thefts per 100,000 population (5 year average)
Crime - Arson per 100,000 population (5 year average)
Crime - City-data.com crime index (5 year average)
Crime - Violent crime index (5 year average)
Crime - Property crime index (5 year average)
1996 Presidential Elections Results (%) - Democratic Party (Clinton)
1996 Presidential Elections Results (%) - Republican Party (Dole)
1996 Presidential Elections Results (%) - Other
2000 Presidential Elections Results (%) - Democratic Party (Gore)
2000 Presidential Elections Results (%) - Republican Party (Bush)
2000 Presidential Elections Results (%) - Other
2004 Presidential Elections Results (%) - Democratic Party (Kerry)
2004 Presidential Elections Results (%) - Republican Party (Bush)
2004 Presidential Elections Results (%) - Other
2008 Presidential Elections Results (%) - Democratic Party (Obama)
2008 Presidential Elections Results (%) - Republican Party (McCain)
2008 Presidential Elections Results (%) - Other
2012 Presidential Elections Results (%) - Democratic Party (Obama)
2012 Presidential Elections Results (%) - Republican Party (Romney)
2012 Presidential Elections Results (%) - Other
2016 Presidential Elections Results (%) - Democratic Party (Clinton)
2016 Presidential Elections Results (%) - Republican Party (Trump)
2016 Presidential Elections Results (%) - Other
2020 Presidential Elections Results (%) - Democratic Party (Biden)
2020 Presidential Elections Results (%) - Republican Party (Trump)
2020 Presidential Elections Results (%) - Other
Ancestries Reported - Arab (%)
Ancestries Reported - Czech (%)
Ancestries Reported - Danish (%)
Ancestries Reported - Dutch (%)
Ancestries Reported - English (%)
Ancestries Reported - French (%)
Ancestries Reported - French Canadian (%)
Ancestries Reported - German (%)
Ancestries Reported - Greek (%)
Ancestries Reported - Hungarian (%)
Ancestries Reported - Irish (%)
Ancestries Reported - Italian (%)
Ancestries Reported - Lithuanian (%)
Ancestries Reported - Norwegian (%)
Ancestries Reported - Polish (%)
Ancestries Reported - Portuguese (%)
Ancestries Reported - Russian (%)
Ancestries Reported - Scotch-Irish (%)
Ancestries Reported - Scottish (%)
Ancestries Reported - Slovak (%)
Ancestries Reported - Subsaharan African (%)
Ancestries Reported - Swedish (%)
Ancestries Reported - Swiss (%)
Ancestries Reported - Ukrainian (%)
Ancestries Reported - United States (%)
Ancestries Reported - Welsh (%)
Ancestries Reported - West Indian (%)
Ancestries Reported - Other (%)
Educational Attainment - No schooling completed (%)
Educational Attainment - Less than high school (%)
Educational Attainment - High school or equivalent (%)
Educational Attainment - Less than 1 year of college (%)
Educational Attainment - 1 or more years of college (%)
Educational Attainment - Associate degree (%)
Educational Attainment - Bachelor's degree (%)
Educational Attainment - Master's degree (%)
Educational Attainment - Professional school degree (%)
Educational Attainment - Doctorate degree (%)
School Enrollment - Nursery, preschool (%)
School Enrollment - Kindergarten (%)
School Enrollment - Grade 1 to 4 (%)
School Enrollment - Grade 5 to 8 (%)
School Enrollment - Grade 9 to 12 (%)
School Enrollment - College undergrad (%)
School Enrollment - Graduate or professional (%)
School Enrollment - Not enrolled in school (%)
School enrollment - Public schools (%)
School enrollment - Private schools (%)
School enrollment - Not enrolled (%)
Median number of rooms in houses and condos
Median number of rooms in apartments
Housing units lacking complete plumbing facilities (%)
Housing units lacking complete kitchen facilities (%)
Density of houses
Urban houses (%)
Rural houses (%)
Households with people 60 years and over (%)
Households with people 65 years and over (%)
Households with people 75 years and over (%)
Households with one or more nonrelatives (%)
Households with no nonrelatives (%)
Population in households (%)
Family households (%)
Nonfamily households (%)
Population in families (%)
Family households with own children (%)
Median number of bedrooms in owner occupied houses
Mean number of bedrooms in owner occupied houses
Median number of bedrooms in renter occupied houses
Mean number of bedrooms in renter occupied houses
Median number of vehichles in owner occupied houses
Mean number of vehichles in owner occupied houses
Median number of vehichles in renter occupied houses
Mean number of vehichles in renter occupied houses
Mortgage status - with mortgage (%)
Mortgage status - with second mortgage (%)
Mortgage status - with home equity loan (%)
Mortgage status - with both second mortgage and home equity loan (%)
Mortgage status - without a mortgage (%)
Average family size
Average family size - White
Average family size - Black or African American
Average family size - Asian
Average family size - Hispanic or Latino
Average family size - American Indian and Alaska Native
Average family size - Multirace
Average family size - Other Race
Geographical mobility - Same house 1 year ago (%)
Geographical mobility - Moved within same county (%)
Geographical mobility - Moved from different county within same state (%)
Geographical mobility - Moved from different state (%)
Geographical mobility - Moved from abroad (%)
Place of birth - Born in state of residence (%)
Place of birth - Born in other state (%)
Place of birth - Native, outside of US (%)
Place of birth - Foreign born (%)
Housing units in structures - 1, detached (%)
Housing units in structures - 1, attached (%)
Housing units in structures - 2 (%)
Housing units in structures - 3 or 4 (%)
Housing units in structures - 5 to 9 (%)
Housing units in structures - 10 to 19 (%)
Housing units in structures - 20 to 49 (%)
Housing units in structures - 50 or more (%)
Housing units in structures - Mobile home (%)
Housing units in structures - Boat, RV, van, etc. (%)
House/condo owner moved in on average (years ago)
Renter moved in on average (years ago)
Year householder moved into unit - Moved in 1999 to March 2000 (%)
Year householder moved into unit - Moved in 1995 to 1998 (%)
Year householder moved into unit - Moved in 1990 to 1994 (%)
Year householder moved into unit - Moved in 1980 to 1989 (%)
Year householder moved into unit - Moved in 1970 to 1979 (%)
Year householder moved into unit - Moved in 1969 or earlier (%)
Means of transportation to work - Drove car alone (%)
Means of transportation to work - Carpooled (%)
Means of transportation to work - Public transportation (%)
Means of transportation to work - Bus or trolley bus (%)
Means of transportation to work - Streetcar or trolley car (%)
Means of transportation to work - Subway or elevated (%)
Means of transportation to work - Railroad (%)
Means of transportation to work - Ferryboat (%)
Means of transportation to work - Taxicab (%)
Means of transportation to work - Motorcycle (%)
Means of transportation to work - Bicycle (%)
Means of transportation to work - Walked (%)
Means of transportation to work - Other means (%)
Working at home (%)
Industry diversity
Most Common Industries - Agriculture, forestry, fishing and hunting, and mining (%)
Most Common Industries - Agriculture, forestry, fishing and hunting (%)
Most Common Industries - Mining, quarrying, and oil and gas extraction (%)
Most Common Industries - Construction (%)
Most Common Industries - Manufacturing (%)
Most Common Industries - Wholesale trade (%)
Most Common Industries - Retail trade (%)
Most Common Industries - Transportation and warehousing, and utilities (%)
Most Common Industries - Transportation and warehousing (%)
Most Common Industries - Utilities (%)
Most Common Industries - Information (%)
Most Common Industries - Finance and insurance, and real estate and rental and leasing (%)
Most Common Industries - Finance and insurance (%)
Most Common Industries - Real estate and rental and leasing (%)
Most Common Industries - Professional, scientific, and management, and administrative and waste management services (%)
Most Common Industries - Professional, scientific, and technical services (%)
Most Common Industries - Management of companies and enterprises (%)
Most Common Industries - Administrative and support and waste management services (%)
Most Common Industries - Educational services, and health care and social assistance (%)
Most Common Industries - Educational services (%)
Most Common Industries - Health care and social assistance (%)
Most Common Industries - Arts, entertainment, and recreation, and accommodation and food services (%)
Most Common Industries - Arts, entertainment, and recreation (%)
Most Common Industries - Accommodation and food services (%)
Most Common Industries - Other services, except public administration (%)
Most Common Industries - Public administration (%)
Occupation diversity
Most Common Occupations - Management, business, science, and arts occupations (%)
Most Common Occupations - Management, business, and financial occupations (%)
Most Common Occupations - Management occupations (%)
Most Common Occupations - Business and financial operations occupations (%)
Most Common Occupations - Computer, engineering, and science occupations (%)
Most Common Occupations - Computer and mathematical occupations (%)
Most Common Occupations - Architecture and engineering occupations (%)
Most Common Occupations - Life, physical, and social science occupations (%)
Most Common Occupations - Education, legal, community service, arts, and media occupations (%)
Most Common Occupations - Community and social service occupations (%)
Most Common Occupations - Legal occupations (%)
Most Common Occupations - Education, training, and library occupations (%)
Most Common Occupations - Arts, design, entertainment, sports, and media occupations (%)
Most Common Occupations - Healthcare practitioners and technical occupations (%)
Most Common Occupations - Health diagnosing and treating practitioners and other technical occupations (%)
Most Common Occupations - Health technologists and technicians (%)
Most Common Occupations - Service occupations (%)
Most Common Occupations - Healthcare support occupations (%)
Most Common Occupations - Protective service occupations (%)
Most Common Occupations - Fire fighting and prevention, and other protective service workers including supervisors (%)
Most Common Occupations - Law enforcement workers including supervisors (%)
Most Common Occupations - Food preparation and serving related occupations (%)
Most Common Occupations - Building and grounds cleaning and maintenance occupations (%)
Most Common Occupations - Personal care and service occupations (%)
Most Common Occupations - Sales and office occupations (%)
Most Common Occupations - Sales and related occupations (%)
Most Common Occupations - Office and administrative support occupations (%)
Most Common Occupations - Natural resources, construction, and maintenance occupations (%)
Most Common Occupations - Farming, fishing, and forestry occupations (%)
Most Common Occupations - Construction and extraction occupations (%)
Most Common Occupations - Installation, maintenance, and repair occupations (%)
Most Common Occupations - Production, transportation, and material moving occupations (%)
Most Common Occupations - Production occupations (%)
Most Common Occupations - Transportation occupations (%)
Most Common Occupations - Material moving occupations (%)
People in Group quarters - Institutionalized population (%)
People in Group quarters - Correctional institutions (%)
People in Group quarters - Federal prisons and detention centers (%)
People in Group quarters - Halfway houses (%)
People in Group quarters - Local jails and other confinement facilities (including police lockups) (%)
People in Group quarters - Military disciplinary barracks (%)
People in Group quarters - State prisons (%)
People in Group quarters - Other types of correctional institutions (%)
People in Group quarters - Nursing homes (%)
People in Group quarters - Hospitals/wards, hospices, and schools for the handicapped (%)
People in Group quarters - Hospitals/wards and hospices for chronically ill (%)
People in Group quarters - Hospices or homes for chronically ill (%)
People in Group quarters - Military hospitals or wards for chronically ill (%)
People in Group quarters - Other hospitals or wards for chronically ill (%)
People in Group quarters - Hospitals or wards for drug/alcohol abuse (%)
People in Group quarters - Mental (Psychiatric) hospitals or wards (%)
People in Group quarters - Schools, hospitals, or wards for the mentally retarded (%)
People in Group quarters - Schools, hospitals, or wards for the physically handicapped (%)
People in Group quarters - Institutions for the deaf (%)
People in Group quarters - Institutions for the blind (%)
People in Group quarters - Orthopedic wards and institutions for the physically handicapped (%)
People in Group quarters - Wards in general hospitals for patients who have no usual home elsewhere (%)
People in Group quarters - Wards in military hospitals for patients who have no usual home elsewhere (%)
People in Group quarters - Juvenile institutions (%)
People in Group quarters - Long-term care (%)
People in Group quarters - Homes for abused, dependent, and neglected children (%)
People in Group quarters - Residential treatment centers for emotionally disturbed children (%)
People in Group quarters - Training schools for juvenile delinquents (%)
People in Group quarters - Short-term care, detention or diagnostic centers for delinquent children (%)
People in Group quarters - Type of juvenile institution unknown (%)
People in Group quarters - Noninstitutionalized population (%)
People in Group quarters - College dormitories (includes college quarters off campus) (%)
People in Group quarters - Military quarters (%)
People in Group quarters - On base (%)
People in Group quarters - Barracks, unaccompanied personnel housing (UPH), (Enlisted/Officer), ;and similar group living quarters for military personnel (%)
People in Group quarters - Transient quarters for temporary residents (%)
People in Group quarters - Military ships (%)
People in Group quarters - Group homes (%)
People in Group quarters - Homes or halfway houses for drug/alcohol abuse (%)
People in Group quarters - Homes for the mentally ill (%)
People in Group quarters - Homes for the mentally retarded (%)
People in Group quarters - Homes for the physically handicapped (%)
People in Group quarters - Other group homes (%)
People in Group quarters - Religious group quarters (%)
People in Group quarters - Dormitories (%)
People in Group quarters - Agriculture workers' dormitories on farms (%)
People in Group quarters - Job Corps and vocational training facilities (%)
People in Group quarters - Other workers' dormitories (%)
People in Group quarters - Crews of maritime vessels (%)
People in Group quarters - Other nonhousehold living situations (%)
People in Group quarters - Other noninstitutional group quarters (%)
Residents speaking English at home (%)
Residents speaking English at home - Born in the United States (%)
Residents speaking English at home - Native, born elsewhere (%)
Residents speaking English at home - Foreign born (%)
Residents speaking Spanish at home (%)
Residents speaking Spanish at home - Born in the United States (%)
Residents speaking Spanish at home - Native, born elsewhere (%)
Residents speaking Spanish at home - Foreign born (%)
Residents speaking other language at home (%)
Residents speaking other language at home - Born in the United States (%)
Residents speaking other language at home - Native, born elsewhere (%)
Residents speaking other language at home - Foreign born (%)
Class of Workers - Employee of private company (%)
Class of Workers - Self-employed in own incorporated business (%)
Class of Workers - Private not-for-profit wage and salary workers (%)
Class of Workers - Local government workers (%)
Class of Workers - State government workers (%)
Class of Workers - Federal government workers (%)
Class of Workers - Self-employed workers in own not incorporated business and Unpaid family workers (%)
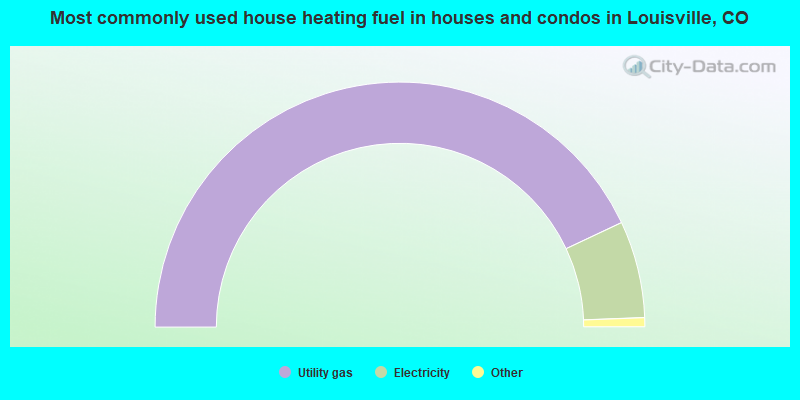
House heating fuel used in houses and condos - Utility gas (%)
House heating fuel used in houses and condos - Bottled, tank, or LP gas (%)
House heating fuel used in houses and condos - Electricity (%)
House heating fuel used in houses and condos - Fuel oil, kerosene, etc. (%)
House heating fuel used in houses and condos - Coal or coke (%)
House heating fuel used in houses and condos - Wood (%)
House heating fuel used in houses and condos - Solar energy (%)
House heating fuel used in houses and condos - Other fuel (%)
House heating fuel used in houses and condos - No fuel used (%)
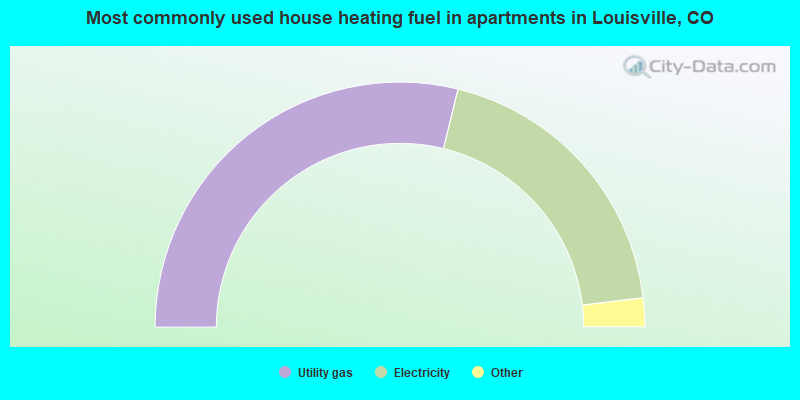
House heating fuel used in apartments - Utility gas (%)
House heating fuel used in apartments - Bottled, tank, or LP gas (%)
House heating fuel used in apartments - Electricity (%)
House heating fuel used in apartments - Fuel oil, kerosene, etc. (%)
House heating fuel used in apartments - Coal or coke (%)
House heating fuel used in apartments - Wood (%)
House heating fuel used in apartments - Solar energy (%)
House heating fuel used in apartments - Other fuel (%)
House heating fuel used in apartments - No fuel used (%)
Armed forces status - In Armed Forces (%)
Armed forces status - Civilian (%)
Armed forces status - Civilian - Veteran (%)
Armed forces status - Civilian - Nonveteran (%)
Fatal accidents locations in years 2005-2021
Fatal accidents locations in 2005
Fatal accidents locations in 2006
Fatal accidents locations in 2007
Fatal accidents locations in 2008
Fatal accidents locations in 2009
Fatal accidents locations in 2010
Fatal accidents locations in 2011
Fatal accidents locations in 2012
Fatal accidents locations in 2013
Fatal accidents locations in 2014
Fatal accidents locations in 2015
Fatal accidents locations in 2016
Fatal accidents locations in 2017
Fatal accidents locations in 2018
Fatal accidents locations in 2019
Fatal accidents locations in 2020
Fatal accidents locations in 2021
Alcohol use - People drinking some alcohol every month (%)
Alcohol use - People not drinking at all (%)
Alcohol use - Average days/month drinking alcohol
Alcohol use - Average drinks/week
Alcohol use - Average days/year people drink much
Audiometry - Average condition of hearing (%)
Audiometry - People that can hear a whisper from across a quiet room (%)
Audiometry - People that can hear normal voice from across a quiet room (%)
Audiometry - Ears ringing, roaring, buzzing (%)
Audiometry - Had a job exposure to loud noise (%)
Audiometry - Had off-work exposure to loud noise (%)
Blood Pressure & Cholesterol - Has high blood pressure (%)
Blood Pressure & Cholesterol - Checking blood pressure at home (%)
Blood Pressure & Cholesterol - Frequently checking blood cholesterol (%)
Blood Pressure & Cholesterol - Has high cholesterol level (%)
Consumer Behavior - Money monthly spent on food at supermarket/grocery store
Consumer Behavior - Money monthly spent on food at other stores
Consumer Behavior - Money monthly spent on eating out
Consumer Behavior - Money monthly spent on carryout/delivered foods
Consumer Behavior - Income spent on food at supermarket/grocery store (%)
Consumer Behavior - Income spent on food at other stores (%)
Consumer Behavior - Income spent on eating out (%)
Consumer Behavior - Income spent on carryout/delivered foods (%)
Current Health Status - General health condition (%)
Current Health Status - Blood donors (%)
Current Health Status - Has blood ever tested for HIV virus (%)
Current Health Status - Left-handed people (%)
Dermatology - People using sunscreen (%)
Diabetes - Diabetics (%)
Diabetes - Had a blood test for high blood sugar (%)
Diabetes - People taking insulin (%)
Diet Behavior & Nutrition - Diet health (%)
Diet Behavior & Nutrition - Milk product consumption (# of products/month)
Diet Behavior & Nutrition - Meals not home prepared (#/week)
Diet Behavior & Nutrition - Meals from fast food or pizza place (#/week)
Diet Behavior & Nutrition - Ready-to-eat foods (#/month)
Diet Behavior & Nutrition - Frozen meals/pizza (#/month)
Drug Use - People that ever used marijuana or hashish (%)
Drug Use - Ever used hard drugs (%)
Drug Use - Ever used any form of cocaine (%)
Drug Use - Ever used heroin (%)
Drug Use - Ever used methamphetamine (%)
Health Insurance - People covered by health insurance (%)
Kidney Conditions-Urology - Avg. # of times urinating at night
Medical Conditions - People with asthma (%)
Medical Conditions - People with anemia (%)
Medical Conditions - People with psoriasis (%)
Medical Conditions - People with overweight (%)
Medical Conditions - Elderly people having difficulties in thinking or remembering (%)
Medical Conditions - People who ever received blood transfusion (%)
Medical Conditions - People having trouble seeing even with glass/contacts (%)
Medical Conditions - People with arthritis (%)
Medical Conditions - People with gout (%)
Medical Conditions - People with congestive heart failure (%)
Medical Conditions - People with coronary heart disease (%)
Medical Conditions - People with angina pectoris (%)
Medical Conditions - People who ever had heart attack (%)
Medical Conditions - People who ever had stroke (%)
Medical Conditions - People with emphysema (%)
Medical Conditions - People with thyroid problem (%)
Medical Conditions - People with chronic bronchitis (%)
Medical Conditions - People with any liver condition (%)
Medical Conditions - People who ever had cancer or malignancy (%)
Mental Health - People who have little interest in doing things (%)
Mental Health - People feeling down, depressed, or hopeless (%)
Mental Health - People who have trouble sleeping or sleeping too much (%)
Mental Health - People feeling tired or having little energy (%)
Mental Health - People with poor appetite or overeating (%)
Mental Health - People feeling bad about themself (%)
Mental Health - People who have trouble concentrating on things (%)
Mental Health - People moving or speaking slowly or too fast (%)
Mental Health - People having thoughts they would be better off dead (%)
Oral Health - Average years since last visit a dentist
Oral Health - People embarrassed because of mouth (%)
Oral Health - People with gum disease (%)
Oral Health - General health of teeth and gums (%)
Oral Health - Average days a week using dental floss/device
Oral Health - Average days a week using mouthwash for dental problem
Oral Health - Average number of teeth
Pesticide Use - Households using pesticides to control insects (%)
Pesticide Use - Households using pesticides to kill weeds (%)
Physical Activity - People doing vigorous-intensity work activities (%)
Physical Activity - People doing moderate-intensity work activities (%)
Physical Activity - People walking or bicycling (%)
Physical Activity - People doing vigorous-intensity recreational activities (%)
Physical Activity - People doing moderate-intensity recreational activities (%)
Physical Activity - Average hours a day doing sedentary activities
Physical Activity - Average hours a day watching TV or videos
Physical Activity - Average hours a day using computer
Physical Functioning - People having limitations keeping them from working (%)
Physical Functioning - People limited in amount of work they can do (%)
Physical Functioning - People that need special equipment to walk (%)
Physical Functioning - People experiencing confusion/memory problems (%)
Physical Functioning - People requiring special healthcare equipment (%)
Prescription Medications - Average number of prescription medicines taking
Preventive Aspirin Use - Adults 40+ taking low-dose aspirin (%)
Reproductive Health - Vaginal deliveries (%)
Reproductive Health - Cesarean deliveries (%)
Reproductive Health - Deliveries resulted in a live birth (%)
Reproductive Health - Pregnancies resulted in a delivery (%)
Reproductive Health - Women breastfeeding newborns (%)
Reproductive Health - Women that had a hysterectomy (%)
Reproductive Health - Women that had both ovaries removed (%)
Reproductive Health - Women that have ever taken birth control pills (%)
Reproductive Health - Women taking birth control pills (%)
Reproductive Health - Women that have ever used Depo-Provera or injectables (%)
Reproductive Health - Women that have ever used female hormones (%)
Sexual Behavior - People 18+ that ever had sex (vaginal, anal, or oral) (%)
Sexual Behavior - Males 18+ that ever had vaginal sex with a woman (%)
Sexual Behavior - Males 18+ that ever performed oral sex on a woman (%)
Sexual Behavior - Males 18+ that ever had anal sex with a woman (%)
Sexual Behavior - Males 18+ that ever had any sex with a man (%)
Sexual Behavior - Females 18+ that ever had vaginal sex with a man (%)
Sexual Behavior - Females 18+ that ever performed oral sex on a man (%)
Sexual Behavior - Females 18+ that ever had anal sex with a man (%)
Sexual Behavior - Females 18+ that ever had any kind of sex with a woman (%)
Sexual Behavior - Average age people first had sex
Sexual Behavior - Average number of female sex partners in lifetime (males 18+)
Sexual Behavior - Average number of female vaginal sex partners in lifetime (males 18+)
Sexual Behavior - Average age people first performed oral sex on a woman (18+)
Sexual Behavior - Average number of woman performed oral sex on in lifetime (18+)
Sexual Behavior - Average number of male sex partners in lifetime (males 18+)
Sexual Behavior - Average number of male anal sex partners in lifetime (males 18+)
Sexual Behavior - Average age people first performed oral sex on a man (18+)
Sexual Behavior - Average number of male oral sex partners in lifetime (18+)
Sexual Behavior - People using protection when performing oral sex (%)
Sexual Behavior - Average number of times people have vaginal or anal sex a year
Sexual Behavior - People having sex without condom (%)
Sexual Behavior - Average number of male sex partners in lifetime (females 18+)
Sexual Behavior - Average number of male vaginal sex partners in lifetime (females 18+)
Sexual Behavior - Average number of female sex partners in lifetime (females 18+)
Sexual Behavior - Circumcised males 18+ (%)
Sleep Disorders - Average hours sleeping at night
Sleep Disorders - People that has trouble sleeping (%)
Smoking-Cigarette Use - People smoking cigarettes (%)
Taste & Smell - People 40+ having problems with smell (%)
Taste & Smell - People 40+ having problems with taste (%)
Taste & Smell - People 40+ that ever had wisdom teeth removed (%)
Taste & Smell - People 40+ that ever had tonsils teeth removed (%)
Taste & Smell - People 40+ that ever had a loss of consciousness because of a head injury (%)
Taste & Smell - People 40+ that ever had a broken nose or other serious injury to face or skull (%)
Taste & Smell - People 40+ that ever had two or more sinus infections (%)
Weight - Average height (inches)
Weight - Average weight (pounds)
Weight - Average BMI
Weight - People that are obese (%)
Weight - People that ever were obese (%)
Weight - People trying to lose weight (%)
16,514 79.2% White alone 2,203 10.6% Hispanic 1,420 6.8% Two or more races 685 3.3% Asian alone 98 0.5% Black alone 26 0.1% Other race alone 2 0.01% American Indian alone
According to our research of Colorado and other state lists, there were 13 registered sex offenders living in Louisville, Colorado as of April 27, 2024 . The ratio of all residents to sex offenders in Louisville is 1,577 to 1.The ratio of registered sex offenders to all residents in this city is much lower than the state average.
Officers per 1,000 residents here:
1.46Colorado average:
2.14
Latest news from Louisville, CO collected exclusively by city-data.com from local newspapers, TV, and radio stations
Louisville, CO City Guides: Ancestries: German (14.4%), European (9.6%), Irish (8.8%), English (8.4%), Italian (5.9%), American (4.8%).
Current Local Time:
Land area: 8.52 square miles.
Population density: 2,414 people per square mile (low).
1,596 residents are foreign born (2.6% Asia , 2.0% Europe , 1.7% Latin America ).
This city:
7.7%Colorado:
9.5%
Median real estate property taxes paid for housing units with mortgages in 2022: $4,052 (0.5%)Median real estate property taxes paid for housing units with no mortgage in 2022: $4,008 (0.5%)
Nearest city with pop. 50,000+: Boulder, CO
Nearest city with pop. 200,000+: West Adams, CO (10.7 miles
Nearest city with pop. 1,000,000+: Phoenix, AZ
Nearest cities:
Valmont, CO (2.3 miles),
Leyner, CO (2.4 miles),
Latitude: 39.98 N, Longitude: 105.14 W
Daytime population change due to commuting: +9,341 (+44.8%)Workers who live and work in this city: 6,152 (54.3%)
Single-family new house construction building permits:
2022: 141 buildings , average cost: $945,7002021: 13 buildings , average cost: $831,8002020: 35 buildings , average cost: $263,7002019: 32 buildings , average cost: $238,1002018: 17 buildings , average cost: $463,0002017: 43 buildings , average cost: $285,7002016: 45 buildings , average cost: $302,3002015: 73 buildings , average cost: $288,3002014: 63 buildings , average cost: $277,0002013: 140 buildings , average cost: $225,1002012: 117 buildings , average cost: $225,1002011: 98 buildings , average cost: $207,2002010: 13 buildings , average cost: $236,2002009: 17 buildings , average cost: $232,0002008: 36 buildings , average cost: $291,8002007: 5 buildings , average cost: $362,4002006: 8 buildings , average cost: $413,4002005: 2 buildings , average cost: $394,8002004: 14 buildings , average cost: $106,9002003: 3 buildings , average cost: $329,7002002: 14 buildings , average cost: $321,6002001: 2 buildings , average cost: $164,9002000: 7 buildings , average cost: $218,6001999: 18 buildings , average cost: $189,9001998: 41 buildings , average cost: $192,2001997: 44 buildings , average cost: $192,400Unemployment in December 2023:
Population change in the 1990s: +6,350 (+50.4%).
Most common occupations in Louisville, CO (%)
Both Males Females
Computer specialists (10.1%)
Other management occupations, except farmers and farm managers (7.1%)
Engineers (4.2%)
Other office and administrative support workers, including supervisors (4.0%)
Preschool, kindergarten, elementary, and middle school teachers (3.8%)
Other sales and related occupations, including supervisors (3.3%)
Operations specialties managers, except financial managers (3.2%)
Computer specialists (13.8%)
Other management occupations, except farmers and farm managers (9.0%)
Engineers (6.7%)
Operations specialties managers, except financial managers (4.2%)
Sales representatives, services, wholesale and manufacturing (3.6%)
Other sales and related occupations, including supervisors (3.4%)
Top executives (2.9%)
Secretaries and administrative assistants (6.6%)
Other office and administrative support workers, including supervisors (6.3%)
Preschool, kindergarten, elementary, and middle school teachers (6.2%)
Computer specialists (6.0%)
Other management occupations, except farmers and farm managers (5.1%)
Registered nurses (4.3%)
Information and record clerks, except customer service representatives (3.3%)
Tornado activity:
Louisville-area historical tornado activity is above Colorado state average. It is 17% greater than the overall U.S. average.
On 6/15/1988, a category F3 (max. wind speeds 158-206 mph) tornado 20.5 miles away from the Louisville city center injured 7 people and caused between $5,000,000 and $50,000,000 in damages.
On 5/18/1975, a category F3 tornado 25.1 miles away from the city center .
Earthquake activity:
Louisville-area historical earthquake activity is significantly above Colorado state average. It is 722% greater than the overall U.S. average. On 8/18/1959 at 06:37:13, a magnitude 7.7 (7.7 UK, Class: Major, Intensity: VIII - XII) earthquake occurred 424.5 miles away from Louisville center, causing $26,000,000 total damage On 10/18/1984 at 15:30:23, a magnitude 5.5 (5.4 MB, 5.1 MS, 5.5 ML, Class: Moderate, Intensity: VI - VII) earthquake occurred 168.8 miles away from the city center On 10/28/1983 at 14:06:06, a magnitude 7.3 (6.2 MB, 7.3 MS, 7.0 MW) earthquake occurred 527.1 miles away from Louisville center, causing 2 deaths ( 2 shaking deaths) and 3 injuries, causing $15,000,000 total damage On 8/23/2011 at 05:46:18, a magnitude 5.3 (5.3 MW, Depth: 2.5 mi) earthquake occurred 202.9 miles away from the city center On 3/28/1975 at 02:31:05, a magnitude 6.2 (6.1 MB, 6.0 MS, 6.2 ML, Class: Strong, Intensity: VII - IX) earthquake occurred 407.6 miles away from the city center On 2/3/1995 at 15:26:10, a magnitude 5.3 (5.3 MB, 4.6 MS, Depth: 0.6 mi) earthquake occurred 258.9 miles away from Louisville center Magnitude types: body-wave magnitude (MB), local magnitude (ML), surface-wave magnitude (MS), moment magnitude (MW) Natural disasters: The number of natural disasters in Boulder County (14) is near the US average (15).Major Disasters (Presidential) Declared: 5Emergencies Declared: 4Fires: 5, Floods: 5, Storms: 4, Landslides: 3, Mudslides: 3, Snows: 2, Heavy Rain: 1, Hurricane: 1, Snowstorm: 1, Tornado: 1, Other: 1 (Note: some incidents may be assigned to more than one category). Main business address for: RAINDANCE COMMUNICATIONS INC COMMUNICATION SERVICES, NEC ), FRONT RANGE CAPITAL CORP NATIONAL COMMERCIAL BANKS ), STORAGE TECHNOLOGY CORP COMPUTER STORAGE DEVICES ).
Hospitals and medical centers in Louisville: AVISTA HOSPICE (333 SO BOULDER RD SUITE 4) CENTURA HEALTH-AVISTA ADVENTIST HOSPITAL (Voluntary non-profit - Church, provides emergency services, 100 HEALTH PARK DRIVE) INTERIM HEALTHCARE OF GREATER DENVER INC (325 W SOUTH BOULDER RD, #4)
Amtrak stations near Louisville: 10 miles: BOULDER (4401 N. BROADWAY) - Bus Station Services: enclosed waiting area, public payphones, snack bar.
14 miles: LONGMONT (615 N. MAUB ST.) - Bus Station 18 miles: DENVER (1701 WYNKOOP ST.) Services: ticket office, fully wheelchair accessible, enclosed waiting area, public restrooms, public payphones, full-service food facilities and snack bar, paid short-term parking, paid long-term parking, call for car rental service, taxi stand, public transit connection.
College/University in Louisville: Institute of Taoist Education and Acupuncture Full-time enrollment: 25; Location: 317 W South Boulder Rd, Suite 5; Private, not-for-profit; Website: www.itea.edu; Offers Master's degree )
Colleges/universities with over 2000 students nearest to Louisville:
University of Colorado Boulder (about 7 miles; Boulder, CO ; Full-time enrollment: 28,328)
Front Range Community College (about 8 miles; Westminster, CO ; FT enrollment: 14,756)
Regis University (about 15 miles; Denver, CO ; FT enrollment: 6,975)
Colorado School of Mines (about 17 miles; Golden, CO ; FT enrollment: 5,507)
University of Colorado Denver (about 18 miles; Denver, CO ; FT enrollment: 14,727)
Red Rocks Community College (about 18 miles; Lakewood, CO ; FT enrollment: 6,185)
Metropolitan State University of Denver (about 18 miles; Denver, CO ; FT enrollment: 17,242)
Public high school in Louisville:
Public elementary/middle schools in Louisville: MONARCH K-8 SCHOOL Students: 757, Location: 263 CAMPUS DRIVE, Grades: PK-8)LOUISVILLE MIDDLE SCHOOL Students: 567, Location: 1341 MAIN STREET, Grades: 6-8)COAL CREEK ELEMENTARY SCHOOL Students: 470, Location: 801 WEST TAMARISK STREET, Grades: KG-5)FIRESIDE ELEMENTARY SCHOOL Students: 453, Location: 845 WEST DAHLIA, Grades: PK-5)LOUISVILLE ELEMENTARY SCHOOL Students: 428, Location: 400 HUTCHINSON STREET, Grades: KG-5)Private elementary/middle school in Louisville: ST LOUIS CATHOLIC SCHOOL Students: 219, Location: 925 GRANT AVE, Grades: PK-8)
See full list of schools located in Louisville Library in Louisville: LOUISVILLE PUBLIC LIBRARY Operating income: $1,185,075; Location: 951 SPRUCE STREET; 67,095 books ; 49 e-books ; 7,513 audio materials ; 5,550 video materials ; 14 local licensed databases ; 3 other licensed databases ; 191 print serial subscriptions )
User-submitted facts and corrections:
Colleges/universities with over 2000 students nearest to Louisville:
The University of Colorado at Boulder is about 8 miles away, not 18 as stated on this page.
Louisville was rated the top 5 city to live in, in America.
Notable locations in Louisville: (A) , Coal Creek Golf Course (B) , Colorado Technological Center (C) , Louisville Fire Protection District Station 2 (D) , Louisville Police Department (E) , Louisville Recreation/Senior Center (F) , Louisville Fire Protection District Station 1 (G) , Louisville City Hall (H) , Louisville Municipal Court (I) , North Metro Fire / Rescue Department Station 67 (J) , Louisville Police Department (K) . Display/hide their locations on the map
Main business address in Louisville include: (A) , FRONT RANGE CAPITAL CORP (B) , STORAGE TECHNOLOGY CORP (C) . Display/hide their locations on the map
Churches in Louisville include: (A) , Christ the Servant Lutheran Church (B) . Display/hide their locations on the map
Cemetery: (1) . Display/hide its location on the map
Lakes and reservoirs: (A) , Louisville Reservoir Number 1 (B) , Hecla Lake (C) , Louisville Reservoir (D) , Cowdrey Reservoir (E) . Display/hide their locations on the map
Parks in Louisville include: (1) , Centennial Park (2) , Cleo Murdock Park (3) , Cottonwood Park (4) , Dutch Creek Park (5) , Heritage Park (6) , Lake Park (7) , Memory Square Park (8) , Middle School Park (9) . Display/hide their locations on the map
Tourist attractions:
Hotels:
Birthplace of: Chris Lamb - College basketball player (San Diego State Aztecs), Jack D. Fischer - Aviator, Phil Mudrock - Baseball player, Scott Senger - College basketball player (Colorado Buffaloes).
Boulder County has a predicted average indoor radon screening level greater than 4 pCi/L (pico curies per liter) - Highest Potential Drinking water stations with addresses in Louisville and their reported violations in the past:
LOUISVILLE CITY OF (Population served: 19,500, Surface water):
Past monitoring violations:
Monitoring and Reporting (DBP) - In APR-2014, Contaminant: Chlorite. Follow-up actions: St Public Notif requested (AUG-15-2014), St Violation/Reminder Notice (AUG-15-2014), St Public Notif received (AUG-26-2014), St Compliance achieved (AUG-26-2014)
Monitoring of Treatment (SWTR-Filter) - In SEP-2011. Follow-up actions: St Public Notif requested (NOV-03-2011), St Violation/Reminder Notice (NOV-03-2011), St Compliance achieved (NOV-15-2011)
Monitoring, Turbidity (Enhanced SWTR) - In SEP-2011, Contaminant: IESWTR. Follow-up actions: St Public Notif requested (NOV-01-2011), St Violation/Reminder Notice (NOV-01-2011), St Compliance achieved (NOV-15-2011)
Monitoring of Treatment (SWTR-Filter) - In MAY-2010. Follow-up actions: St Public Notif requested (JUL-07-2010), St Violation/Reminder Notice (JUL-07-2010), St Compliance achieved (JUL-13-2010), St Public Notif received (MAY-10-2011)
Monitoring and Reporting (DBP) - Between APR-2010 and JUN-2010, Contaminant: Chlorine. Follow-up actions: St Public Notif requested (JUL-07-2010), St Violation/Reminder Notice (JUL-07-2010), St Compliance achieved (JUL-13-2010), St Public Notif received (MAY-10-2011)
One minor monitoring violation
One regular monitoring violation
Average household size: This city:
2.4 peopleColorado:
2.5 people
Percentage of family households: This city:
65.5%Whole state:
63.9%
Percentage of households with unmarried partners: This city:
5.4%Whole state:
6.5%
Likely homosexual households (counted as self-reported same-sex unmarried-partner households)
Lesbian couples: 0.7% of all households Gay men: 0.2% of all households
People in group quarters in Louisville in 2010:
119 people in nursing facilities/skilled-nursing facilities
11 people in residential treatment centers for juveniles (non-correctional)
3 people in group homes intended for adults
people in nursing homes in 2000people in other noninstitutional group quarters in 2000Banks with most branches in Louisville (2011 data):
Great Western Bank: Louisville Main Street Branch at 801 Main Street, Suite 130, branch established on 1998/08/10; Louisville Branch at 1020 Century Drive, branch established on 1995/07/17. Info updated 2010/06/08: Bank assets: $8,458.0 mil, Deposits: $6,362.5 mil, headquarters in Watertown, SD, positive income , Commercial Lending Specialization, 187 total offices , Holding Company: National Australia Bank Limited
JPMorgan Chase Bank, National Association: Mccaslin Branch at 578 Mccaslin Boulevard, branch established on 1995/02/21; Louisville Branch at 833 Main Street, branch established on 1915/02/08. Info updated 2011/11/10: Bank assets: $1,811,678.0 mil, Deposits: $1,190,738.0 mil, headquarters in Columbus, OH, positive income , International Specialization, 5577 total offices , Holding Company: Jpmorgan Chase & Co.
First National Bank of Omaha: Louisville Branch at 515 Mccaslin Blvd, branch established on 1998/04/01. Info updated 2010/10/13: Bank assets: $13,433.1 mil, Deposits: $10,746.6 mil, headquarters in Omaha, NE, positive income , Commercial Lending Specialization, 102 total offices , Holding Company: Lauritzen Corporation
U.S. Bank National Association: Louisville Albertsons Branch at 910 West Cherry Avenue, branch established on 1996/06/30. Info updated 2012/01/30: Bank assets: $330,470.8 mil, Deposits: $236,091.5 mil, headquarters in Cincinnati, OH, positive income , 3121 total offices , Holding Company: U.S. Bancorp
FirstBank: Louisville Branch at 500 S. Mccaslin Blvd, branch established on 1994/10/03. Info updated 2011/12/05: Bank assets: $11,597.1 mil, Deposits: $10,530.4 mil, headquarters in Lakewood, CO, positive income , Mortgage Lending Specialization, 130 total offices , Holding Company: Firstbank Holding Company
Bank of the West: Louisville North at 865 South Boulder Road, branch established on 1891/01/01. Info updated 2009/11/16: Bank assets: $62,408.3 mil, Deposits: $43,995.2 mil, headquarters in San Francisco, CA, positive income , 647 total offices , Holding Company: Bnp Paribas
KeyBank National Association: Mccaslin Blvd Branch at 409 South Mc Caslin Blvd, branch established on 2009/06/15. Info updated 2008/03/03: Bank assets: $86,198.8 mil, Deposits: $64,214.8 mil, headquarters in Cleveland, OH, positive income , Commercial Lending Specialization, 1067 total offices , Holding Company: Keycorp
Wells Fargo Bank, National Association: Louisville Branch at 1137 South Boulder Road, branch established on 1994/11/28. Info updated 2011/04/05: Bank assets: $1,161,490.0 mil, Deposits: $905,653.0 mil, headquarters in Sioux Falls, SD, positive income , 6395 total offices , Holding Company: Wells Fargo & Company
CoBiz Bank: Colorado Business Bank - Northwest B at 400 Centennial Parkway Suite 100, branch established on 2004/11/22. Info updated 2007/04/19: Bank assets: $2,372.4 mil, Deposits: $1,946.0 mil, headquarters in Denver, CO, positive income , Commercial Lending Specialization, 20 total offices , Holding Company: Cobiz Financial, Inc.
For population 15 years and over in Louisville:
Never married: 30.1%Now married: 55.5%Separated: 0.4%Widowed: 5.1%Divorced: 8.9% For population 25 years and over in Louisville:
High school or higher: 98.5%Bachelor's degree or higher: 65.9%Graduate or professional degree: 31.9%Unemployed: 2.0%Mean travel time to work (commute): 14.1 minutes
Education Gini index (Inequality in education) Here:
9.5Colorado average:
11.1
Religion statistics for Louisville, CO (based on Boulder County data)
Religion Adherents Congregations Catholic 59,240 11 Evangelical Protestant 28,825 101 Mainline Protestant 19,126 43 Other 14,359 74 Orthodox 718 4 None 172,299 -
Source: Clifford Grammich, Kirk Hadaway, Richard Houseal, Dale E.Jones, Alexei Krindatch, Richie Stanley and Richard H.Taylor. 2012. 2010 U.S.Religion Census: Religious Congregations & Membership Study. Association of Statisticians of American Religious Bodies. Jones, Dale E., et al. 2002. Congregations and Membership in the United States 2000. Nashville, TN: Glenmary Research Center. Graphs represent county-level data
Food Environment Statistics: Number of grocery stores : 45Boulder County :
1.56 / 10,000 pop.Colorado :
1.50 / 10,000 pop.
Number of supercenters and club stores : 3This county :
0.10 / 10,000 pop.State :
0.15 / 10,000 pop.
Number of convenience stores (no gas) : 11Boulder County :
0.38 / 10,000 pop.Colorado :
0.45 / 10,000 pop.
Number of convenience stores (with gas) : 68This county :
2.35 / 10,000 pop.Colorado :
3.13 / 10,000 pop.
Number of full-service restaurants : 287This county :
9.94 / 10,000 pop.State :
8.99 / 10,000 pop.
Adult diabetes rate : This county :
3.6%State :
5.3%
Adult obesity rate : This county :
12.5%Colorado :
18.4%
Low-income preschool obesity rate : Health and Nutrition:
Average overall health of teeth and gums : This city:
55.1%State:
47.8%
Average BMI : This city:
28.2Colorado:
28.5
People feeling badly about themselves : This city:
19.3%Colorado:
20.7%
People not drinking alcohol at all : Average hours sleeping at night : Louisville:
6.9Colorado:
6.8
Overweight people : Louisville:
33.9%Colorado:
33.3%
General health condition : Average condition of hearing : Louisville:
82.6%Colorado:
80.2%
More about Health and Nutrition of Louisville, CO Residents
Local government employment and payroll (March 2022)
Function
Full-time employees
Monthly full-time payroll
Average yearly full-time wage
Part-time employees
Monthly part-time payroll
Parks and Recreation
41 $261,569 $76,557 119 $79,506 Other Government Administration
30 $259,784 $103,914 10 $23,797 Police Protection - Officers
27 $248,531 $110,458 0 $0 Streets and Highways
26 $161,393 $74,489 0 $0 Financial Administration
16 $124,230 $93,173 0 $0 Local Libraries
11 $69,004 $75,277 23 $41,633 Police - Other
9 $44,715 $59,620 5 $18,084 Water Supply
9 $47,720 $63,627 0 $0 Natural Resources
6 $28,910 $57,820 0 $0 Other and Unallocable
5 $32,667 $78,401 0 $0 Sewerage
5 $25,424 $61,018 0 $0 Judicial and Legal
1 $4,964 $59,568 0 $0
Totals for Government
186 $1,308,913 $84,446 157 $163,020
Louisville government finances - Expenditure in 2021 (per resident):
Construction - Regular Highways: $9,414,000 ($457.88)
Water Utilities: $2,706,000 ($131.61)Natural Resources - Other: $1,566,000 ($76.17)Parks and Recreation: $320,000 ($15.56)Financial Administration: $190,000 ($9.24)Central Staff Services: $97,000 ($4.72)Police Protection: $45,000 ($2.19)Current Operations - Parks and Recreation: $5,534,000 ($269.16)
Police Protection: $5,362,000 ($260.80)Central Staff Services: $5,321,000 ($258.80)Regular Highways: $2,680,000 ($130.35)Water Utilities: $2,669,000 ($129.82)Financial Administration: $2,071,000 ($100.73)Sewerage: $1,975,000 ($96.06)Natural Resources - Other: $1,672,000 ($81.32)Solid Waste Management: $1,514,000 ($73.64)Libraries: $1,498,000 ($72.86)General Public Buildings: $1,483,000 ($72.13)Protective Inspection and Regulation - Other: $704,000 ($34.24)Judicial and Legal Services: $575,000 ($27.97)Housing and Community Development: $436,000 ($21.21)Miscellaneous Commercial Activities - Other: $27,000 ($1.31)General - Interest on Debt: $435,000 ($21.16)
Intergovernmental to Local - Other - Housing and Community Development: $532,000 ($25.88)
Other - Water Utilities: $342,000 ($16.63)Other - Police Protection: $318,000 ($15.47)Other - Solid Waste Management: $70,000 ($3.40)Other Capital Outlay - Police Protection: $680,000 ($33.07)
Natural Resources - Other: $459,000 ($22.32)Parks and Recreation: $354,000 ($17.22)Regular Highways: $92,000 ($4.47)Water Utilities: $82,000 ($3.99)Miscellaneous Commercial Activities - Other: $8,000 ($0.39)Total Salaries and Wages: $15,865,000 ($771.64)
Water Utilities - Interest on Debt: $1,672,000 ($81.32)
Louisville government finances - Revenue in 2021 (per resident):
Charges - Sewerage: $5,362,000 ($260.80)
Parks and Recreation: $3,036,000 ($147.67)Solid Waste Management: $1,652,000 ($80.35)Other: $205,000 ($9.97)Miscellaneous Commercial Activities: $60,000 ($2.92)Local Intergovernmental - Other: $812,000 ($39.49)
Highways: $63,000 ($3.06)Miscellaneous - Interest Earnings: $911,000 ($44.31)
General Revenue - Other: $495,000 ($24.08)Rents: $118,000 ($5.74)Fines and Forfeits: $93,000 ($4.52)Sale of Property: $43,000 ($2.09)Revenue - Water Utilities: $8,914,000 ($433.56)
State Intergovernmental - Other: $2,472,000 ($120.23)
Highways: $2,087,000 ($101.51)General Local Government Support: $49,000 ($2.38)Water Utilities: $5,000 ($0.24)Tax - General Sales and Gross Receipts: $20,603,000 ($1002.09)
Property: $9,528,000 ($463.42)Other License: $1,992,000 ($96.89)Public Utilities Sales: $1,012,000 ($49.22)Other Selective Sales: $363,000 ($17.66)Alcoholic Beverage License: $10,000 ($0.49)
Louisville government finances - Debt in 2021 (per resident):
Long Term Debt - Beginning Outstanding - Unspecified Public Purpose: $36,495,000 ($1775.05)
Outstanding Unspecified Public Purpose: $35,582,000 ($1730.64)Beginning Outstanding - Public Debt for Private Purpose: $32,564,000 ($1583.85)Outstanding Nonguaranteed - Industrial Revenue: $30,814,000 ($1498.74)Retired Nonguaranteed - Public Debt for Private Purpose: $1,750,000 ($85.12)Retired Unspecified Public Purpose: $912,000 ($44.36)
Louisville government finances - Cash and Securities in 2021 (per resident):
Other Funds - Cash and Securities: $58,825,000 ($2861.14)
Sinking Funds - Cash and Securities: $32,554,000 ($1583.37)
Businesses in Louisville, CO
Name Count Name Count
7-Eleven 1 Lowe's 1 Albertsons 1 Marriott 2 Best Western 1 MasterBrand Cabinets 2 Big O Tires 1 McDonald's 1 Blockbuster 1 New Balance 1 Burger King 1 Nike 3 Chipotle 1 Outback 1 Dairy Queen 1 Outback Steakhouse 1 Domino's Pizza 1 Qdoba Mexican Grill 1 FedEx 4 Quality 1 GNC 1 Quiznos 1 H&R Block 1 Safeway 1 Hilton 1 Starbucks 1 Hobby Lobby 1 Subway 2 Home Depot 1 The Room Place 1 Jones New York 1 UPS 1 Kohl's 1 Vons 1 Kroger 1 Walgreens 2 La Quinta 1
Strongest AM radio stations in Louisville:
KKZN (760 AM; 50 kW; THORNTON, CO; Owner: JACOR BROADCASTING OF COLORADO, INC.)
KVCU (1190 AM; 7 kW; BOULDER, CO; Owner: THE UNIVERSITY OF CO FOUNDATION, INC.)
KLTT (670 AM; 50 kW; COMMERCE CITY, CO; Owner: KLZ RADIO, INC.)
KLMO (1060 AM; 30 kW; LONGMONT, CO; Owner: PILGRIM COMMUNICATIONS, INC.)
KPOF (910 AM; 5 kW; DENVER, CO; Owner: PILLAR OF FIRE)
KLZ (560 AM; 5 kW; DENVER, CO; Owner: KLZ RADIO, INC.)
KHOW (630 AM; 5 kW; DENVER, CO; Owner: CITICASTERS LICENSES, L.P.)
KRKS (990 AM; 10 kW; DENVER, CO; Owner: SALEM MEDIA OF COLORADO, INC.)
KMXA (1090 AM; 50 kW; AURORA, CO; Owner: ENTRAVISION HOLDINGS, LLC)
KOA (850 AM; 50 kW; DENVER, CO; Owner: JACOR BROADCASTING OF COLORADO, INC.)
KKFN (950 AM; 5 kW; DENVER, CO; Owner: JEFFERSON-PILOT COMMUNICATIONS COMPANY OF COLORADO)
KNUS (710 AM; 5 kW; DENVER, CO; Owner: SALEM MEDIA OF COLORADO, INC.)
KBJD (1650 AM; 10 kW; DENVER, CO; Owner: SALEM MEDIA OF COLORADO, INC.)
Strongest FM radio stations in Louisville:
KGNU (88.5 FM; BOULDER, CO; Owner: BOULDER COMMUNITY B/CST. ASSN., INC.)
KBCO-FM (97.3 FM; BOULDER, CO; Owner: CITICASTERS LICENSES, L.P.)
KRKS-FM (94.7 FM; LAFAYETTE, CO; Owner: SALEM MEDIA OF COLORADO, INC)
KBPI (106.7 FM; DENVER, CO; Owner: JACOR BROADCASTING OF COLORADO, INC.)
KALC (105.9 FM; DENVER, CO; Owner: ENTERCOM DENVER LICENSE, LLC)
KJCD (104.3 FM; LONGMONT, CO; Owner: JEFFERSON-PILOT COMMUNICATIONS COMPANY OF COLORADO)
KFMD (95.7 FM; DENVER, CO; Owner: CITICASTERS LICENSES, L.P.)
KRFX (103.5 FM; DENVER, CO; Owner: JACOR BROADCASTING OF COLORADO, INC.)
KOSI (101.1 FM; DENVER, CO; Owner: ENTERCOM DENVER LICENSE, LLC)
KDJM (92.5 FM; BROOMFIELD, CO; Owner: INFINITY RADIO OPERATIONS INC.)
KQMT (99.5 FM; DENVER, CO; Owner: ENTERCOM DENVER LICENSE, LLC)
KTCL (93.3 FM; FORT COLLINS, CO; Owner: JACOR BROADCASTING OF COLORADO, INC.)
KUVO (89.3 FM; DENVER, CO; Owner: DENVER EDUCATIONAL BROADCASTING)
KQKS (107.5 FM; LAKEWOOD, CO; Owner: JEFFERSON-PILOT COMMUNICATIONS COMPANY OF COLORADO)
KYGO-FM (98.5 FM; DENVER, CO; Owner: JEFFERSON-PILOT COMMUNICATIONS COMPANY OF COLORADO)
KXPK (96.5 FM; EVERGREEN, CO; Owner: ENTRAVISION HOLDINGS, LLC)
KIMN (100.3 FM; DENVER, CO; Owner: INFINITY RADIO OPERATIONS INC.)
KVOD (90.1 FM; DENVER, CO; Owner: PUBLIC BROADCASTING OF COLORADO, INC)
K209DE (89.7 FM; GOLDEN, CO; Owner: WAY-FM MEDIA GROUP, INC.)
KXKL-FM (105.1 FM; DENVER, CO; Owner: INFINITY RADIO OPERATIONS INC.)
TV broadcast stations around Louisville:
KDEN (Channel 25; LONGMONT, CO; Owner: LONGMONT CHANNEL 25, INC.)
KUSA-TV (Channel 9; DENVER, CO; Owner: MULTIMEDIA HOLDINGS CORPORATION)
KMGH-TV (Channel 7; DENVER, CO; Owner: MCGRAW-HILL BROADCASTING COMPANY, INC.)
K47IH (Channel 47; BOULDER, CO; Owner: CHANNEL 20 TV COMPANY)
KTVD (Channel 20; DENVER, CO; Owner: TWENVER BROADCAST, INC.)
KCNC-TV (Channel 4; DENVER, CO; Owner: CBS TELEVISION STATIONS INC.)
KRMA-TV (Channel 6; DENVER, CO; Owner: ROCKY MOUNTAIN PUBLIC BROADCASTING NETWORK, INC.)
K44CT (Channel 44; BOULDER, CO; Owner: ROCKY MOUNTAIN PUBLIC BROADCASTING NETWORK, INC.)
KWGN-TV (Channel 2; DENVER, CO; Owner: KWGN INC.)
K48FW (Channel 48; DENVER, CO; Owner: TRINITY BROADCASTING NETWORK)
KDVR (Channel 31; DENVER, CO; Owner: FOX TELEVISION STATIONS, INC.)
KMAS-LP (Channel 63; DENVER, CO; Owner: TELEMUNDO OF STEAMBOAT SPRINGS COLO. LIC. CORP.)
KDEO-LP (Channel 38; AURORA, CO; Owner: PETER B. VAN DE SANDE)
K17CF (Channel 17; BOULDER, CO; Owner: FULL GOSPEL OUTREACH, INC.)
K66FB (Channel 66; DENVER, CO; Owner: TRINITY BROADCASTING NETWORK)
KPXC-TV (Channel 59; DENVER, CO; Owner: PAXSON DENVER LICENSE, INC.)
K11QJ (Channel 11; BOULDER, CO; Owner: FRONT RANGE EDUCATIONAL MEDIA CORP.)
KDVT-LP (Channel 36; DENVER, CO; Owner: ENTRAVISION HOLDINGS, LLC)
K54DK (Channel 54; BOULDER, CO; Owner: FOX TELEVISION STATIONS, INC.)
K45HH (Channel 45; DENVER, CO; Owner: SYNCOM MEDIA GROUP, INC.)
K28HJ (Channel 28; DENVER, CO; Owner: SYNCOM MEDIA GROUP, INC.)
KCIN-LP (Channel 27; DENVER, CO; Owner: SYNCOM MEDIA GROUP, INC.)
National Bridge Inventory (NBI) Statistics 8 Number of bridges125ft / 38.5m Total length93,408 Total average daily traffic8,215 Total average daily truck traffic
FCC Registered Cell Phone Towers: 1
1955 Washington Street (Lat: 39.992472 Lon: -105.154972), Type: Mast, Structure height: 45.7 m, Call Sign: KNKA220Assigned Frequencies: 880.020 MHz, 880.020 MHz, 880.020 MHz, 835.020 MHz, 835.020 MHz, 835.020 MHz, 891.510 MHz, 891.510 MHz, 891.510 MHz, 846.510 MHz, 846.510 MHz, 846.510 MHzGrant Date: 08/26/2014, Expiration Date: 10/01/2024, Certifier: Gregory M RomanoRegistrant: Verizon, 1300 I St Nw - Suite 500 East, Washington, DC 20005, Phone: (202) 515-2453, Email:
FCC Registered Antenna Towers: 3
DOUGLAS M SHORT, 1958 Washington Avenue (Lat: 39.992500 Lon: -105.155000), Type: 50.3, Overall height: 45.7 m, Registrant: City Of Layfayette, Douglass@cityoflafayette.Com, , Lafay-ette, Phone: (303) 665-5588 Aditya Rudrakshi, 2000 Taylor Ave (Lat: 39.970278 Lon: -105.111111), Type: 15.0, Structure height: 08013 m, Overall height: 1 m, Registrant: Sierra Space Corporation, Aditya.Rudrakshi@sncorp.Com, , Broom-field, Phone: (303) 530-1925 Aditya Rudrakshi, 2000 Taylor Ave (Lat: 39.970278 Lon: -105.111111), Type: 15.0, Structure height: 08013 m, Overall height: 1 m, Registrant: Sierra Space Corporation, Aditya.Rudrakshi@sncorp.Com, , Broom-field, Phone: (303) 530-1925 FCC Registered Private Land Mobile Towers: 3 (
See the full list of FCC Registered Private Land Mobile Towers in Louisville, CO )
FCC Registered Broadcast Land Mobile Towers: 33 (
See the full list of FCC Registered Broadcast Land Mobile Towers )
FCC Registered Microwave Towers: 21 (
See the full list of FCC Registered Microwave Towers in this town )
FCC Registered Paging Towers: 1 (
See the full list of FCC Registered Paging Towers )
FCC Registered Amateur Radio Licenses: 250 (
See the full list of FCC Registered Amateur Radio Licenses in Louisville )
FAA Registered Aircraft Manufacturers and Dealers: 3 (
See the full list of FAA Registered Manufacturers and Dealers in Louisville )
FAA Registered Aircraft: 27 (
See the full list of FAA Registered Aircraft )
Home Mortgage Disclosure Act Aggregated Statistics For Year 2009(Based on 4 full and 6 partial tracts) A) FHA, FSA/RHS & VA B) Conventional C) Refinancings D) Home Improvement Loans F) Non-occupant Loans on G) Loans On Manufactured Number Average Value Number Average Value Number Average Value Number Average Value Number Average Value Number Average Value
LOANS ORIGINATED 50 $266,752 179 $287,622 1,033 $255,701 28 $99,208 44 $208,337 0 $0 APPLICATIONS APPROVED, NOT ACCEPTED 2 $348,935 9 $287,007 52 $277,147 4 $215,965 2 $144,465 0 $0 APPLICATIONS DENIED 4 $252,672 19 $276,903 137 $268,638 8 $59,129 7 $217,487 3 $3,663 APPLICATIONS WITHDRAWN 2 $283,795 22 $265,665 137 $239,493 12 $173,530 11 $186,522 0 $0 FILES CLOSED FOR INCOMPLETENESS 0 $0 0 $0 34 $279,842 4 $71,095 2 $136,530 0 $0
Aggregated Statistics For Year 2008(Based on 4 full and 6 partial tracts) A) FHA, FSA/RHS & VA B) Conventional C) Refinancings D) Home Improvement Loans E) Loans on Dwellings For 5+ Families F) Non-occupant Loans on G) Loans On Manufactured Number Average Value Number Average Value Number Average Value Number Average Value Number Average Value Number Average Value Number Average Value
LOANS ORIGINATED 32 $255,065 226 $258,424 384 $251,472 31 $106,939 2 $1,055,385 54 $201,223 1 $35,960 APPLICATIONS APPROVED, NOT ACCEPTED 2 $165,955 27 $302,663 44 $244,543 7 $157,327 0 $0 6 $196,528 0 $0 APPLICATIONS DENIED 1 $81,000 30 $268,430 81 $257,597 20 $76,129 0 $0 15 $197,707 2 $12,205 APPLICATIONS WITHDRAWN 2 $194,705 23 $268,077 63 $240,834 6 $101,917 0 $0 10 $197,929 0 $0 FILES CLOSED FOR INCOMPLETENESS 0 $0 2 $101,840 18 $248,533 2 $102,485 0 $0 2 $142,575 0 $0
Aggregated Statistics For Year 2007(Based on 4 full and 6 partial tracts) A) FHA, FSA/RHS & VA B) Conventional C) Refinancings D) Home Improvement Loans E) Loans on Dwellings For 5+ Families F) Non-occupant Loans on G) Loans On Manufactured Number Average Value Number Average Value Number Average Value Number Average Value Number Average Value Number Average Value Number Average Value
LOANS ORIGINATED 11 $263,762 406 $230,977 349 $220,757 35 $95,009 2 $2,970,500 71 $196,703 2 $16,490 APPLICATIONS APPROVED, NOT ACCEPTED 1 $158,320 41 $249,850 56 $198,769 11 $83,339 0 $0 8 $170,671 0 $0 APPLICATIONS DENIED 0 $0 31 $264,110 108 $209,588 12 $86,757 0 $0 13 $187,030 0 $0 APPLICATIONS WITHDRAWN 0 $0 25 $253,178 52 $234,597 7 $121,453 0 $0 6 $159,485 1 $43,310 FILES CLOSED FOR INCOMPLETENESS 0 $0 1 $107,560 14 $240,176 1 $87,000 0 $0 0 $0 0 $0
Aggregated Statistics For Year 2006(Based on 4 full and 6 partial tracts) A) FHA, FSA/RHS & VA B) Conventional C) Refinancings D) Home Improvement Loans F) Non-occupant Loans on G) Loans On Manufactured Number Average Value Number Average Value Number Average Value Number Average Value Number Average Value Number Average Value
LOANS ORIGINATED 7 $225,940 424 $207,970 381 $213,767 43 $62,417 89 $170,230 0 $0 APPLICATIONS APPROVED, NOT ACCEPTED 0 $0 30 $210,014 64 $194,706 4 $33,138 8 $176,076 0 $0 APPLICATIONS DENIED 0 $0 53 $183,938 137 $221,564 21 $74,047 13 $189,612 1 $42,170 APPLICATIONS WITHDRAWN 0 $0 37 $211,993 121 $236,597 8 $236,440 18 $271,720 1 $295,000 FILES CLOSED FOR INCOMPLETENESS 1 $150,000 7 $170,374 20 $196,826 2 $345,035 1 $173,100 0 $0
Aggregated Statistics For Year 2005(Based on 4 full and 6 partial tracts) A) FHA, FSA/RHS & VA B) Conventional C) Refinancings D) Home Improvement Loans E) Loans on Dwellings For 5+ Families F) Non-occupant Loans on G) Loans On Manufactured Number Average Value Number Average Value Number Average Value Number Average Value Number Average Value Number Average Value Number Average Value
LOANS ORIGINATED 9 $217,119 487 $208,746 547 $217,697 50 $147,617 2 $3,490,640 94 $174,070 3 $10,673 APPLICATIONS APPROVED, NOT ACCEPTED 0 $0 31 $187,071 46 $216,260 10 $39,085 0 $0 4 $155,288 2 $33,010 APPLICATIONS DENIED 0 $0 39 $178,674 187 $217,131 25 $93,755 0 $0 22 $164,255 5 $22,724 APPLICATIONS WITHDRAWN 2 $197,315 50 $206,676 139 $229,755 18 $104,043 0 $0 11 $147,883 0 $0 FILES CLOSED FOR INCOMPLETENESS 0 $0 8 $180,329 36 $287,880 4 $145,460 0 $0 2 $204,540 0 $0
Aggregated Statistics For Year 2004(Based on 4 full and 6 partial tracts) A) FHA, FSA/RHS & VA B) Conventional C) Refinancings D) Home Improvement Loans F) Non-occupant Loans on G) Loans On Manufactured Number Average Value Number Average Value Number Average Value Number Average Value Number Average Value Number Average Value
LOANS ORIGINATED 20 $216,127 404 $218,585 731 $212,705 37 $77,548 101 $176,571 2 $84,400 APPLICATIONS APPROVED, NOT ACCEPTED 0 $0 26 $195,612 71 $202,599 9 $55,441 4 $130,968 0 $0 APPLICATIONS DENIED 4 $147,758 42 $181,538 167 $222,982 25 $52,989 20 $169,624 6 $27,383 APPLICATIONS WITHDRAWN 7 $176,693 40 $221,119 117 $215,927 8 $92,172 9 $150,622 0 $0 FILES CLOSED FOR INCOMPLETENESS 0 $0 0 $0 29 $296,494 3 $29,647 1 $215,090 0 $0
Aggregated Statistics For Year 2003(Based on 4 full and 6 partial tracts) A) FHA, FSA/RHS & VA B) Conventional C) Refinancings D) Home Improvement Loans E) Loans on Dwellings For 5+ Families F) Non-occupant Loans on Number Average Value Number Average Value Number Average Value Number Average Value Number Average Value Number Average Value
LOANS ORIGINATED 49 $205,042 414 $207,229 2,224 $192,696 42 $51,800 1 $6,150,300 233 $155,791 APPLICATIONS APPROVED, NOT ACCEPTED 2 $178,225 29 $231,432 161 $191,701 11 $54,406 0 $0 14 $169,498 APPLICATIONS DENIED 3 $171,867 44 $143,700 220 $209,122 15 $35,247 0 $0 25 $149,434 APPLICATIONS WITHDRAWN 4 $161,515 27 $267,776 183 $193,188 3 $58,243 0 $0 12 $155,852 FILES CLOSED FOR INCOMPLETENESS 0 $0 6 $189,172 31 $163,300 2 $94,160 0 $0 2 $188,045
Aggregated Statistics For Year 1999(Based on 1 full and 5 partial tracts) A) FHA, FSA/RHS & VA B) Conventional C) Refinancings D) Home Improvement Loans E) Loans on Dwellings For 5+ Families F) Non-occupant Loans on Number Average Value Number Average Value Number Average Value Number Average Value Number Average Value Number Average Value
LOANS ORIGINATED 56 $154,399 590 $173,904 579 $140,147 78 $29,958 1 $939,000 121 $133,052 APPLICATIONS APPROVED, NOT ACCEPTED 0 $0 62 $138,029 95 $124,886 13 $23,267 0 $0 14 $97,580 APPLICATIONS DENIED 5 $184,204 76 $123,362 110 $116,904 30 $27,680 0 $0 19 $107,864 APPLICATIONS WITHDRAWN 4 $187,198 51 $178,974 89 $133,546 9 $74,692 0 $0 11 $146,654 FILES CLOSED FOR INCOMPLETENESS 0 $0 20 $193,093 22 $156,694 2 $54,225 0 $0 4 $199,130
Detailed mortgage data for all 10 tracts in Louisville, CO
Private Mortgage Insurance Companies Aggregated Statistics For Year 2009(Based on 4 full and 5 partial tracts) A) Conventional B) Refinancings C) Non-occupant Loans on Number Average Value Number Average Value Number Average Value
LOANS ORIGINATED 36 $270,407 35 $279,364 0 $0 APPLICATIONS APPROVED, NOT ACCEPTED 5 $303,696 9 $293,884 1 $303,110 APPLICATIONS DENIED 4 $311,330 3 $327,173 0 $0 APPLICATIONS WITHDRAWN 2 $235,805 3 $364,040 1 $208,000 FILES CLOSED FOR INCOMPLETENESS 1 $304,220 0 $0 0 $0
Aggregated Statistics For Year 2008(Based on 4 full and 5 partial tracts) A) Conventional B) Refinancings C) Non-occupant Loans on Number Average Value Number Average Value Number Average Value
LOANS ORIGINATED 56 $271,494 32 $288,174 7 $192,953 APPLICATIONS APPROVED, NOT ACCEPTED 12 $303,867 9 $300,034 0 $0 APPLICATIONS DENIED 9 $253,201 1 $444,740 4 $323,758 APPLICATIONS WITHDRAWN 1 $182,500 2 $233,195 0 $0 FILES CLOSED FOR INCOMPLETENESS 1 $274,250 0 $0 0 $0
Aggregated Statistics For Year 2007(Based on 4 full and 6 partial tracts) A) Conventional B) Refinancings C) Non-occupant Loans on Number Average Value Number Average Value Number Average Value
LOANS ORIGINATED 61 $243,038 20 $257,787 2 $160,150 APPLICATIONS APPROVED, NOT ACCEPTED 2 $182,230 7 $262,237 1 $113,890 APPLICATIONS DENIED 0 $0 1 $257,100 0 $0 APPLICATIONS WITHDRAWN 2 $141,850 1 $280,500 0 $0 FILES CLOSED FOR INCOMPLETENESS 0 $0 0 $0 0 $0
Aggregated Statistics For Year 2006(Based on 4 full and 5 partial tracts) A) Conventional B) Refinancings C) Non-occupant Loans on Number Average Value Number Average Value Number Average Value
LOANS ORIGINATED 19 $216,407 9 $273,648 1 $120,400 APPLICATIONS APPROVED, NOT ACCEPTED 0 $0 4 $162,948 1 $149,380 APPLICATIONS DENIED 0 $0 2 $275,000 1 $275,000 APPLICATIONS WITHDRAWN 1 $258,050 2 $112,210 0 $0 FILES CLOSED FOR INCOMPLETENESS 0 $0 0 $0 0 $0
Aggregated Statistics For Year 2005(Based on 4 full and 6 partial tracts) A) Conventional B) Refinancings Number Average Value Number Average Value
LOANS ORIGINATED 16 $251,789 13 $244,747 APPLICATIONS APPROVED, NOT ACCEPTED 1 $467,720 2 $183,015 APPLICATIONS DENIED 0 $0 0 $0 APPLICATIONS WITHDRAWN 2 $251,250 0 $0 FILES CLOSED FOR INCOMPLETENESS 0 $0 0 $0
Aggregated Statistics For Year 2004(Based on 4 full and 5 partial tracts) A) Conventional B) Refinancings C) Non-occupant Loans on Number Average Value Number Average Value Number Average Value
LOANS ORIGINATED 20 $215,640 22 $232,989 7 $219,109 APPLICATIONS APPROVED, NOT ACCEPTED 0 $0 9 $231,176 1 $251,290 APPLICATIONS DENIED 0 $0 1 $277,000 0 $0 APPLICATIONS WITHDRAWN 0 $0 4 $270,188 0 $0 FILES CLOSED FOR INCOMPLETENESS 1 $247,300 0 $0 0 $0
Aggregated Statistics For Year 2003(Based on 4 full and 6 partial tracts) A) Conventional B) Refinancings C) Non-occupant Loans on Number Average Value Number Average Value Number Average Value
LOANS ORIGINATED 55 $235,443 72 $220,690 6 $184,560 APPLICATIONS APPROVED, NOT ACCEPTED 1 $291,700 21 $251,459 1 $243,990 APPLICATIONS DENIED 1 $243,250 0 $0 0 $0 APPLICATIONS WITHDRAWN 2 $334,175 4 $273,878 0 $0 FILES CLOSED FOR INCOMPLETENESS 0 $0 0 $0 0 $0
Aggregated Statistics For Year 1999(Based on 1 full and 5 partial tracts) A) Conventional B) Refinancings C) Non-occupant Loans on Number Average Value Number Average Value Number Average Value
LOANS ORIGINATED 193 $198,356 37 $169,101 13 $181,821 APPLICATIONS APPROVED, NOT ACCEPTED 28 $188,229 17 $162,493 6 $184,137 APPLICATIONS DENIED 13 $195,079 4 $126,230 7 $214,860 APPLICATIONS WITHDRAWN 3 $219,387 3 $174,937 1 $205,720 FILES CLOSED FOR INCOMPLETENESS 0 $0 0 $0 0 $0
Fire-safe hotels and motels in Louisville, Colorado:
Quality Inn Boulder County, 1196 Dillon Rd, Louisville, Colorado 80027 Phone: (303) 604-0181, Fax: (303) 604-6558
Hampton Inn Boulder/Louisville, 912 W Dillon Rd, Louisville, Colorado 80027 Phone: (303) 666-7700, Fax: (303) 666-7374
Best Western Plus Louiseville Inn & Suites, 960 W Dillon Rd, Louisville, Colorado 80027 Phone: (303) 327-1215, Fax: (303) 665-2382
Residence Inn By Marriott Boulder Louisville, 845 Coal Creek Cir, Louisville, Colorado 80027 Phone: (303) 665-2661, Fax: (303) 665-9842
Courtyard By Marriott Boulder Louisville, 948 W Dillon Rd, Louisville, Colorado 80027 Phone: (303) 604-0007, Fax: (303) 604-0047
All 5 fire-safe hotels and motels in Louisville, Colorado
Most common first names in Louisville, CO among deceased individuals Name Count Lived (average)
Mary 55 80.6 years John 45 77.5 years George 34 75.4 years James 33 73.8 years Robert 32 69.1 years William 32 77.1 years Helen 28 84.7 years Joseph 27 78.3 years Frank 24 79.1 years Margaret 22 81.2 years
Most common last names in Louisville, CO among deceased individuals Last name Count Lived (average)
Brown 15 76.2 years Madonna 11 83.5 years Coet 10 80.4 years Thompson 9 77.7 years Anderson 8 79.0 years Rickman 8 74.0 years Smith 8 66.6 years Thomas 8 80.7 years Johnson 7 83.6 years Martella 7 80.4 years
Louisville compared to Colorado state average:
Median house value above state average. Unemployed percentage significantly below state average. Black race population percentage significantly below state average. Hispanic race population percentage below state average. Length of stay since moving in significantly above state average. House age below state average. Percentage of population with a bachelor's degree or higher above state average. Louisville on our top lists :
#63 on the list of "Top 101 cities with the most local government spending on current operations of parks and recreation per resident (population 10,000+)"
#82 on the list of "Top 101 cities with the most people having Master's or Doctorate degrees (population 5,000+)"
#2 on the list of "Top 101 counties with the highest percentage of residents that exercised in the past month"
#4 on the list of "Top 101 counties with the lowest average weight of females"
#5 on the list of "Top 101 counties with the lowest number of infant deaths per 1000 residents 2007-2013 (pop. 50,000+)"
#5 on the list of "Top 101 counties with the largest decrease in the number of infant deaths per 1000 residents 2000-2006 to 2007-2013 (pop. 50,000+)"
#7 on the list of "Top 101 counties with the best general health status score of residents (1-5), 3 years of data"
Top Patent Applicants
Paul Roller Michaelis (84)
Charles I. Cook (48)
Kristin D. Johnson (48)
Bo Chen (41)
Angele Sjong (39)
David A. Coleman (29)
Gary Milne (26)
Francis Ming-Meng Ngai (25)
Joseph A. Paulus (23)
Timothy Richard Feldman (22)
Total of 1666 patent applications in 2008-2024.

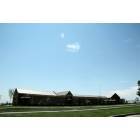

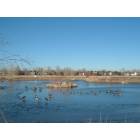
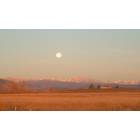
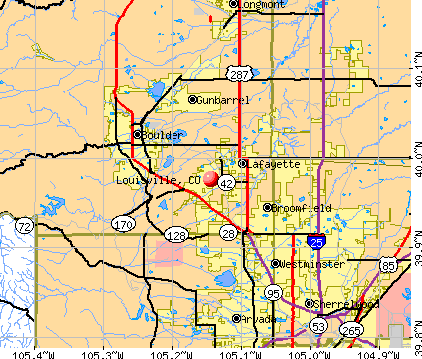


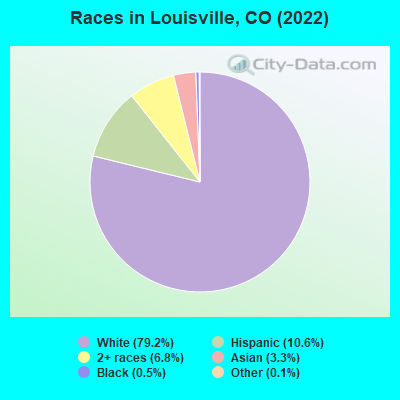
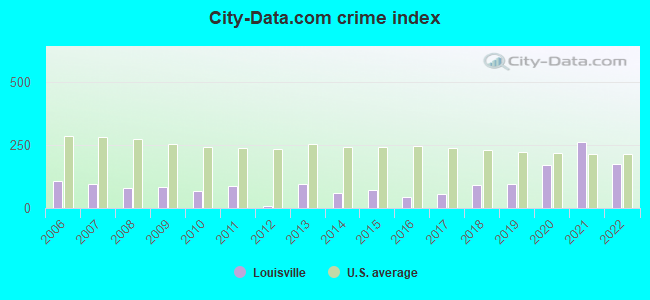
 Recent articles from our blog. Our writers, many of them Ph.D. graduates or candidates, create easy-to-read articles on a wide variety of topics.

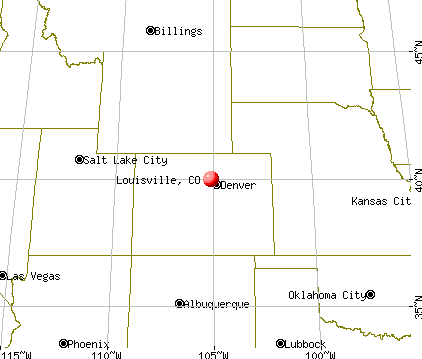
 (6.8 miles
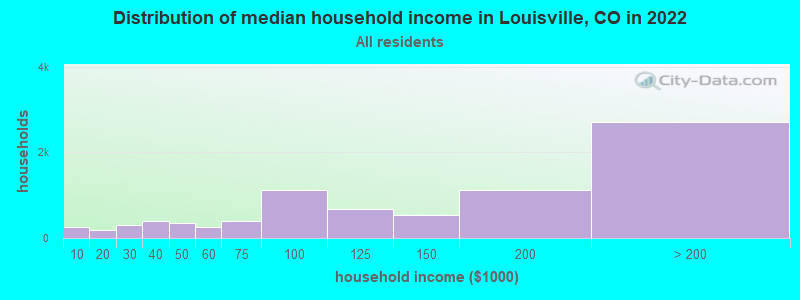
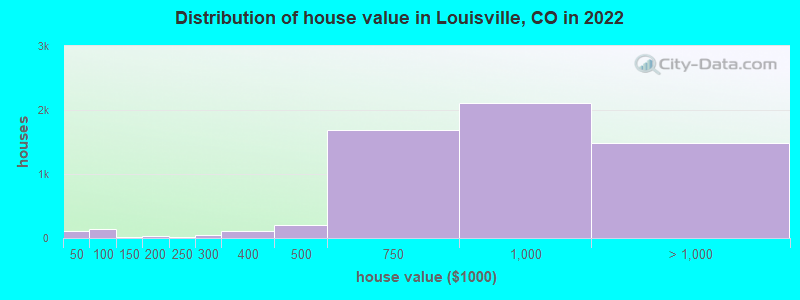
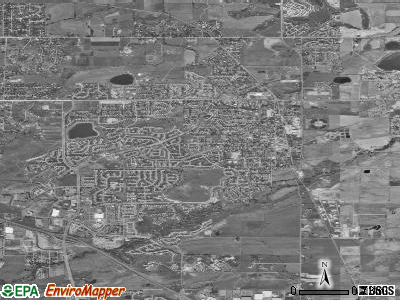
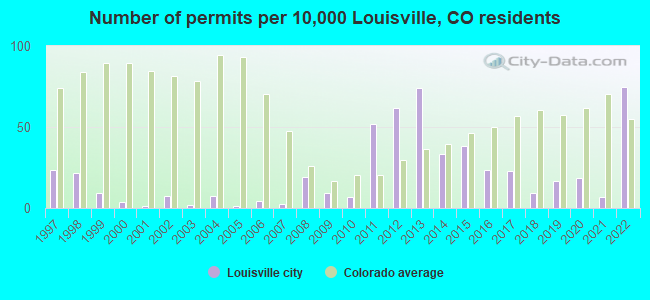
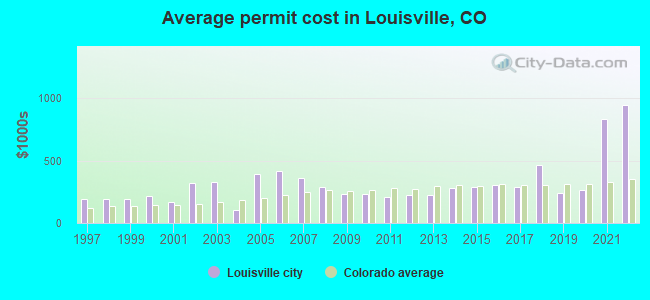
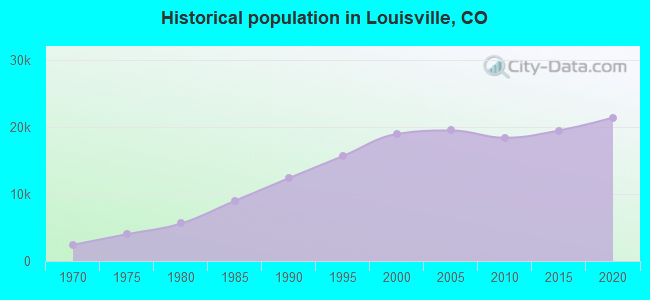
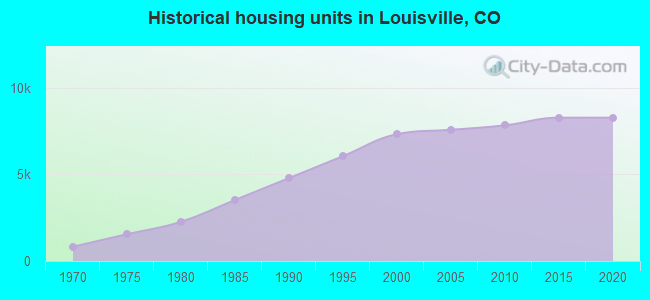
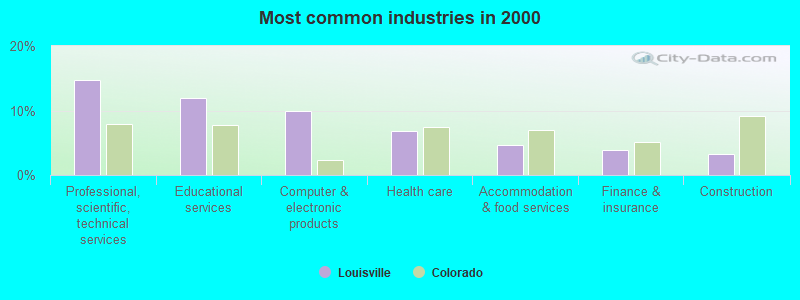
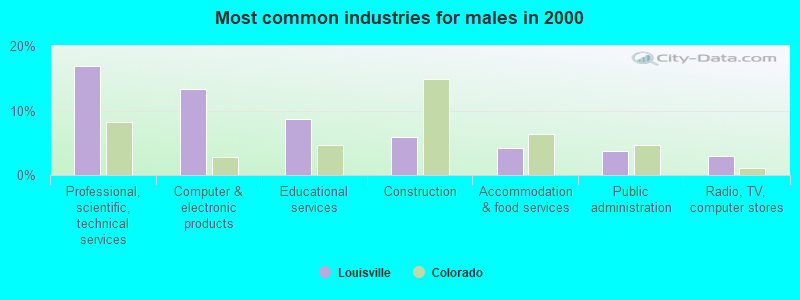
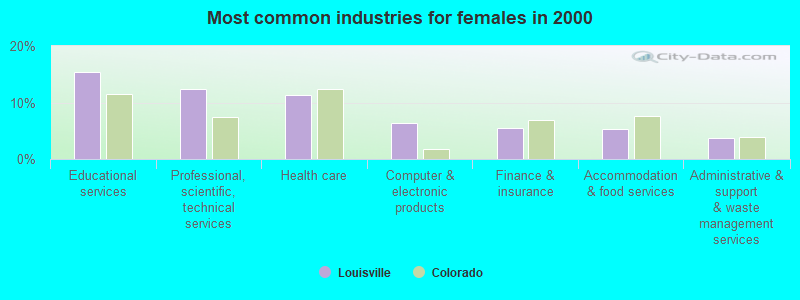
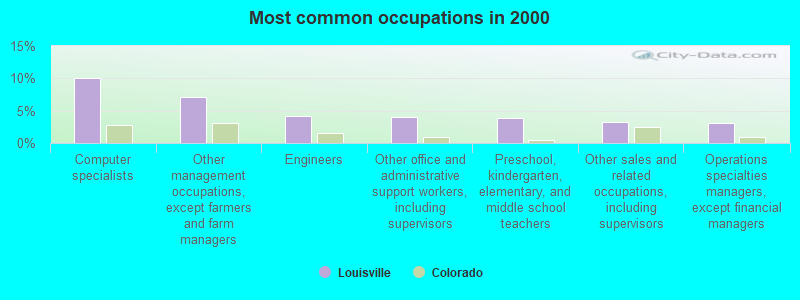
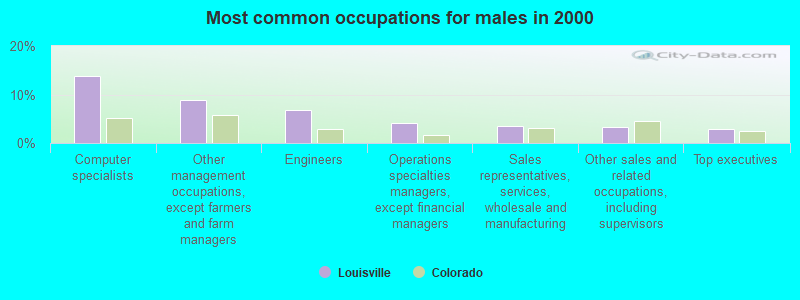
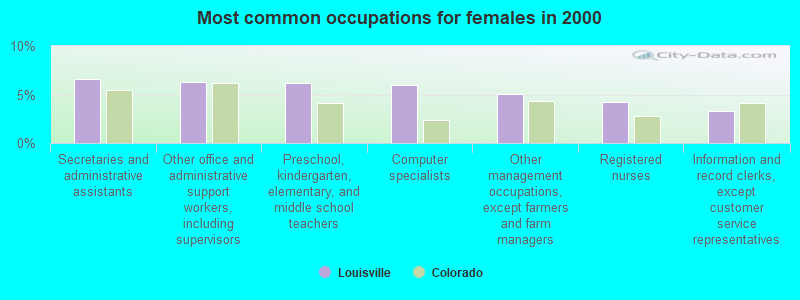
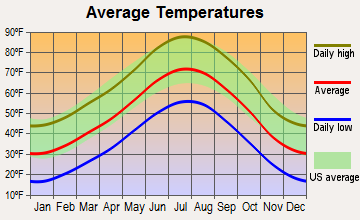


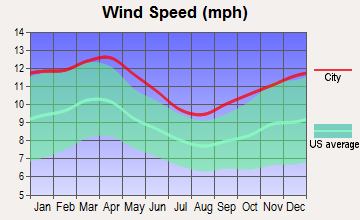
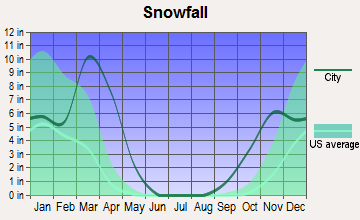
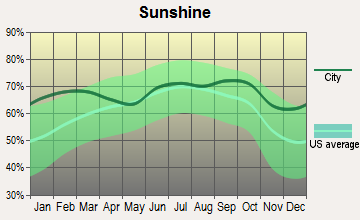
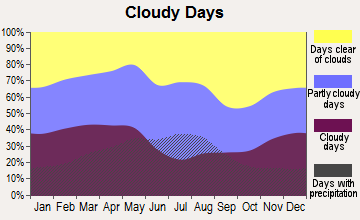
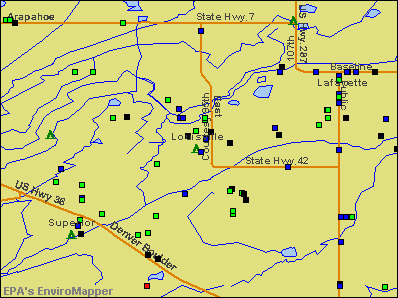

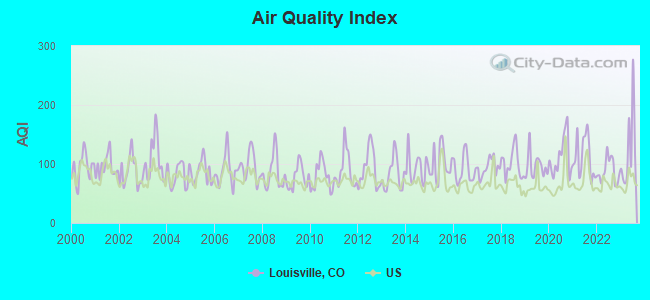

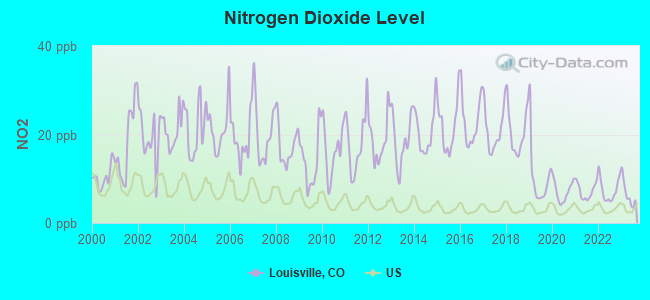
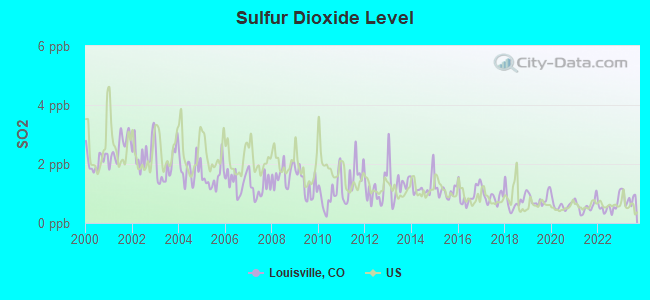
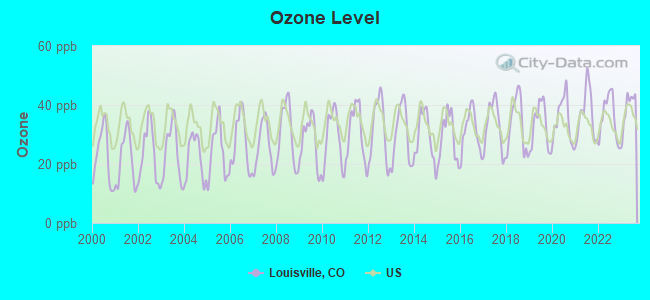
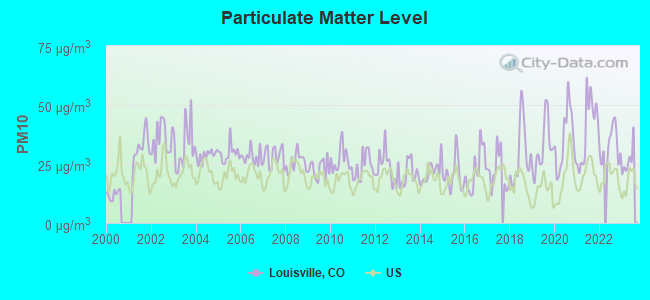
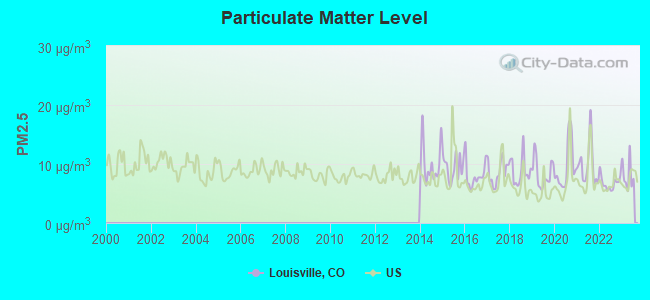
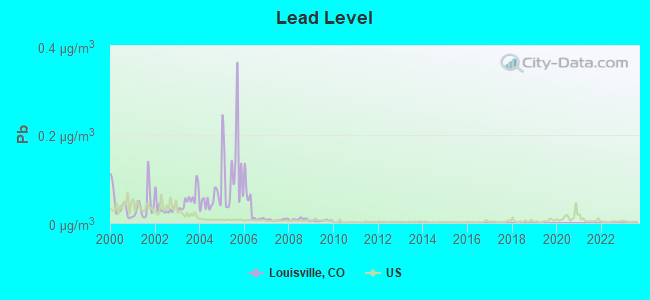
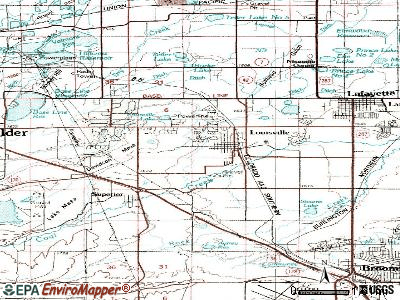
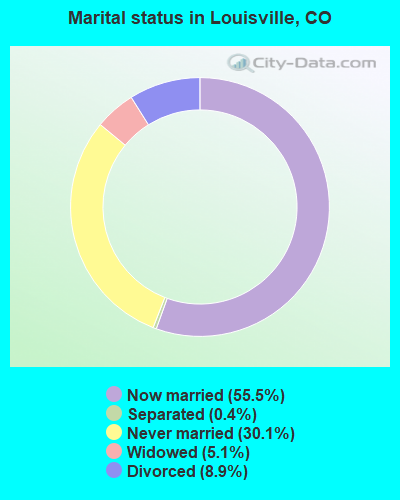
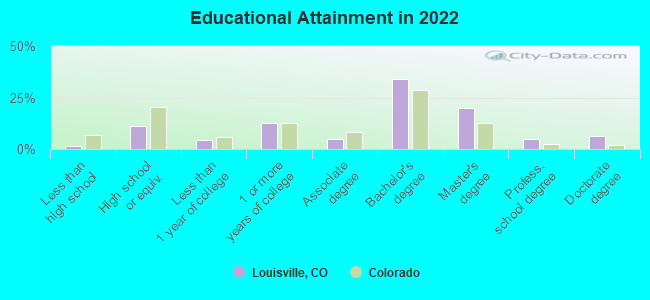
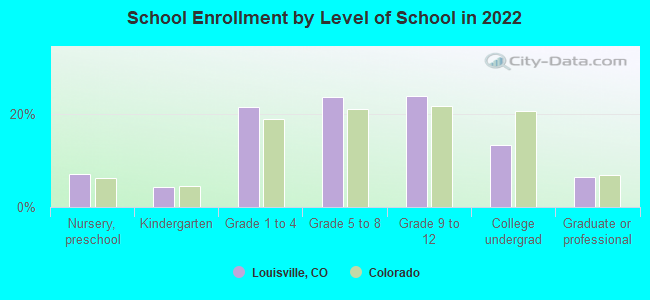
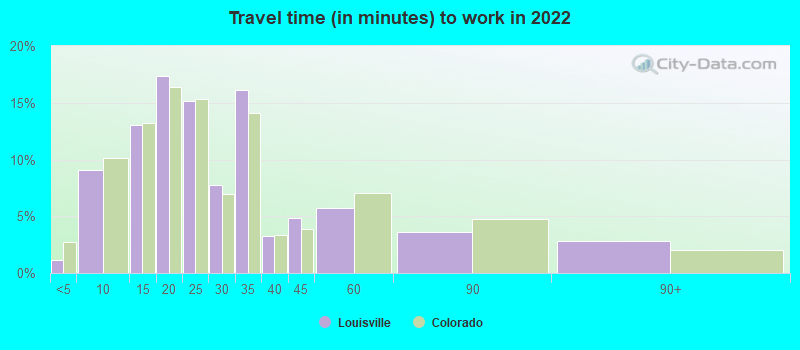
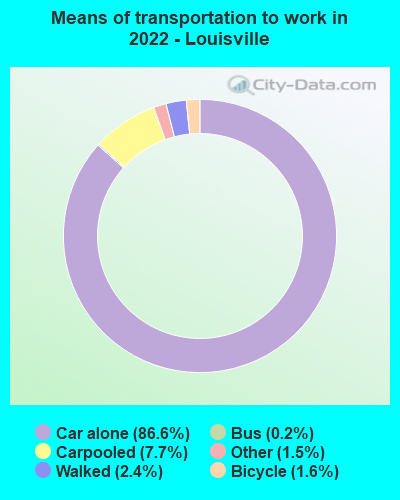
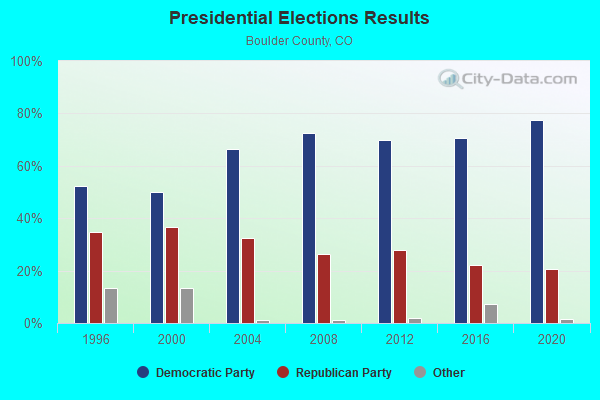
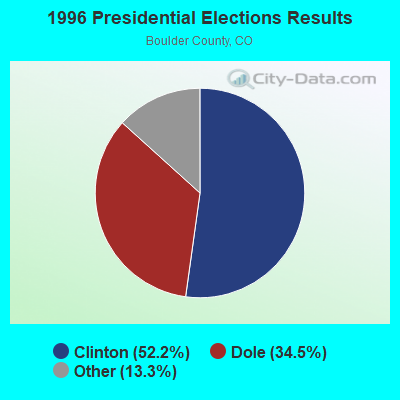

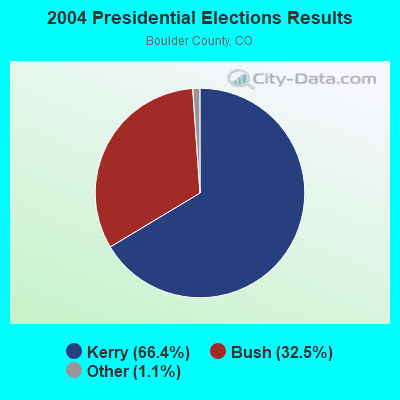
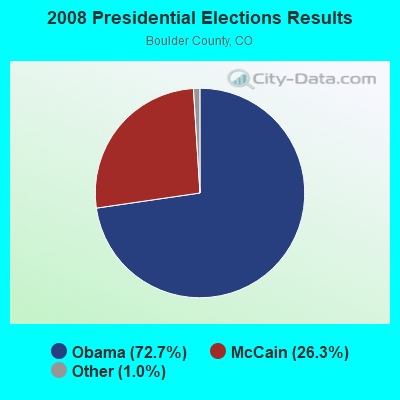
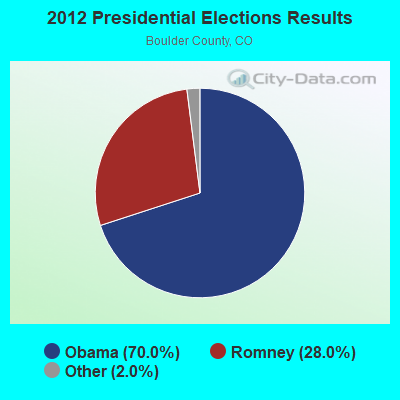
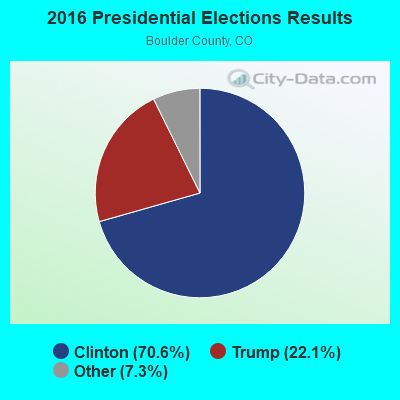
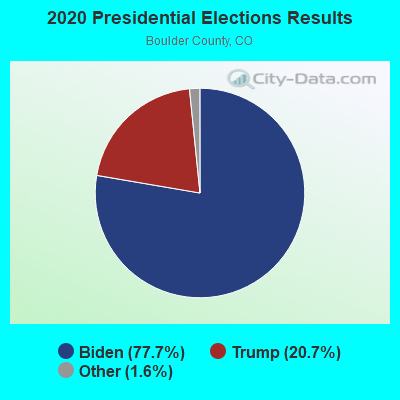
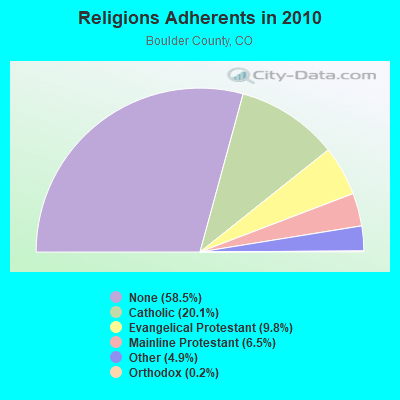
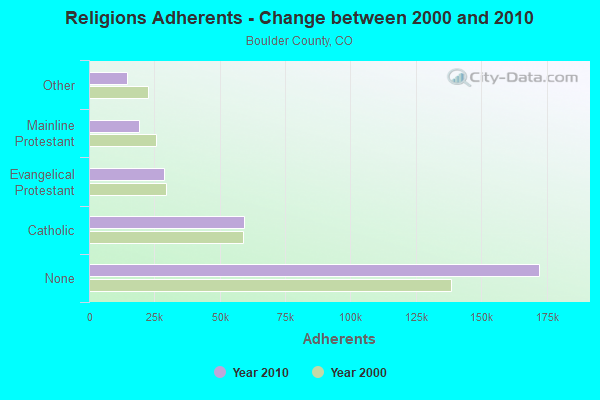
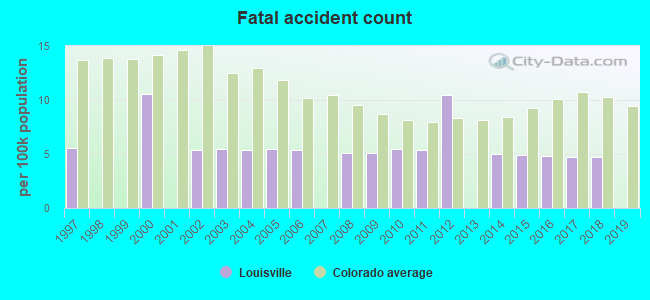
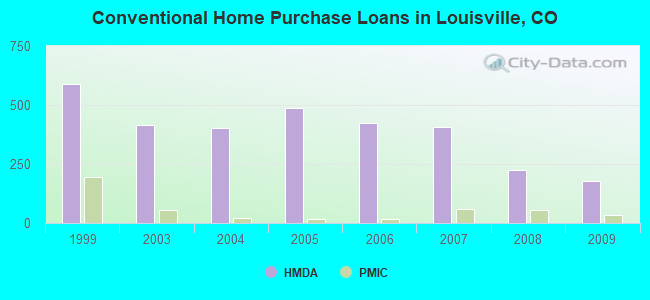
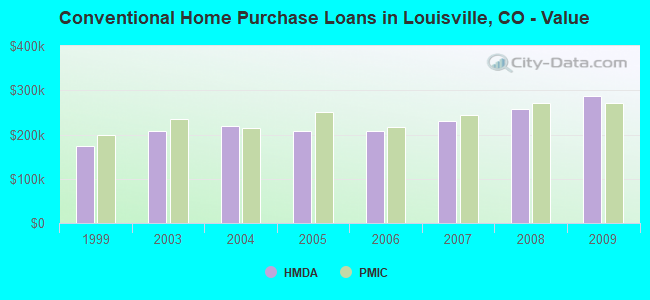
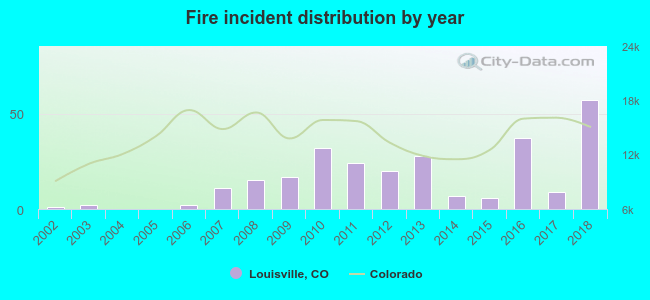 Based on the data from the years 2002 - 2018 the average number of fires per year is 16. The highest number of fire incidents - 57 took place in 2018, and the least - 0 in 2004. The data has a growing trend.
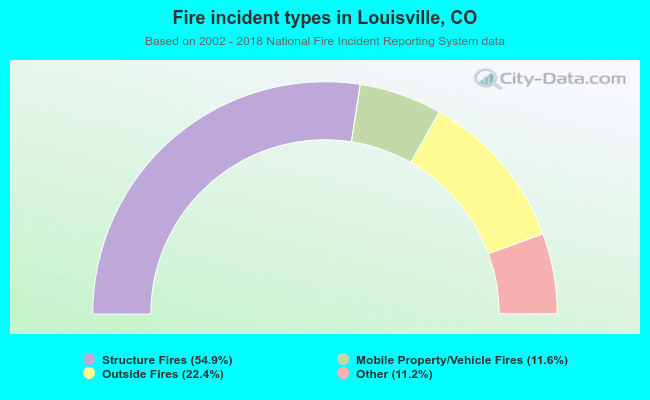 When looking into fire subcategories, the most reports belonged to: Structure Fires (54.9%), and Outside Fires (22.4%).