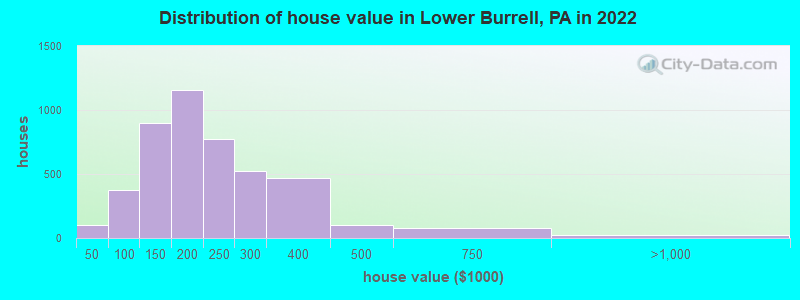
Estimated median house or condo value in 2022: $192,044 (it was $92,900 in 2000)
Lower Burrell:
$192,044
PA:
$245,500
Mean prices in 2022:all housing units: $228,115; detached houses: $234,173; townhouses or other attached units: $272,830; in 2-unit structures: $182,399; in 3-to-4-unit structures: $188,665; in 5-or-more-unit structures: $107,918; mobile homes: $75,096
Median gross rent in 2022: $789.
March 2022 cost of living index in Lower Burrell: 89.2 (less than average, U.S. average is 100)
Percentage of residents living in poverty in 2022: 5.7%
(5.4% for White Non-Hispanic residents, 35.1% for Black residents, 10.2% for two or more races residents)
According to our research of Pennsylvania and other state lists, there were 8 registered sex offenders living in Lower Burrell, Pennsylvania as of April 27, 2024. The ratio of all residents to sex offenders in Lower Burrell is 1,441 to 1. The ratio of registered sex offenders to all residents in this city is much lower than the state average.
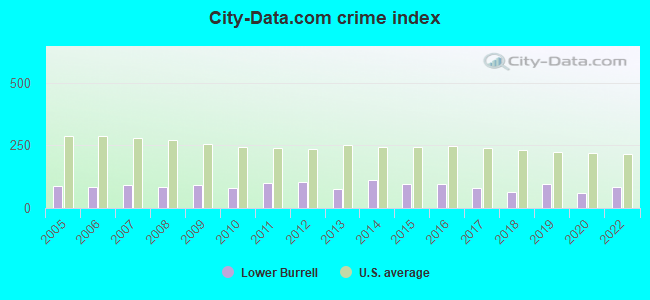
Crime rates in Lower Burrell by year
Type
2009
2010
2011
2012
2013
2014
2015
2016
2017
2018
2019
2020
2022
Murders (per 100,000)
0 (0.0)
0 (0.0)
1 (8.5)
0 (0.0)
0 (0.0)
1 (8.6)
0 (0.0)
0 (0.0)
0 (0.0)
0 (0.0)
0 (0.0)
0 (0.0)
1 (8.6)
Rapes (per 100,000)
3 (24.9)
2 (17.0)
0 (0.0)
2 (17.0)
1 (8.6)
0 (0.0)
1 (8.7)
1 (8.8)
2 (17.7)
3 (26.9)
5 (45.1)
1 (9.1)
1 (8.6)
Robberies (per 100,000)
2 (16.6)
0 (0.0)
2 (17.0)
2 (17.0)
0 (0.0)
1 (8.6)
1 (8.7)
0 (0.0)
0 (0.0)
0 (0.0)
1 (9.0)
1 (9.1)
1 (8.6)
Assaults (per 100,000)
12 (99.7)
8 (68.0)
3 (25.4)
8 (68.0)
8 (68.9)
2 (17.2)
7 (61.0)
19 (166.5)
7 (61.9)
6 (53.8)
10 (90.3)
10 (90.9)
15 (129.6)
Burglaries (per 100,000)
26 (216.1)
23 (195.6)
45 (381.4)
43 (365.7)
27 (232.7)
37 (319.0)
28 (244.0)
14 (122.7)
19 (168.1)
10 (89.6)
2 (18.1)
7 (63.6)
8 (69.1)
Thefts (per 100,000)
84 (698.1)
97 (824.8)
128 (1,085)
129 (1,097)
102 (878.9)
186 (1,604)
155 (1,351)
128 (1,122)
112 (990.9)
74 (663.4)
102 (920.8)
69 (626.9)
71 (613.3)
Auto thefts (per 100,000)
4 (33.2)
8 (68.0)
4 (33.9)
4 (34.0)
3 (25.9)
0 (0.0)
2 (17.4)
4 (35.1)
4 (35.4)
0 (0.0)
1 (9.0)
3 (27.3)
3 (25.9)
Arson (per 100,000)
0 (0.0)
0 (0.0)
0 (0.0)
0 (0.0)
0 (0.0)
0 (0.0)
0 (0.0)
0 (0.0)
0 (0.0)
0 (0.0)
0 (0.0)
0 (0.0)
1 (8.6)
City-Data.com crime index
90.6
79.3
99.9
104.5
74.2
109.8
94.3
96.6
80.8
65.1
95.7
59.9
84.1
The City-Data.com crime index weighs serious crimes and violent crimes more heavily. Higher means more crime, U.S. average is 246.1. It adjusts for the number of visitors and daily workers commuting into cities.
Latest news from Lower Burrell, PA collected exclusively by city-data.com from local newspapers, TV, and radio stations
Ancestries: Italian (22.4%), German (14.2%), Polish (11.8%), English (11.1%), American (8.3%), Irish (5.7%).
Current Local Time: EST time zone
Incorporated in 1958
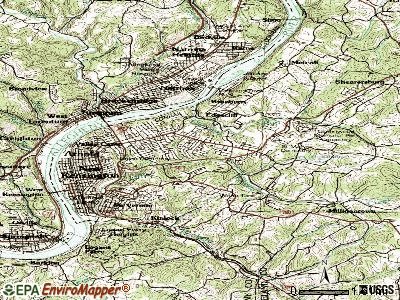
Elevation: 840 feet
Land area: 11.5 square miles.
Population density: 1,003 people per square mile (low).
103 residents are foreign born
This city:
0.9%
Pennsylvania:
7.3%
Median real estate property taxes paid for housing units with mortgages in 2022: $3,250 (1.7%) Median real estate property taxes paid for housing units with no mortgage in 2022: $2,758 (1.5%)
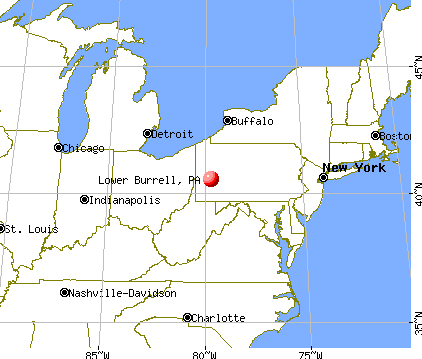
Nearest city with pop. 50,000+: Pittsburgh, PA (16.7 miles , pop. 334,563).
Nearest city with pop. 1,000,000+: Philadelphia, PA (244.8 miles , pop. 1,517,550).
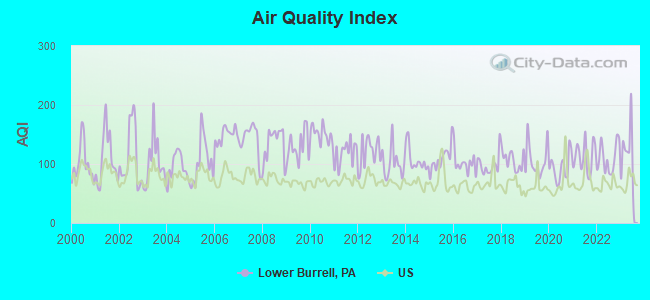
Air Quality Index (AQI) level in 2023 was 121. This is significantly worse than average.
City:
121
U.S.:
73
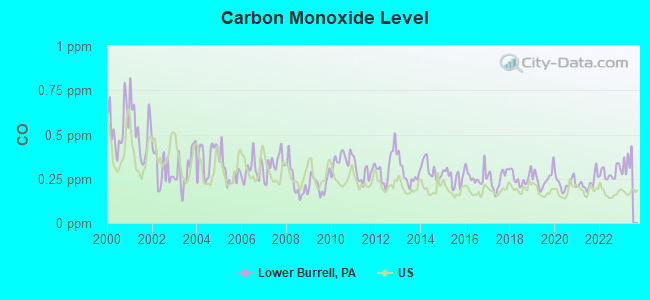
Carbon Monoxide (CO) [ppm] level in 2022 was 0.283. This is about average.Closest monitor was 9.6 miles away from the city center.
City:
0.283
U.S.:
0.251
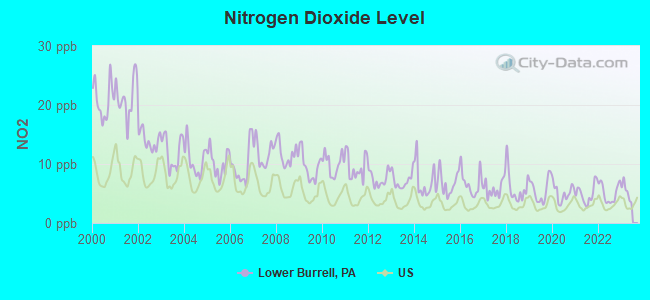
Nitrogen Dioxide (NO2) [ppb] level in 2022 was 5.11. This is about average.Closest monitor was 2.1 miles away from the city center.
City:
5.11
U.S.:
5.11
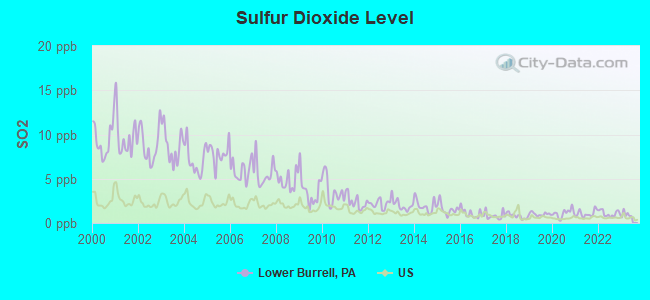
Sulfur Dioxide (SO2) [ppb] level in 2022 was 1.08. This is better than average.Closest monitor was 2.3 miles away from the city center.
City:
1.08
U.S.:
1.51
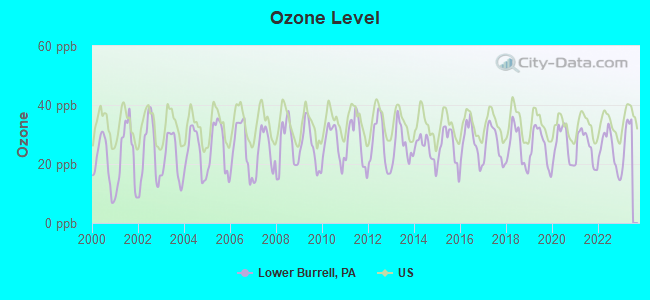
Ozone [ppb] level in 2022 was 24.9. This is better than average.Closest monitor was 2.1 miles away from the city center.
City:
24.9
U.S.:
33.3
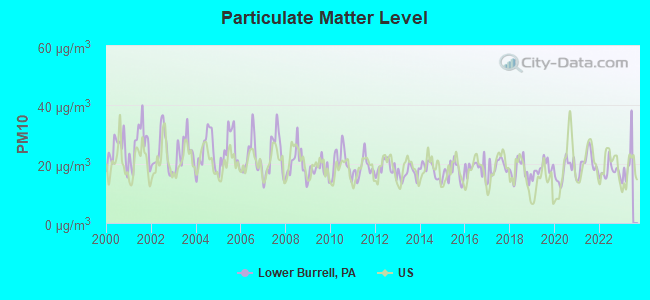
Particulate Matter (PM10) [µg/m3] level in 2022 was 17.6. This is about average.Closest monitor was 1.9 miles away from the city center.
City:
17.6
U.S.:
19.2
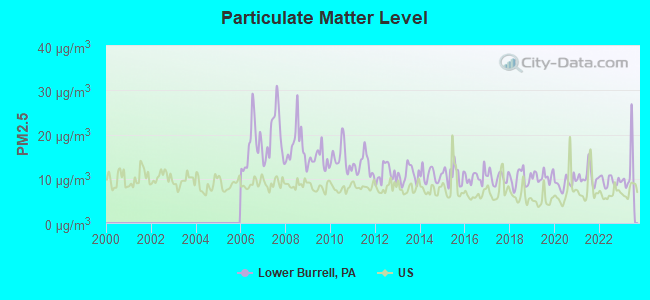
Particulate Matter (PM2.5) [µg/m3] level in 2023 was 11.8. This is significantly worse than average.Closest monitor was 2.3 miles away from the city center.
City:
11.8
U.S.:
8.1
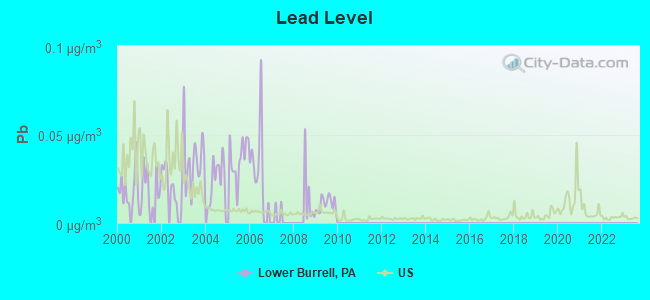
Lead (Pb) [µg/m3] level in 2009 was 0.0107. This is about average.Closest monitor was 2.2 miles away from the city center.
City:
0.0107
U.S.:
0.0093
Tornado activity:
Lower Burrell-area historical tornado activity is near Pennsylvania state average. It is 17% smaller than the overall U.S. average.
On 6/3/1980, a category F4 (max. wind speeds 207-260 mph) tornado 4.6 miles away from the Lower Burrell city center injured 140 peopleand causedbetween $50,000,000 and $500,000,000 in damages.
On 5/31/1985, a category F3 (max. wind speeds 158-206 mph) tornado 9.4 miles away from the city center killed 9 peopleand injured 120 peopleand causedbetween $5,000,000 and $50,000,000 in damages.
Earthquake activity:
Lower Burrell-area historical earthquake activity is significantly above Pennsylvania state average. It is 57% smaller than the overall U.S. average.
On 9/25/1998 at 19:52:52, a magnitude 5.2 (4.8 MB, 4.3 MS, 5.2 LG, 4.5 MW, Depth: 3.1 mi, Class: Moderate, Intensity: VI - VII) earthquake occurred 71.9 miles away from Lower Burrell center On 8/23/2011 at 17:51:04, a magnitude 5.8 (5.8 MW, Depth: 3.7 mi) earthquake occurred 208.2 miles away from Lower Burrell center On 1/31/1986 at 16:46:43, a magnitude 5.0 (5.0 MB) earthquake occurred 102.8 miles away from the city center On 7/27/1980 at 18:52:21, a magnitude 5.2 (5.1 MB, 4.7 MS, 5.0 UK, 5.2 UK) earthquake occurred 279.2 miles away from the city center On 12/31/2011 at 20:05:01, a magnitude 4.0 (4.0 ML, Depth: 3.1 mi, Class: Light, Intensity: IV - V) earthquake occurred 62.6 miles away from the city center On 1/16/1994 at 01:49:16, a magnitude 4.6 (4.6 MB, 4.6 LG, Depth: 3.1 mi) earthquake occurred 194.7 miles away from Lower Burrell center Magnitude types: regional Lg-wave magnitude (LG), body-wave magnitude (MB), local magnitude (ML), surface-wave magnitude (MS), moment magnitude (MW)
Natural disasters:
The number of natural disasters in Westmoreland County (17) is near the US average (15). Major Disasters (Presidential) Declared: 12 Emergencies Declared: 5
Causes of natural disasters: Floods: 5, Snowstorms: 4, Storms: 4, Winter Storms: 4, Hurricanes: 2, Blizzard: 1, Snowfall: 1, Tropical Depression: 1, Tropical Storm: 1, Other: 1 (Note: some incidents may be assigned to more than one category).
Hospitals and medical centers in Lower Burrell:
WESTARM HOMECARE (3168 KIPP AVENUE)
BELAIR HEALTH AND REHABILITATI (100 LITTLE ROAD)
BELAIR NSG CTR (CHESTER DR AND LITTLE RD)
Amtrak station near Lower Burrell:
18 miles: PITTSBURGH (1100 LIBERTY AVE.) . Services: ticket office, fully wheelchair accessible, enclosed waiting area, public restrooms, public payphones, vending machines, ATM, free short-term parking, paid long-term parking, call for car rental service, call for taxi service, intercity bus service, public transit connection.
Notable locations in Lower Burrell: Bethel Nursery School (A), Lower Burrell City Hall (B), Braeview Volunteer Fire Company (C), Lower Burrell Fire Company 3 (D), South New Kensington Volunteer Fire Company 1 (E). Display/hide their locations on the map
Churches in Lower Burrell include: Hillcrest Alliance Church (A), Saint Margaret Marys Church (B), Puckety Church (C), Kingdom Hall Church (D), Lower Burrell Baptist Church (E), Grace Community Presbyterian Church (F), Church of God (G), Bethesda Evangelical Lutheran Church (H), Bethel United Methodist Church (I). Display/hide their locations on the map
Monitoring of Treatment (SWTR-Unfilt/GWR) - In JUL-2014, Contaminant: GROUNDWATER RULE. Follow-up actions: St Public Notif requested (SEP-08-2014), St Compliance achieved (SEP-08-2014), St Violation/Reminder Notice (SEP-08-2014)
Monitoring of Treatment (SWTR-Unfilt/GWR) - In APR-2014, Contaminant: GROUNDWATER RULE. Follow-up actions: St Violation/Reminder Notice (JUN-17-2014), St Compliance achieved (JUN-17-2014)
Monitoring of Treatment (SWTR-Unfilt/GWR) - In DEC-2013, Contaminant: GROUNDWATER RULE. Follow-up actions: St Violation/Reminder Notice (FEB-18-2014), St Compliance achieved (FEB-18-2014)
Follow-up Or Routine LCR Tap M/R - In OCT-01-2013, Contaminant: Lead and Copper Rule. Follow-up actions: St Violation/Reminder Notice (NOV-26-2013), St Compliance achieved (NOV-26-2013)
Monitoring of Treatment (SWTR-Unfilt/GWR) - In AUG-2013, Contaminant: GROUNDWATER RULE. Follow-up actions: St Violation/Reminder Notice (SEP-24-2013), St Compliance achieved (SEP-24-2013)
6 routine major monitoring violations
31 regular monitoring violations
12 other older monitoring violations
Drinking water stations with addresses in Lower Burrell that have no violations reported:
ZUM ZUM (Population served: 25,Primary Water Source Type: Groundwater)
Average household size:
This city:
2.3 people
Pennsylvania:
2.5 people
Percentage of family households:
This city:
65.7%
Whole state:
65.0%
Percentage of households with unmarried partners:
This city:
5.2%
Whole state:
6.6%
Likely homosexual households (counted as self-reported same-sex unmarried-partner households)
Lesbian couples: 0.5% of all households
Gay men: 0.2% of all households
People in group quarters in Lower Burrell in 2010:
100 people in nursing facilities/skilled-nursing facilities
5 people in group homes intended for adults
3 people in residential treatment centers for adults
People in group quarters in Lower Burrell in 2000:
152 people in nursing homes
83 people in other types of correctional institutions
9 people in homes for the mentally retarded
2 people in other group homes
Banks with branches in Lower Burrell (2011 data):
First National Bank of Pennsylvania: Lower Burrell Branch at 110 Burrell Plaza, branch established on 1909/01/01. Info updated 2012/01/10: Bank assets: $9,581.0 mil, Deposits: $7,462.2 mil, headquarters in Greenville, PA, positive income, Commercial Lending Specialization, 291 total offices, Holding Company: F.N.b. Corporation
Citizens Bank of Pennsylvania: Lower Burrell Branch at 3136 Leechburg Road, branch established on 1984/11/01. Info updated 2010/09/24: Bank assets: $32,316.9 mil, Deposits: $25,297.1 mil, headquarters in Philadelphia, PA, positive income, 396 total offices, Holding Company: Uk Financial Investments Limited
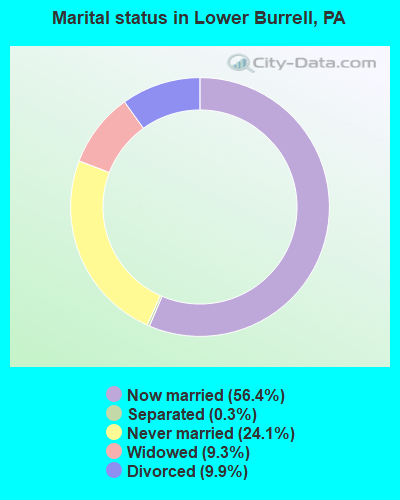
For population 15 years and over in Lower Burrell:
Never married: 24.1%
Now married: 56.4%
Separated: 0.3%
Widowed: 9.3%
Divorced: 9.9%
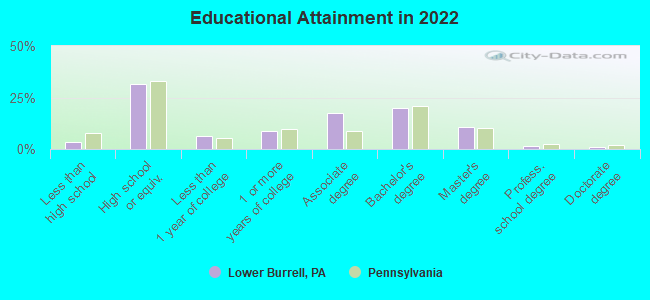
For population 25 years and over in Lower Burrell:
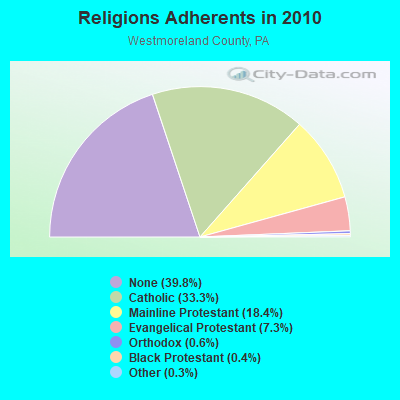
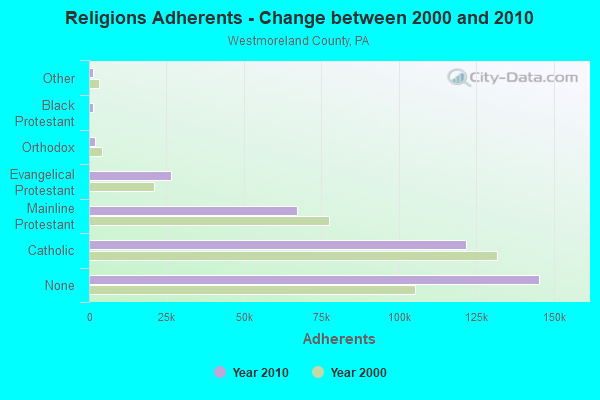
Religion statistics for Lower Burrell, PA (based on Westmoreland County data)
Religion
Adherents
Congregations
Catholic
121,691
60
Mainline Protestant
67,009
194
Evangelical Protestant
26,600
170
Orthodox
2,036
17
Black Protestant
1,320
11
Other
1,164
16
None
145,349
-
Source: Clifford Grammich, Kirk Hadaway, Richard Houseal, Dale E.Jones, Alexei Krindatch, Richie Stanley and Richard H.Taylor. 2012. 2010 U.S.Religion Census: Religious Congregations & Membership Study. Association of Statisticians of American Religious Bodies. Jones, Dale E., et al. 2002. Congregations and Membership in the United States 2000. Nashville, TN: Glenmary Research Center. Graphs represent county-level data
Aircraft: SNYDER ROBERT L CHALLENGER II (Category: Land, Seats: 2, Weight: Up to 12,499 Pounds), Engine: ROTAX SEE BOMBADIER (Reciprocating) N-Number: 381RS, N381RS, N-381RS, Serial Number: CH2-1003-2381, Year manufactured: 2004, Airworthiness Date: 10/27/2004, Certificate Issue Date: 05/04/2020 Registrant (Individual): Brian J Strausser, 113 Pacific Ave, Lower Burrell, PA 15068
Aircraft: MAULE MX-7-235 (Category: Land, Seats: 5, Weight: Up to 12,499 Pounds), Engine: Reciprocating N-Number: 70LB, N70LB, N-70LB, Serial Number: 10010C, Airworthiness Date: 03/22/1985, Certificate Issue Date: 05/22/2003 Registrant (Individual): Stephen S Grabowski, 321 Country View Dr, Lower Burrell, PA 15068
Aircraft: CESSNA 172H (Category: Land, Seats: 4, Weight: Up to 12,499 Pounds, Speed: 105 mph), Engine: CONT MOTOR 0-300 SER (145 HP) (Reciprocating) N-Number: 8812Z, N8812Z, N-8812Z, Serial Number: 17255462, Year manufactured: 1966, Airworthiness Date: 11/07/1966, Certificate Issue Date: 08/23/1990 Registrant (Individual): Leonard R Jr Pierce, 5041 Watters Rd, Lower Burrell, PA 15068 Deregistered:Cancel Date: 01/09/2018
Aircraft: PIPER PA-23-250 (Category: Land, Engines: 2, Seats: 6, Weight: Up to 12,499 Pounds, Speed: 150 mph), Engine: LYCOMING TI0-540 SER (310 HP) (Reciprocating) N-Number: 6558Y, N6558Y, N-6558Y, Serial Number: 27-3854, Year manufactured: 1968, Airworthiness Date: 02/20/1968, Certificate Issue Date: 04/07/1975 Registrant (Corporation): Ginnick Enterprises Ltd, 3058 Leechburg Rd Stes 10 And 11, Lower Burrell, PA 15068 Deregistered:Cancel Date: 10/26/2017
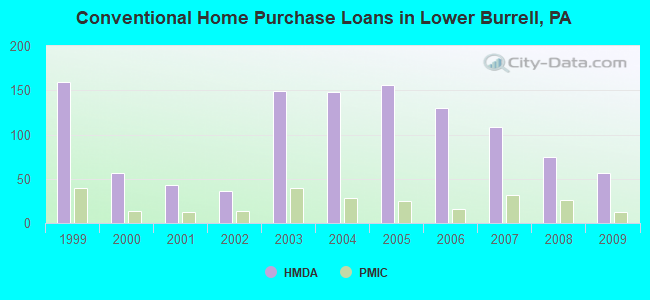
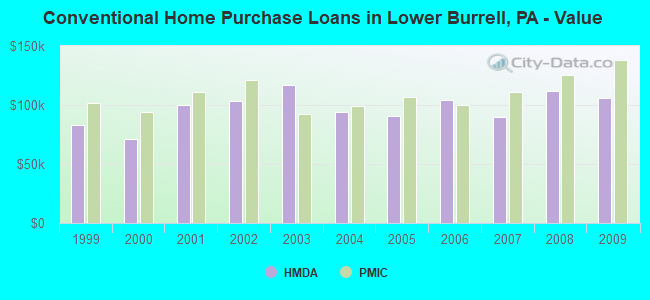
Home Mortgage Disclosure Act Aggregated Statistics For Year 2009 (Based on 3 full tracts)
A) FHA, FSA/RHS & VA Home Purchase Loans
B) Conventional Home Purchase Loans
C) Refinancings
D) Home Improvement Loans
F) Non-occupant Loans on < 5 Family Dwellings (A B C & D)
G) Loans On Manufactured Home Dwelling (A B C & D)
Number
Average Value
Number
Average Value
Number
Average Value
Number
Average Value
Number
Average Value
Number
Average Value
LOANS ORIGINATED
49
$123,114
57
$105,961
172
$108,894
35
$31,634
7
$47,681
3
$80,923
APPLICATIONS APPROVED, NOT ACCEPTED
1
$71,000
3
$91,313
22
$106,283
1
$130,000
1
$27,940
0
$0
APPLICATIONS DENIED
7
$91,539
6
$119,240
78
$121,581
12
$43,061
2
$51,950
0
$0
APPLICATIONS WITHDRAWN
4
$106,000
4
$75,195
44
$118,631
2
$41,420
2
$51,470
0
$0
FILES CLOSED FOR INCOMPLETENESS
2
$141,500
0
$0
11
$163,491
1
$13,000
0
$0
0
$0
Aggregated Statistics For Year 2008 (Based on 3 full tracts)
A) FHA, FSA/RHS & VA Home Purchase Loans
B) Conventional Home Purchase Loans
C) Refinancings
D) Home Improvement Loans
E) Loans on Dwellings For 5+ Families
F) Non-occupant Loans on < 5 Family Dwellings (A B C & D)
G) Loans On Manufactured Home Dwelling (A B C & D)
Number
Average Value
Number
Average Value
Number
Average Value
Number
Average Value
Number
Average Value
Number
Average Value
Number
Average Value
LOANS ORIGINATED
38
$108,543
75
$112,199
122
$92,344
48
$45,192
1
$138,680
11
$57,252
1
$50,000
APPLICATIONS APPROVED, NOT ACCEPTED
1
$44,000
9
$93,546
22
$100,045
8
$36,976
0
$0
2
$31,455
1
$23,000
APPLICATIONS DENIED
3
$96,333
11
$88,032
103
$120,556
35
$45,717
0
$0
4
$74,750
1
$33,000
APPLICATIONS WITHDRAWN
11
$99,621
7
$110,834
24
$99,352
3
$70,277
0
$0
3
$83,957
0
$0
FILES CLOSED FOR INCOMPLETENESS
0
$0
3
$73,307
8
$94,300
0
$0
0
$0
1
$58,000
0
$0
Aggregated Statistics For Year 2007 (Based on 3 full tracts)
A) FHA, FSA/RHS & VA Home Purchase Loans
B) Conventional Home Purchase Loans
C) Refinancings
D) Home Improvement Loans
E) Loans on Dwellings For 5+ Families
F) Non-occupant Loans on < 5 Family Dwellings (A B C & D)
G) Loans On Manufactured Home Dwelling (A B C & D)
Number
Average Value
Number
Average Value
Number
Average Value
Number
Average Value
Number
Average Value
Number
Average Value
Number
Average Value
LOANS ORIGINATED
25
$95,056
108
$89,563
150
$91,909
90
$33,308
1
$195,000
8
$61,319
1
$99,000
APPLICATIONS APPROVED, NOT ACCEPTED
0
$0
19
$83,242
42
$107,915
15
$34,919
0
$0
1
$23,940
3
$67,000
APPLICATIONS DENIED
1
$84,000
19
$104,947
180
$122,655
66
$43,591
0
$0
5
$63,000
1
$101,000
APPLICATIONS WITHDRAWN
2
$73,000
5
$142,862
48
$117,185
7
$63,143
0
$0
0
$0
1
$70,000
FILES CLOSED FOR INCOMPLETENESS
1
$80,810
2
$78,940
13
$158,861
0
$0
0
$0
0
$0
0
$0
Aggregated Statistics For Year 2006 (Based on 3 full tracts)
A) FHA, FSA/RHS & VA Home Purchase Loans
B) Conventional Home Purchase Loans
C) Refinancings
D) Home Improvement Loans
E) Loans on Dwellings For 5+ Families
F) Non-occupant Loans on < 5 Family Dwellings (A B C & D)
G) Loans On Manufactured Home Dwelling (A B C & D)
Number
Average Value
Number
Average Value
Number
Average Value
Number
Average Value
Number
Average Value
Number
Average Value
Number
Average Value
LOANS ORIGINATED
20
$96,978
130
$104,659
216
$87,393
73
$25,768
1
$250,000
12
$63,261
3
$57,300
APPLICATIONS APPROVED, NOT ACCEPTED
0
$0
11
$116,891
47
$103,710
14
$28,128
0
$0
2
$64,850
0
$0
APPLICATIONS DENIED
1
$87,000
15
$104,434
155
$105,437
40
$34,830
0
$0
10
$49,998
2
$4,490
APPLICATIONS WITHDRAWN
4
$96,250
18
$102,810
73
$118,442
9
$37,422
0
$0
1
$85,800
0
$0
FILES CLOSED FOR INCOMPLETENESS
0
$0
4
$119,250
24
$130,890
1
$10,000
0
$0
0
$0
0
$0
Aggregated Statistics For Year 2005 (Based on 3 full tracts)
A) FHA, FSA/RHS & VA Home Purchase Loans
B) Conventional Home Purchase Loans
C) Refinancings
D) Home Improvement Loans
F) Non-occupant Loans on < 5 Family Dwellings (A B C & D)
G) Loans On Manufactured Home Dwelling (A B C & D)
Number
Average Value
Number
Average Value
Number
Average Value
Number
Average Value
Number
Average Value
Number
Average Value
LOANS ORIGINATED
15
$98,812
156
$90,269
232
$85,099
68
$33,378
18
$60,247
1
$123,710
APPLICATIONS APPROVED, NOT ACCEPTED
0
$0
19
$81,664
52
$84,279
14
$40,924
3
$57,970
0
$0
APPLICATIONS DENIED
3
$64,000
40
$90,143
175
$105,177
48
$36,390
18
$37,918
3
$37,000
APPLICATIONS WITHDRAWN
4
$111,500
20
$223,725
110
$118,124
18
$121,759
10
$326,541
2
$1,261,360
FILES CLOSED FOR INCOMPLETENESS
0
$0
10
$116,761
27
$134,091
0
$0
0
$0
0
$0
Aggregated Statistics For Year 2004 (Based on 3 full tracts)
A) FHA, FSA/RHS & VA Home Purchase Loans
B) Conventional Home Purchase Loans
C) Refinancings
D) Home Improvement Loans
E) Loans on Dwellings For 5+ Families
F) Non-occupant Loans on < 5 Family Dwellings (A B C & D)
G) Loans On Manufactured Home Dwelling (A B C & D)
Number
Average Value
Number
Average Value
Number
Average Value
Number
Average Value
Number
Average Value
Number
Average Value
Number
Average Value
LOANS ORIGINATED
13
$107,424
148
$93,838
323
$91,990
92
$34,611
1
$196,000
30
$59,111
3
$43,667
APPLICATIONS APPROVED, NOT ACCEPTED
1
$91,000
21
$71,458
59
$94,687
17
$42,148
0
$0
4
$46,948
0
$0
APPLICATIONS DENIED
1
$109,000
30
$76,610
191
$98,409
48
$20,991
3
$685,420
17
$29,732
4
$68,658
APPLICATIONS WITHDRAWN
1
$91,790
20
$80,594
105
$100,927
14
$56,527
0
$0
4
$53,700
1
$36,000
FILES CLOSED FOR INCOMPLETENESS
0
$0
9
$112,791
40
$115,969
5
$69,160
0
$0
0
$0
0
$0
Aggregated Statistics For Year 2003 (Based on 3 full tracts)
A) FHA, FSA/RHS & VA Home Purchase Loans
B) Conventional Home Purchase Loans
C) Refinancings
D) Home Improvement Loans
E) Loans on Dwellings For 5+ Families
F) Non-occupant Loans on < 5 Family Dwellings (A B C & D)
Number
Average Value
Number
Average Value
Number
Average Value
Number
Average Value
Number
Average Value
Number
Average Value
LOANS ORIGINATED
20
$111,840
149
$116,812
536
$90,056
82
$32,842
1
$13,400,000
18
$277,526
APPLICATIONS APPROVED, NOT ACCEPTED
1
$127,000
13
$81,034
130
$100,886
22
$38,769
0
$0
0
$0
APPLICATIONS DENIED
2
$89,400
19
$52,139
197
$106,536
37
$30,088
0
$0
3
$19,333
APPLICATIONS WITHDRAWN
4
$85,232
16
$123,232
69
$92,268
6
$12,495
0
$0
0
$0
FILES CLOSED FOR INCOMPLETENESS
0
$0
3
$113,540
22
$101,954
4
$35,750
0
$0
1
$24,940
Aggregated Statistics For Year 2002 (Based on 1 full tract)
A) FHA, FSA/RHS & VA Home Purchase Loans
B) Conventional Home Purchase Loans
C) Refinancings
D) Home Improvement Loans
F) Non-occupant Loans on < 5 Family Dwellings (A B C & D)
Number
Average Value
Number
Average Value
Number
Average Value
Number
Average Value
Number
Average Value
LOANS ORIGINATED
4
$106,000
36
$103,528
168
$88,940
32
$24,094
2
$12,000
APPLICATIONS APPROVED, NOT ACCEPTED
0
$0
8
$70,625
49
$91,367
5
$28,000
0
$0
APPLICATIONS DENIED
0
$0
15
$45,400
68
$84,544
10
$41,300
2
$99,000
APPLICATIONS WITHDRAWN
1
$152,000
3
$54,333
54
$99,019
3
$23,667
1
$65,000
FILES CLOSED FOR INCOMPLETENESS
0
$0
2
$83,000
7
$49,429
1
$65,000
0
$0
Aggregated Statistics For Year 2001 (Based on 1 full tract)
A) FHA, FSA/RHS & VA Home Purchase Loans
B) Conventional Home Purchase Loans
C) Refinancings
D) Home Improvement Loans
F) Non-occupant Loans on < 5 Family Dwellings (A B C & D)
Number
Average Value
Number
Average Value
Number
Average Value
Number
Average Value
Number
Average Value
LOANS ORIGINATED
10
$96,300
43
$99,907
167
$74,892
37
$24,054
5
$51,800
APPLICATIONS APPROVED, NOT ACCEPTED
0
$0
7
$55,571
34
$72,500
6
$17,500
0
$0
APPLICATIONS DENIED
0
$0
11
$64,364
92
$77,098
27
$19,296
0
$0
APPLICATIONS WITHDRAWN
2
$117,000
4
$96,000
47
$99,957
2
$21,500
1
$27,000
FILES CLOSED FOR INCOMPLETENESS
0
$0
2
$66,000
7
$77,143
0
$0
1
$56,000
Aggregated Statistics For Year 2000 (Based on 1 full tract)
A) FHA, FSA/RHS & VA Home Purchase Loans
B) Conventional Home Purchase Loans
C) Refinancings
D) Home Improvement Loans
F) Non-occupant Loans on < 5 Family Dwellings (A B C & D)
Number
Average Value
Number
Average Value
Number
Average Value
Number
Average Value
Number
Average Value
LOANS ORIGINATED
9
$72,111
56
$70,821
58
$53,086
29
$29,103
4
$80,500
APPLICATIONS APPROVED, NOT ACCEPTED
0
$0
3
$44,000
22
$86,136
13
$24,385
0
$0
APPLICATIONS DENIED
1
$100,000
23
$43,261
52
$68,731
17
$13,529
3
$60,000
APPLICATIONS WITHDRAWN
0
$0
6
$79,667
22
$97,409
1
$25,000
0
$0
FILES CLOSED FOR INCOMPLETENESS
0
$0
2
$104,000
4
$47,000
3
$28,333
0
$0
Aggregated Statistics For Year 1999 (Based on 2 full and 1 partial tracts)
A) FHA, FSA/RHS & VA Home Purchase Loans
B) Conventional Home Purchase Loans
C) Refinancings
D) Home Improvement Loans
F) Non-occupant Loans on < 5 Family Dwellings (A B C & D)
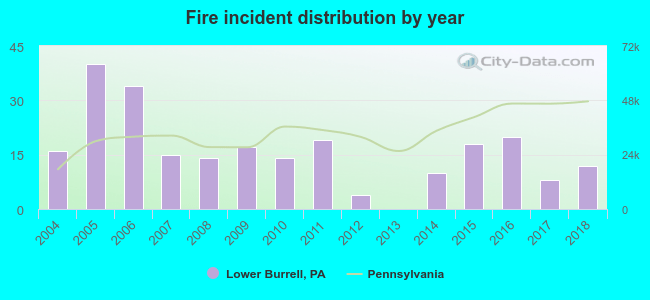
2004 - 2018 National Fire Incident Reporting System (NFIRS) incidents
According to the data from the years 2004 - 2018 the average number of fires per year is 16. The highest number of fires - 40 took place in 2005, and the least - 0 in 2013. The data has a declining trend.
When looking into fire subcategories, the most incidents belonged to: Structure Fires (49.4%), and Outside Fires (28.6%).
Fire incident types reported to NFIRS in Lower Burrell, PA


 Recent articles from our blog. Our writers, many of them Ph.D. graduates or candidates, create easy-to-read articles on a wide variety of topics.

 (16.7 miles

 According to the data from the years 2004 - 2018 the average number of fires per year is 16. The highest number of fires - 40 took place in 2005, and the least - 0 in 2013. The data has a declining trend.
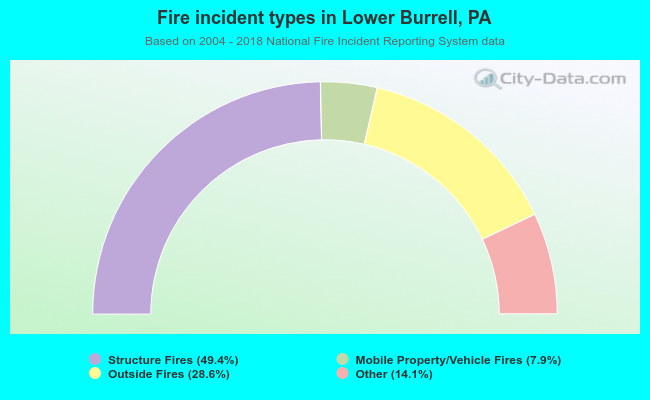 When looking into fire subcategories, the most incidents belonged to: Structure Fires (49.4%), and Outside Fires (28.6%).