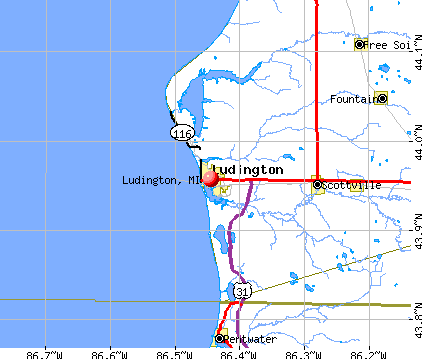
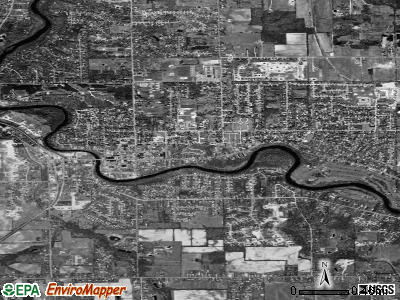
Ludington, Michigan

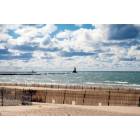
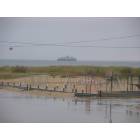
Ludington: Looking west from Harbor View Marina

Ludington: sunset at the beach
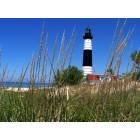
Ludington: Big Sable Point Light
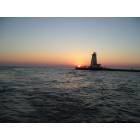
Ludington: Red Sunset is so beautiful to have to come see!!

Ludington: Sunset at Ludington State Park Beach

Ludington: Sunset over lake Michigan in Ludington
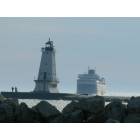
Ludington: Ludington lighthouse in the fall
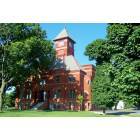
Ludington: Mason County Courthouse, Ludington, Michigan
Ludington: Lake Michigan Ferry's first test run for the year- Ludington
Ludington: Lake Michigan Ferry returning to Ludington
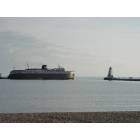
Ludington: U.S.S. Badger on its way to Wisconsin
- see
28
more - add
your
Submit your own pictures of this city and show them to the world
- OSM Map
- General Map
- Google Map
- MSN Map
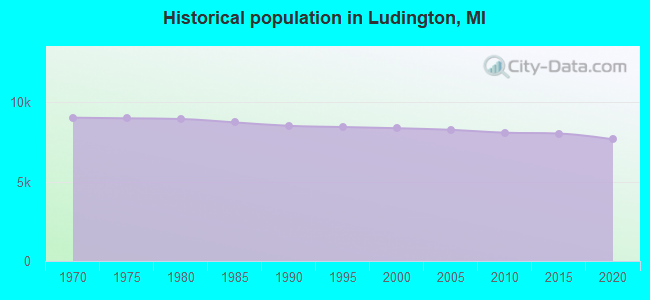
Population change since 2000: -7.9%
 |
| Males: 3,809 | |
| Females: 3,890 |
| Median resident age: | 42.7 years |
| Michigan median age: | 40.3 years |
Zip codes: 49431.
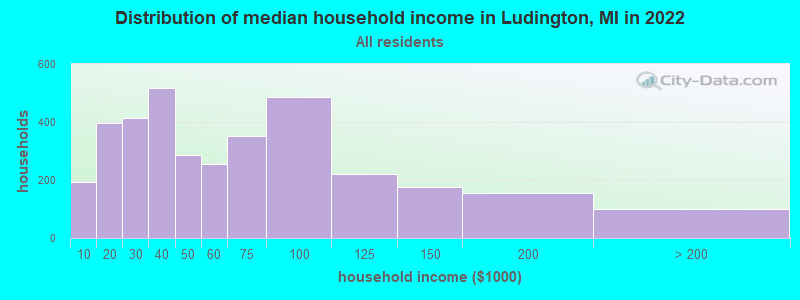
| Ludington: | $48,405 |
| MI: | $66,986 |
Estimated per capita income in 2022: $30,563 (it was $17,215 in 2000)
Ludington city income, earnings, and wages data
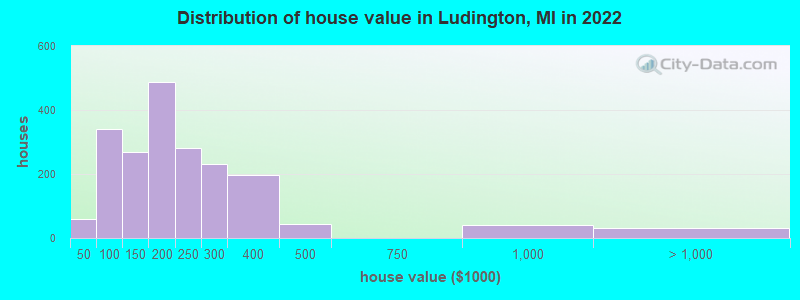
Estimated median house or condo value in 2022: $193,044 (it was $73,700 in 2000)
| Ludington: | $193,044 |
| MI: | $224,400 |
Mean prices in 2022: all housing units: $235,344; detached houses: $247,135; townhouses or other attached units: $303,774; in 2-unit structures: $158,835; in 3-to-4-unit structures: $256,126; in 5-or-more-unit structures: $288,754; mobile homes: $96,342
Median gross rent in 2022: $850.
(22.6% for White Non-Hispanic residents, 0.6% for Black residents)
Detailed information about poverty and poor residents in Ludington, MI


Compare current foreclosures near Ludington, MI:
| Photo | Address | Area | Beds / Baths | Price | Details |
|---|---|---|---|---|---|

|
#1
E Maple St
Ludington, MI 49431
|
1,056 sq. feet
|
1 baths 3 beds |
show details | |

|
#2
Adams St
Ludington, MI 49431
|
1,000 sq. feet
|
2 baths 4 beds |
show details | |

|
#3
4th St
Ludington, MI 49431
|
- sq. feet
|
2 baths 3 beds |
show details | |

|
#4
S Therese Ave
Ludington, MI 49431
|
- sq. feet
|
- baths - beds |
show details | |

|
#5
Longdale St
Ludington, MI 49431
|
- sq. feet
|
- baths - beds |
show details | |

|
#6
E Whittier St
Ludington, MI 49431
|
- sq. feet
|
- baths - beds |
show details | |

|
#7
2nd St
Ludington, MI 49431
|
- sq. feet
|
- baths - beds |
show details | |

|
#8
N Rath Ave
Ludington, MI 49431
|
- sq. feet
|
- baths - beds |
show details | |

|
#9
N Emily St
Ludington, MI 49431
|
- sq. feet
|
- baths - beds |
show details | |

|
#10
S Pere Marquette Hwy
Ludington, MI 49431
|
- sq. feet
|
- baths - beds |
show details |
| Photo | Address | Area | Beds / Baths | Price | Details |
|---|---|---|---|---|---|

|
#11
W Dewey Rd
Scottville, MI 49454
|
- sq. feet
|
2 baths 3 beds |
show details | |

|
#12
N Stephens Rd
Free Soil, MI 49411
|
- sq. feet
|
2 baths 3 beds |
show details | |

|
#13
Mount Vernon Dr
Scottville, MI 49454
|
- sq. feet
|
- baths - beds |
show details | |

|
#14
W Birch St
Scottville, MI 49454
|
- sq. feet
|
- baths - beds |
show details | |

|
#15
Hoague Rd
Manistee, MI 49660
|
- sq. feet
|
- baths - beds |
show details | |

|
#16
Thomas St # 1
Scottville, MI 49454
|
- sq. feet
|
- baths - beds |
show details | |

|
#17
72nd Ave
Pentwater, MI 49449
|
- sq. feet
|
- baths - beds |
show details | |

|
#18
W Conrad Rd
Scottville, MI 49454
|
- sq. feet
|
- baths - beds |
show details | |

|
#19
E Johnson Rd
Scottville, MI 49454
|
- sq. feet
|
- baths - beds |
show details | |

|
#20
W 4th St
Scottville, MI 49454
|
- sq. feet
|
- baths - beds |
show details |
| Photo | Address | Area | Beds / Baths | Price | Details |
|---|---|---|---|---|---|

|
#21
Harold St # House
Scottville, MI 49454
|
- sq. feet
|
- baths - beds |
show details | |

|
#22
N Benson Rd
Fountain, MI 49410
|
- sq. feet
|
- baths - beds |
show details | |

|
Check over 1 million property listings on Foreclosure.com!
|
browse all offers | |||


- 6,71887.6%White alone
- 3855.0%Hispanic
- 2142.8%Two or more races
- 1962.6%Black alone
- 741.0%Asian alone
- 450.6%American Indian alone
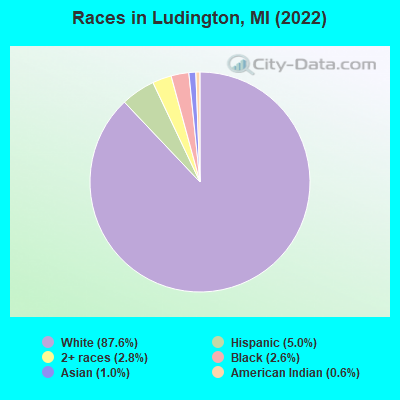
Races in Ludington detailed stats: ancestries, foreign born residents, place of birth
According to our research of Michigan and other state lists, there were 75 registered sex offenders living in Ludington, Michigan as of April 27, 2024.
The ratio of all residents to sex offenders in Ludington is 108 to 1.
Type |
2009 |
2010 |
2011 |
2012 |
2013 |
2014 |
2015 |
2016 |
2017 |
2018 |
2019 |
2020 |
2021 |
2022 |
|---|---|---|---|---|---|---|---|---|---|---|---|---|---|---|
| Murders (per 100,000) | 0 (0.0) | 0 (0.0) | 0 (0.0) | 0 (0.0) | 0 (0.0) | 0 (0.0) | 0 (0.0) | 0 (0.0) | 0 (0.0) | 0 (0.0) | 0 (0.0) | 0 (0.0) | 0 (0.0) | 0 (0.0) |
| Rapes (per 100,000) | 11 (132.2) | 7 (86.7) | 4 (49.6) | 11 (136.2) | 14 (174.2) | 12 (149.4) | 7 (86.7) | 15 (186.2) | 17 (210.7) | 18 (223.4) | 22 (270.1) | 20 (246.6) | 7 (86.4) | 8 (102.8) |
| Robberies (per 100,000) | 4 (48.1) | 5 (61.9) | 0 (0.0) | 0 (0.0) | 1 (12.4) | 2 (24.9) | 0 (0.0) | 1 (12.4) | 1 (12.4) | 2 (24.8) | 0 (0.0) | 0 (0.0) | 2 (24.7) | 0 (0.0) |
| Assaults (per 100,000) | 20 (240.4) | 18 (222.9) | 18 (223.0) | 24 (297.2) | 11 (136.9) | 20 (249.1) | 12 (148.6) | 19 (235.9) | 13 (161.1) | 14 (173.7) | 15 (184.2) | 15 (184.9) | 23 (284.0) | 17 (218.4) |
| Burglaries (per 100,000) | 45 (540.9) | 25 (309.6) | 0 (0.0) | 31 (383.9) | 38 (472.9) | 21 (261.5) | 12 (148.6) | 17 (211.1) | 19 (235.5) | 13 (161.3) | 21 (257.9) | 11 (135.6) | 4 (49.4) | 13 (167.0) |
| Thefts (per 100,000) | 230 (2,765) | 208 (2,576) | 20 (247.8) | 234 (2,898) | 156 (1,942) | 146 (1,818) | 99 (1,226) | 130 (1,614) | 149 (1,847) | 95 (1,179) | 119 (1,461) | 98 (1,208) | 54 (666.8) | 55 (706.5) |
| Auto thefts (per 100,000) | 5 (60.1) | 7 (86.7) | 0 (0.0) | 7 (86.7) | 3 (37.3) | 4 (49.8) | 1 (12.4) | 6 (74.5) | 4 (49.6) | 2 (24.8) | 3 (36.8) | 7 (86.3) | 1 (12.3) | 1 (12.8) |
| Arson (per 100,000) | 2 (24.0) | 2 (24.8) | 3 (37.2) | 3 (37.2) | 0 (0.0) | 0 (0.0) | 0 (0.0) | 1 (12.4) | 0 (0.0) | 1 (12.4) | 0 (0.0) | 0 (0.0) | 2 (24.7) | 1 (12.8) |
| City-Data.com crime index | 321.6 | 264.1 | 94.2 | 318.1 | 284.3 | 271.9 | 159.4 | 285.2 | 298.8 | 281.3 | 332.4 | 299.0 | 164.5 | 166.9 |
The City-Data.com crime index weighs serious crimes and violent crimes more heavily. Higher means more crime, U.S. average is 246.1. It adjusts for the number of visitors and daily workers commuting into cities.
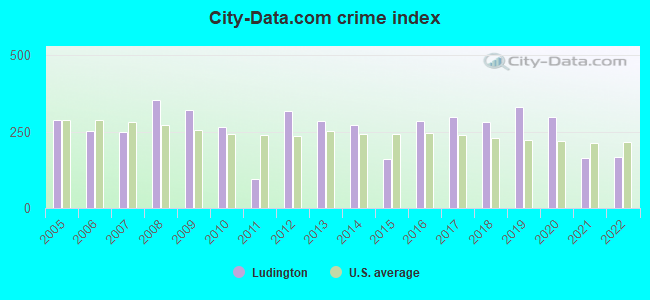
Crime rate in Ludington detailed stats: murders, rapes, robberies, assaults, burglaries, thefts, arson
Full-time law enforcement employees in 2021, including police officers: 16 (14 officers - 11 male; 3 female).
| Officers per 1,000 residents here: | 1.73 |
| Michigan average: | 1.86 |
 Recent articles from our blog. Our writers, many of them Ph.D. graduates or candidates, create easy-to-read articles on a wide variety of topics.

 | Magical Small Towns in Michigan (27 replies) |
| Looking for smaller cities west michigan grand rapids north (5 replies) |
| Family life in Pentwater Michigan (5 replies) |
| Best West Michigan Town for me (6 replies) |
| Getting from Ludington to Muskegon (6 replies) |
| Lake Michigan Ferry Service (14 replies) |
Latest news from Ludington, MI collected exclusively by city-data.com from local newspapers, TV, and radio stations
Ancestries: German (34.5%), English (7.6%), Polish (6.5%), American (5.4%), European (4.4%), Irish (3.7%).
Current Local Time: EST time zone
Elevation: 584 feet
Land area: 3.37 square miles.
Population density: 2,287 people per square mile (low).
125 residents are foreign born
| This city: | 1.6% |
| Michigan: | 6.9% |
Median real estate property taxes paid for housing units with mortgages in 2022: $2,408 (1.2%)
Median real estate property taxes paid for housing units with no mortgage in 2022: $2,327 (1.2%)
Nearest city with pop. 50,000+: Sheboygan, WI  (65.5 miles , pop. 50,792).
Nearest city with pop. 200,000+: Milwaukee, WI (98.3 miles , pop. 596,974).
Nearest city with pop. 1,000,000+: Chicago, IL (159.2 miles , pop. 2,896,016).
Nearest cities:
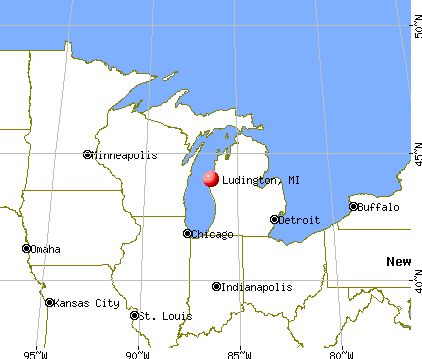
), Latitude: 43.96 N, Longitude: 86.44 W
Daytime population change due to commuting: +2,565 (+33.4%)
Workers who live and work in this city: 1,947 (64.3%)
Area code: 231
Ludington, Michigan accommodation & food services, waste management - Economy and Business Data
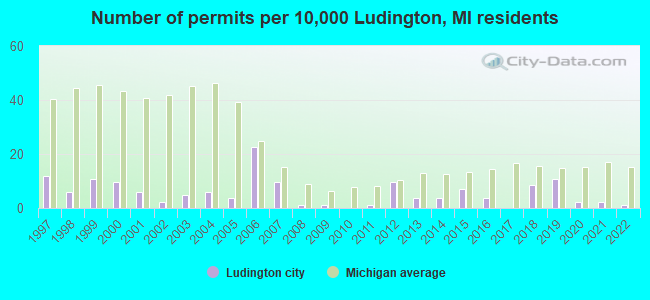
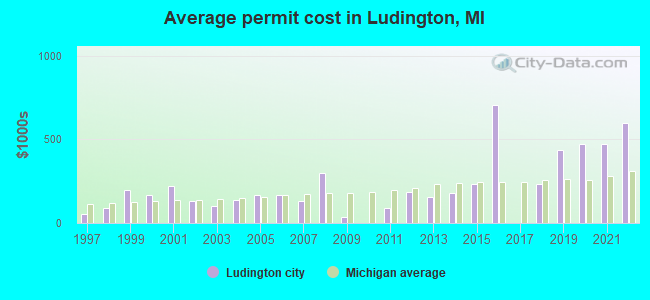
Single-family new house construction building permits:
- 2022: 1 building, cost: $600,000
- 2021: 2 buildings, average cost: $475,000
- 2020: 2 buildings, average cost: $475,000
- 2019: 9 buildings, average cost: $434,400
- 2018: 7 buildings, average cost: $234,200
- 2016: 3 buildings, average cost: $706,700
- 2015: 6 buildings, average cost: $235,000
- 2014: 3 buildings, average cost: $180,700
- 2013: 3 buildings, average cost: $153,300
- 2012: 8 buildings, average cost: $187,500
- 2011: 1 building, cost: $88,000
- 2009: 1 building, cost: $35,000
- 2008: 1 building, cost: $300,000
- 2007: 8 buildings, average cost: $131,900
- 2006: 19 buildings, average cost: $164,500
- 2005: 3 buildings, average cost: $165,300
- 2004: 5 buildings, average cost: $140,000
- 2003: 4 buildings, average cost: $102,500
- 2002: 2 buildings, average cost: $133,400
- 2001: 5 buildings, average cost: $218,900
- 2000: 8 buildings, average cost: $165,300
- 1999: 9 buildings, average cost: $196,900
- 1998: 5 buildings, average cost: $86,500
- 1997: 10 buildings, average cost: $54,000
| Here: | 4.8% |
| Michigan: | 3.5% |
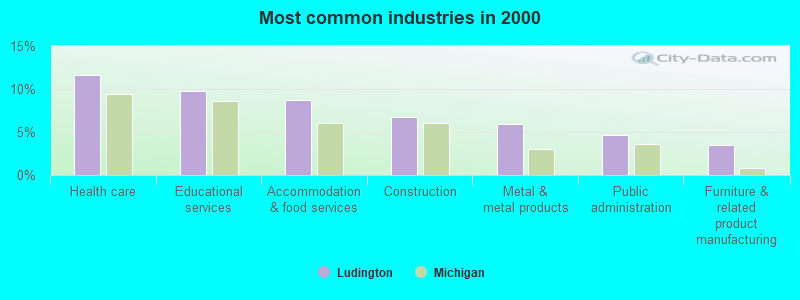
- Health care (11.7%)
- Educational services (9.8%)
- Accommodation & food services (8.7%)
- Construction (6.8%)
- Metal & metal products (6.0%)
- Public administration (4.7%)
- Furniture & related product manufacturing (3.5%)
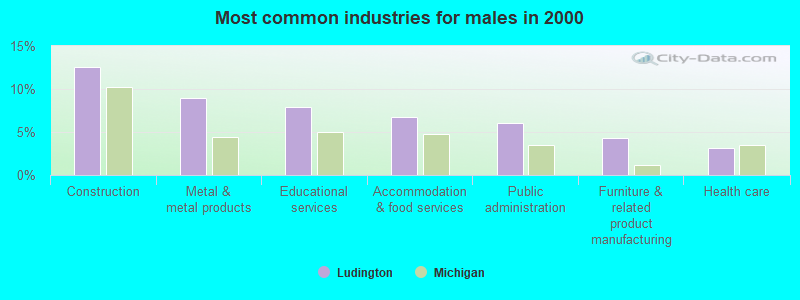
- Construction (12.6%)
- Metal & metal products (9.0%)
- Educational services (7.9%)
- Accommodation & food services (6.7%)
- Public administration (6.0%)
- Furniture & related product manufacturing (4.3%)
- Health care (3.2%)
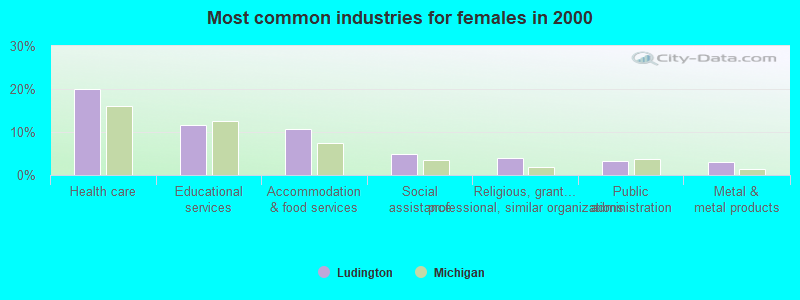
- Health care (20.1%)
- Educational services (11.6%)
- Accommodation & food services (10.7%)
- Social assistance (5.0%)
- Religious, grantmaking, civic, professional, similar organizations (3.9%)
- Public administration (3.4%)
- Metal & metal products (2.9%)
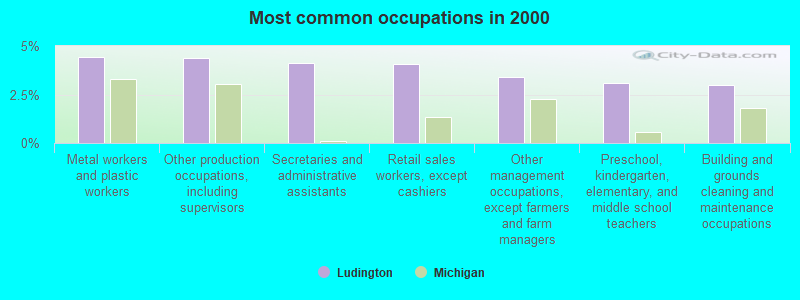
- Metal workers and plastic workers (4.4%)
- Other production occupations, including supervisors (4.4%)
- Secretaries and administrative assistants (4.1%)
- Retail sales workers, except cashiers (4.1%)
- Other management occupations, except farmers and farm managers (3.4%)
- Preschool, kindergarten, elementary, and middle school teachers (3.1%)
- Building and grounds cleaning and maintenance occupations (3.0%)
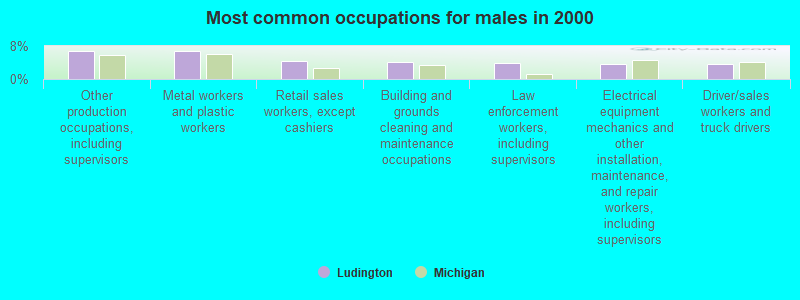
- Other production occupations, including supervisors (6.9%)
- Metal workers and plastic workers (6.9%)
- Retail sales workers, except cashiers (4.5%)
- Building and grounds cleaning and maintenance occupations (4.2%)
- Law enforcement workers, including supervisors (4.0%)
- Electrical equipment mechanics and other installation, maintenance, and repair workers, including supervisors (3.6%)
- Driver/sales workers and truck drivers (3.6%)

- Secretaries and administrative assistants (7.3%)
- Cashiers (5.1%)
- Information and record clerks, except customer service representatives (4.8%)
- Counselors, social workers, and other community and social service specialists (4.7%)
- Registered nurses (4.1%)
- Other teachers, instructors, education, training, and library occupations (4.0%)
- Cooks and food preparation workers (3.8%)
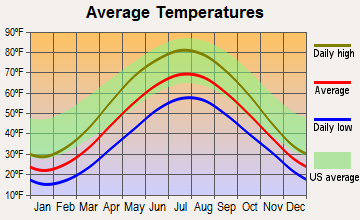
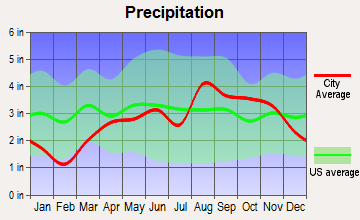
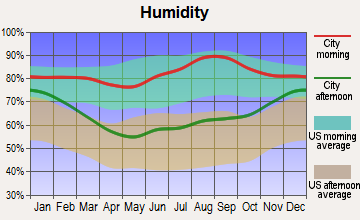
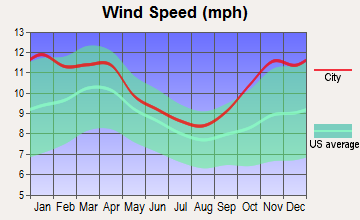
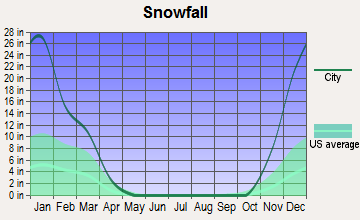
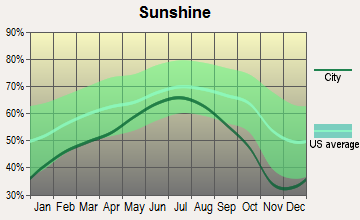
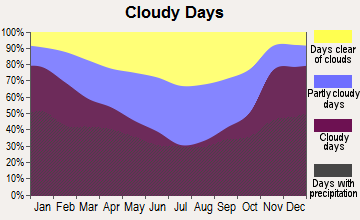
Average climate in Ludington, Michigan
Based on data reported by over 4,000 weather stations
|
|

Tornado activity:
Ludington-area historical tornado activity is significantly below Michigan state average. It is 62% smaller than the overall U.S. average.
On 4/3/1956, a category F4 (max. wind speeds 207-260 mph) tornado 30.5 miles away from the Ludington city center killed 2 people and injured 24 people and caused between $50,000 and $500,000 in damages.
On 4/12/1972, a category F2 (max. wind speeds 113-157 mph) tornado 13.6 miles away from the city center injured 8 people and caused between $500,000 and $5,000,000 in damages.
Earthquake activity:
Ludington-area historical earthquake activity is significantly above Michigan state average. It is 34% smaller than the overall U.S. average.On 5/2/2015 at 16:23:07, a magnitude 4.2 (4.2 MW, Depth: 2.8 mi, Class: Light, Intensity: IV - V) earthquake occurred 129.6 miles away from the city center
On 1/31/1986 at 16:46:43, a magnitude 5.0 (5.0 MB, Class: Moderate, Intensity: VI - VII) earthquake occurred 313.8 miles away from Ludington center
On 9/25/1998 at 19:52:52, a magnitude 5.2 (4.8 MB, 4.3 MS, 5.2 LG, 4.5 MW, Depth: 3.1 mi) earthquake occurred 351.4 miles away from Ludington center
On 4/18/2008 at 09:36:59, a magnitude 5.4 (5.1 MB, 4.8 MS, 5.4 MW, 5.2 MW) earthquake occurred 388.1 miles away from the city center
On 6/10/1987 at 23:48:54, a magnitude 5.1 (4.9 MB, 4.4 MS, 4.6 MS, 5.1 LG) earthquake occurred 363.0 miles away from Ludington center
On 7/12/1986 at 08:19:37, a magnitude 4.5 (4.5 MB) earthquake occurred 259.3 miles away from Ludington center
Magnitude types: regional Lg-wave magnitude (LG), body-wave magnitude (MB), surface-wave magnitude (MS), moment magnitude (MW)
Natural disasters:
The number of natural disasters in Mason County (8) is smaller than the US average (15).Major Disasters (Presidential) Declared: 4
Emergencies Declared: 3
Causes of natural disasters: Storms: 4, Floods: 3, Blizzard: 1, Drought: 1, Hurricane: 1, Snowstorm: 1, Tornado: 1, Wind: 1, Other: 1 (Note: some incidents may be assigned to more than one category).
Hospitals and medical centers in Ludington:
- HOSPICE OF MICHIGAN (10 ATKINSON DR, SUITE #3)
- MEMORIAL MEDICAL CENTER OF WEST MICHIGAN (Voluntary non-profit - Other, 1 N ATKINSON DRIVE)
- BAYWOOD NURSING HOME (1000 E TINKHAM AVE)
- OAKVIEW MEDICAL CARE FACILITY (1000 DIANA ST)
- TENDERCARE OF LUDINGTON (1000 E TINKHAM AVE)
- DAVITA - LUDINGTON (7 N ATKINSON DR STE 210)
- LAKESHORE HOME HEALTH CARE, INC (5511 WEST US TEN HWY, SUITE C)
- MEMORIAL MEDICAL HOME CARE (ONE NORTH ATKINSON DRIVE, SUITE 202)
- MICHIGAN HOME HEALTH CARE INC (5724 W-US 10)
Airports and heliports located in Ludington:
- Mason County Airport (LDM) (Runways: 2, Air Taxi Ops: 2,000, Itinerant Ops: 4,423, Local Ops: 3,259)
- Memorial Medical Center Heliport (3MI4)
Colleges/universities with over 2000 students nearest to Ludington:
- Muskegon Community College (about 51 miles; Muskegon, MI; Full-time enrollment: 3,310)
- Baker College of Muskegon (about 51 miles; Muskegon, MI; FT enrollment: 3,293)
- Ferris State University (about 52 miles; Big Rapids, MI; FT enrollment: 11,238)
- Northwestern Michigan College (about 71 miles; Traverse City, MI; FT enrollment: 3,276)
- Lakeland College (about 73 miles; Plymouth, WI; FT enrollment: 2,395)
- Grand Valley State University (about 75 miles; Allendale, MI; FT enrollment: 21,982)
- Grand Rapids Community College (about 79 miles; Grand Rapids, MI; FT enrollment: 11,296)
Public high schools in Ludington:
- LUDINGTON HIGH SCHOOL (Students: 817, Location: 508 NORTH WASHINGTON AVE, Grades: 9-12)
- ACADEMY OF SCIENCE MATH AND TECHNOLOGY EARLY COLLE (Location: 2130 W. US 10, Grades: 11-12)
- DEVELOPMENTAL CLASSROOMS (Location: 2130 WEST US HIGHWAY 10, Grades: KG-12)
Public elementary/middle schools in Ludington:
- FOSTER SCHOOL (Students: 195, Location: 505 EAST FOSTER ST, Grades: 3-5)
- FRANKLIN ELEMENTARY SCHOOL (Location: 721 ANDERSON ST, Grades: KG-2)
- LAKEVIEW ELEMENTARY SCHOOL (Location: 502 WEST HAIGHT ST, Grades: KG-2)
- O.J. DEJONGE MIDDLE SCHOOL (Location: 706 EAST TINKHAM AVE, Grades: 6-8)
Private elementary/middle schools in Ludington:
Points of interest:
Notable locations in Ludington: Ludington Yacht Club (A), Thompson Marina (B), Ludington Outboard Club (C), Tamarac Sport Fishing Dock (D), Ray Auto Marina (E), Ludington Station (F), Cartier Campgrounds (G), Harbor View Marina (H), Ludington Municipal Marina (I), Mason County Courthouse (J), Mason County District Library (K), Mason County Sheriff's Office (L), Ludington Fire Department (M). Display/hide their locations on the map
Churches in Ludington include: Prayer and Praise Assembly of God Church (A), Emmanuel Lutheran Church (B), People's Church (C), Ludington Seventh Day Adventist Church (D), Living Word Church (E), Saint Johns Lutheran Church (F), United Methodist Church (G), Bethany Lutheran Church (H), Ludington Baptist Chapel (I). Display/hide their locations on the map
Cemetery: Lakeview Cemetery (1). Display/hide its location on the map
Parks in Ludington include: Copeyon Park (1), Waterfront Park (2), Ludington City Park (3), Marquette's Death Historical Marker (4), Mason County Historical Marker (5), Mason County Courthouse Historical Marker (6), Swedish Lutheran Church Historical Marker (7), Ludington Car Ferries Historical Marker (8), SS Badger Historical Marker (9). Display/hide their locations on the map
Tourist attractions: Haunted Corn Maze (Cultural Attractions- Events- & Facilities; 2688 West Conrad Road), Amber Elk Ranch (Cultural Attractions- Events- & Facilities; 2688 West Conrad Road), Big Sable Point Lighthouse (Tours & Charters; 5611 North Lighthouse).
Hotels: Four Seasons Lodging & Breakfast (717 East Ludington Avenue), Blue Spruce Motel (109 North Ferry Street), Country Haven Resort-Motel (3263 North Lakeshore Dr).
Court: Mason County Government - Courthouse- Circuit Court (304 East Ludington Avenue).
Birthplace of: Mike Hankwitz - Football player and coach, William A. Ekwall - Politician, William R. Charette - Navy Medal of Honor recipient, Davey Claire - Baseball player.
Drinking water stations with addresses in Ludington and their reported violations in the past:
SILVER CREEK RV RESORT (Population served: 400, Groundwater):Past monitoring violations:WHITE PINE VILLAGE (Population served: 200, Groundwater):
- 3 regular monitoring violations
Past monitoring violations:KIBBY CREEK TRAVEL PARK (Population served: 170, Groundwater):
- 2 routine major monitoring violations
- 2 regular monitoring violations
Past monitoring violations:STAR PORT MARINA (Population served: 154, Groundwater):
- 10 routine major monitoring violations
- One regular monitoring violation
Past health violations:SILVER CREEK RV RESORT (Population served: 150, Groundwater):Past monitoring violations:
- MCL, Monthly (TCR) - In JUL-2011, Contaminant: Coliform. Follow-up actions: St Tech Assistance Visit (JUL-13-2011), St Public Notif requested (JUL-13-2011), St Public Notif issued (JUL-13-2011), St Public Notif received (JUL-13-2011), St Violation/Reminder Notice (JUL-13-2011), St Compliance achieved (2 times from JUL-15-2011 to SEP-14-2011)
- 6 routine major monitoring violations
- 4 regular monitoring violations
Past monitoring violations:HEMLOCK GOLF COURSE (Population served: 150, Groundwater):
- 4 routine major monitoring violations
Past monitoring violations:PERE MARQUETTE TOWNSHIP HALL (Population served: 104, Groundwater):
- One routine major monitoring violation
- 2 regular monitoring violations
Past health violations:KIBBY CREEK TRAVEL PARK (SEASONAL) (Population served: 100, Groundwater):Past monitoring violations:
- MCL, Monthly (TCR) - In DEC-2008, Contaminant: Coliform. Follow-up actions: St Public Notif requested (DEC-11-2008), St Public Notif received (DEC-11-2008), St Tech Assistance Visit (DEC-12-2008), St Compliance achieved (DEC-18-2008)
- 2 routine major monitoring violations
Past monitoring violations:
- 2 routine major monitoring violations
- One regular monitoring violation
Drinking water stations with addresses in Ludington that have no violations reported:
- MEMORIAL FAMILY CARE CENTER (Population served: 50, Primary Water Source Type: Groundwater)
- HOBBY CREST RESORT (Population served: 25, Primary Water Source Type: Groundwater)
| This city: | 2.2 people |
| Michigan: | 2.5 people |
| This city: | 56.5% |
| Whole state: | 66.0% |
| This city: | 7.4% |
| Whole state: | 6.4% |
Likely homosexual households (counted as self-reported same-sex unmarried-partner households)
- Lesbian couples: 0.5% of all households
- Gay men: 0.3% of all households
People in group quarters in Ludington in 2010:
- 220 people in nursing facilities/skilled-nursing facilities
- 59 people in local jails and other municipal confinement facilities
- 14 people in emergency and transitional shelters (with sleeping facilities) for people experiencing homelessness
- 5 people in other noninstitutional facilities
People in group quarters in Ludington in 2000:
- 95 people in nursing homes
- 68 people in local jails and other confinement facilities (including police lockups)
- 14 people in other noninstitutional group quarters
- 5 people in other group homes
- 2 people in military barracks, etc.
Banks with branches in Ludington (2011 data):
- PNC Bank, National Association: Ludington Branch at 130 East Ludington Avenue, branch established on 1882/02/19; Ludington Plaza Branch at 4566 West U.S 10, branch established on 1972/04/24. Info updated 2012/03/20: Bank assets: $263,309.6 mil, Deposits: $197,343.0 mil, headquarters in Wilmington, DE, positive income, Commercial Lending Specialization, 3085 total offices, Holding Company: Pnc Financial Services Group, Inc., The
- Northwestern Bank: Ludington Federal Branch at 101 East Court Street, branch established on 1991/05/17; Ludington East Branch at 3965 West Us 10, branch established on 2004/10/11. Info updated 2006/11/03: Bank assets: $867.7 mil, Deposits: $784.0 mil, headquarters in Traverse City, MI, positive income, Commercial Lending Specialization, 27 total offices
- The Shelby State Bank: Ludington Branch at 30 North Meyers Avenue, branch established on 2008/07/08. Info updated 2006/11/03: Bank assets: $206.2 mil, Deposits: $177.4 mil, headquarters in Shelby, MI, positive income, Commercial Lending Specialization, 8 total offices, Holding Company: Shelby Financial Corporation
- Fifth Third Bank: Ludington at 5870 West U.S. 10, branch established on 1967/03/13. Info updated 2009/10/05: Bank assets: $114,540.4 mil, Deposits: $89,689.1 mil, headquarters in Cincinnati, OH, positive income, Commercial Lending Specialization, 1378 total offices, Holding Company: Fifth Third Bancorp
- West Shore Bank: at 201 West Loomis Street, branch established on 1898/07/25. Info updated 2006/11/03: Bank assets: $345.2 mil, Deposits: $264.6 mil, local headquarters, positive income, 8 total offices, Holding Company: West Shore Bank Corporation
For population 15 years and over in Ludington:
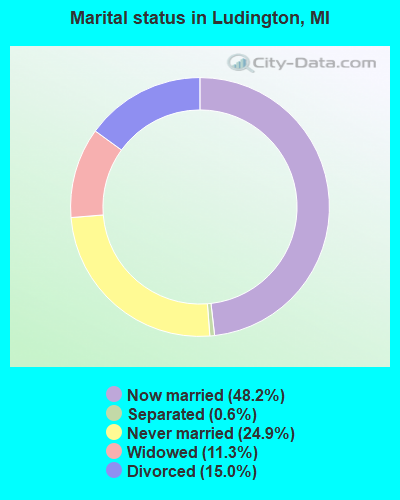
- Never married: 24.9%
- Now married: 48.2%
- Separated: 0.6%
- Widowed: 11.3%
- Divorced: 15.0%
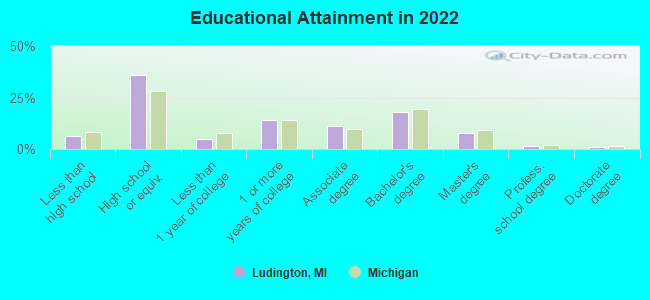
For population 25 years and over in Ludington:
- High school or higher: 93.7%
- Bachelor's degree or higher: 27.2%
- Graduate or professional degree: 10.0%
- Unemployed: 7.5%
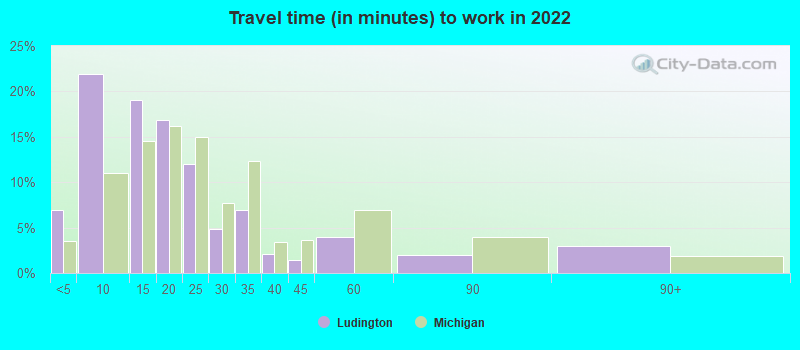
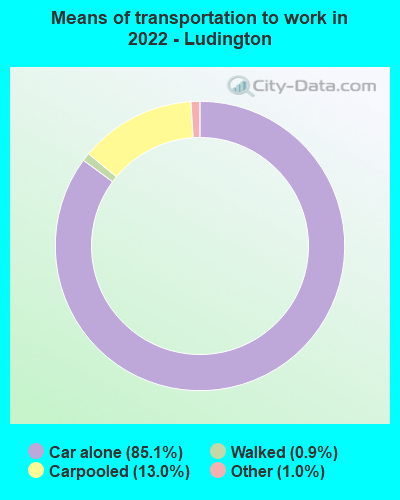
- Mean travel time to work (commute): 13.0 minutes
| Here: | 10.1 |
| Michigan average: | 11.0 |
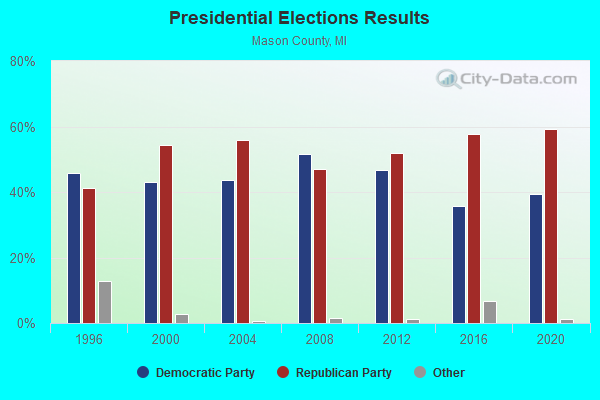
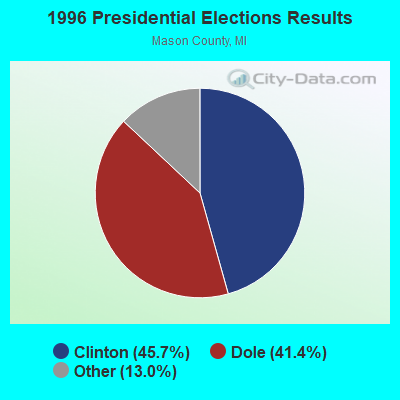
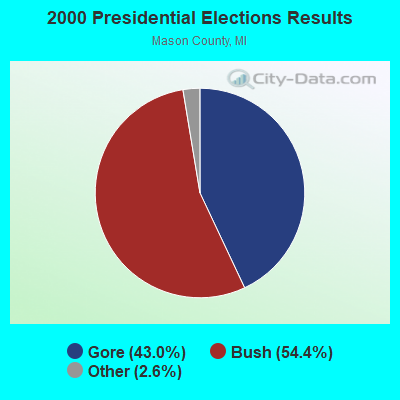
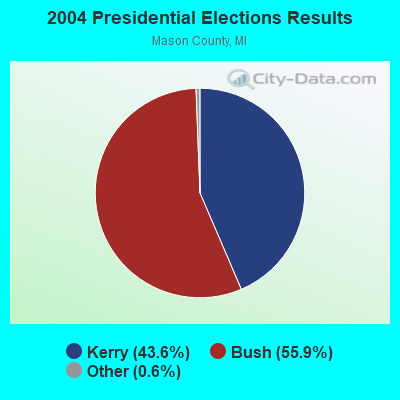
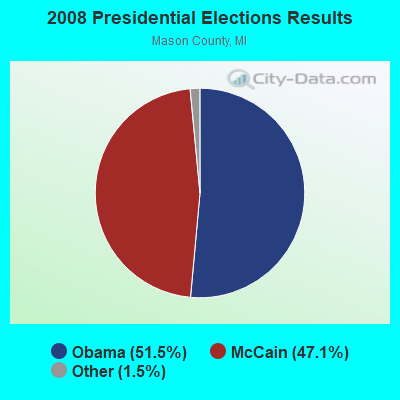
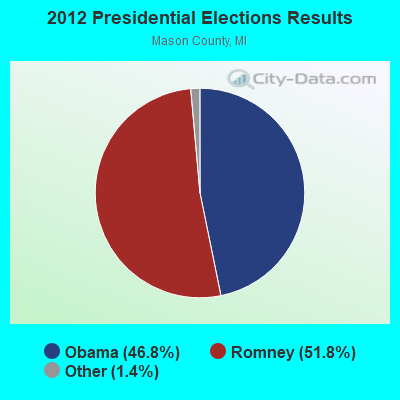

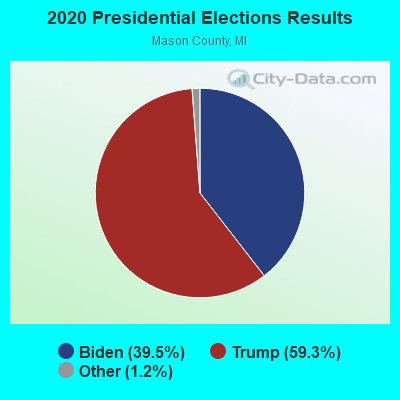
Graphs represent county-level data. Detailed 2008 Election Results
Religion statistics for Ludington, MI (based on Mason County data)
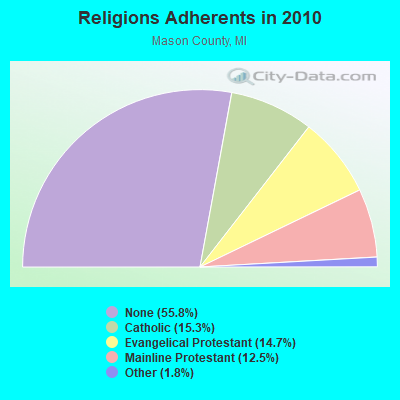
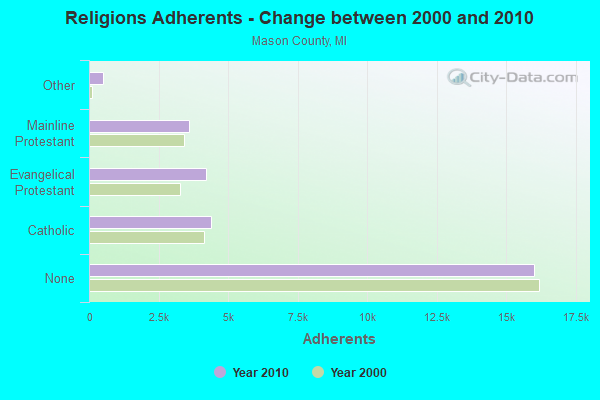
| Religion | Adherents | Congregations |
|---|---|---|
| Catholic | 4,385 | 6 |
| Evangelical Protestant | 4,223 | 33 |
| Mainline Protestant | 3,581 | 11 |
| Other | 511 | 6 |
| None | 16,005 | - |
Food Environment Statistics:
| Here: | 2.78 / 10,000 pop. |
| Michigan: | 2.34 / 10,000 pop. |
| Mason County: | 0.70 / 10,000 pop. |
| State: | 0.18 / 10,000 pop. |
| Mason County: | 5.91 / 10,000 pop. |
| State: | 2.99 / 10,000 pop. |
| Mason County: | 11.13 / 10,000 pop. |
| State: | 6.80 / 10,000 pop. |
| Mason County: | 9.3% |
| Michigan: | 9.7% |
| Mason County: | 29.1% |
| State: | 29.7% |
| Here: | 12.2% |
| State: | 13.4% |
Health and Nutrition:
| This city: | 51.7% |
| Michigan: | 50.3% |
| Here: | 48.3% |
| Michigan: | 47.9% |
| Ludington: | 28.6 |
| Michigan: | 28.7 |
| Here: | 19.7% |
| Michigan: | 20.6% |
| Here: | 11.7% |
| Michigan: | 10.4% |
| Here: | 6.9 |
| Michigan: | 6.8 |
| Ludington: | 34.1% |
| Michigan: | 34.1% |
| Ludington: | 57.1% |
| State: | 57.0% |
| Ludington: | 77.0% |
| Michigan: | 79.6% |
More about Health and Nutrition of Ludington, MI Residents
| Local government employment and payroll (March 2022) | |||||
| Function | Full-time employees | Monthly full-time payroll | Average yearly full-time wage | Part-time employees | Monthly part-time payroll |
|---|---|---|---|---|---|
| Police Protection - Officers | 14 | $82,783 | $70,957 | 0 | $0 |
| Streets and Highways | 11 | $44,848 | $48,925 | 0 | $0 |
| Water Supply | 10 | $39,250 | $47,100 | 0 | $0 |
| Sewerage | 7 | $29,742 | $50,986 | 0 | $0 |
| Financial Administration | 6 | $25,318 | $50,636 | 0 | $0 |
| Parks and Recreation | 5 | $21,058 | $50,539 | 5 | $2,157 |
| Other and Unallocable | 4 | $14,951 | $44,853 | 0 | $0 |
| Other Government Administration | 4 | $23,383 | $70,149 | 0 | $0 |
| Welfare | 2 | $8,157 | $48,942 | 2 | $1,652 |
| Housing and Community Development (Local) | 2 | $9,411 | $56,466 | 1 | $2,945 |
| Police - Other | 1 | $3,383 | $40,596 | 1 | $1,160 |
| Totals for Government | 66 | $302,285 | $54,961 | 9 | $7,914 |
Ludington government finances - Expenditure in 2018 (per resident):
- Construction - Sewerage: $524,000 ($68.06)
- Current Operations - Regular Highways: $2,162,000 ($280.82)
Water Utilities: $1,605,000 ($208.47)
Police Protection: $1,549,000 ($201.19)
General - Other: $1,481,000 ($192.36)
Sewerage: $1,247,000 ($161.97)
Parks and Recreation: $832,000 ($108.07)
Central Staff Services: $604,000 ($78.45)
Financial Administration: $293,000 ($38.06)
General Public Buildings: $258,000 ($33.51)
Local Fire Protection: $174,000 ($22.60)
Health - Other: $82,000 ($10.65)
Judicial and Legal Services: $76,000 ($9.87)
Protective Inspection and Regulation - Other: $49,000 ($6.36)
- General - Interest on Debt: $72,000 ($9.35)
- Other Capital Outlay - Local Fire Protection: $191,000 ($24.81)
Water Utilities: $189,000 ($24.55)
General - Other: $71,000 ($9.22)
Police Protection: $36,000 ($4.68)
Parks and Recreation: $16,000 ($2.08)
- Total Salaries and Wages: $3,723,000 ($483.57)
Ludington government finances - Revenue in 2018 (per resident):
- Charges - Sewerage: $1,776,000 ($230.68)
Parks and Recreation: $1,175,000 ($152.62)
Other: $552,000 ($71.70)
- Federal Intergovernmental - Housing and Community Development: $83,000 ($10.78)
Other: $56,000 ($7.27)
Health and Hospitals: $13,000 ($1.69)
- Local Intergovernmental - Other: $392,000 ($50.92)
Health and Hospitals: $201,000 ($26.11)
- Miscellaneous - General Revenue - Other: $450,000 ($58.45)
Rents: $142,000 ($18.44)
Interest Earnings: $71,000 ($9.22)
Fines and Forfeits: $31,000 ($4.03)
Sale of Property: $27,000 ($3.51)
- Revenue - Water Utilities: $2,154,000 ($279.78)
- State Intergovernmental - Other: $1,422,000 ($184.70)
Highways: $835,000 ($108.46)
General Local Government Support: $802,000 ($104.17)
- Tax - Property: $3,883,000 ($504.35)
Occupation and Business License - Other: $86,000 ($11.17)
Other License: $33,000 ($4.29)
Ludington government finances - Debt in 2018 (per resident):
- Long Term Debt - Outstanding Unspecified Public Purpose: $12,633,000 ($1640.86)
Issue, Unspecified Public Purpose: $10,418,000 ($1353.16)
Beginning Outstanding - Unspecified Public Purpose: $2,810,000 ($364.98)
Retired Unspecified Public Purpose: $595,000 ($77.28)
Ludington government finances - Cash and Securities in 2018 (per resident):
- Bond Funds - Cash and Securities: $8,796,000 ($1142.49)
- Other Funds - Cash and Securities: $6,218,000 ($807.64)
| Businesses in Ludington, MI | ||||
| Name | Count | Name | Count | |
|---|---|---|---|---|
| AT&T | 1 | Little Caesars Pizza | 1 | |
| Advance Auto Parts | 1 | Lowe's | 1 | |
| Applebee's | 1 | MasterBrand Cabinets | 2 | |
| Arby's | 1 | Maurices | 1 | |
| AutoZone | 1 | McDonald's | 1 | |
| Best Western | 1 | Meijer | 1 | |
| Burger King | 1 | New Balance | 2 | |
| Chevrolet | 1 | Penske | 1 | |
| Curves | 1 | Pizza Hut | 1 | |
| Dairy Queen | 1 | RadioShack | 1 | |
| Days Inn | 1 | Ramada | 1 | |
| FedEx | 1 | Rite Aid | 1 | |
| Ford | 1 | Staples | 1 | |
| GNC | 1 | Subway | 3 | |
| GameStop | 1 | Taco Bell | 1 | |
| H&R Block | 1 | True Value | 1 | |
| Haworth | 1 | U-Haul | 2 | |
| Holiday Inn | 1 | UPS | 6 | |
| Home Depot | 1 | Walgreens | 1 | |
| KFC | 1 | Walmart | 1 | |
| Lane Furniture | 1 | Wendy's | 1 | |
Strongest AM radio stations in Ludington:
- WKLA (1450 AM; 1 kW; LUDINGTON, MI; Owner: LAKE MICHIGAN BROADCASTING, INC.)
- WTCM (580 AM; 35 kW; TRAVERSE CITY, MI; Owner: WTCM RADIO, INC.)
- WLDR (1210 AM; daytime; 50 kW; KINGSLEY, MI; Owner: FORT BEND BROADCASTING COMPANY)
- WTMJ (620 AM; 50 kW; MILWAUKEE, WI; Owner: JOURNAL BROADCAST CORPORATION)
- WNAM (1280 AM; 50 kW; NEENAH-MENASHA, WI; Owner: CUMULUS LICENSING CORP.)
- WISN (1130 AM; 50 kW; MILWAUKEE, WI; Owner: CAPSTAR TX LIMITED PARTNERSHIP)
- WOAP (1080 AM; 50 kW; OWOSSO, MI)
- WGN (720 AM; 50 kW; CHICAGO, IL; Owner: WGN CONTINENTAL BROADCASTING CO.)
- WSCR (670 AM; 50 kW; CHICAGO, IL; Owner: INFINITY BROADCASTING OPERATIONS, INC.)
- WCCW (1310 AM; 15 kW; TRAVERSE CITY, MI; Owner: WCCW RADIO, INC.)
- WBBM (780 AM; 50 kW; CHICAGO, IL; Owner: INFINITY BROADCASTING OPERATIONS, INC.)
- WOOD (1300 AM; 20 kW; GRAND RAPIDS, MI; Owner: CLEAR CHANNEL BROADCASTING LICENSES, INC.)
- WHBY (1150 AM; 25 kW; KIMBERLY, WI; Owner: WOODWARD COMMUNICATIONS, INC.)
Strongest FM radio stations in Ludington:
- WKLA-FM (106.3 FM; LUDINGTON, MI; Owner: LAKE MICHIGAN BROADCASTING, INC.)
- WKZC (94.9 FM; SCOTTVILLE, MI; Owner: LAKE MICHIGAN BROADCASTING, INC.)
- WCXT (105.3 FM; HART, MI; Owner: WATERS BROADCASTING CORPORATION)
- WMOM (102.7 FM; PENTWATER, MI; Owner: BAY VIEW BROADCASTING, INC)
- WVXM (97.7 FM; MANISTEE, MI; Owner: XAVIER UNIVERSITY)
- WWKR (94.1 FM; PENTWATER, MI; Owner: SYNERGY MEDIA, INC.)
- WIAA (88.7 FM; INTERLOCHEN, MI; Owner: INTERLOCHEN CENTER FOR THE ARTS)
- WOUF (92.1 FM; BEULAH, MI; Owner: FORT BEND BROADCASTING CO.)
- WBLV (90.3 FM; TWIN LAKE, MI; Owner: BLUE LAKE FINE ARTS CAMP, INC.)
- WMTE-FM (101.5 FM; MANISTEE, MI; Owner: LAKE MICHIGAN BROADCASTING, INC.)
TV broadcast stations around Ludington:
- W34BZ (Channel 34; LUDINGTON, MI; Owner: MS COMMUNICATIONS, LLC)
- W48BY (Channel 48; LUDINGTON, MI; Owner: MS COMMUNICATIONS, LLC)
- W53CC (Channel 53; LUDINGTON, MI; Owner: MS COMMUNICATIONS, LLC)
- WCMW (Channel 21; MANISTEE, MI; Owner: CENTRAL MICHIGAN UNIVERSITY)
- WPBN-TV (Channel 7; TRAVERSE CITY, MI; Owner: WPBN/WTOM LICENSE SUBSIDIARY, INC.)
Medal of Honor Recipients
Medal of Honor Recipient born in Ludington: William R. Charette.
- National Bridge Inventory (NBI) Statistics
- 37Number of bridges
- 440ft / 134mTotal length
- $349,000Total costs
- 148,852Total average daily traffic
- 13,566Total average daily truck traffic
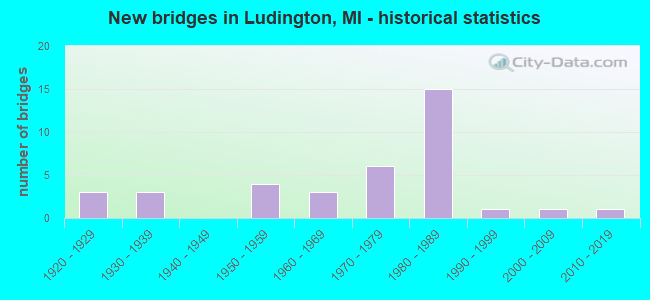
- New bridges - historical statistics
- 31920-1929
- 31930-1939
- 41950-1959
- 31960-1969
- 61970-1979
- 151980-1989
- 11990-1999
- 12000-2009
- 12010-2019
FCC Registered Antenna Towers: 144 (See the full list of FCC Registered Antenna Towers)
FCC Registered Commercial Land Mobile Towers: 1 (See the full list of FCC Registered Commercial Land Mobile Towers in Ludington, MI)
FCC Registered Broadcast Land Mobile Towers: 27 (See the full list of FCC Registered Broadcast Land Mobile Towers)
FCC Registered Microwave Towers: 20 (See the full list of FCC Registered Microwave Towers in this town)
FCC Registered Paging Towers: 4 (See the full list of FCC Registered Paging Towers)
FCC Registered Maritime Coast & Aviation Ground Towers: 12 (See the full list of FCC Registered Maritime Coast & Aviation Ground Towers)
FCC Registered Amateur Radio Licenses: 100 (See the full list of FCC Registered Amateur Radio Licenses in Ludington)
FAA Registered Aircraft: 29 (See the full list of FAA Registered Aircraft in Ludington)
2002 - 2018 National Fire Incident Reporting System (NFIRS) incidents
- Fire incident types reported to NFIRS in Ludington, MI
- 66955.3%Structure Fires
- 32626.9%Outside Fires
- 16513.6%Mobile Property/Vehicle Fires
- 504.1%Other
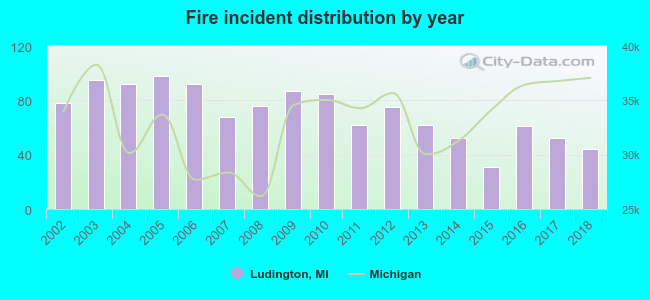 According to the data from the years 2002 - 2018 the average number of fires per year is 71. The highest number of reported fires - 98 took place in 2005, and the least - 31 in 2015. The data has a declining trend.
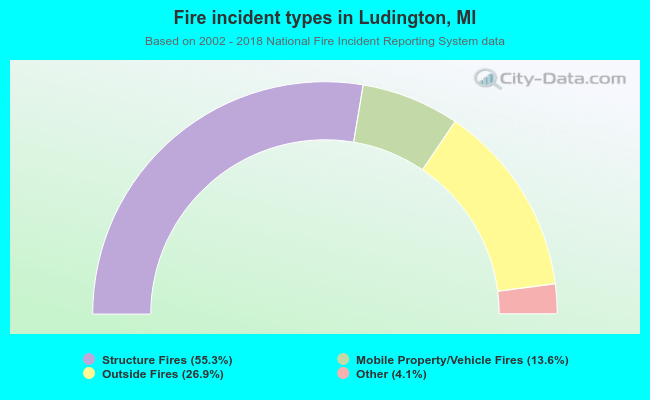 When looking into fire subcategories, the most incidents belonged to: Structure Fires (55.3%), and Outside Fires (26.9%).
Fire-safe hotels and motels in Ludington, Michigan:
- Comfort Inn, 5323 W US Hwy 10, Ludington, Michigan 49431 , Phone: (231) 845-7004, Fax: (231) 843-1677
- Americas Best Value Inn, 5095 W US 10, Ludington, Michigan 49431 , Phone: (231) 843-2233, Fax: (231) 843-1945
- America's Best Value Inn, 5095 W US 10, Ludington, Michigan 49431 , Phone: (231) 843-2233
- Holiday Inn Express & Suites, 4079 W US-10, Ludington, Michigan 49431 , Phone: (231) 845-7311
- Best Western Lakewinds, 5005 W US Hwy 10, Ludington, Michigan 49431 , Phone: (231) 843-2140, Fax: (231) 843-1753
| Most common first names in Ludington, MI among deceased individuals | ||
| Name | Count | Lived (average) |
|---|---|---|
| John | 145 | 77.1 years |
| Mary | 118 | 79.8 years |
| William | 111 | 78.5 years |
| Robert | 106 | 73.5 years |
| George | 84 | 76.8 years |
| Charles | 83 | 77.2 years |
| James | 77 | 71.9 years |
| Helen | 75 | 79.8 years |
| Edward | 69 | 76.5 years |
| Dorothy | 68 | 78.2 years |
| Most common last names in Ludington, MI among deceased individuals | ||
| Last name | Count | Lived (average) |
|---|---|---|
| Johnson | 109 | 77.2 years |
| Anderson | 68 | 79.3 years |
| Hansen | 56 | 80.8 years |
| Peterson | 55 | 79.8 years |
| Smith | 54 | 77.2 years |
| Olson | 39 | 77.2 years |
| Miller | 36 | 81.4 years |
| Nelson | 36 | 79.0 years |
| Larson | 34 | 76.4 years |
| Christensen | 32 | 80.6 years |
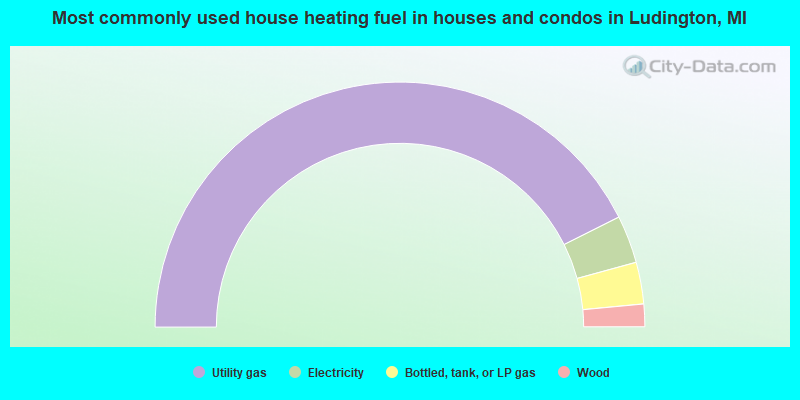
- 85.2%Utility gas
- 6.3%Electricity
- 5.5%Bottled, tank, or LP gas
- 3.0%Wood
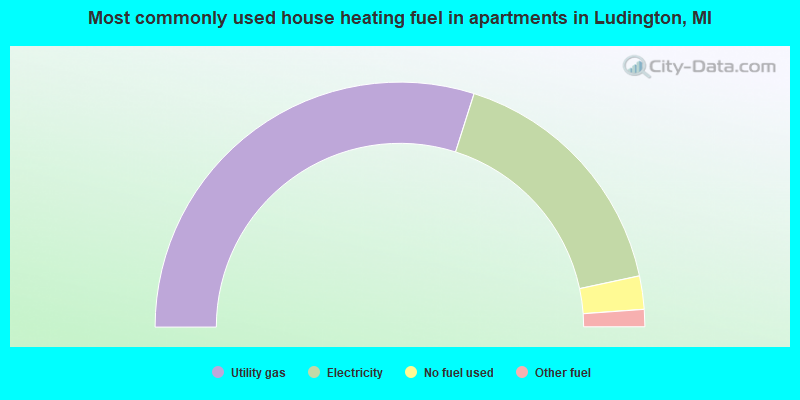
- 59.8%Utility gas
- 33.5%Electricity
- 4.4%No fuel used
- 2.3%Other fuel
Ludington compared to Michigan state average:
- Unemployed percentage below state average.
- Black race population percentage significantly below state average.
- Foreign-born population percentage significantly below state average.
- Renting percentage above state average.
- Length of stay since moving in above state average.
- Institutionalized population percentage above state average.
- Number of college students below state average.
Ludington on our top lists:
- #51 on the list of "Top 101 cities with the most users submitting photos to our site per 10,000 residents (population 5,000+)"
- #64 on the list of "Top 101 cities with the highest number of rapes per 100,000 residents, excludes tourist destinations and others with a lot of outsiders visiting based on city industries data (population 5,000+)"
- #65 on the list of "Top 101 cities with largest percentage of females in occupations: arts, design, entertainment, sports, and media occupations (population 5,000+)"

|
|
Total of 34 patent applications in 2008-2024.