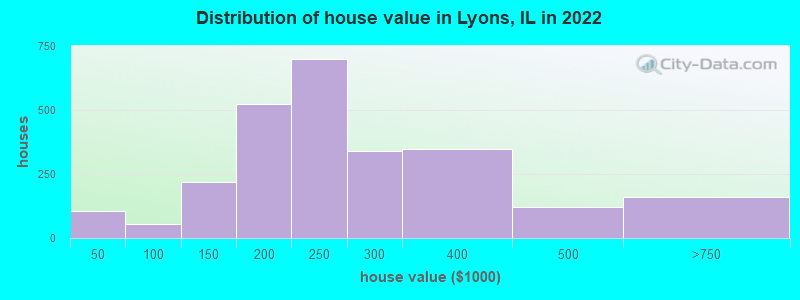
Estimated median house or condo value in 2022: $228,539 (it was $130,100 in 2000)
Lyons:
$228,539
IL:
$251,600
Mean prices in 2022:all housing units: $234,164; detached houses: $232,439; townhouses or other attached units: $192,862; in 2-unit structures: $249,601; in 3-to-4-unit structures: $465,559; in 5-or-more-unit structures: $187,251
Median gross rent in 2022: $1,060.
March 2022 cost of living index in Lyons: 101.0 (near average, U.S. average is 100)
Percentage of residents living in poverty in 2022: 7.4%
(5.4% for White Non-Hispanic residents, 13.1% for Black residents, 7.4% for Hispanic or Latino residents, 9.4% for other race residents)
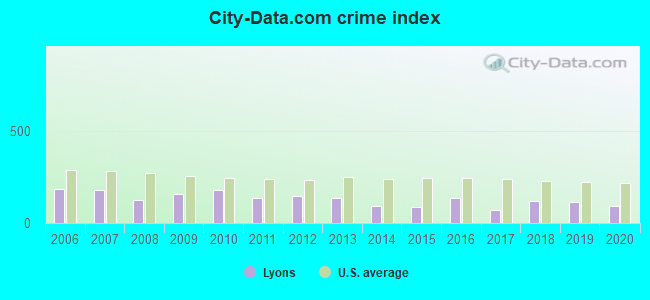
The City-Data.com crime index weighs serious crimes and violent crimes more heavily. Higher means more crime, U.S. average is 246.1. It adjusts for the number of visitors and daily workers commuting into cities.
Latest news from Lyons, IL collected exclusively by city-data.com from local newspapers, TV, and radio stations
Ancestries: Serbian (5.1%), Polish (4.9%), Albanian (4.2%), Italian (3.4%), American (3.4%), Czech (2.4%).
Current Local Time: CST time zone
Incorporated on 10/13/1888
Elevation: 620 feet
Land area: 2.21 square miles.
Population density: 4,718 people per square mile (average).
2,793 residents are foreign born (18.3% Latin America, 5.4% Europe).
This village:
26.7%
Illinois:
14.1%
Median real estate property taxes paid for housing units with mortgages in 2022: $5,543 (2.5%) Median real estate property taxes paid for housing units with no mortgage in 2022: $5,875 (2.5%)
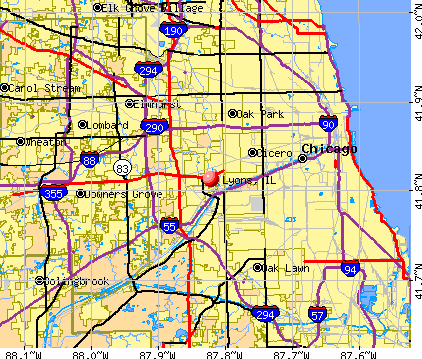
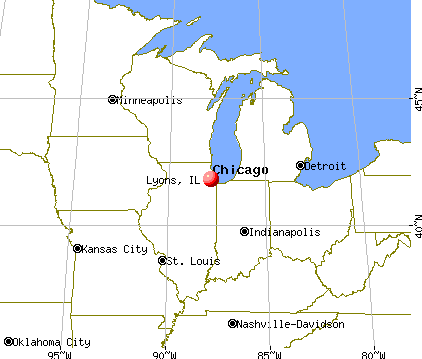
Nearest city with pop. 50,000+: Berwyn, IL (2.6 miles , pop. 54,016).
Nearest city with pop. 200,000+: Chicago, IL (7.6 miles , pop. 2,896,016).
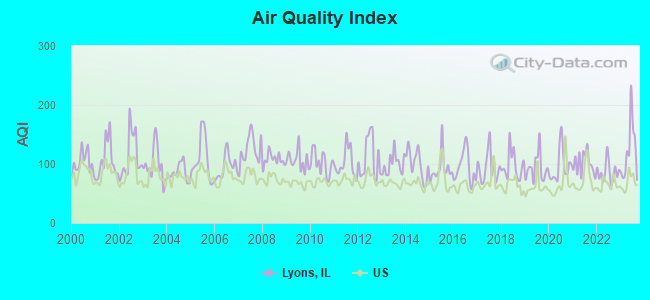
Air Quality Index (AQI) level in 2023 was 121. This is significantly worse than average.
City:
121
U.S.:
73
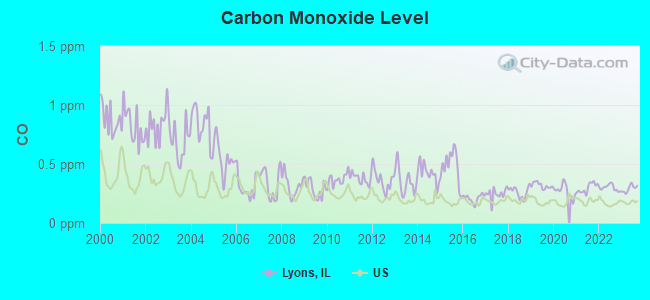
Carbon Monoxide (CO) [ppm] level in 2023 was 0.291. This is about average.Closest monitor was 4.4 miles away from the city center.
City:
0.291
U.S.:
0.251
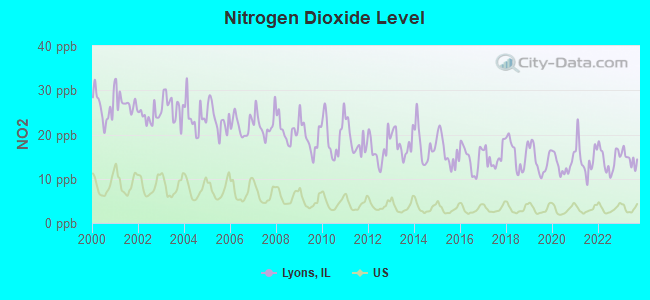
Nitrogen Dioxide (NO2) [ppb] level in 2023 was 14.6. This is significantly worse than average.Closest monitor was 2.3 miles away from the city center.
City:
14.6
U.S.:
5.1
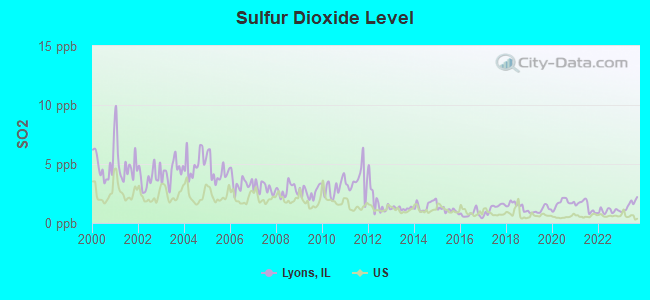
Sulfur Dioxide (SO2) [ppb] level in 2023 was 1.53. This is about average.Closest monitor was 0.3 miles away from the city center.
City:
1.53
U.S.:
1.51
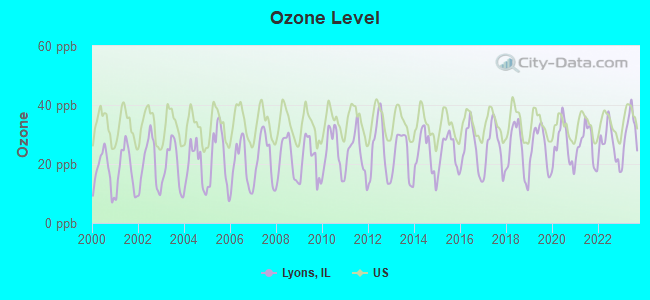
Ozone [ppb] level in 2023 was 30.9. This is about average.Closest monitor was 4.3 miles away from the city center.
City:
30.9
U.S.:
33.3
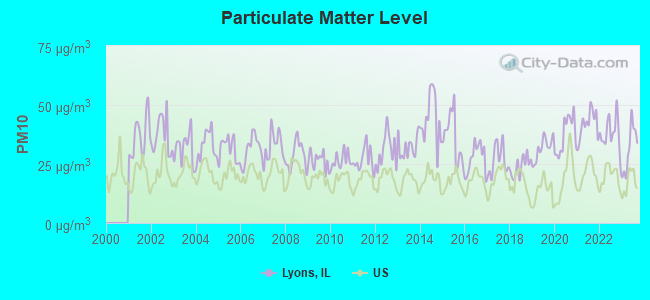
Particulate Matter (PM10) [µg/m3] level in 2023 was 31.4. This is significantly worse than average.Closest monitor was 1.0 miles away from the city center.
City:
31.4
U.S.:
19.2
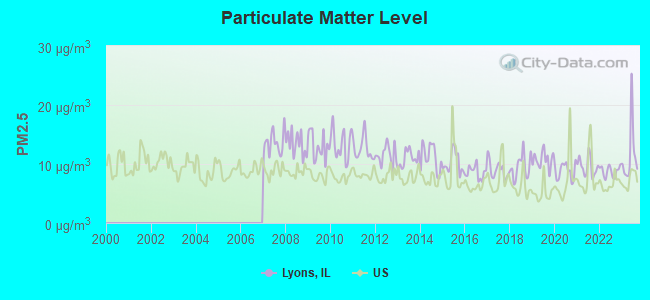
Particulate Matter (PM2.5) [µg/m3] level in 2023 was 11.5. This is significantly worse than average.Closest monitor was 0.3 miles away from the city center.
City:
11.5
U.S.:
8.1
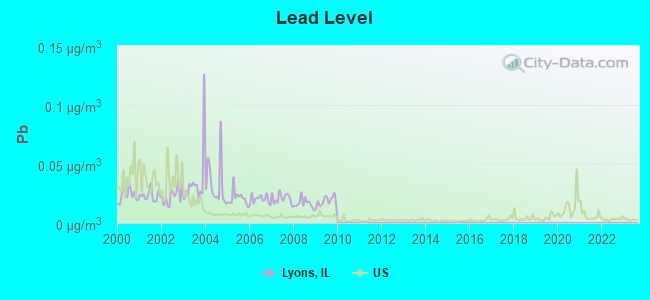
Lead (Pb) [µg/m3] level in 2009 was 0.0185. This is significantly worse than average.Closest monitor was 0.3 miles away from the city center.
City:
0.0185
U.S.:
0.0093
Tornado activity:
Lyons-area historical tornado activity is slightly below Illinois state average. It is 49% greater than the overall U.S. average.
On 8/28/1990, a category F5 (max. wind speeds 261-318 mph) tornado 24.9 miles away from the Lyons village center killed 29 peopleand injured 350 peopleand causedbetween $50,000 and $500,000 in damages.
On 6/13/1976, a category F4 (max. wind speeds 207-260 mph) tornado 7.7 miles away from the village center killed 2 peopleand injured 23 peopleand causedbetween $500,000 and $5,000,000 in damages.
Earthquake activity:
Lyons-area historical earthquake activity is significantly above Illinois state average. It is 41% greater than the overall U.S. average.
On 4/18/2008 at 09:36:59, a magnitude 5.4 (5.1 MB, 4.8 MS, 5.4 MW, 5.2 MW, Class: Moderate, Intensity: VI - VII) earthquake occurred 232.5 miles away from the city center On 6/10/1987 at 23:48:54, a magnitude 5.1 (4.9 MB, 4.4 MS, 4.6 MS, 5.1 LG) earthquake occurred 207.0 miles away from Lyons center On 4/18/2008 at 09:36:59, a magnitude 5.2 (5.2 MW, Depth: 8.9 mi) earthquake occurred 232.5 miles away from the city center On 6/28/2004 at 06:10:52, a magnitude 4.2 (4.2 MW, Depth: 6.2 mi, Class: Light, Intensity: IV - V) earthquake occurred 60.9 miles away from the city center On 6/18/2002 at 17:37:15, a magnitude 5.0 (4.3 MB, 4.6 MW, 5.0 LG) earthquake occurred 264.7 miles away from Lyons center On 4/18/2008 at 15:14:16, a magnitude 4.8 (4.5 MB, 4.8 MW, 4.6 MW) earthquake occurred 230.8 miles away from the city center Magnitude types: regional Lg-wave magnitude (LG), body-wave magnitude (MB), surface-wave magnitude (MS), moment magnitude (MW)
Natural disasters:
The number of natural disasters in Cook County (20) is greater than the US average (15). Major Disasters (Presidential) Declared: 15 Emergencies Declared: 4
Causes of natural disasters: Floods: 13, Storms: 12, Tornadoes: 3, Snowstorms: 2, Winter Storms: 2, Blizzard: 1, Hurricane: 1, Snow: 1, Wind: 1, Other: 1 (Note: some incidents may be assigned to more than one category).
Hospitals and medical centers near Lyons:
COURTYARD HEALTHCARE CENTER (Nursing Home, about 2 miles away; BERWYN, IL)
PERSHING CONVALESCENT CENTER (Nursing Home, about 2 miles away; BERWYN, IL)
PERSHING GARDENS HEALTHCARE CENTER (Nursing Home, about 2 miles away; STICKNEY, IL)
BRITISH HOME, THE (Nursing Home, about 2 miles away; BROOKFIELD, IL)
MACNEAL HOSPITAL Acute Care Hospitals (about 3 miles away; BERWYN, IL)
LAGRANGE COL MANOR CONV NSG CTR (Nursing Home, about 3 miles away; LA GRANGE, IL)
MEADOWBROOK MANOR - LAGRANGE (Nursing Home, about 3 miles away; LA GRANGE, IL)
Amtrak stations near Lyons:
2 miles: SUMMIT (ARCHER & CENTER AVE.) . Services: public payphones, free short-term parking, free long-term parking, call for taxi service, public transit connection.
3 miles: LA GRANGE ROAD (LA GRANGE, 25 W. BURLINGTON AVE.) . Services: enclosed waiting area, public payphones, taxi stand, public transit connection.
11 miles: CHICAGO (225 S. CANAL ST.) . Services: ticket office, partially wheelchair accessible, enclosed waiting area, public restrooms, public payphones, snack bar, paid short-term parking, paid long-term parking, call for car rental service, taxi stand, public transit connection.
Colleges/universities with over 2000 students nearest to Lyons:
Morton College (about 4 miles; Cicero, IL; Full-time enrollment: 3,236)
Concordia University-Chicago (about 6 miles; River Forest, IL; FT enrollment: 3,944)
Dominican University (about 7 miles; River Forest, IL; FT enrollment: 2,971)
City Colleges of Chicago-Richard J Daley College (about 7 miles; Chicago, IL; FT enrollment: 7,497)
Triton College (about 8 miles; River Grove, IL; FT enrollment: 8,817)
Moraine Valley Community College (about 9 miles; Palos Hills, IL; FT enrollment: 12,008)
Elmhurst College (about 9 miles; Elmhurst, IL; FT enrollment: 3,364)
LYONS PUBLIC LIBRARY (Operating income: $494,690; Location: 4209 JOLIET AVENUE; 57,836 books; 1,968 audio materials; 1,265 video materials; 4 local licensed databases; 16 state licensed databases; 1 other licensed databases; 161 print serial subscriptions; 4 electronic serial subscriptions)
User-submitted facts and corrections:
Loyola Medical Center, one of the largest hospitals in the Chicago area, is closer than either the Madden Psychiatric Center or the Riveredge Center. Look on any map, on First Ave., south of Madden and Riveredge.
added by Robert G. Olmstead
St Hughs school was closed 5 years ago.
Loyola Medical Center, one of the largest hospitals in the Chicago area, is closer than either the Madden Psychiatric Center or the Riveredge Center. Look on any map, on First Ave., south of Madden and Riveredge.
Loyola Medical Center, one of the largest hospitals in the Chicago area, is closer than either the Madden Psychiatric Center or the Riveredge Center. Look on any map, on First Ave., south of Madden and Riveredge.
Churches in Lyons include: Lyons Evangelical Free Church (A), Saint Hugh Catholic Church (B), Saint John's United Church of Christ (C), Zion Lutheran Church (D). Display/hide their locations on the map
Cook County has a predicted average indoor radon screening level between 2 and 4 pCi/L (pico curies per liter) - Moderate Potential
Average household size:
This village:
2.6 people
Illinois:
2.6 people
Percentage of family households:
This village:
63.9%
Whole state:
65.8%
Percentage of households with unmarried partners:
This village:
8.0%
Whole state:
6.3%
Likely homosexual households (counted as self-reported same-sex unmarried-partner households)
Lesbian couples: 0.3% of all households
Gay men: 0.2% of all households
56 people in nursing facilities/skilled-nursing facilities in 2010
13 people in group homes intended for adults in 2010
6 people in other group homes in 2000
Banks with branches in Lyons (2011 data):
Standard Bank and Trust Company: Lyons 7201 Branch, Internet Banking Branch, Lyons 8601 Branch. Info updated 2006/11/03: Bank assets: $2,140.2 mil, Deposits: $1,872.8 mil, headquarters in Hickory Hills, IL, positive income, Commercial Lending Specialization, 43 total offices, Holding Company: Standard Bancshares, Inc.
RBS Citizens, National Association: Lyons Branch at 4231 Joliet Avenue, branch established on 1922/01/01. Info updated 2007/09/19: Bank assets: $106,940.6 mil, Deposits: $75,690.2 mil, headquarters in Providence, RI, positive income, 1135 total offices, Holding Company: Uk Financial Investments Limited
Metrobank: Lyons Branch at 8744 Ogden Avenue, branch established on 2004/03/20. Info updated 2011/04/14: Bank assets: $800.5 mil, Deposits: $711.8 mil, headquarters in Berwyn, IL, negative income in the last year, Commercial Lending Specialization, 22 total offices, Holding Company: Metropolitan Bank Group, Inc.
Religion statistics for Lyons, IL (based on Cook County data)
Religion
Adherents
Congregations
Catholic
1,947,223
376
Evangelical Protestant
432,975
1,484
Other
312,636
403
Mainline Protestant
202,114
630
Black Protestant
148,895
395
Orthodox
53,276
66
None
2,097,556
-
Source: Clifford Grammich, Kirk Hadaway, Richard Houseal, Dale E.Jones, Alexei Krindatch, Richie Stanley and Richard H.Taylor. 2012. 2010 U.S.Religion Census: Religious Congregations & Membership Study. Association of Statisticians of American Religious Bodies. Jones, Dale E., et al. 2002. Congregations and Membership in the United States 2000. Nashville, TN: Glenmary Research Center. Graphs represent county-level data
Aircraft: JERZY RUDEK AEROSTAR FESTIVAL R4 (Category: Land, Seats: 2, Weight: Up to 12,499 Pounds), Engine: Reciprocating N-Number: 637WJ, N637WJ, N-637WJ, Serial Number: 451, Certificate Issue Date: 12/04/2019 Registrant (Individual): Jerzy Rudek, 4320 Center Ave, Lyons, IL 60534
Aircraft: JACEK WIETECHA PULSAR 1 (Category: Land, Seats: 2, Weight: Up to 12,499 Pounds), Engine: ROTAX 503 DCDI (52 HP) (Reciprocating) N-Number: 697M, N697M, N-697M, Serial Number: 113, Year manufactured: 2018, Airworthiness Date: 08/19/2018, Certificate Issue Date: 03/28/2018 Registrant (Individual): Jerzy S Rudek, 4320 Center Ave, Lyons, IL 60534
Aircraft: D & D SPECIAL D-1 (Category: Land, Seats: 2, Weight: Up to 12,499 Pounds, Speed: 85 mph), Engine: LYCOMING 0-290 SERIES (140 HP) (Reciprocating) N-Number: 54D, N54D, N-54D, Serial Number: 62-3, Year manufactured: 2003, Airworthiness Date: 06/05/2003 Registrant (Individual): Reported Sale, 4320 1st Ave, Lyons, IL 60534
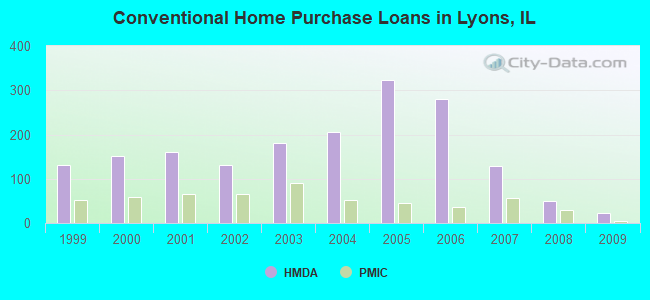
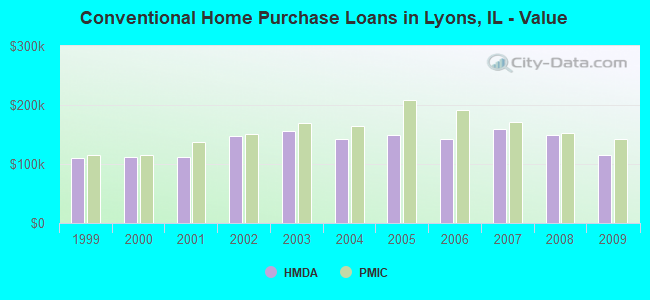
Home Mortgage Disclosure Act Aggregated Statistics For Year 2009 (Based on 1 full and 1 partial tracts)
A) FHA, FSA/RHS & VA Home Purchase Loans
B) Conventional Home Purchase Loans
C) Refinancings
D) Home Improvement Loans
E) Loans on Dwellings For 5+ Families
F) Non-occupant Loans on < 5 Family Dwellings (A B C & D)
Number
Average Value
Number
Average Value
Number
Average Value
Number
Average Value
Number
Average Value
Number
Average Value
LOANS ORIGINATED
46
$149,397
23
$115,978
125
$163,176
5
$130,512
1
$643,000
10
$143,528
APPLICATIONS APPROVED, NOT ACCEPTED
2
$178,800
3
$121,563
9
$206,444
1
$4,580
0
$0
0
$0
APPLICATIONS DENIED
10
$133,222
8
$96,800
100
$184,139
10
$40,754
0
$0
5
$174,466
APPLICATIONS WITHDRAWN
4
$110,030
5
$132,740
36
$171,563
1
$284,050
0
$0
3
$209,360
FILES CLOSED FOR INCOMPLETENESS
5
$139,792
2
$109,735
14
$168,063
0
$0
0
$0
1
$127,000
Aggregated Statistics For Year 2008 (Based on 1 full and 1 partial tracts)
A) FHA, FSA/RHS & VA Home Purchase Loans
B) Conventional Home Purchase Loans
C) Refinancings
D) Home Improvement Loans
E) Loans on Dwellings For 5+ Families
F) Non-occupant Loans on < 5 Family Dwellings (A B C & D)
G) Loans On Manufactured Home Dwelling (A B C & D)
Number
Average Value
Number
Average Value
Number
Average Value
Number
Average Value
Number
Average Value
Number
Average Value
Number
Average Value
LOANS ORIGINATED
26
$179,214
50
$148,760
150
$172,299
11
$67,977
3
$883,313
14
$151,646
0
$0
APPLICATIONS APPROVED, NOT ACCEPTED
1
$161,000
5
$138,452
25
$192,216
3
$64,487
0
$0
1
$100,000
0
$0
APPLICATIONS DENIED
3
$153,983
31
$138,072
134
$188,976
23
$93,229
0
$0
10
$131,800
1
$27,490
APPLICATIONS WITHDRAWN
2
$152,805
6
$168,687
37
$202,792
2
$106,500
0
$0
1
$106,000
0
$0
FILES CLOSED FOR INCOMPLETENESS
1
$275,810
7
$163,387
19
$209,803
0
$0
0
$0
0
$0
0
$0
Aggregated Statistics For Year 2007 (Based on 1 full and 1 partial tracts)
A) FHA, FSA/RHS & VA Home Purchase Loans
B) Conventional Home Purchase Loans
C) Refinancings
D) Home Improvement Loans
E) Loans on Dwellings For 5+ Families
F) Non-occupant Loans on < 5 Family Dwellings (A B C & D)
Number
Average Value
Number
Average Value
Number
Average Value
Number
Average Value
Number
Average Value
Number
Average Value
LOANS ORIGINATED
6
$201,748
129
$158,701
215
$174,306
32
$78,631
3
$331,333
11
$133,904
APPLICATIONS APPROVED, NOT ACCEPTED
1
$99,000
15
$165,949
41
$172,339
6
$72,593
0
$0
2
$205,250
APPLICATIONS DENIED
4
$206,625
52
$157,603
173
$186,501
36
$58,925
0
$0
13
$174,772
APPLICATIONS WITHDRAWN
0
$0
19
$113,181
45
$195,689
8
$200,421
0
$0
8
$174,828
FILES CLOSED FOR INCOMPLETENESS
0
$0
11
$191,630
37
$190,028
1
$260,000
0
$0
2
$221,525
Aggregated Statistics For Year 2006 (Based on 1 full and 1 partial tracts)
A) FHA, FSA/RHS & VA Home Purchase Loans
B) Conventional Home Purchase Loans
C) Refinancings
D) Home Improvement Loans
E) Loans on Dwellings For 5+ Families
F) Non-occupant Loans on < 5 Family Dwellings (A B C & D)
Number
Average Value
Number
Average Value
Number
Average Value
Number
Average Value
Number
Average Value
Number
Average Value
LOANS ORIGINATED
6
$238,833
280
$141,794
305
$166,201
30
$73,940
16
$528,948
25
$172,711
APPLICATIONS APPROVED, NOT ACCEPTED
0
$0
40
$131,154
71
$150,243
7
$111,546
0
$0
10
$134,775
APPLICATIONS DENIED
2
$232,000
98
$145,533
192
$173,124
23
$70,735
1
$166,770
10
$143,475
APPLICATIONS WITHDRAWN
1
$249,230
36
$130,859
90
$186,345
6
$67,738
1
$704,000
4
$105,322
FILES CLOSED FOR INCOMPLETENESS
0
$0
5
$217,782
22
$178,618
0
$0
0
$0
4
$235,968
Aggregated Statistics For Year 2005 (Based on 1 full and 1 partial tracts)
A) FHA, FSA/RHS & VA Home Purchase Loans
B) Conventional Home Purchase Loans
C) Refinancings
D) Home Improvement Loans
E) Loans on Dwellings For 5+ Families
F) Non-occupant Loans on < 5 Family Dwellings (A B C & D)
G) Loans On Manufactured Home Dwelling (A B C & D)
Number
Average Value
Number
Average Value
Number
Average Value
Number
Average Value
Number
Average Value
Number
Average Value
Number
Average Value
LOANS ORIGINATED
8
$184,075
324
$149,179
322
$158,454
31
$98,517
9
$624,019
42
$142,853
0
$0
APPLICATIONS APPROVED, NOT ACCEPTED
0
$0
49
$136,937
41
$187,904
5
$78,990
0
$0
5
$159,054
0
$0
APPLICATIONS DENIED
2
$180,000
79
$151,120
170
$161,394
31
$61,242
0
$0
10
$111,292
1
$150,270
APPLICATIONS WITHDRAWN
0
$0
50
$150,304
109
$176,275
8
$100,989
0
$0
8
$178,668
0
$0
FILES CLOSED FOR INCOMPLETENESS
1
$157,600
17
$141,473
35
$166,480
3
$19,110
0
$0
2
$142,000
0
$0
Aggregated Statistics For Year 2004 (Based on 1 full and 1 partial tracts)
A) FHA, FSA/RHS & VA Home Purchase Loans
B) Conventional Home Purchase Loans
C) Refinancings
D) Home Improvement Loans
E) Loans on Dwellings For 5+ Families
F) Non-occupant Loans on < 5 Family Dwellings (A B C & D)
G) Loans On Manufactured Home Dwelling (A B C & D)
Number
Average Value
Number
Average Value
Number
Average Value
Number
Average Value
Number
Average Value
Number
Average Value
Number
Average Value
LOANS ORIGINATED
31
$176,069
205
$142,112
343
$144,965
21
$80,109
8
$247,100
30
$145,211
0
$0
APPLICATIONS APPROVED, NOT ACCEPTED
1
$82,000
47
$162,062
53
$153,969
7
$56,403
0
$0
5
$91,756
0
$0
APPLICATIONS DENIED
0
$0
52
$144,316
149
$140,811
27
$44,997
1
$458,150
13
$157,961
2
$99,500
APPLICATIONS WITHDRAWN
2
$128,500
30
$150,584
100
$156,074
5
$111,400
0
$0
6
$100,537
0
$0
FILES CLOSED FOR INCOMPLETENESS
3
$180,360
9
$187,440
34
$165,214
2
$131,100
0
$0
0
$0
0
$0
Aggregated Statistics For Year 2003 (Based on 1 full and 1 partial tracts)
A) FHA, FSA/RHS & VA Home Purchase Loans
B) Conventional Home Purchase Loans
C) Refinancings
D) Home Improvement Loans
E) Loans on Dwellings For 5+ Families
F) Non-occupant Loans on < 5 Family Dwellings (A B C & D)
Number
Average Value
Number
Average Value
Number
Average Value
Number
Average Value
Number
Average Value
Number
Average Value
LOANS ORIGINATED
35
$178,181
181
$156,068
567
$124,442
22
$24,815
17
$353,439
27
$127,199
APPLICATIONS APPROVED, NOT ACCEPTED
2
$176,130
21
$154,323
74
$121,329
3
$22,333
0
$0
5
$152,874
APPLICATIONS DENIED
1
$94,000
32
$149,541
185
$124,267
22
$24,027
0
$0
6
$89,785
APPLICATIONS WITHDRAWN
3
$164,563
19
$184,596
79
$128,991
3
$29,853
0
$0
8
$115,084
FILES CLOSED FOR INCOMPLETENESS
1
$100,000
8
$131,074
16
$120,263
0
$0
0
$0
0
$0
Aggregated Statistics For Year 2002 (Based on 1 full and 1 partial tracts)
A) FHA, FSA/RHS & VA Home Purchase Loans
B) Conventional Home Purchase Loans
C) Refinancings
D) Home Improvement Loans
E) Loans on Dwellings For 5+ Families
F) Non-occupant Loans on < 5 Family Dwellings (A B C & D)
Number
Average Value
Number
Average Value
Number
Average Value
Number
Average Value
Number
Average Value
Number
Average Value
LOANS ORIGINATED
50
$161,034
132
$146,941
360
$123,116
10
$19,691
11
$509,079
9
$159,173
APPLICATIONS APPROVED, NOT ACCEPTED
3
$153,643
11
$120,584
58
$122,630
6
$22,830
0
$0
3
$94,177
APPLICATIONS DENIED
6
$174,590
22
$129,860
77
$115,222
13
$14,550
2
$1,099,560
2
$199,000
APPLICATIONS WITHDRAWN
2
$121,410
10
$117,777
62
$123,763
5
$26,708
1
$430,660
2
$242,215
FILES CLOSED FOR INCOMPLETENESS
1
$164,000
5
$96,330
36
$122,571
0
$0
0
$0
1
$102,000
Aggregated Statistics For Year 2001 (Based on 1 full and 1 partial tracts)
A) FHA, FSA/RHS & VA Home Purchase Loans
B) Conventional Home Purchase Loans
C) Refinancings
D) Home Improvement Loans
E) Loans on Dwellings For 5+ Families
F) Non-occupant Loans on < 5 Family Dwellings (A B C & D)
Number
Average Value
Number
Average Value
Number
Average Value
Number
Average Value
Number
Average Value
Number
Average Value
LOANS ORIGINATED
51
$147,814
160
$112,405
280
$116,711
15
$14,392
13
$251,258
19
$78,269
APPLICATIONS APPROVED, NOT ACCEPTED
4
$104,900
13
$95,317
39
$103,461
4
$76,520
1
$536,000
3
$101,467
APPLICATIONS DENIED
3
$153,333
20
$112,618
114
$99,148
19
$16,895
1
$210,000
4
$101,325
APPLICATIONS WITHDRAWN
2
$150,500
10
$161,957
53
$112,665
9
$45,699
1
$240,000
0
$0
FILES CLOSED FOR INCOMPLETENESS
0
$0
1
$133,000
12
$121,049
1
$24,740
0
$0
0
$0
Aggregated Statistics For Year 2000 (Based on 1 full and 1 partial tracts)
A) FHA, FSA/RHS & VA Home Purchase Loans
B) Conventional Home Purchase Loans
C) Refinancings
D) Home Improvement Loans
E) Loans on Dwellings For 5+ Families
F) Non-occupant Loans on < 5 Family Dwellings (A B C & D)
Number
Average Value
Number
Average Value
Number
Average Value
Number
Average Value
Number
Average Value
Number
Average Value
LOANS ORIGINATED
64
$123,802
151
$112,239
95
$87,565
30
$23,370
6
$380,005
5
$122,474
APPLICATIONS APPROVED, NOT ACCEPTED
5
$135,428
15
$105,357
23
$87,567
10
$21,911
0
$0
0
$0
APPLICATIONS DENIED
10
$131,509
28
$97,229
66
$90,830
28
$15,870
1
$120,000
2
$71,000
APPLICATIONS WITHDRAWN
9
$134,798
11
$111,513
27
$84,961
5
$16,716
1
$216,250
0
$0
FILES CLOSED FOR INCOMPLETENESS
1
$154,000
2
$104,500
14
$97,290
1
$9,160
0
$0
1
$74,000
Aggregated Statistics For Year 1999 (Based on 1 full and 1 partial tracts)
A) FHA, FSA/RHS & VA Home Purchase Loans
B) Conventional Home Purchase Loans
C) Refinancings
D) Home Improvement Loans
E) Loans on Dwellings For 5+ Families
F) Non-occupant Loans on < 5 Family Dwellings (A B C & D)
Detailed PMIC statistics for the following Tracts:8191.00
, 8192.00
2002 - 2018 National Fire Incident Reporting System (NFIRS) incidents
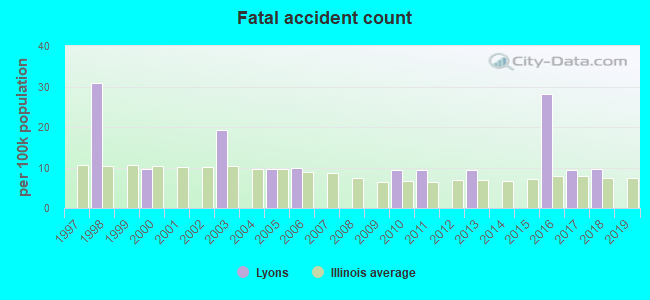
Based on the data from the years 2002 - 2018 the average number of fires per year is 60. The highest number of fire incidents - 99 took place in 2014, and the least - 9 in 2003. The data has a growing trend.
When looking into fire subcategories, the most reports belonged to: Structure Fires (68.1%), and Outside Fires (19.9%).
Fire incident types reported to NFIRS in Lyons, IL


 Recent articles from our blog. Our writers, many of them Ph.D. graduates or candidates, create easy-to-read articles on a wide variety of topics.

 (2.6 miles
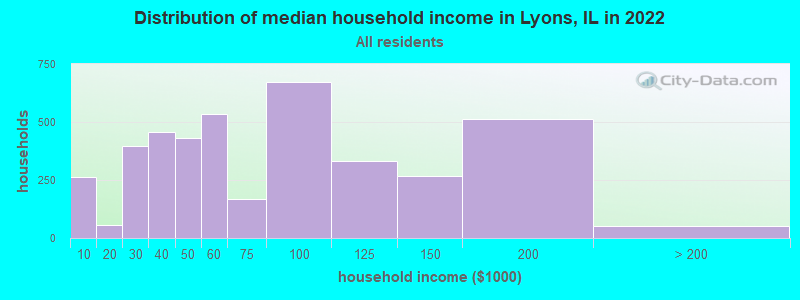


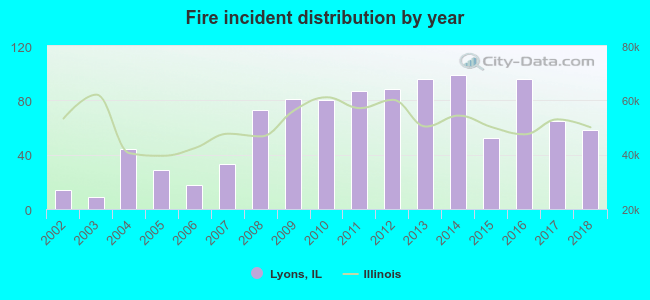 Based on the data from the years 2002 - 2018 the average number of fires per year is 60. The highest number of fire incidents - 99 took place in 2014, and the least - 9 in 2003. The data has a growing trend.
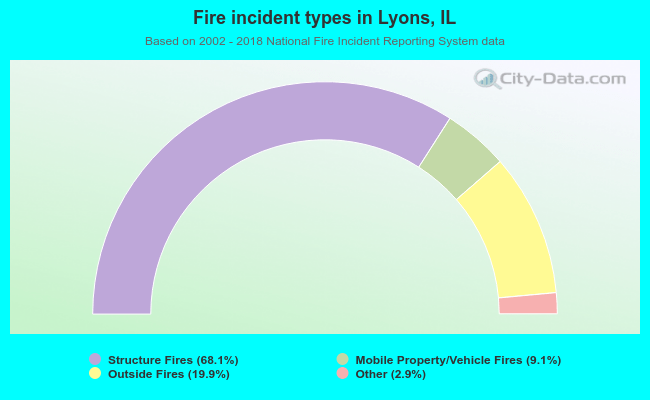 When looking into fire subcategories, the most reports belonged to: Structure Fires (68.1%), and Outside Fires (19.9%).