Madison, Mississippi Submit your own pictures of this city and show them to the world
OSM Map
General Map
Google Map
MSN Map
OSM Map
General Map
Google Map
MSN Map
OSM Map
General Map
Google Map
MSN Map
OSM Map
General Map
Google Map
MSN Map
Please wait while loading the map...
Population in 2022: 27,775 (97% urban, 3% rural). Population change since 2000: +89.0%Males: 13,556 Females: 14,219
March 2022 cost of living index in Madison: 87.4 (less than average, U.S. average is 100) Percentage of residents living in poverty in 2022: 4.7%for White Non-Hispanic residents , 8.3% for Black residents , 33.0% for Hispanic or Latino residents , 2.6% for other race residents , 13.5% for two or more races residents )
Profiles of local businesses
Business Search - 14 Million verified businesses
Data:
Median household income ($)
Median household income (% change since 2000)
Household income diversity
Ratio of average income to average house value (%)
Ratio of average income to average rent
Median household income ($) - White
Median household income ($) - Black or African American
Median household income ($) - Asian
Median household income ($) - Hispanic or Latino
Median household income ($) - American Indian and Alaska Native
Median household income ($) - Multirace
Median household income ($) - Other Race
Median household income for houses/condos with a mortgage ($)
Median household income for apartments without a mortgage ($)
Races - White alone (%)
Races - White alone (% change since 2000)
Races - Black alone (%)
Races - Black alone (% change since 2000)
Races - American Indian alone (%)
Races - American Indian alone (% change since 2000)
Races - Asian alone (%)
Races - Asian alone (% change since 2000)
Races - Hispanic (%)
Races - Hispanic (% change since 2000)
Races - Native Hawaiian and Other Pacific Islander alone (%)
Races - Native Hawaiian and Other Pacific Islander alone (% change since 2000)
Races - Two or more races (%)
Races - Two or more races (% change since 2000)
Races - Other race alone (%)
Races - Other race alone (% change since 2000)
Racial diversity
Unemployment (%)
Unemployment (% change since 2000)
Unemployment (%) - White
Unemployment (%) - Black or African American
Unemployment (%) - Asian
Unemployment (%) - Hispanic or Latino
Unemployment (%) - American Indian and Alaska Native
Unemployment (%) - Multirace
Unemployment (%) - Other Race
Population density (people per square mile)
Population - Males (%)
Population - Females (%)
Population - Males (%) - White
Population - Males (%) - Black or African American
Population - Males (%) - Asian
Population - Males (%) - Hispanic or Latino
Population - Males (%) - American Indian and Alaska Native
Population - Males (%) - Multirace
Population - Males (%) - Other Race
Population - Females (%) - White
Population - Females (%) - Black or African American
Population - Females (%) - Asian
Population - Females (%) - Hispanic or Latino
Population - Females (%) - American Indian and Alaska Native
Population - Females (%) - Multirace
Population - Females (%) - Other Race
Coronavirus confirmed cases (Apr 27, 2024)
Deaths caused by coronavirus (Apr 27, 2024)
Coronavirus confirmed cases (per 100k population) (Apr 27, 2024)
Deaths caused by coronavirus (per 100k population) (Apr 27, 2024)
Daily increase in number of cases (Apr 27, 2024)
Weekly increase in number of cases (Apr 27, 2024)
Cases doubled (in days) (Apr 27, 2024)
Hospitalized patients (Apr 18, 2022)
Negative test results (Apr 18, 2022)
Total test results (Apr 18, 2022)
COVID Vaccine doses distributed (per 100k population) (Sep 19, 2023)
COVID Vaccine doses administered (per 100k population) (Sep 19, 2023)
COVID Vaccine doses distributed (Sep 19, 2023)
COVID Vaccine doses administered (Sep 19, 2023)
Likely homosexual households (%)
Likely homosexual households (% change since 2000)
Likely homosexual households - Lesbian couples (%)
Likely homosexual households - Lesbian couples (% change since 2000)
Likely homosexual households - Gay men (%)
Likely homosexual households - Gay men (% change since 2000)
Cost of living index
Median gross rent ($)
Median contract rent ($)
Median monthly housing costs ($)
Median house or condo value ($)
Median house or condo value ($ change since 2000)
Mean house or condo value by units in structure - 1, detached ($)
Mean house or condo value by units in structure - 1, attached ($)
Mean house or condo value by units in structure - 2 ($)
Mean house or condo value by units in structure by units in structure - 3 or 4 ($)
Mean house or condo value by units in structure - 5 or more ($)
Mean house or condo value by units in structure - Boat, RV, van, etc. ($)
Mean house or condo value by units in structure - Mobile home ($)
Median house or condo value ($) - White
Median house or condo value ($) - Black or African American
Median house or condo value ($) - Asian
Median house or condo value ($) - Hispanic or Latino
Median house or condo value ($) - American Indian and Alaska Native
Median house or condo value ($) - Multirace
Median house or condo value ($) - Other Race
Median resident age
Resident age diversity
Median resident age - Males
Median resident age - Females
Median resident age - White
Median resident age - Black or African American
Median resident age - Asian
Median resident age - Hispanic or Latino
Median resident age - American Indian and Alaska Native
Median resident age - Multirace
Median resident age - Other Race
Median resident age - Males - White
Median resident age - Males - Black or African American
Median resident age - Males - Asian
Median resident age - Males - Hispanic or Latino
Median resident age - Males - American Indian and Alaska Native
Median resident age - Males - Multirace
Median resident age - Males - Other Race
Median resident age - Females - White
Median resident age - Females - Black or African American
Median resident age - Females - Asian
Median resident age - Females - Hispanic or Latino
Median resident age - Females - American Indian and Alaska Native
Median resident age - Females - Multirace
Median resident age - Females - Other Race
Commute - mean travel time to work (minutes)
Travel time to work - Less than 5 minutes (%)
Travel time to work - Less than 5 minutes (% change since 2000)
Travel time to work - 5 to 9 minutes (%)
Travel time to work - 5 to 9 minutes (% change since 2000)
Travel time to work - 10 to 19 minutes (%)
Travel time to work - 10 to 19 minutes (% change since 2000)
Travel time to work - 20 to 29 minutes (%)
Travel time to work - 20 to 29 minutes (% change since 2000)
Travel time to work - 30 to 39 minutes (%)
Travel time to work - 30 to 39 minutes (% change since 2000)
Travel time to work - 40 to 59 minutes (%)
Travel time to work - 40 to 59 minutes (% change since 2000)
Travel time to work - 60 to 89 minutes (%)
Travel time to work - 60 to 89 minutes (% change since 2000)
Travel time to work - 90 or more minutes (%)
Travel time to work - 90 or more minutes (% change since 2000)
Marital status - Never married (%)
Marital status - Now married (%)
Marital status - Separated (%)
Marital status - Widowed (%)
Marital status - Divorced (%)
Median family income ($)
Median family income (% change since 2000)
Median non-family income ($)
Median non-family income (% change since 2000)
Median per capita income ($)
Median per capita income (% change since 2000)
Median family income ($) - White
Median family income ($) - Black or African American
Median family income ($) - Asian
Median family income ($) - Hispanic or Latino
Median family income ($) - American Indian and Alaska Native
Median family income ($) - Multirace
Median family income ($) - Other Race
Median year house/condo built
Median year apartment built
Year house built - Built 2005 or later (%)
Year house built - Built 2000 to 2004 (%)
Year house built - Built 1990 to 1999 (%)
Year house built - Built 1980 to 1989 (%)
Year house built - Built 1970 to 1979 (%)
Year house built - Built 1960 to 1969 (%)
Year house built - Built 1950 to 1959 (%)
Year house built - Built 1940 to 1949 (%)
Year house built - Built 1939 or earlier (%)
Average household size
Household density (households per square mile)
Average household size - White
Average household size - Black or African American
Average household size - Asian
Average household size - Hispanic or Latino
Average household size - American Indian and Alaska Native
Average household size - Multirace
Average household size - Other Race
Occupied housing units (%)
Vacant housing units (%)
Owner occupied housing units (%)
Renter occupied housing units (%)
Vacancy status - For rent (%)
Vacancy status - For sale only (%)
Vacancy status - Rented or sold, not occupied (%)
Vacancy status - For seasonal, recreational, or occasional use (%)
Vacancy status - For migrant workers (%)
Vacancy status - Other vacant (%)
Residents with income below the poverty level (%)
Residents with income below 50% of the poverty level (%)
Children below poverty level (%)
Poor families by family type - Married-couple family (%)
Poor families by family type - Male, no wife present (%)
Poor families by family type - Female, no husband present (%)
Poverty status for native-born residents (%)
Poverty status for foreign-born residents (%)
Poverty among high school graduates not in families (%)
Poverty among people who did not graduate high school not in families (%)
Residents with income below the poverty level (%) - White
Residents with income below the poverty level (%) - Black or African American
Residents with income below the poverty level (%) - Asian
Residents with income below the poverty level (%) - Hispanic or Latino
Residents with income below the poverty level (%) - American Indian and Alaska Native
Residents with income below the poverty level (%) - Multirace
Residents with income below the poverty level (%) - Other Race
Air pollution - Air Quality Index (AQI)
Air pollution - CO
Air pollution - NO2
Air pollution - SO2
Air pollution - Ozone
Air pollution - PM10
Air pollution - PM25
Air pollution - Pb
Crime - Murders per 100,000 population
Crime - Rapes per 100,000 population
Crime - Robberies per 100,000 population
Crime - Assaults per 100,000 population
Crime - Burglaries per 100,000 population
Crime - Thefts per 100,000 population
Crime - Auto thefts per 100,000 population
Crime - Arson per 100,000 population
Crime - City-data.com crime index
Crime - Violent crime index
Crime - Property crime index
Crime - Murders per 100,000 population (5 year average)
Crime - Rapes per 100,000 population (5 year average)
Crime - Robberies per 100,000 population (5 year average)
Crime - Assaults per 100,000 population (5 year average)
Crime - Burglaries per 100,000 population (5 year average)
Crime - Thefts per 100,000 population (5 year average)
Crime - Auto thefts per 100,000 population (5 year average)
Crime - Arson per 100,000 population (5 year average)
Crime - City-data.com crime index (5 year average)
Crime - Violent crime index (5 year average)
Crime - Property crime index (5 year average)
1996 Presidential Elections Results (%) - Democratic Party (Clinton)
1996 Presidential Elections Results (%) - Republican Party (Dole)
1996 Presidential Elections Results (%) - Other
2000 Presidential Elections Results (%) - Democratic Party (Gore)
2000 Presidential Elections Results (%) - Republican Party (Bush)
2000 Presidential Elections Results (%) - Other
2004 Presidential Elections Results (%) - Democratic Party (Kerry)
2004 Presidential Elections Results (%) - Republican Party (Bush)
2004 Presidential Elections Results (%) - Other
2008 Presidential Elections Results (%) - Democratic Party (Obama)
2008 Presidential Elections Results (%) - Republican Party (McCain)
2008 Presidential Elections Results (%) - Other
2012 Presidential Elections Results (%) - Democratic Party (Obama)
2012 Presidential Elections Results (%) - Republican Party (Romney)
2012 Presidential Elections Results (%) - Other
2016 Presidential Elections Results (%) - Democratic Party (Clinton)
2016 Presidential Elections Results (%) - Republican Party (Trump)
2016 Presidential Elections Results (%) - Other
2020 Presidential Elections Results (%) - Democratic Party (Biden)
2020 Presidential Elections Results (%) - Republican Party (Trump)
2020 Presidential Elections Results (%) - Other
Ancestries Reported - Arab (%)
Ancestries Reported - Czech (%)
Ancestries Reported - Danish (%)
Ancestries Reported - Dutch (%)
Ancestries Reported - English (%)
Ancestries Reported - French (%)
Ancestries Reported - French Canadian (%)
Ancestries Reported - German (%)
Ancestries Reported - Greek (%)
Ancestries Reported - Hungarian (%)
Ancestries Reported - Irish (%)
Ancestries Reported - Italian (%)
Ancestries Reported - Lithuanian (%)
Ancestries Reported - Norwegian (%)
Ancestries Reported - Polish (%)
Ancestries Reported - Portuguese (%)
Ancestries Reported - Russian (%)
Ancestries Reported - Scotch-Irish (%)
Ancestries Reported - Scottish (%)
Ancestries Reported - Slovak (%)
Ancestries Reported - Subsaharan African (%)
Ancestries Reported - Swedish (%)
Ancestries Reported - Swiss (%)
Ancestries Reported - Ukrainian (%)
Ancestries Reported - United States (%)
Ancestries Reported - Welsh (%)
Ancestries Reported - West Indian (%)
Ancestries Reported - Other (%)
Educational Attainment - No schooling completed (%)
Educational Attainment - Less than high school (%)
Educational Attainment - High school or equivalent (%)
Educational Attainment - Less than 1 year of college (%)
Educational Attainment - 1 or more years of college (%)
Educational Attainment - Associate degree (%)
Educational Attainment - Bachelor's degree (%)
Educational Attainment - Master's degree (%)
Educational Attainment - Professional school degree (%)
Educational Attainment - Doctorate degree (%)
School Enrollment - Nursery, preschool (%)
School Enrollment - Kindergarten (%)
School Enrollment - Grade 1 to 4 (%)
School Enrollment - Grade 5 to 8 (%)
School Enrollment - Grade 9 to 12 (%)
School Enrollment - College undergrad (%)
School Enrollment - Graduate or professional (%)
School Enrollment - Not enrolled in school (%)
School enrollment - Public schools (%)
School enrollment - Private schools (%)
School enrollment - Not enrolled (%)
Median number of rooms in houses and condos
Median number of rooms in apartments
Housing units lacking complete plumbing facilities (%)
Housing units lacking complete kitchen facilities (%)
Density of houses
Urban houses (%)
Rural houses (%)
Households with people 60 years and over (%)
Households with people 65 years and over (%)
Households with people 75 years and over (%)
Households with one or more nonrelatives (%)
Households with no nonrelatives (%)
Population in households (%)
Family households (%)
Nonfamily households (%)
Population in families (%)
Family households with own children (%)
Median number of bedrooms in owner occupied houses
Mean number of bedrooms in owner occupied houses
Median number of bedrooms in renter occupied houses
Mean number of bedrooms in renter occupied houses
Median number of vehichles in owner occupied houses
Mean number of vehichles in owner occupied houses
Median number of vehichles in renter occupied houses
Mean number of vehichles in renter occupied houses
Mortgage status - with mortgage (%)
Mortgage status - with second mortgage (%)
Mortgage status - with home equity loan (%)
Mortgage status - with both second mortgage and home equity loan (%)
Mortgage status - without a mortgage (%)
Average family size
Average family size - White
Average family size - Black or African American
Average family size - Asian
Average family size - Hispanic or Latino
Average family size - American Indian and Alaska Native
Average family size - Multirace
Average family size - Other Race
Geographical mobility - Same house 1 year ago (%)
Geographical mobility - Moved within same county (%)
Geographical mobility - Moved from different county within same state (%)
Geographical mobility - Moved from different state (%)
Geographical mobility - Moved from abroad (%)
Place of birth - Born in state of residence (%)
Place of birth - Born in other state (%)
Place of birth - Native, outside of US (%)
Place of birth - Foreign born (%)
Housing units in structures - 1, detached (%)
Housing units in structures - 1, attached (%)
Housing units in structures - 2 (%)
Housing units in structures - 3 or 4 (%)
Housing units in structures - 5 to 9 (%)
Housing units in structures - 10 to 19 (%)
Housing units in structures - 20 to 49 (%)
Housing units in structures - 50 or more (%)
Housing units in structures - Mobile home (%)
Housing units in structures - Boat, RV, van, etc. (%)
House/condo owner moved in on average (years ago)
Renter moved in on average (years ago)
Year householder moved into unit - Moved in 1999 to March 2000 (%)
Year householder moved into unit - Moved in 1995 to 1998 (%)
Year householder moved into unit - Moved in 1990 to 1994 (%)
Year householder moved into unit - Moved in 1980 to 1989 (%)
Year householder moved into unit - Moved in 1970 to 1979 (%)
Year householder moved into unit - Moved in 1969 or earlier (%)
Means of transportation to work - Drove car alone (%)
Means of transportation to work - Carpooled (%)
Means of transportation to work - Public transportation (%)
Means of transportation to work - Bus or trolley bus (%)
Means of transportation to work - Streetcar or trolley car (%)
Means of transportation to work - Subway or elevated (%)
Means of transportation to work - Railroad (%)
Means of transportation to work - Ferryboat (%)
Means of transportation to work - Taxicab (%)
Means of transportation to work - Motorcycle (%)
Means of transportation to work - Bicycle (%)
Means of transportation to work - Walked (%)
Means of transportation to work - Other means (%)
Working at home (%)
Industry diversity
Most Common Industries - Agriculture, forestry, fishing and hunting, and mining (%)
Most Common Industries - Agriculture, forestry, fishing and hunting (%)
Most Common Industries - Mining, quarrying, and oil and gas extraction (%)
Most Common Industries - Construction (%)
Most Common Industries - Manufacturing (%)
Most Common Industries - Wholesale trade (%)
Most Common Industries - Retail trade (%)
Most Common Industries - Transportation and warehousing, and utilities (%)
Most Common Industries - Transportation and warehousing (%)
Most Common Industries - Utilities (%)
Most Common Industries - Information (%)
Most Common Industries - Finance and insurance, and real estate and rental and leasing (%)
Most Common Industries - Finance and insurance (%)
Most Common Industries - Real estate and rental and leasing (%)
Most Common Industries - Professional, scientific, and management, and administrative and waste management services (%)
Most Common Industries - Professional, scientific, and technical services (%)
Most Common Industries - Management of companies and enterprises (%)
Most Common Industries - Administrative and support and waste management services (%)
Most Common Industries - Educational services, and health care and social assistance (%)
Most Common Industries - Educational services (%)
Most Common Industries - Health care and social assistance (%)
Most Common Industries - Arts, entertainment, and recreation, and accommodation and food services (%)
Most Common Industries - Arts, entertainment, and recreation (%)
Most Common Industries - Accommodation and food services (%)
Most Common Industries - Other services, except public administration (%)
Most Common Industries - Public administration (%)
Occupation diversity
Most Common Occupations - Management, business, science, and arts occupations (%)
Most Common Occupations - Management, business, and financial occupations (%)
Most Common Occupations - Management occupations (%)
Most Common Occupations - Business and financial operations occupations (%)
Most Common Occupations - Computer, engineering, and science occupations (%)
Most Common Occupations - Computer and mathematical occupations (%)
Most Common Occupations - Architecture and engineering occupations (%)
Most Common Occupations - Life, physical, and social science occupations (%)
Most Common Occupations - Education, legal, community service, arts, and media occupations (%)
Most Common Occupations - Community and social service occupations (%)
Most Common Occupations - Legal occupations (%)
Most Common Occupations - Education, training, and library occupations (%)
Most Common Occupations - Arts, design, entertainment, sports, and media occupations (%)
Most Common Occupations - Healthcare practitioners and technical occupations (%)
Most Common Occupations - Health diagnosing and treating practitioners and other technical occupations (%)
Most Common Occupations - Health technologists and technicians (%)
Most Common Occupations - Service occupations (%)
Most Common Occupations - Healthcare support occupations (%)
Most Common Occupations - Protective service occupations (%)
Most Common Occupations - Fire fighting and prevention, and other protective service workers including supervisors (%)
Most Common Occupations - Law enforcement workers including supervisors (%)
Most Common Occupations - Food preparation and serving related occupations (%)
Most Common Occupations - Building and grounds cleaning and maintenance occupations (%)
Most Common Occupations - Personal care and service occupations (%)
Most Common Occupations - Sales and office occupations (%)
Most Common Occupations - Sales and related occupations (%)
Most Common Occupations - Office and administrative support occupations (%)
Most Common Occupations - Natural resources, construction, and maintenance occupations (%)
Most Common Occupations - Farming, fishing, and forestry occupations (%)
Most Common Occupations - Construction and extraction occupations (%)
Most Common Occupations - Installation, maintenance, and repair occupations (%)
Most Common Occupations - Production, transportation, and material moving occupations (%)
Most Common Occupations - Production occupations (%)
Most Common Occupations - Transportation occupations (%)
Most Common Occupations - Material moving occupations (%)
People in Group quarters - Institutionalized population (%)
People in Group quarters - Correctional institutions (%)
People in Group quarters - Federal prisons and detention centers (%)
People in Group quarters - Halfway houses (%)
People in Group quarters - Local jails and other confinement facilities (including police lockups) (%)
People in Group quarters - Military disciplinary barracks (%)
People in Group quarters - State prisons (%)
People in Group quarters - Other types of correctional institutions (%)
People in Group quarters - Nursing homes (%)
People in Group quarters - Hospitals/wards, hospices, and schools for the handicapped (%)
People in Group quarters - Hospitals/wards and hospices for chronically ill (%)
People in Group quarters - Hospices or homes for chronically ill (%)
People in Group quarters - Military hospitals or wards for chronically ill (%)
People in Group quarters - Other hospitals or wards for chronically ill (%)
People in Group quarters - Hospitals or wards for drug/alcohol abuse (%)
People in Group quarters - Mental (Psychiatric) hospitals or wards (%)
People in Group quarters - Schools, hospitals, or wards for the mentally retarded (%)
People in Group quarters - Schools, hospitals, or wards for the physically handicapped (%)
People in Group quarters - Institutions for the deaf (%)
People in Group quarters - Institutions for the blind (%)
People in Group quarters - Orthopedic wards and institutions for the physically handicapped (%)
People in Group quarters - Wards in general hospitals for patients who have no usual home elsewhere (%)
People in Group quarters - Wards in military hospitals for patients who have no usual home elsewhere (%)
People in Group quarters - Juvenile institutions (%)
People in Group quarters - Long-term care (%)
People in Group quarters - Homes for abused, dependent, and neglected children (%)
People in Group quarters - Residential treatment centers for emotionally disturbed children (%)
People in Group quarters - Training schools for juvenile delinquents (%)
People in Group quarters - Short-term care, detention or diagnostic centers for delinquent children (%)
People in Group quarters - Type of juvenile institution unknown (%)
People in Group quarters - Noninstitutionalized population (%)
People in Group quarters - College dormitories (includes college quarters off campus) (%)
People in Group quarters - Military quarters (%)
People in Group quarters - On base (%)
People in Group quarters - Barracks, unaccompanied personnel housing (UPH), (Enlisted/Officer), ;and similar group living quarters for military personnel (%)
People in Group quarters - Transient quarters for temporary residents (%)
People in Group quarters - Military ships (%)
People in Group quarters - Group homes (%)
People in Group quarters - Homes or halfway houses for drug/alcohol abuse (%)
People in Group quarters - Homes for the mentally ill (%)
People in Group quarters - Homes for the mentally retarded (%)
People in Group quarters - Homes for the physically handicapped (%)
People in Group quarters - Other group homes (%)
People in Group quarters - Religious group quarters (%)
People in Group quarters - Dormitories (%)
People in Group quarters - Agriculture workers' dormitories on farms (%)
People in Group quarters - Job Corps and vocational training facilities (%)
People in Group quarters - Other workers' dormitories (%)
People in Group quarters - Crews of maritime vessels (%)
People in Group quarters - Other nonhousehold living situations (%)
People in Group quarters - Other noninstitutional group quarters (%)
Residents speaking English at home (%)
Residents speaking English at home - Born in the United States (%)
Residents speaking English at home - Native, born elsewhere (%)
Residents speaking English at home - Foreign born (%)
Residents speaking Spanish at home (%)
Residents speaking Spanish at home - Born in the United States (%)
Residents speaking Spanish at home - Native, born elsewhere (%)
Residents speaking Spanish at home - Foreign born (%)
Residents speaking other language at home (%)
Residents speaking other language at home - Born in the United States (%)
Residents speaking other language at home - Native, born elsewhere (%)
Residents speaking other language at home - Foreign born (%)
Class of Workers - Employee of private company (%)
Class of Workers - Self-employed in own incorporated business (%)
Class of Workers - Private not-for-profit wage and salary workers (%)
Class of Workers - Local government workers (%)
Class of Workers - State government workers (%)
Class of Workers - Federal government workers (%)
Class of Workers - Self-employed workers in own not incorporated business and Unpaid family workers (%)
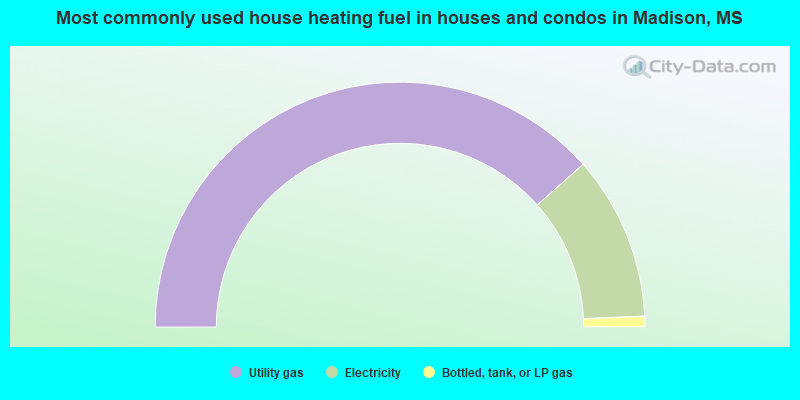
House heating fuel used in houses and condos - Utility gas (%)
House heating fuel used in houses and condos - Bottled, tank, or LP gas (%)
House heating fuel used in houses and condos - Electricity (%)
House heating fuel used in houses and condos - Fuel oil, kerosene, etc. (%)
House heating fuel used in houses and condos - Coal or coke (%)
House heating fuel used in houses and condos - Wood (%)
House heating fuel used in houses and condos - Solar energy (%)
House heating fuel used in houses and condos - Other fuel (%)
House heating fuel used in houses and condos - No fuel used (%)
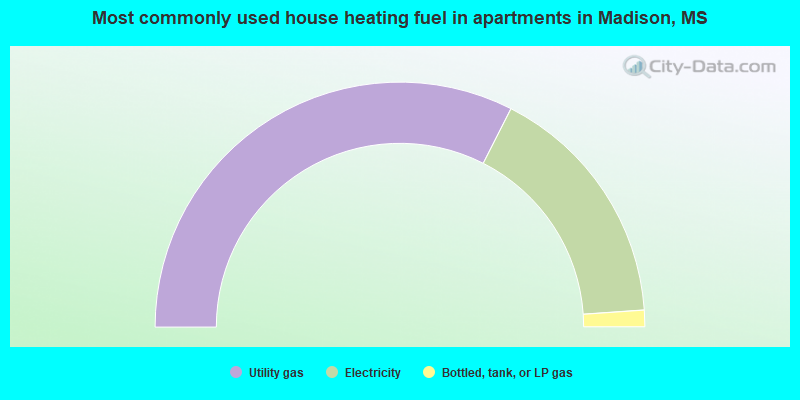
House heating fuel used in apartments - Utility gas (%)
House heating fuel used in apartments - Bottled, tank, or LP gas (%)
House heating fuel used in apartments - Electricity (%)
House heating fuel used in apartments - Fuel oil, kerosene, etc. (%)
House heating fuel used in apartments - Coal or coke (%)
House heating fuel used in apartments - Wood (%)
House heating fuel used in apartments - Solar energy (%)
House heating fuel used in apartments - Other fuel (%)
House heating fuel used in apartments - No fuel used (%)
Armed forces status - In Armed Forces (%)
Armed forces status - Civilian (%)
Armed forces status - Civilian - Veteran (%)
Armed forces status - Civilian - Nonveteran (%)
Fatal accidents locations in years 2005-2021
Fatal accidents locations in 2005
Fatal accidents locations in 2006
Fatal accidents locations in 2007
Fatal accidents locations in 2008
Fatal accidents locations in 2009
Fatal accidents locations in 2010
Fatal accidents locations in 2011
Fatal accidents locations in 2012
Fatal accidents locations in 2013
Fatal accidents locations in 2014
Fatal accidents locations in 2015
Fatal accidents locations in 2016
Fatal accidents locations in 2017
Fatal accidents locations in 2018
Fatal accidents locations in 2019
Fatal accidents locations in 2020
Fatal accidents locations in 2021
Alcohol use - People drinking some alcohol every month (%)
Alcohol use - People not drinking at all (%)
Alcohol use - Average days/month drinking alcohol
Alcohol use - Average drinks/week
Alcohol use - Average days/year people drink much
Audiometry - Average condition of hearing (%)
Audiometry - People that can hear a whisper from across a quiet room (%)
Audiometry - People that can hear normal voice from across a quiet room (%)
Audiometry - Ears ringing, roaring, buzzing (%)
Audiometry - Had a job exposure to loud noise (%)
Audiometry - Had off-work exposure to loud noise (%)
Blood Pressure & Cholesterol - Has high blood pressure (%)
Blood Pressure & Cholesterol - Checking blood pressure at home (%)
Blood Pressure & Cholesterol - Frequently checking blood cholesterol (%)
Blood Pressure & Cholesterol - Has high cholesterol level (%)
Consumer Behavior - Money monthly spent on food at supermarket/grocery store
Consumer Behavior - Money monthly spent on food at other stores
Consumer Behavior - Money monthly spent on eating out
Consumer Behavior - Money monthly spent on carryout/delivered foods
Consumer Behavior - Income spent on food at supermarket/grocery store (%)
Consumer Behavior - Income spent on food at other stores (%)
Consumer Behavior - Income spent on eating out (%)
Consumer Behavior - Income spent on carryout/delivered foods (%)
Current Health Status - General health condition (%)
Current Health Status - Blood donors (%)
Current Health Status - Has blood ever tested for HIV virus (%)
Current Health Status - Left-handed people (%)
Dermatology - People using sunscreen (%)
Diabetes - Diabetics (%)
Diabetes - Had a blood test for high blood sugar (%)
Diabetes - People taking insulin (%)
Diet Behavior & Nutrition - Diet health (%)
Diet Behavior & Nutrition - Milk product consumption (# of products/month)
Diet Behavior & Nutrition - Meals not home prepared (#/week)
Diet Behavior & Nutrition - Meals from fast food or pizza place (#/week)
Diet Behavior & Nutrition - Ready-to-eat foods (#/month)
Diet Behavior & Nutrition - Frozen meals/pizza (#/month)
Drug Use - People that ever used marijuana or hashish (%)
Drug Use - Ever used hard drugs (%)
Drug Use - Ever used any form of cocaine (%)
Drug Use - Ever used heroin (%)
Drug Use - Ever used methamphetamine (%)
Health Insurance - People covered by health insurance (%)
Kidney Conditions-Urology - Avg. # of times urinating at night
Medical Conditions - People with asthma (%)
Medical Conditions - People with anemia (%)
Medical Conditions - People with psoriasis (%)
Medical Conditions - People with overweight (%)
Medical Conditions - Elderly people having difficulties in thinking or remembering (%)
Medical Conditions - People who ever received blood transfusion (%)
Medical Conditions - People having trouble seeing even with glass/contacts (%)
Medical Conditions - People with arthritis (%)
Medical Conditions - People with gout (%)
Medical Conditions - People with congestive heart failure (%)
Medical Conditions - People with coronary heart disease (%)
Medical Conditions - People with angina pectoris (%)
Medical Conditions - People who ever had heart attack (%)
Medical Conditions - People who ever had stroke (%)
Medical Conditions - People with emphysema (%)
Medical Conditions - People with thyroid problem (%)
Medical Conditions - People with chronic bronchitis (%)
Medical Conditions - People with any liver condition (%)
Medical Conditions - People who ever had cancer or malignancy (%)
Mental Health - People who have little interest in doing things (%)
Mental Health - People feeling down, depressed, or hopeless (%)
Mental Health - People who have trouble sleeping or sleeping too much (%)
Mental Health - People feeling tired or having little energy (%)
Mental Health - People with poor appetite or overeating (%)
Mental Health - People feeling bad about themself (%)
Mental Health - People who have trouble concentrating on things (%)
Mental Health - People moving or speaking slowly or too fast (%)
Mental Health - People having thoughts they would be better off dead (%)
Oral Health - Average years since last visit a dentist
Oral Health - People embarrassed because of mouth (%)
Oral Health - People with gum disease (%)
Oral Health - General health of teeth and gums (%)
Oral Health - Average days a week using dental floss/device
Oral Health - Average days a week using mouthwash for dental problem
Oral Health - Average number of teeth
Pesticide Use - Households using pesticides to control insects (%)
Pesticide Use - Households using pesticides to kill weeds (%)
Physical Activity - People doing vigorous-intensity work activities (%)
Physical Activity - People doing moderate-intensity work activities (%)
Physical Activity - People walking or bicycling (%)
Physical Activity - People doing vigorous-intensity recreational activities (%)
Physical Activity - People doing moderate-intensity recreational activities (%)
Physical Activity - Average hours a day doing sedentary activities
Physical Activity - Average hours a day watching TV or videos
Physical Activity - Average hours a day using computer
Physical Functioning - People having limitations keeping them from working (%)
Physical Functioning - People limited in amount of work they can do (%)
Physical Functioning - People that need special equipment to walk (%)
Physical Functioning - People experiencing confusion/memory problems (%)
Physical Functioning - People requiring special healthcare equipment (%)
Prescription Medications - Average number of prescription medicines taking
Preventive Aspirin Use - Adults 40+ taking low-dose aspirin (%)
Reproductive Health - Vaginal deliveries (%)
Reproductive Health - Cesarean deliveries (%)
Reproductive Health - Deliveries resulted in a live birth (%)
Reproductive Health - Pregnancies resulted in a delivery (%)
Reproductive Health - Women breastfeeding newborns (%)
Reproductive Health - Women that had a hysterectomy (%)
Reproductive Health - Women that had both ovaries removed (%)
Reproductive Health - Women that have ever taken birth control pills (%)
Reproductive Health - Women taking birth control pills (%)
Reproductive Health - Women that have ever used Depo-Provera or injectables (%)
Reproductive Health - Women that have ever used female hormones (%)
Sexual Behavior - People 18+ that ever had sex (vaginal, anal, or oral) (%)
Sexual Behavior - Males 18+ that ever had vaginal sex with a woman (%)
Sexual Behavior - Males 18+ that ever performed oral sex on a woman (%)
Sexual Behavior - Males 18+ that ever had anal sex with a woman (%)
Sexual Behavior - Males 18+ that ever had any sex with a man (%)
Sexual Behavior - Females 18+ that ever had vaginal sex with a man (%)
Sexual Behavior - Females 18+ that ever performed oral sex on a man (%)
Sexual Behavior - Females 18+ that ever had anal sex with a man (%)
Sexual Behavior - Females 18+ that ever had any kind of sex with a woman (%)
Sexual Behavior - Average age people first had sex
Sexual Behavior - Average number of female sex partners in lifetime (males 18+)
Sexual Behavior - Average number of female vaginal sex partners in lifetime (males 18+)
Sexual Behavior - Average age people first performed oral sex on a woman (18+)
Sexual Behavior - Average number of woman performed oral sex on in lifetime (18+)
Sexual Behavior - Average number of male sex partners in lifetime (males 18+)
Sexual Behavior - Average number of male anal sex partners in lifetime (males 18+)
Sexual Behavior - Average age people first performed oral sex on a man (18+)
Sexual Behavior - Average number of male oral sex partners in lifetime (18+)
Sexual Behavior - People using protection when performing oral sex (%)
Sexual Behavior - Average number of times people have vaginal or anal sex a year
Sexual Behavior - People having sex without condom (%)
Sexual Behavior - Average number of male sex partners in lifetime (females 18+)
Sexual Behavior - Average number of male vaginal sex partners in lifetime (females 18+)
Sexual Behavior - Average number of female sex partners in lifetime (females 18+)
Sexual Behavior - Circumcised males 18+ (%)
Sleep Disorders - Average hours sleeping at night
Sleep Disorders - People that has trouble sleeping (%)
Smoking-Cigarette Use - People smoking cigarettes (%)
Taste & Smell - People 40+ having problems with smell (%)
Taste & Smell - People 40+ having problems with taste (%)
Taste & Smell - People 40+ that ever had wisdom teeth removed (%)
Taste & Smell - People 40+ that ever had tonsils teeth removed (%)
Taste & Smell - People 40+ that ever had a loss of consciousness because of a head injury (%)
Taste & Smell - People 40+ that ever had a broken nose or other serious injury to face or skull (%)
Taste & Smell - People 40+ that ever had two or more sinus infections (%)
Weight - Average height (inches)
Weight - Average weight (pounds)
Weight - Average BMI
Weight - People that are obese (%)
Weight - People that ever were obese (%)
Weight - People trying to lose weight (%)
According to our research of Mississippi and other state lists, there were 17 registered sex offenders living in Madison, Mississippi as of April 27, 2024 . The ratio of all residents to sex offenders in Madison is 1,498 to 1.The ratio of registered sex offenders to all residents in this city is much lower than the state average.
Officers per 1,000 residents here:
2.44Mississippi average:
2.18
Latest news from Madison, MS collected exclusively by city-data.com from local newspapers, TV, and radio stations
Ancestries: English (15.9%), European (14.0%), American (11.6%), Irish (7.9%), Scotch-Irish (2.6%), German (2.1%).
Current Local Time:
Land area: 13.5 square miles.
Population density: 2,061 people per square mile (low).
1,815 residents are foreign born (4.6% Asia , 0.7% Europe , 0.7% Latin America ).
This city:
6.5%Mississippi:
2.3%
Median real estate property taxes paid for housing units with mortgages in 2022: $2,763 (0.8%)Median real estate property taxes paid for housing units with no mortgage in 2022: $2,111 (0.8%)
Nearest city with pop. 50,000+: Jackson, MS
Nearest city with pop. 200,000+: Baton Rouge, LA
Nearest city with pop. 1,000,000+: Houston, TX
Nearest cities:
Latitude: 32.46 N, Longitude: 90.11 W
Daytime population change due to commuting: +626 (+2.2%)Workers who live and work in this city: 5,055 (37.4%)
Single-family new house construction building permits:
2022: 92 buildings , average cost: $512,3002021: 81 buildings , average cost: $497,7002020: 79 buildings , average cost: $445,8002019: 100 buildings , average cost: $414,2002018: 75 buildings , average cost: $402,6002017: 93 buildings , average cost: $367,4002016: 112 buildings , average cost: $341,8002015: 104 buildings , average cost: $348,4002014: 135 buildings , average cost: $319,8002013: 186 buildings , average cost: $337,3002012: 123 buildings , average cost: $327,8002011: 82 buildings , average cost: $345,2002010: 118 buildings , average cost: $299,2002009: 122 buildings , average cost: $285,1002008: 94 buildings , average cost: $289,2002007: 127 buildings , average cost: $249,2002006: 186 buildings , average cost: $260,2002005: 170 buildings , average cost: $205,6002004: 294 buildings , average cost: $214,5002003: 276 buildings , average cost: $173,9002002: 246 buildings , average cost: $165,4002001: 181 buildings , average cost: $152,7002000: 110 buildings , average cost: $158,7001999: 139 buildings , average cost: $135,8001998: 156 buildings , average cost: $126,7001997: 138 buildings , average cost: $112,100Unemployment in December 2023: Here:
1.6%Mississippi:
2.6%
Most common industries in Madison, MS (%)
Both Males Females
Finance & insurance (11.2%)
Professional, scientific, technical services (11.0%)
Health care (10.7%)
Educational services (8.9%)
Public administration (6.8%)
Construction (4.9%)
Accommodation & food services (3.7%)
Professional, scientific, technical services (11.1%)
Finance & insurance (10.3%)
Construction (8.1%)
Public administration (7.8%)
Health care (5.0%)
Accommodation & food services (4.6%)
Educational services (4.3%)
Health care (17.0%)
Educational services (13.9%)
Finance & insurance (12.2%)
Professional, scientific, technical services (10.8%)
Public administration (5.7%)
Broadcasting & telecommunications (4.1%)
Religious, grantmaking, civic, professional, similar organizations (3.9%)
Most common occupations in Madison, MS (%)
Both Males Females
Other management occupations, except farmers and farm managers (7.1%)
Sales representatives, services, wholesale and manufacturing (6.5%)
Retail sales workers, except cashiers (4.6%)
Top executives (4.3%)
Secretaries and administrative assistants (4.2%)
Other sales and related occupations, including supervisors (4.1%)
Registered nurses (4.1%)
Sales representatives, services, wholesale and manufacturing (9.3%)
Other management occupations, except farmers and farm managers (8.7%)
Top executives (6.7%)
Other sales and related occupations, including supervisors (6.0%)
Electrical equipment mechanics and other installation, maintenance, and repair workers, including supervisors (4.5%)
Retail sales workers, except cashiers (4.5%)
Lawyers (4.1%)
Secretaries and administrative assistants (8.7%)
Preschool, kindergarten, elementary, and middle school teachers (7.7%)
Registered nurses (7.6%)
Other management occupations, except farmers and farm managers (5.3%)
Accountants and auditors (5.1%)
Other office and administrative support workers, including supervisors (5.0%)
Retail sales workers, except cashiers (4.7%)
Tornado activity:
Madison-area historical tornado activity is slightly above Mississippi state average. It is 164% greater than the overall U.S. average.
On 11/24/2001, a category F4 (max. wind speeds 207-260 mph) tornado 5.7 miles away from the Madison city center killed 2 people and injured 21 people and caused $12 million in damages.
On 3/29/1976, a category F4 tornado 10.7 miles away from the city center killed 3 people and injured 177 people and caused between $5,000,000 and $50,000,000 in damages.
Earthquake activity:
Madison-area historical earthquake activity is significantly above Mississippi state average. It is 207% greater than the overall U.S. average. On 10/24/1997 at 08:35:17, a magnitude 4.9 (4.8 MB, 4.2 MS, 4.9 LG, Depth: 6.2 mi, Class: Light, Intensity: IV - V) earthquake occurred 190.6 miles away from Madison center On 1/18/1999 at 07:00:53, a magnitude 4.8 (4.8 MB, 4.0 LG, Depth: 0.6 mi) earthquake occurred 178.2 miles away from the city center On 3/25/1976 at 00:41:20, a magnitude 5.0 (4.9 MB, 5.0 LG, Class: Moderate, Intensity: VI - VII) earthquake occurred 220.3 miles away from the city center On 6/24/1975 at 11:11:36, a magnitude 4.5 (4.5 MB) earthquake occurred 157.8 miles away from the city center On 11/7/2004 at 11:20:21, a magnitude 4.3 (4.3 MW, Depth: 3.1 mi) earthquake occurred 127.5 miles away from the city center On 1/21/1982 at 00:33:54, a magnitude 4.7 (4.5 MB, 4.7 LG, 4.5 LG) earthquake occurred 223.1 miles away from the city center Magnitude types: regional Lg-wave magnitude (LG), body-wave magnitude (MB), surface-wave magnitude (MS), moment magnitude (MW) Natural disasters: The number of natural disasters in Madison County (17) is near the US average (15).Major Disasters (Presidential) Declared: 14Emergencies Declared: 2Storms: 10, Tornadoes: 10, Floods: 8, Hurricanes: 4, Drought: 1, Freeze: 1, Tropical Storm: 1, Other: 1 (Note: some incidents may be assigned to more than one category). Hospitals and medical centers in Madison: LIFE SOURCES SERVICES, LLC (129 EXECUTIVE DRIVE, SUITE C,) THE NICHOLS CENTER (1308 HIGHWAY 51 NORTH)
Other hospitals and medical centers near Madison: HOSPICE MINISTRIES, INC (Hospital, about 4 miles away; RIDGELAND, MS)
HIGHLAND HOME (Nursing Home, about 5 miles away; RIDGELAND, MS)
PROVIDENCE HOSPICE LLC (Hospital, about 5 miles away; JACKSON, MS)
STA HOME HOSPICE (Hospital, about 6 miles away; JACKSON, MS)
ALPHA HEALTHCARE, LLC (Hospital, about 6 miles away; JACKSON, MS)
DSI JACKSON NORTH (Dialysis Facility, about 7 miles away; JACKSON, MS)
MANHATTAN NURSING AND REHABILITATION CENTER LLC (Nursing Home, about 8 miles away; JACKSON, MS)
Airports located in Madison: Amtrak station near Madison: 12 miles: JACKSON (300 W. CAPITOL ST.) Services: ticket office, partially wheelchair accessible, enclosed waiting area, public restrooms, public payphones, vending machines, paid short-term parking, paid long-term parking, call for taxi service, public transit connection.
College/University in Madison: ITT Technical Institute-Madison Full-time enrollment: 170; Location: 382 Galleria Pkwy Ste 100; Private, for-profit; Website: www.itt-tech.edu)
Colleges/universities with over 2000 students nearest to Madison:
Belhaven University (about 11 miles; Jackson, MS ; Full-time enrollment: 3,147)
Jackson State University (about 13 miles; Jackson, MS ; FT enrollment: 7,485)
Mississippi College (about 16 miles; Clinton, MS ; FT enrollment: 3,919)
Hinds Community College (about 23 miles; Raymond, MS ; FT enrollment: 9,115)
Holmes Community College (about 38 miles; Goodman, MS ; FT enrollment: 5,352)
Copiah-Lincoln Community College (about 56 miles; Wesson, MS ; FT enrollment: 2,532)
East Central Community College (about 59 miles; Decatur, MS ; FT enrollment: 2,380)
Public high schools in Madison:
Private high schools in Madison: MADISON-RIDGELAND ACADEMY Students: 910, Location: 7601 OLD CANTON RD, Grades: PK-12)
ST JOSEPH CATHOLIC SCHOOL Students: 460, Location: 308 NEW MANNSDALE RD, Grades: 7-12)
Public elementary/middle schools in Madison:
Private elementary/middle school in Madison: ST ANTHONY CATHOLIC SCHOOL Students: 281, Location: 1585 OLD MANNSDALE RD, Grades: PK-6)
See full list of schools located in Madison User-submitted facts and corrections:
Madison First Church of God 747 Hwy 51 Madison, MS 39110
Notable locations in Madison: (A) , Montgomery Historic House Museum (B) , Madison Public Library (C) , Madison City Hall (D) , Madison Fire Department Station 2 (E) . Display/hide their locations on the map
Churches in Madison include: (A) , Saint Paul Methodist Church (B) , Saint Frances of Assisi Catholic Church (C) , Pilgrim Rest Baptist Church (D) , Bennett Chapel (E) , Christian Union Church (F) , Montgomery Memorial Methodist Church (G) , First Presbyterian Church (H) , First Baptist Church (I) . Display/hide their locations on the map
Cemeteries: (1) , Natchez Trace Memorial Park Cemetery (2) , Rosa Scott School Cemetery (3) . Display/hide their locations on the map
Reservoirs: (A) , Lake Castle (B) . Display/hide their locations on the map
Hotel: (1) . Display/hide its approximate location on the map
Birthplace of: Chris Spencer - 2005 NFL player (Seattle Seahawks, born : Mar 28, 1982), Chris Spencer (American football) - Football offensive lineman, Neill Berry - College basketball player (SE Louisiana Lions), Sammy Winder - Football player, Sarah Beth James - Beauty pageant winner, Tate Ellington - Actor.
Madison County has a predicted average indoor radon screening level less than 2 pCi/L (pico curies per liter) - Low Potential Drinking water stations with addresses in Madison and their reported violations in the past:
CITY OF MADISON (Population served: 12,498, Groundwater):
Past monitoring violations:
One minor monitoring violation
63 regular monitoring violations
Population served: 50, Groundwater):
Past monitoring violations:
Monitoring and Reporting (DBP) - Between JUL-2012 and SEP-2012, Contaminant: Chlorine. Follow-up actions: St Public Notif requested (SEP-12-2012), St Formal NOV issued (SEP-12-2012), St Public Notif received (SEP-25-2012), St Compliance achieved (DEC-31-2012)
2 routine major monitoring violations
Average household size: This city:
2.8 peopleMississippi:
2.6 people
Percentage of family households: This city:
79.6%Whole state:
69.0%
Percentage of households with unmarried partners: This city:
1.8%Whole state:
5.7%
Likely homosexual households (counted as self-reported same-sex unmarried-partner households)
Lesbian couples: 0.3% of all households Gay men: 0.2% of all households
114 people in nursing facilities/skilled-nursing facilities in 2010people in nursing homes in 2000
Banks with most branches in Madison (2011 data):
Trustmark National Bank: Madison Office, St. Catherine's Branch, Madison Branch, Hwy 463 Branch. Info updated 2012/03/26: Bank assets: $9,612.1 mil, Deposits: $7,410.1 mil, headquarters in Jackson, MS, positive income , Commercial Lending Specialization, 186 total offices , Holding Company: Trustmark Corporation
Community Trust Bank: Gluckstadt Branch, Madison Financial Center, Madison County Mobile Banking Center. Info updated 2011/10/14: Bank assets: $2,472.6 mil, Deposits: $1,908.3 mil, headquarters in Choudrant, LA, positive income , Commercial Lending Specialization, 32 total offices , Holding Company: Community Trust Financial Corporation
Merchants and Farmers Bank: Highland Colony Branch, Madison Admin Branch, Madison Branch. Info updated 2007/01/11: Bank assets: $1,561.3 mil, Deposits: $1,372.4 mil, headquarters in Kosciusko, MS, positive income , Commercial Lending Specialization, 39 total offices , Holding Company: First M & F Corporation
BankPlus: Strawberry Hill Drive Branch, Gluckstadt Branch, Hwy 463 Branch. Info updated 2006/11/03: Bank assets: $2,177.0 mil, Deposits: $1,696.4 mil, headquarters in Belzoni, MS, positive income , Commercial Lending Specialization, 62 total offices , Holding Company: Bancplus Corporation
BancorpSouth Bank: Colony Crossing Branch at 120 Colony Crossing, branch established on 2004/08/25; Madison Branch at 2174 Main Street, branch established on 1996/05/06. Info updated 2007/07/18: Bank assets: $12,990.3 mil, Deposits: $10,863.8 mil, headquarters in Tupelo, MS, positive income , Commercial Lending Specialization, 271 total offices , Holding Company: Bancorpsouth, Inc.
Regions Bank: Madison Station Shop N' Bank Branch at 1050 Highway 51 North, branch established on 1988/11/03; Highland Colony Branch at 109 Webster Circle, branch established on 2004/11/01. Info updated 2011/02/24: Bank assets: $123,368.2 mil, Deposits: $98,301.3 mil, headquarters in Birmingham, AL, positive income , Commercial Lending Specialization, 1778 total offices , Holding Company: Regions Financial Corporation
BankFirst Financial Services: Gluckstadt Branch at 102 Dees Drive, branch established on 2006/06/30; Madison Branch at 1597 Highland Colony Parkway, branch established on 2008/02/19. Info updated 2006/11/03: Bank assets: $718.9 mil, Deposits: $600.2 mil, headquarters in Macon, MS, positive income , Commercial Lending Specialization, 14 total offices , Holding Company: Bankfirst Capital Corporation
Southern Bancorp Bank: Madison Branch at 1888 Main Street Crossing, Suite D, branch established on 2011/04/05. Info updated 2010/06/01: Bank assets: $1,146.8 mil, Deposits: $966.8 mil, headquarters in Arkadelphia, AR, positive income , Commercial Lending Specialization, 40 total offices , Holding Company: Southern Bancorp, Inc
Community Bank of Mississippi: Madison Branch at 998 Highway 51, branch established on 2010/09/01. Info updated 2010/04/06: Bank assets: $639.2 mil, Deposits: $566.3 mil, headquarters in Forest, MS, positive income , Commercial Lending Specialization, 13 total offices , Holding Company: Community Bancshares Of Mississippi, Inc. Employee Stock Ownership Plan
For population 15 years and over in Madison:
Never married: 24.0%Now married: 65.2%Separated: 0.8%Widowed: 4.8%Divorced: 5.2% For population 25 years and over in Madison:
High school or higher: 97.2%Bachelor's degree or higher: 67.7%Graduate or professional degree: 29.4%Unemployed: 1.9%Mean travel time to work (commute): 21.6 minutes
Education Gini index (Inequality in education) Here:
9.5Mississippi average:
11.8
Religion statistics for Madison, MS (based on Madison County data)
Religion Adherents Congregations Evangelical Protestant 28,607 54 Mainline Protestant 8,631 20 Black Protestant 5,650 31 Catholic 5,242 5 Other 1,445 5 Orthodox 135 1 None 45,493 -
Source: Clifford Grammich, Kirk Hadaway, Richard Houseal, Dale E.Jones, Alexei Krindatch, Richie Stanley and Richard H.Taylor. 2012. 2010 U.S.Religion Census: Religious Congregations & Membership Study. Association of Statisticians of American Religious Bodies. Jones, Dale E., et al. 2002. Congregations and Membership in the United States 2000. Nashville, TN: Glenmary Research Center. Graphs represent county-level data
Food Environment Statistics: Number of grocery stores : 12This county :
1.34 / 10,000 pop.State :
2.08 / 10,000 pop.
Number of supercenters and club stores : 1This county :
0.11 / 10,000 pop.Mississippi :
0.24 / 10,000 pop.
Number of convenience stores (no gas) : 4Here :
0.45 / 10,000 pop.Mississippi :
0.80 / 10,000 pop.
Number of convenience stores (with gas) : 47Here :
5.26 / 10,000 pop.Mississippi :
6.36 / 10,000 pop.
Number of full-service restaurants : 65This county :
7.28 / 10,000 pop.Mississippi :
5.03 / 10,000 pop.
Adult diabetes rate : Madison County :
10.4%State :
12.3%
Adult obesity rate : This county :
28.4%Mississippi :
33.1%
Low-income preschool obesity rate : Madison County :
10.2%Mississippi :
14.4%
Health and Nutrition: Healthy diet rate : Madison:
57.8%Mississippi:
48.6%
Average overall health of teeth and gums : This city:
59.1%Mississippi:
45.3%
Average BMI : Madison:
28.0Mississippi:
29.2
People feeling badly about themselves : This city:
18.7%Mississippi:
20.5%
People not drinking alcohol at all : This city:
7.8%State:
11.6%
Average hours sleeping at night : Overweight people : Here:
33.9%Mississippi:
34.8%
General health condition : Here:
64.2%Mississippi:
54.9%
Average condition of hearing : This city:
83.0%State:
79.9%
More about Health and Nutrition of Madison, MS Residents
Local government employment and payroll (March 2022)
Function
Full-time employees
Monthly full-time payroll
Average yearly full-time wage
Part-time employees
Monthly part-time payroll
Police Protection - Officers
66 $344,142 $62,571 1 $1,663 Firefighters
40 $172,710 $51,813 2 $3,255 Police - Other
16 $63,796 $47,847 0 $0 Streets and Highways
11 $47,539 $51,861 0 $0 Other and Unallocable
10 $40,322 $48,386 1 $755 Parks and Recreation
8 $28,350 $42,525 2 $1,225 Sewerage
8 $33,079 $49,619 0 $0 Financial Administration
5 $32,154 $77,170 0 $0 Water Supply
5 $17,280 $41,472 0 $0 Other Government Administration
5 $35,028 $84,067 0 $0 Health
4 $11,548 $34,644 3 $2,569 Fire - Other
2 $9,110 $54,660 0 $0 Judicial and Legal
2 $18,585 $111,510 0 $0
Totals for Government
182 $853,640 $56,284 9 $9,466
Madison government finances - Expenditure in 2021 (per resident):
Construction - Regular Highways: $3,868,000 ($139.26)
Air Transportation: $830,000 ($29.88)Water Utilities: $512,000 ($18.43)General - Other: $92,000 ($3.31)Current Operations - Police Protection: $7,741,000 ($278.70)
Regular Highways: $4,577,000 ($164.79)Local Fire Protection: $2,866,000 ($103.19)Sewerage: $2,681,000 ($96.53)Financial Administration: $2,646,000 ($95.27)Solid Waste Management: $1,711,000 ($61.60)Central Staff Services: $1,574,000 ($56.67)Water Utilities: $1,303,000 ($46.91)Parks and Recreation: $1,008,000 ($36.29)Judicial and Legal Services: $333,000 ($11.99)Libraries: $167,000 ($6.01)Air Transportation: $75,000 ($2.70)General - Interest on Debt: $1,077,000 ($38.78)
Other Capital Outlay - Police Protection: $472,000 ($16.99)
Central Staff Services: $421,000 ($15.16)Regular Highways: $175,000 ($6.30)Local Fire Protection: $12,000 ($0.43)Parks and Recreation: $10,000 ($0.36)Financial Administration: $4,000 ($0.14)Total Salaries and Wages: $9,762,000 ($351.47)
Water Utilities - Interest on Debt: $327,000 ($11.77)
Madison government finances - Revenue in 2021 (per resident):
Charges - Sewerage: $3,652,000 ($131.49)
Solid Waste Management: $1,813,000 ($65.27)Air Transportation: $128,000 ($4.61)Parks and Recreation: $61,000 ($2.20)Federal Intergovernmental - Air Transportation: $768,000 ($27.65)
Local Intergovernmental - Highways: $3,346,000 ($120.47)
Miscellaneous - Fines and Forfeits: $806,000 ($29.02)
Interest Earnings: $298,000 ($10.73)Rents: $286,000 ($10.30)General Revenue - Other: $243,000 ($8.75)Sale of Property: $83,000 ($2.99)Revenue - Water Utilities: $1,020,000 ($36.72)
State Intergovernmental - General Local Government Support: $9,378,000 ($337.64)
Other: $744,000 ($26.79)Highways: $253,000 ($9.11)Tax - Property: $12,540,000 ($451.49)
Public Utilities Sales: $1,169,000 ($42.09)Occupation and Business License - Other: $1,060,000 ($38.16)
Madison government finances - Debt in 2021 (per resident):
Long Term Debt - Outstanding Unspecified Public Purpose: $49,059,000 ($1766.30)
Beginning Outstanding - Unspecified Public Purpose: $47,086,000 ($1695.27)Issue, Unspecified Public Purpose: $14,185,000 ($510.71)Retired Unspecified Public Purpose: $12,212,000 ($439.68)
Madison government finances - Cash and Securities in 2021 (per resident):
Bond Funds - Cash and Securities: $150,000 ($5.40)
Other Funds - Cash and Securities: $9,057,000 ($326.08)
Sinking Funds - Cash and Securities: $9,196,000 ($331.09)
Businesses in Madison, MS
Name Count Name Count
AT&T 2 Kroger 2 Ace Hardware 1 Little Caesars Pizza 1 Applebee's 1 Lowe's 1 Blockbuster 1 McDonald's 2 Burger King 1 Nike 3 CVS 2 Pizza Hut 1 Chick-Fil-A 1 Popeyes 1 Cold Stone Creamery 1 Rite Aid 1 Domino's Pizza 1 Subway 3 FedEx 7 Super 8 1 GNC 1 T-Mobile 1 GameStop 1 UPS 7 H&R Block 1 Walgreens 1 Home Depot 1 Walmart 1 Jones New York 1 Wendy's 2 KFC 1
Strongest AM radio stations in Madison:
WJNT (1180 AM; 50 kW; PEARL, MS; Owner: BUCHANAN BROADCASTING CO., INC.)
WIIN (780 AM; daytime; 5 kW; RIDGELAND, MS; Owner: NEW SOUTH RADIO, INC)
WSLI (930 AM; 5 kW; JACKSON, MS; Owner: SPORTSRAD, INC.)
WJDX (620 AM; 5 kW; JACKSON, MS; Owner: CAPSTAR TX LIMITED PARTNERSHIP)
WOAD (1300 AM; 5 kW; JACKSON, MS; Owner: URBAN RADIO OF MISSISSIPPI, L.L.C.)
WWDF (720 AM; daytime; 5 kW; RICHLAND, MS; Owner: WILLIS BROADCASTING CORPORATION)
WZRX (1590 AM; 5 kW; JACKSON, MS; Owner: CAPSTAR TX LIMITED PARTNERSHIP)
WTWZ (1120 AM; daytime; 8 kW; CLINTON, MS; Owner: WOOD BROADCASTING CO.)
WSJC (810 AM; 50 kW; MAGEE, MS; Owner: FAMILY TALK RADIO)
WONG (1150 AM; 0 kW; CANTON, MS; Owner: MARION R. WILLIAMS)
WQST (850 AM; daytime; 10 kW; FOREST, MS; Owner: ACE BROADCASTING, INC.)
WKXI (1400 AM; 1 kW; JACKSON, MS; Owner: URBAN RADIO OF MISSISSIPPI, L.L.C.)
WJXN (1450 AM; 1 kW; JACKSON, MS; Owner: WILLIS BROADCASTING CORPORATION)
Strongest FM radio stations in Madison:
WYOY (101.7 FM; GLUCKSTADT, MS; Owner: NEW SOUTH RADIO, INC)
WDBT (95.5 FM; JACKSON, MS; Owner: CAPSTAR TX LIMITED PARTNERSHIP)
WMSI-FM (102.9 FM; JACKSON, MS; Owner: CAPSTAR TX LIMITED PARTNERSHIP)
WTYX (94.7 FM; JACKSON, MS; Owner: BACKYARD BROADCASTING MISSISSIPPI, LLC)
WSTZ-FM (106.7 FM; VICKSBURG, MS; Owner: CAPSTAR TX LIMITED PARTNERSHIP)
WJMI (99.7 FM; JACKSON, MS; Owner: URBAN RADIO OF MISSISSIPPI, L.L.C.)
WYJS (105.9 FM; PICKENS, MS; Owner: URBAN RADIO OF MISSISSIPPI, LLC)
WMPN-FM (91.3 FM; JACKSON, MS; Owner: MISSISSIPPI AUTHORITY FOR EDUCATIONAL TV)
WUSJ (96.3 FM; JACKSON, MS; Owner: NEW SOUTH COMMUNICATIONS, INC.)
WJKK (98.7 FM; VICKSBURG, MS; Owner: NEW SOUTH RADIO, INC.)
WKXI-FM (107.5 FM; MAGEE, MS; Owner: URBAN RADIO OF MISSISSIPPI, L.L.C.)
WRXW (93.9 FM; PEARL, MS; Owner: BACKYARD BROADCASTING MISSISSIPPI, LLC)
WQST-FM (92.5 FM; FOREST, MS; Owner: AMERICAN FAMILY ASSOCIATION, INC.)
WMPR (90.1 FM; JACKSON, MS; Owner: J.C. MAXWELL BROADCASTING GROUP, INC)
WHJT (93.5 FM; CLINTON, MS; Owner: MISSISSIPPI COLLEGE)
WFMN (97.3 FM; FLORA, MS; Owner: WFMN RADIO, INC.)
WJSU-FM (88.5 FM; JACKSON, MS; Owner: JACKSON STATE UNIVERSITY)
WJXN-FM (100.9 FM; UTICA, MS; Owner: FLINN BROADCASTING CORPORATION)
WRJH (97.7 FM; BRANDON, MS; Owner: ON TOP COMMUNICATIONS OF MISSISSIPPI, LLC)
WYAB (93.1 FM; YAZOO CITY, MS; Owner: SSR COMMUNICATIONS, INC.)
TV broadcast stations around Madison:
W46CW (Channel 46; JACKSON/BRANDON, MS; Owner: MISSISSIPPI TELEVISION, LLC)
WJTV (Channel 12; JACKSON, MS; Owner: MEDIA GENERAL COMMUNICATIONS, INC.)
WLBT (Channel 3; JACKSON, MS; Owner: CIVCO, INC.)
WDBD (Channel 40; JACKSON, MS; Owner: WDBD LICENSE CORP.)
WBMS-CA (Channel 10; JACKSON, MS; Owner: GENE A. BLAILOCK)
WMPN-TV (Channel 29; JACKSON, MS; Owner: MISSISSIPPI AUTHORITY FOR EDUCATIONAL TV)
WJKO-LP (Channel 64; JACKSON, MS; Owner: WORD OF GOD FELLOWSHIP, INC.)
WJMF-LP (Channel 53; JACKSON, MS; Owner: EQUITY BROADCASTING CORPORATION)
WJXF-LP (Channel 49; JACKSON, MS; Owner: EQUITY BROADCASTING CORPORATION)
WAPT (Channel 16; JACKSON, MS; Owner: WAPT HEARST-ARGYLE TV, INC. (CA CORP.))
WBXK-CA (Channel 8; JACKSON, ETC., MS; Owner: THE BOX WORLDWIDE LLC)
W23BC (Channel 23; JACKSON, MS; Owner: JACKSON STATE UNIVERSITY)
National Bridge Inventory (NBI) Statistics 46 Number of bridges361ft / 110m Total length $198,050,000 Total costs429,210 Total average daily traffic42,642 Total average daily truck traffic
New bridges - historical statistics
1 1920-1929 3 1950-1959 15 1960-1969 3 1970-1979 4 1980-1989 7 1990-1999 9 2000-2009 4 2010-2019
See full National Bridge Inventory statistics for Madison, MS
Home Mortgage Disclosure Act Aggregated Statistics For Year 2009(Based on 1 full and 3 partial tracts) A) FHA, FSA/RHS & VA B) Conventional C) Refinancings D) Home Improvement Loans F) Non-occupant Loans on Number Average Value Number Average Value Number Average Value Number Average Value Number Average Value
LOANS ORIGINATED 87 $169,049 151 $227,432 511 $203,524 21 $49,870 55 $199,195 APPLICATIONS APPROVED, NOT ACCEPTED 4 $217,925 5 $271,848 38 $197,765 2 $191,605 2 $352,155 APPLICATIONS DENIED 9 $193,039 11 $225,125 81 $215,286 11 $36,639 3 $80,813 APPLICATIONS WITHDRAWN 10 $162,695 16 $201,906 82 $204,617 1 $138,280 4 $139,962 FILES CLOSED FOR INCOMPLETENESS 3 $204,787 4 $170,248 22 $170,167 0 $0 0 $0
Aggregated Statistics For Year 2008(Based on 1 full and 3 partial tracts) A) FHA, FSA/RHS & VA B) Conventional C) Refinancings D) Home Improvement Loans F) Non-occupant Loans on G) Loans On Manufactured Number Average Value Number Average Value Number Average Value Number Average Value Number Average Value Number Average Value
LOANS ORIGINATED 53 $170,915 203 $223,707 274 $215,257 23 $42,049 63 $214,184 0 $0 APPLICATIONS APPROVED, NOT ACCEPTED 1 $249,190 20 $239,776 29 $193,711 1 $220,200 3 $98,630 1 $38,540 APPLICATIONS DENIED 7 $150,919 14 $258,886 81 $190,993 10 $54,479 9 $143,770 0 $0 APPLICATIONS WITHDRAWN 4 $164,742 18 $265,321 33 $241,339 1 $195,860 1 $137,360 0 $0 FILES CLOSED FOR INCOMPLETENESS 2 $108,280 4 $358,340 8 $214,900 0 $0 0 $0 0 $0
Aggregated Statistics For Year 2007(Based on 1 full and 3 partial tracts) A) FHA, FSA/RHS & VA B) Conventional C) Refinancings D) Home Improvement Loans F) Non-occupant Loans on G) Loans On Manufactured Number Average Value Number Average Value Number Average Value Number Average Value Number Average Value Number Average Value
LOANS ORIGINATED 25 $164,702 350 $206,553 210 $185,961 31 $50,040 45 $169,059 0 $0 APPLICATIONS APPROVED, NOT ACCEPTED 1 $108,250 37 $200,318 30 $244,931 5 $60,060 4 $112,518 0 $0 APPLICATIONS DENIED 2 $167,345 54 $240,019 91 $184,207 16 $90,519 13 $162,361 1 $23,140 APPLICATIONS WITHDRAWN 1 $164,030 26 $255,155 40 $176,856 3 $63,287 4 $153,522 0 $0 FILES CLOSED FOR INCOMPLETENESS 0 $0 11 $203,420 28 $194,559 1 $62,670 1 $73,320 0 $0
Aggregated Statistics For Year 2006(Based on 1 full and 3 partial tracts) A) FHA, FSA/RHS & VA B) Conventional C) Refinancings D) Home Improvement Loans F) Non-occupant Loans on G) Loans On Manufactured Number Average Value Number Average Value Number Average Value Number Average Value Number Average Value Number Average Value
LOANS ORIGINATED 47 $153,073 371 $175,093 216 $175,828 28 $31,663 56 $161,063 0 $0 APPLICATIONS APPROVED, NOT ACCEPTED 2 $97,635 35 $199,038 30 $142,557 2 $77,145 3 $180,990 1 $61,000 APPLICATIONS DENIED 5 $159,756 82 $203,955 92 $155,361 18 $45,243 9 $134,000 1 $39,430 APPLICATIONS WITHDRAWN 4 $165,335 41 $198,890 46 $167,236 1 $74,770 3 $125,357 0 $0 FILES CLOSED FOR INCOMPLETENESS 0 $0 20 $181,395 33 $170,917 0 $0 6 $110,345 0 $0
Aggregated Statistics For Year 2005(Based on 1 full and 3 partial tracts) A) FHA, FSA/RHS & VA B) Conventional C) Refinancings D) Home Improvement Loans F) Non-occupant Loans on G) Loans On Manufactured Number Average Value Number Average Value Number Average Value Number Average Value Number Average Value Number Average Value
LOANS ORIGINATED 39 $139,909 450 $179,620 259 $157,115 23 $49,601 58 $121,715 1 $62,550 APPLICATIONS APPROVED, NOT ACCEPTED 1 $225,530 50 $160,948 49 $162,776 3 $45,690 4 $123,650 2 $52,355 APPLICATIONS DENIED 4 $114,988 79 $163,414 96 $159,915 18 $40,901 9 $142,989 2 $56,295 APPLICATIONS WITHDRAWN 1 $117,280 65 $173,635 86 $173,592 6 $41,860 9 $184,596 0 $0 FILES CLOSED FOR INCOMPLETENESS 0 $0 13 $164,317 25 $159,308 3 $45,073 0 $0 0 $0
Aggregated Statistics For Year 2004(Based on 1 full and 3 partial tracts) A) FHA, FSA/RHS & VA B) Conventional C) Refinancings D) Home Improvement Loans F) Non-occupant Loans on G) Loans On Manufactured Number Average Value Number Average Value Number Average Value Number Average Value Number Average Value Number Average Value
LOANS ORIGINATED 36 $132,343 354 $173,541 292 $137,136 24 $58,390 35 $101,991 1 $54,220 APPLICATIONS APPROVED, NOT ACCEPTED 0 $0 36 $172,423 36 $151,446 2 $69,815 2 $81,830 1 $46,310 APPLICATIONS DENIED 5 $128,466 41 $183,702 95 $137,498 13 $60,015 3 $79,847 3 $25,357 APPLICATIONS WITHDRAWN 5 $141,736 28 $190,354 105 $144,136 6 $116,392 4 $114,092 0 $0 FILES CLOSED FOR INCOMPLETENESS 0 $0 9 $175,673 13 $124,132 3 $93,813 0 $0 0 $0
Aggregated Statistics For Year 2003(Based on 1 full and 3 partial tracts) A) FHA, FSA/RHS & VA B) Conventional C) Refinancings D) Home Improvement Loans F) Non-occupant Loans on Number Average Value Number Average Value Number Average Value Number Average Value Number Average Value
LOANS ORIGINATED 52 $128,648 345 $161,852 856 $129,716 20 $51,516 45 $101,733 APPLICATIONS APPROVED, NOT ACCEPTED 0 $0 26 $147,239 58 $132,793 2 $24,355 1 $79,480 APPLICATIONS DENIED 2 $123,455 23 $129,446 106 $132,580 11 $54,955 6 $79,083 APPLICATIONS WITHDRAWN 4 $115,402 17 $159,096 89 $125,942 0 $0 4 $86,075 FILES CLOSED FOR INCOMPLETENESS 1 $152,120 8 $172,174 25 $161,909 0 $0 2 $121,955
Aggregated Statistics For Year 2002(Based on 1 partial tract) A) FHA, FSA/RHS & VA B) Conventional C) Refinancings D) Home Improvement Loans F) Non-occupant Loans on Number Average Value Number Average Value Number Average Value Number Average Value Number Average Value
LOANS ORIGINATED 24 $112,537 87 $132,184 196 $120,774 10 $57,434 17 $97,710 APPLICATIONS APPROVED, NOT ACCEPTED 1 $51,120 5 $122,204 15 $70,364 2 $24,055 1 $75,180 APPLICATIONS DENIED 1 $56,530 7 $71,051 34 $92,191 4 $7,518 0 $0 APPLICATIONS WITHDRAWN 2 $99,230 7 $112,634 26 $114,451 0 $0 3 $79,183 FILES CLOSED FOR INCOMPLETENESS 1 $54,730 0 $0 5 $100,194 0 $0 0 $0
Aggregated Statistics For Year 2001(Based on 1 partial tract) A) FHA, FSA/RHS & VA B) Conventional C) Refinancings D) Home Improvement Loans F) Non-occupant Loans on Number Average Value Number Average Value Number Average Value Number Average Value Number Average Value
LOANS ORIGINATED 28 $105,632 75 $122,221 156 $115,631 11 $28,648 8 $128,023 APPLICATIONS APPROVED, NOT ACCEPTED 1 $68,560 5 $101,998 11 $114,867 2 $21,050 0 $0 APPLICATIONS DENIED 1 $102,840 8 $80,738 32 $81,997 7 $38,060 4 $52,472 APPLICATIONS WITHDRAWN 0 $0 3 $177,213 20 $115,168 1 $15,640 1 $278,450 FILES CLOSED FOR INCOMPLETENESS 1 $57,130 1 $164,780 7 $91,327 0 $0 0 $0
Aggregated Statistics For Year 2000(Based on 1 partial tract) A) FHA, FSA/RHS & VA B) Conventional C) Refinancings D) Home Improvement Loans F) Non-occupant Loans on Number Average Value Number Average Value Number Average Value Number Average Value Number Average Value
LOANS ORIGINATED 24 $98,254 76 $140,371 39 $104,659 25 $21,698 11 $55,657 APPLICATIONS APPROVED, NOT ACCEPTED 1 $60,140 2 $158,770 7 $103,011 2 $33,980 0 $0 APPLICATIONS DENIED 2 $104,945 5 $75,656 22 $69,872 7 $15,636 0 $0 APPLICATIONS WITHDRAWN 1 $145,540 4 $129,902 17 $89,750 2 $58,635 0 $0 FILES CLOSED FOR INCOMPLETENESS 1 $143,730 1 $135,920 2 $167,490 0 $0 0 $0
Aggregated Statistics For Year 1999(Based on 2 partial tracts) A) FHA, FSA/RHS & VA B) Conventional C) Refinancings D) Home Improvement Loans F) Non-occupant Loans on Number Average Value Number Average Value Number Average Value Number Average Value Number Average Value
LOANS ORIGINATED 40 $103,220 180 $137,154 136 $114,476 23 $26,179 11 $73,573 APPLICATIONS APPROVED, NOT ACCEPTED 1 $85,580 11 $137,509 20 $95,171 6 $22,445 0 $0 APPLICATIONS DENIED 2 $144,925 18 $121,972 39 $91,614 12 $18,238 1 $67,490 APPLICATIONS WITHDRAWN 4 $104,412 13 $138,508 27 $105,209 2 $67,185 0 $0 FILES CLOSED FOR INCOMPLETENESS 0 $0 1 $124,900 4 $112,420 1 $12,230 0 $0
Detailed HMDA statistics for the following Tracts:
0301.01
, 0302.02 , 0302.03 , 0302.04
Private Mortgage Insurance Companies Aggregated Statistics For Year 2009(Based on 1 full and 3 partial tracts) A) Conventional B) Refinancings Number Average Value Number Average Value
LOANS ORIGINATED 27 $251,736 47 $245,221 APPLICATIONS APPROVED, NOT ACCEPTED 6 $280,935 12 $248,600 APPLICATIONS DENIED 7 $253,659 7 $254,710 APPLICATIONS WITHDRAWN 2 $359,510 3 $241,880 FILES CLOSED FOR INCOMPLETENESS 1 $310,930 2 $339,510
Aggregated Statistics For Year 2008(Based on 1 full and 3 partial tracts) A) Conventional B) Refinancings C) Non-occupant Loans on Number Average Value Number Average Value Number Average Value
LOANS ORIGINATED 79 $220,288 32 $214,932 8 $168,180 APPLICATIONS APPROVED, NOT ACCEPTED 27 $206,364 15 $234,373 2 $237,485 APPLICATIONS DENIED 2 $275,120 1 $140,540 1 $72,080 APPLICATIONS WITHDRAWN 3 $235,280 3 $214,553 1 $268,620 FILES CLOSED FOR INCOMPLETENESS 1 $169,110 1 $133,220 0 $0
Aggregated Statistics For Year 2007(Based on 1 full and 3 partial tracts) A) Conventional B) Refinancings C) Non-occupant Loans on Number Average Value Number Average Value Number Average Value
LOANS ORIGINATED 134 $196,121 37 $193,185 5 $131,838 APPLICATIONS APPROVED, NOT ACCEPTED 24 $201,772 15 $180,351 3 $91,697 APPLICATIONS DENIED 2 $167,930 1 $286,490 1 $70,360 APPLICATIONS WITHDRAWN 3 $295,367 2 $187,905 1 $143,550 FILES CLOSED FOR INCOMPLETENESS 0 $0 1 $90,810 0 $0
Aggregated Statistics For Year 2006(Based on 1 full and 3 partial tracts) A) Conventional B) Refinancings C) Non-occupant Loans on Number Average Value Number Average Value Number Average Value
LOANS ORIGINATED 73 $190,577 25 $187,122 4 $134,255 APPLICATIONS APPROVED, NOT ACCEPTED 9 $202,953 7 $177,000 1 $73,320 APPLICATIONS DENIED 0 $0 0 $0 0 $0 APPLICATIONS WITHDRAWN 4 $169,900 1 $232,850 0 $0 FILES CLOSED FOR INCOMPLETENESS 0 $0 0 $0 0 $0
Aggregated Statistics For Year 2005(Based on 1 full and 3 partial tracts) A) Conventional B) Refinancings C) Non-occupant Loans on Number Average Value Number Average Value Number Average Value
LOANS ORIGINATED 87 $184,917 35 $160,530 4 $137,870 APPLICATIONS APPROVED, NOT ACCEPTED 16 $215,510 12 $196,632 1 $223,040 APPLICATIONS DENIED 0 $0 0 $0 0 $0 APPLICATIONS WITHDRAWN 3 $164,243 2 $98,565 2 $113,990 FILES CLOSED FOR INCOMPLETENESS 0 $0 2 $120,140 0 $0
Aggregated Statistics For Year 2004(Based on 1 full and 3 partial tracts) A) Conventional B) Refinancings C) Non-occupant Loans on Number Average Value Number Average Value Number Average Value
LOANS ORIGINATED 104 $182,997 47 $161,923 2 $130,440 APPLICATIONS APPROVED, NOT ACCEPTED 21 $182,708 15 $193,383 0 $0 APPLICATIONS DENIED 0 $0 0 $0 0 $0 APPLICATIONS WITHDRAWN 4 $169,052 4 $170,902 0 $0 FILES CLOSED FOR INCOMPLETENESS 0 $0 1 $152,260 0 $0
Aggregated Statistics For Year 2003(Based on 1 full and 3 partial tracts) A) Conventional B) Refinancings C) Non-occupant Loans on Number Average Value Number Average Value Number Average Value
LOANS ORIGINATED 123 $176,039 141 $146,678 5 $119,368 APPLICATIONS APPROVED, NOT ACCEPTED 11 $191,748 16 $171,422 0 $0 APPLICATIONS DENIED 1 $129,900 1 $85,400 0 $0 APPLICATIONS WITHDRAWN 5 $219,924 6 $143,085 1 $81,190 FILES CLOSED FOR INCOMPLETENESS 0 $0 0 $0 0 $0
Aggregated Statistics For Year 2002(Based on 1 partial tract) A) Conventional B) Refinancings C) Non-occupant Loans on Number Average Value Number Average Value Number Average Value
LOANS ORIGINATED 39 $143,149 25 $132,019 2 $99,230 APPLICATIONS APPROVED, NOT ACCEPTED 3 $145,940 5 $127,136 0 $0 APPLICATIONS DENIED 0 $0 0 $0 0 $0 APPLICATIONS WITHDRAWN 1 $99,230 0 $0 0 $0 FILES CLOSED FOR INCOMPLETENESS 0 $0 0 $0 0 $0
Aggregated Statistics For Year 2001(Based on 1 partial tract) A) Conventional B) Refinancings C) Non-occupant Loans on Number Average Value Number Average Value Number Average Value
LOANS ORIGINATED 26 $124,004 33 $134,003 2 $68,560 APPLICATIONS APPROVED, NOT ACCEPTED 2 $124,790 2 $109,455 0 $0 APPLICATIONS DENIED 0 $0 0 $0 0 $0 APPLICATIONS WITHDRAWN 0 $0 0 $0 0 $0 FILES CLOSED FOR INCOMPLETENESS 0 $0 0 $0 0 $0
Aggregated Statistics For Year 2000(Based on 1 partial tract) A) Conventional B) Refinancings C) Non-occupant Loans on Number Average Value Number Average Value Number Average Value
LOANS ORIGINATED 25 $126,992 5 $148,184 1 $121,480 APPLICATIONS APPROVED, NOT ACCEPTED 3 $137,120 1 $154,560 0 $0 APPLICATIONS DENIED 0 $0 0 $0 0 $0 APPLICATIONS WITHDRAWN 0 $0 1 $199,060 0 $0 FILES CLOSED FOR INCOMPLETENESS 0 $0 0 $0 0 $0
Aggregated Statistics For Year 1999(Based on 2 partial tracts) A) Conventional B) Refinancings C) Non-occupant Loans on Number Average Value Number Average Value Number Average Value
LOANS ORIGINATED 70 $137,561 23 $128,876 1 $63,700 APPLICATIONS APPROVED, NOT ACCEPTED 5 $141,300 8 $145,291 0 $0 APPLICATIONS DENIED 2 $218,120 0 $0 0 $0 APPLICATIONS WITHDRAWN 1 $124,440 2 $116,150 0 $0 FILES CLOSED FOR INCOMPLETENESS 0 $0 0 $0 0 $0
Detailed PMIC statistics for the following Tracts:
0301.01
, 0302.02 , 0302.03 , 0302.04 Fire-safe hotels and motels in Madison, Mississippi:
Super 8 Motel, 405 Business Park Dr, Madison, Mississippi 39110 Phone: (601) 853-3330, Fax: (601) 898-4065
Hilton Garden Inn Jackson/Madison, 320 New Mannsdale Rd, Madison, Mississippi 39110 Phone: (601) 420-0442
Courtyard by Marriott Jackson Madison, 601 Baptist Dr, Madison, Mississippi 39110 Phone: (601) 605-8810
All 3 fire-safe hotels and motels in Madison, Mississippi
Most common first names in Madison, MS among deceased individuals Name Count Lived (average)
Mary 85 83.3 years James 69 72.3 years John 67 77.8 years William 63 74.6 years Robert 52 76.4 years Dorothy 30 81.8 years Willie 30 78.5 years Charles 29 76.0 years Ruth 28 83.9 years Henry 26 78.6 years
Most common last names in Madison, MS among deceased individuals Last name Count Lived (average)
Smith 49 79.8 years Brown 30 73.9 years Williams 28 77.9 years Jones 23 77.9 years Johnson 22 80.7 years Moore 21 80.0 years Lewis 20 75.7 years Davis 17 74.2 years Cox 17 79.6 years Bouldin 17 74.7 years
Madison compared to Mississippi state average:
Median household income significantly above state average. Median house value above state average. Unemployed percentage significantly below state average. Median age above state average. Foreign-born population percentage significantly above state average. Renting percentage significantly below state average. Length of stay since moving in significantly above state average. Number of rooms per house above state average. House age significantly below state average. Percentage of population with a bachelor's degree or higher significantly above state average.
#19 on the list of "Top 101 cities with largest percentage of females in occupations: health diagnosing and treating practitioners and other technical occupations (population 5,000+)"
#69 on the list of "Top 101 cities with the largest percentage of one, detached housing units in structures (2,000+ housing units)"
#81 on the list of "Top 101 cities with the lowest number of burglaries per 100,000 residents (population 5,000+)"
#89 (39110) on the list of "Top 101 zip codes with the largest percentage of English first ancestries (pop 5,000+)"
#41 on the list of "Top 101 counties with the largest decrease in the number of deaths per 1000 residents 2000-2006 to 2007-2013 (pop. 50,000+)"
#69 on the list of "Top 101 counties with the largest number of people moving in compared to moving out (pop. 50,000+)"
#91 on the list of "Top 101 counties with the highest percentage of residents relocating from other counties between 2010 and 2011 (pop. 50,000+)"
#96 on the list of "Top 101 counties with the lowest percentage of residents relocating to foreign countries in 2011"
Top Patent Applicants
John Lawrence Walker (16)
James W. Meadows (9)
John Todd Barrett (9)
Robert L. Lewis (7)
Kerry D. Roosmalen (5)
Rebecca C. Eller (5)
Dallas L. Nash, Ii (4)
Richard Seiss (3)
Robert Lewis (3)
Joseph Matthew Jones (3)
Total of 136 patent applications in 2008-2024.


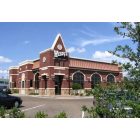
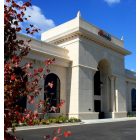
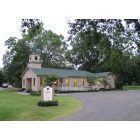
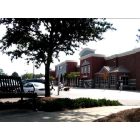
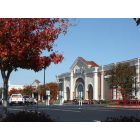
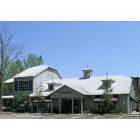


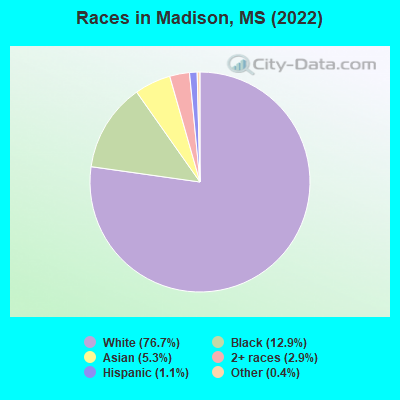
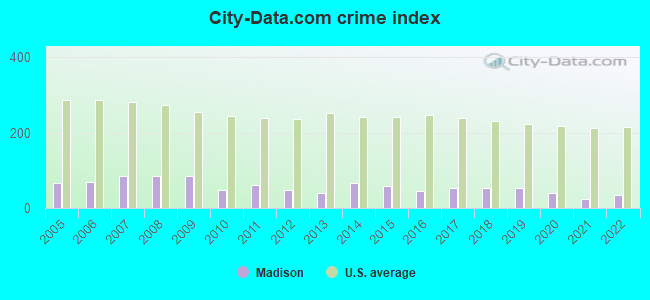
 Recent articles from our blog. Our writers, many of them Ph.D. graduates or candidates, create easy-to-read articles on a wide variety of topics.

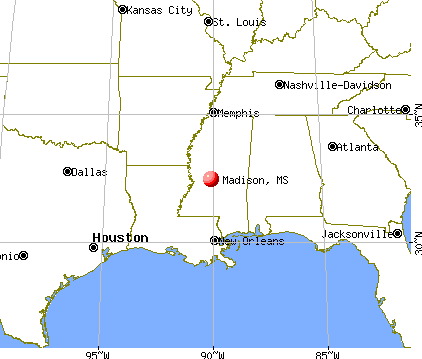
 (11.0 miles
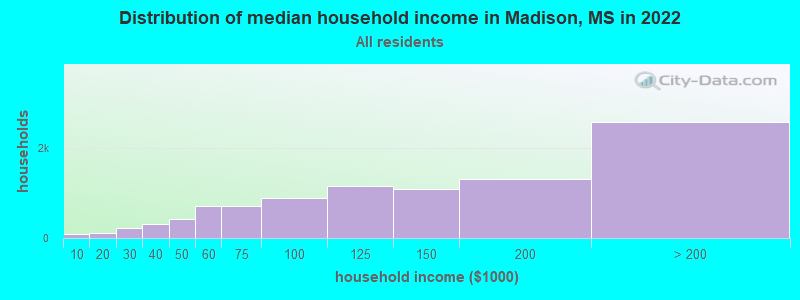
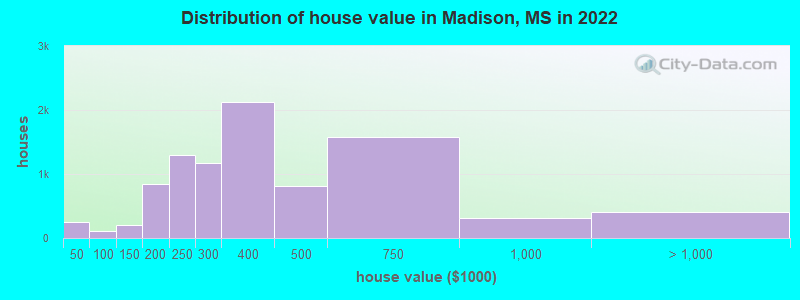
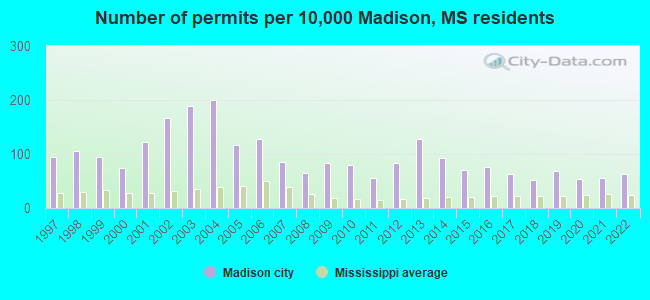
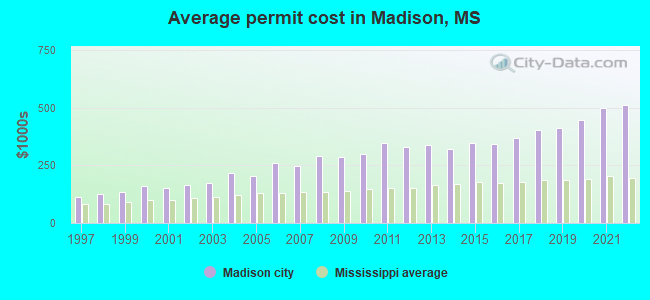
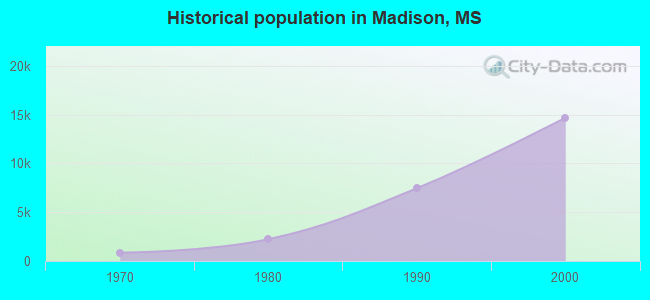
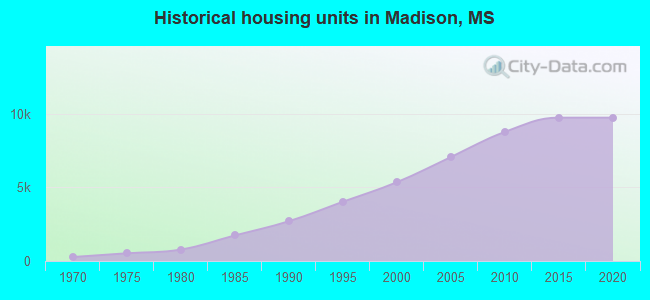
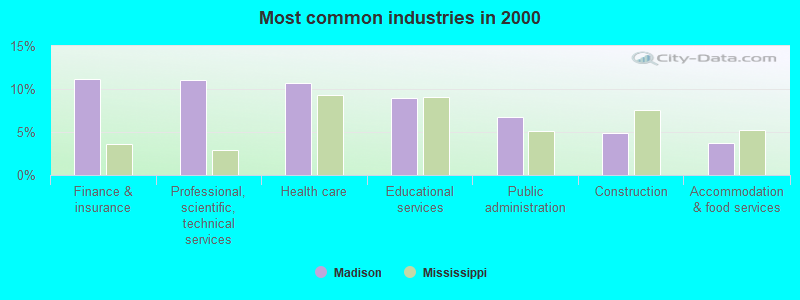
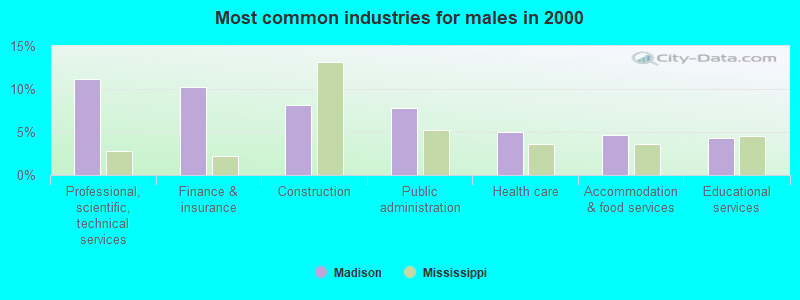
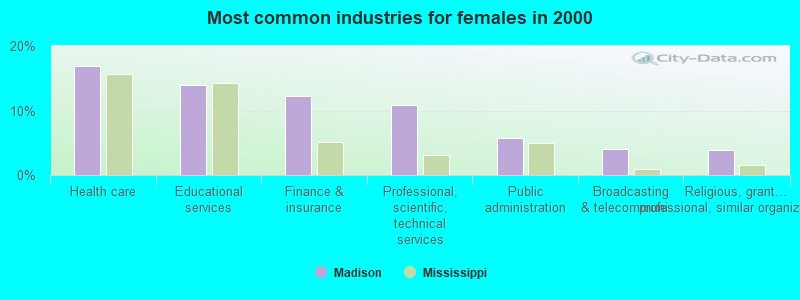
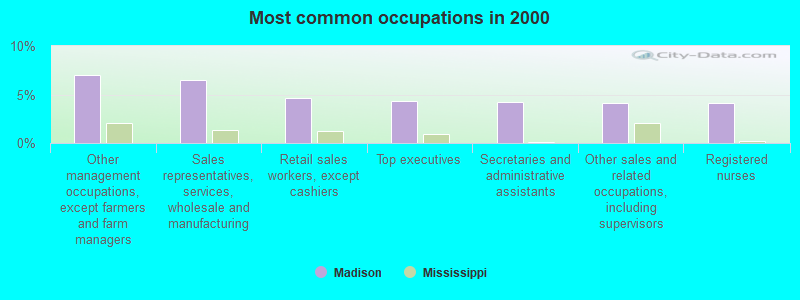
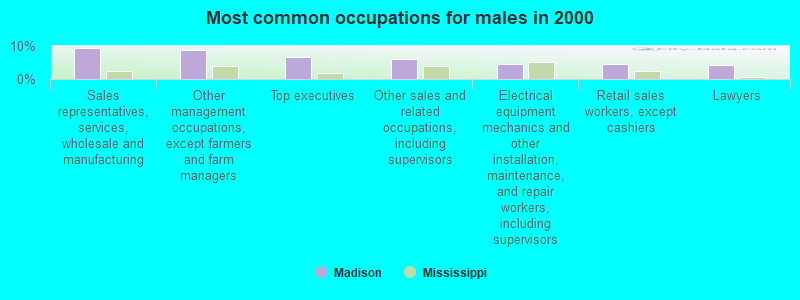
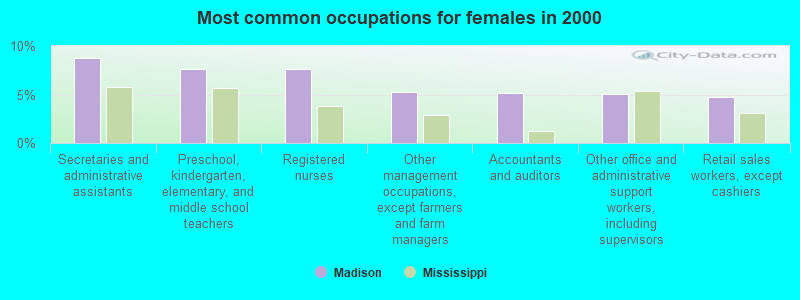
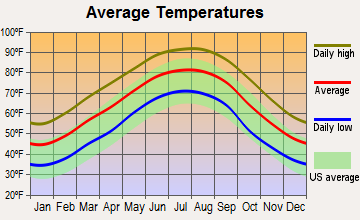
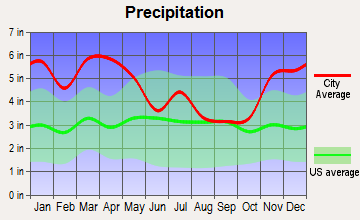
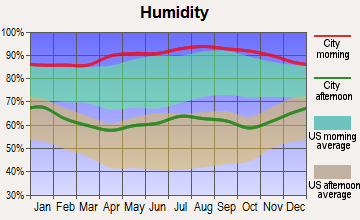
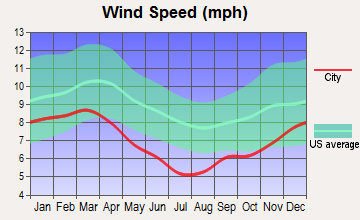
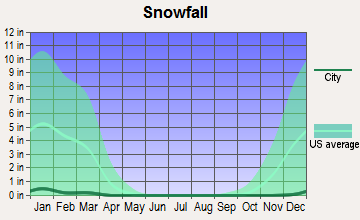
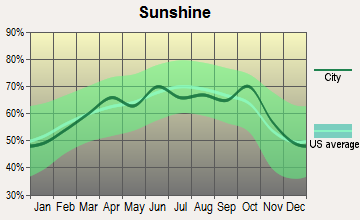
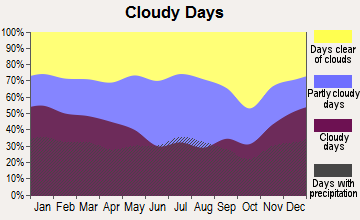
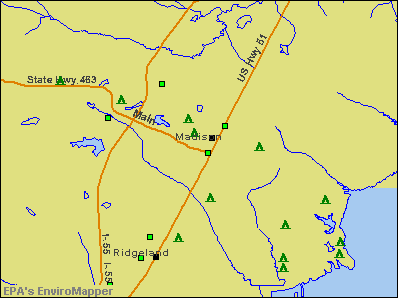

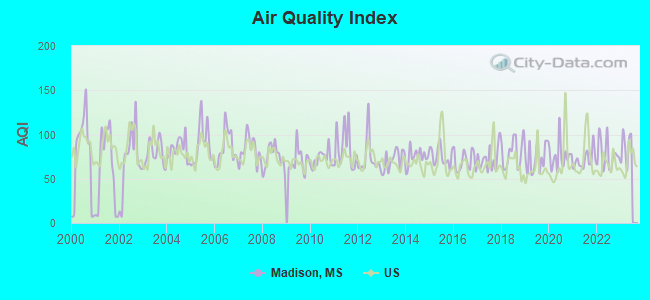
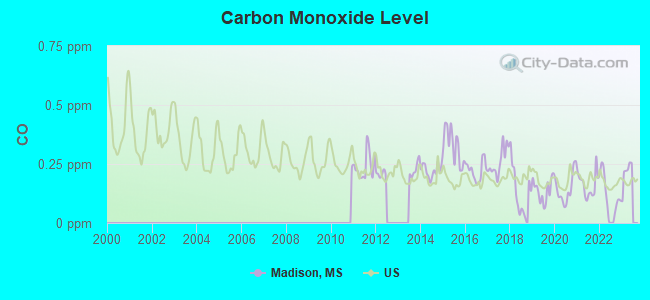
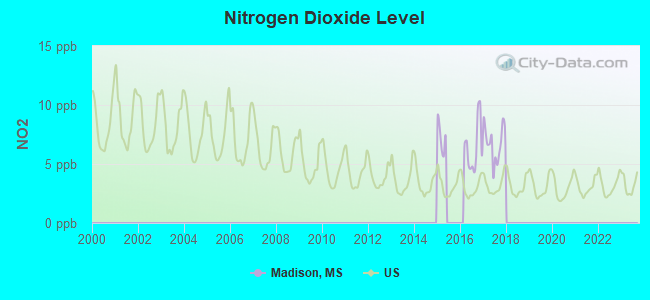
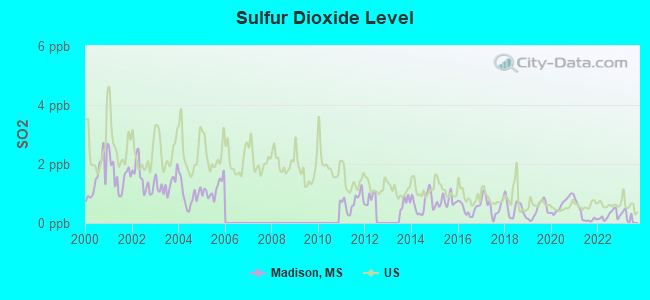
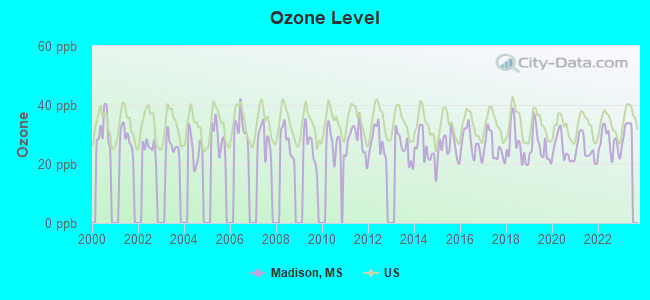
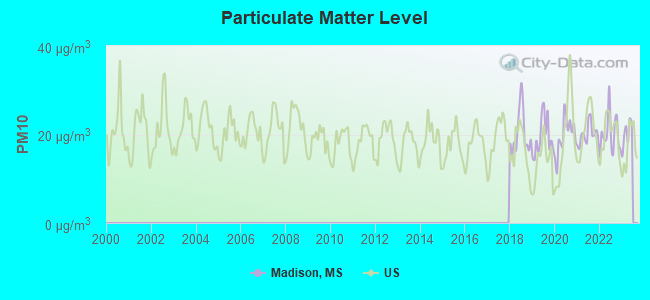
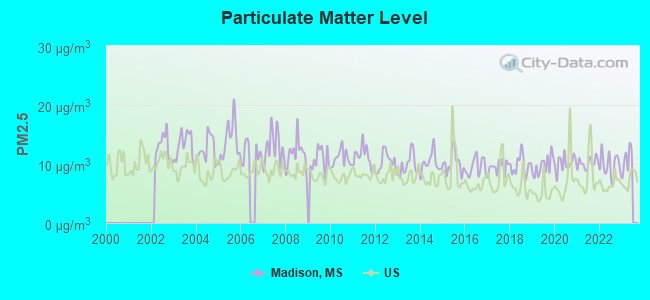

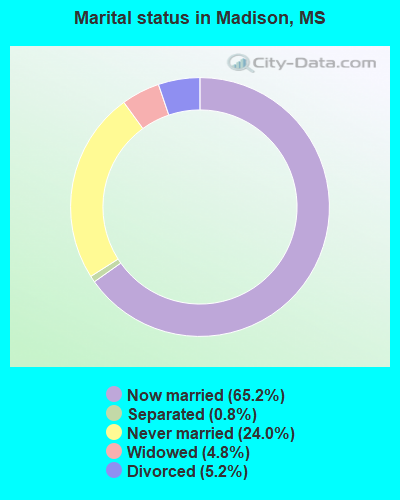
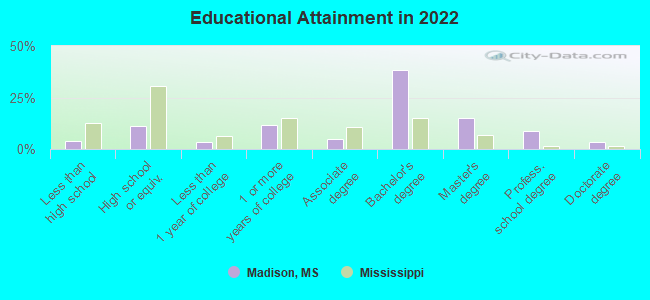
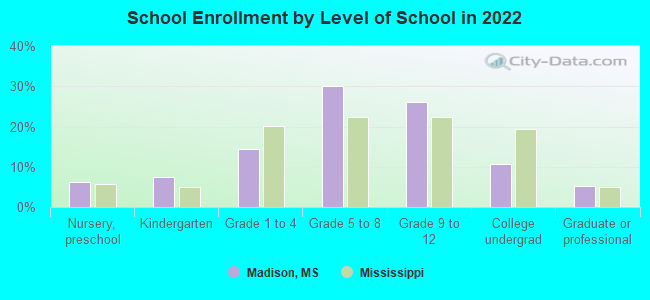
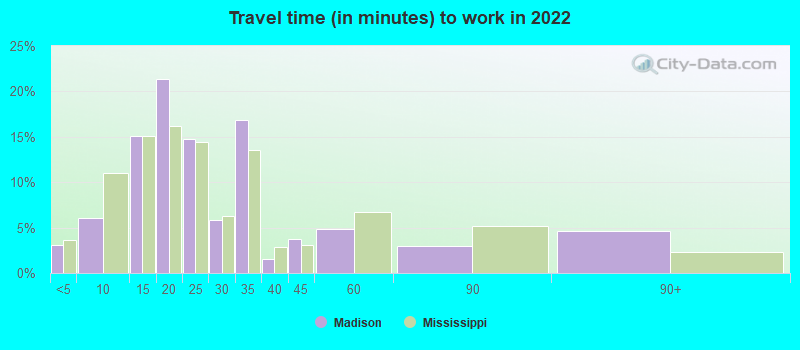
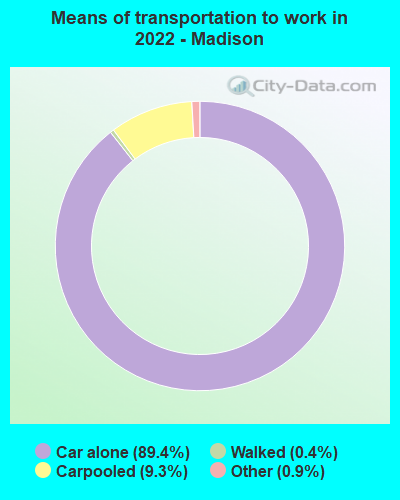
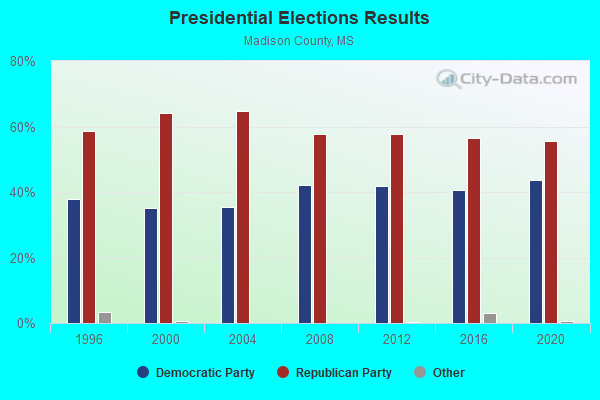
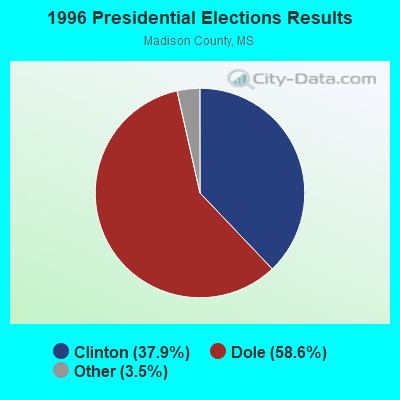
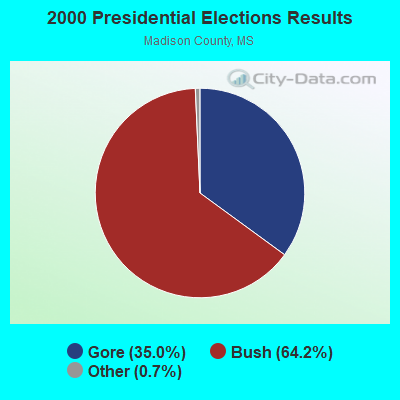
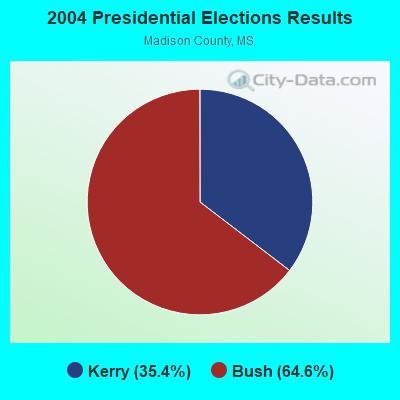
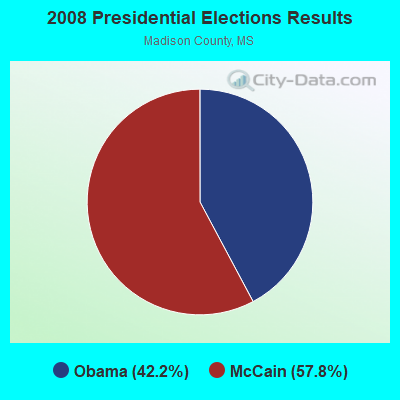
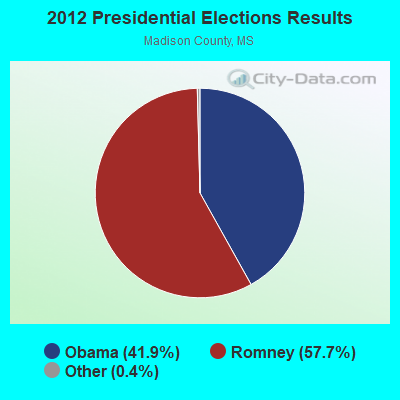
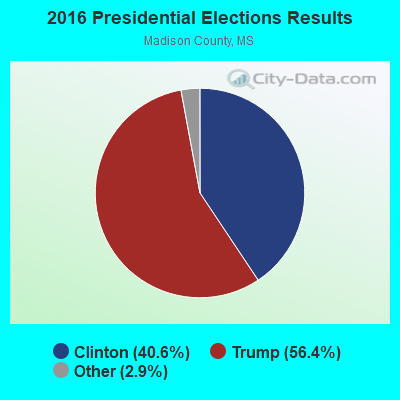
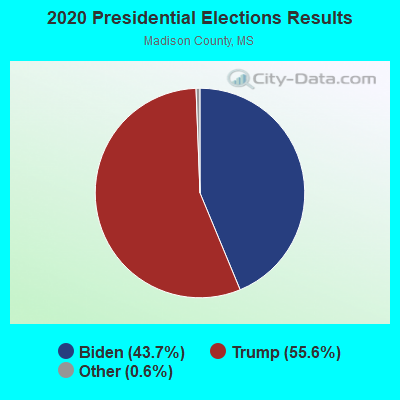
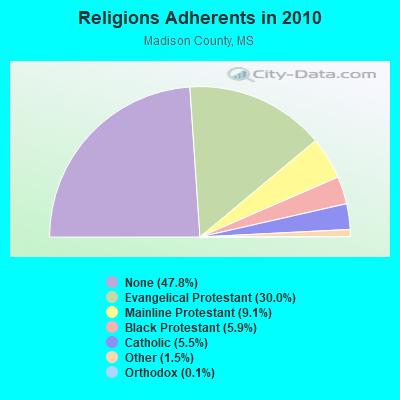
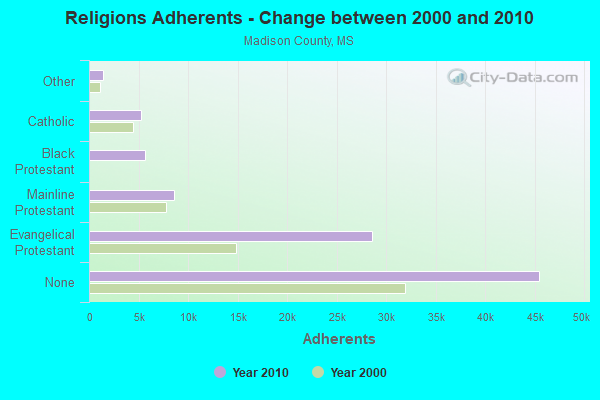
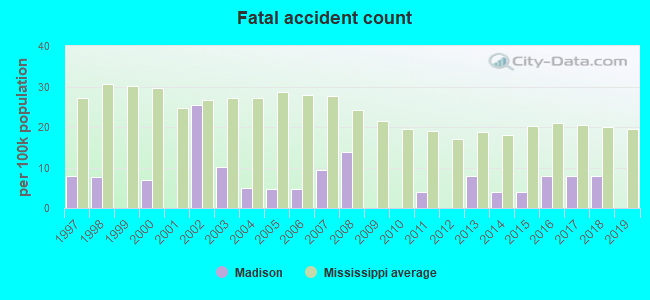
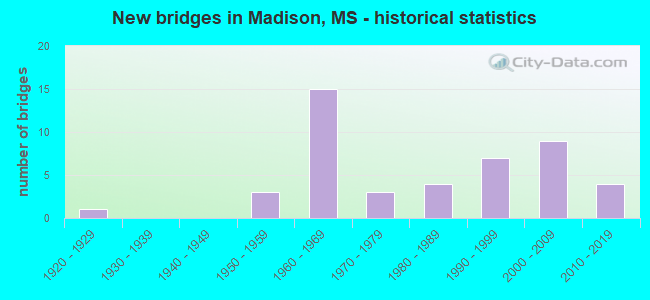

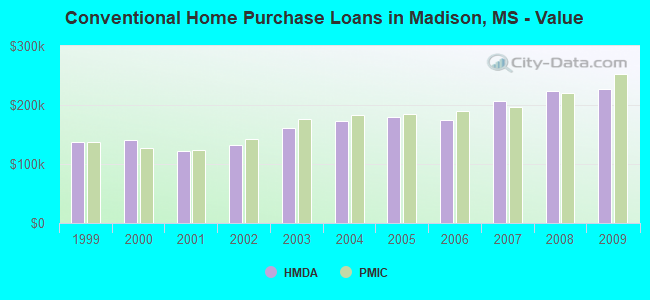
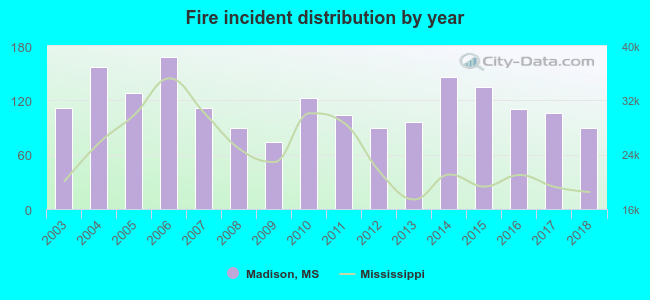 According to the data from the years 2003 - 2018 the average number of fires per year is 115. The highest number of fires - 168 took place in 2006, and the least - 74 in 2009. The data has a decreasing trend.
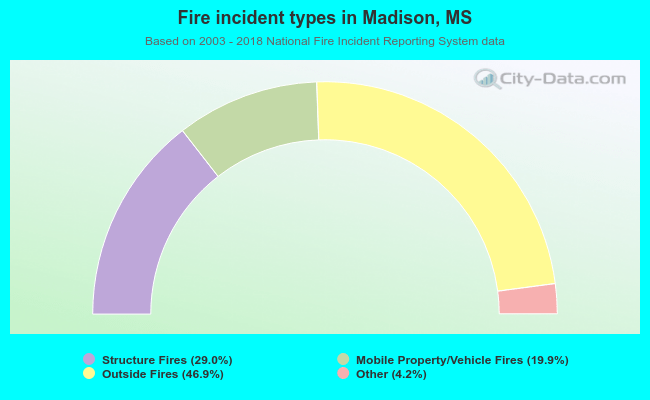 When looking into fire subcategories, the most incidents belonged to: Outside Fires (46.9%), and Structure Fires (29.0%).