Meadow Vista, California Submit your own pictures of this place and show them to the world
OSM Map
General Map
Google Map
MSN Map
OSM Map
General Map
Google Map
MSN Map
OSM Map
General Map
Google Map
MSN Map
OSM Map
General Map
Google Map
MSN Map
Please wait while loading the map...
Population in 2010: 3,217. Population change since 2000: +3.9%Males: 1,588 Females: 1,629
March 2022 cost of living index in Meadow Vista: 103.8 (near average, U.S. average is 100) Percentage of residents living in poverty in 2022: 2.3%Business Search - 14 Million verified businesses
Data:
Median household income ($)
Median household income (% change since 2000)
Household income diversity
Ratio of average income to average house value (%)
Ratio of average income to average rent
Median household income ($) - White
Median household income ($) - Black or African American
Median household income ($) - Asian
Median household income ($) - Hispanic or Latino
Median household income ($) - American Indian and Alaska Native
Median household income ($) - Multirace
Median household income ($) - Other Race
Median household income for houses/condos with a mortgage ($)
Median household income for apartments without a mortgage ($)
Races - White alone (%)
Races - White alone (% change since 2000)
Races - Black alone (%)
Races - Black alone (% change since 2000)
Races - American Indian alone (%)
Races - American Indian alone (% change since 2000)
Races - Asian alone (%)
Races - Asian alone (% change since 2000)
Races - Hispanic (%)
Races - Hispanic (% change since 2000)
Races - Native Hawaiian and Other Pacific Islander alone (%)
Races - Native Hawaiian and Other Pacific Islander alone (% change since 2000)
Races - Two or more races (%)
Races - Two or more races (% change since 2000)
Races - Other race alone (%)
Races - Other race alone (% change since 2000)
Racial diversity
Unemployment (%)
Unemployment (% change since 2000)
Unemployment (%) - White
Unemployment (%) - Black or African American
Unemployment (%) - Asian
Unemployment (%) - Hispanic or Latino
Unemployment (%) - American Indian and Alaska Native
Unemployment (%) - Multirace
Unemployment (%) - Other Race
Population density (people per square mile)
Population - Males (%)
Population - Females (%)
Population - Males (%) - White
Population - Males (%) - Black or African American
Population - Males (%) - Asian
Population - Males (%) - Hispanic or Latino
Population - Males (%) - American Indian and Alaska Native
Population - Males (%) - Multirace
Population - Males (%) - Other Race
Population - Females (%) - White
Population - Females (%) - Black or African American
Population - Females (%) - Asian
Population - Females (%) - Hispanic or Latino
Population - Females (%) - American Indian and Alaska Native
Population - Females (%) - Multirace
Population - Females (%) - Other Race
Coronavirus confirmed cases (Apr 27, 2024)
Deaths caused by coronavirus (Apr 27, 2024)
Coronavirus confirmed cases (per 100k population) (Apr 27, 2024)
Deaths caused by coronavirus (per 100k population) (Apr 27, 2024)
Daily increase in number of cases (Apr 27, 2024)
Weekly increase in number of cases (Apr 27, 2024)
Cases doubled (in days) (Apr 27, 2024)
Hospitalized patients (Apr 18, 2022)
Negative test results (Apr 18, 2022)
Total test results (Apr 18, 2022)
COVID Vaccine doses distributed (per 100k population) (Sep 19, 2023)
COVID Vaccine doses administered (per 100k population) (Sep 19, 2023)
COVID Vaccine doses distributed (Sep 19, 2023)
COVID Vaccine doses administered (Sep 19, 2023)
Likely homosexual households (%)
Likely homosexual households (% change since 2000)
Likely homosexual households - Lesbian couples (%)
Likely homosexual households - Lesbian couples (% change since 2000)
Likely homosexual households - Gay men (%)
Likely homosexual households - Gay men (% change since 2000)
Cost of living index
Median gross rent ($)
Median contract rent ($)
Median monthly housing costs ($)
Median house or condo value ($)
Median house or condo value ($ change since 2000)
Mean house or condo value by units in structure - 1, detached ($)
Mean house or condo value by units in structure - 1, attached ($)
Mean house or condo value by units in structure - 2 ($)
Mean house or condo value by units in structure by units in structure - 3 or 4 ($)
Mean house or condo value by units in structure - 5 or more ($)
Mean house or condo value by units in structure - Boat, RV, van, etc. ($)
Mean house or condo value by units in structure - Mobile home ($)
Median house or condo value ($) - White
Median house or condo value ($) - Black or African American
Median house or condo value ($) - Asian
Median house or condo value ($) - Hispanic or Latino
Median house or condo value ($) - American Indian and Alaska Native
Median house or condo value ($) - Multirace
Median house or condo value ($) - Other Race
Median resident age
Resident age diversity
Median resident age - Males
Median resident age - Females
Median resident age - White
Median resident age - Black or African American
Median resident age - Asian
Median resident age - Hispanic or Latino
Median resident age - American Indian and Alaska Native
Median resident age - Multirace
Median resident age - Other Race
Median resident age - Males - White
Median resident age - Males - Black or African American
Median resident age - Males - Asian
Median resident age - Males - Hispanic or Latino
Median resident age - Males - American Indian and Alaska Native
Median resident age - Males - Multirace
Median resident age - Males - Other Race
Median resident age - Females - White
Median resident age - Females - Black or African American
Median resident age - Females - Asian
Median resident age - Females - Hispanic or Latino
Median resident age - Females - American Indian and Alaska Native
Median resident age - Females - Multirace
Median resident age - Females - Other Race
Commute - mean travel time to work (minutes)
Travel time to work - Less than 5 minutes (%)
Travel time to work - Less than 5 minutes (% change since 2000)
Travel time to work - 5 to 9 minutes (%)
Travel time to work - 5 to 9 minutes (% change since 2000)
Travel time to work - 10 to 19 minutes (%)
Travel time to work - 10 to 19 minutes (% change since 2000)
Travel time to work - 20 to 29 minutes (%)
Travel time to work - 20 to 29 minutes (% change since 2000)
Travel time to work - 30 to 39 minutes (%)
Travel time to work - 30 to 39 minutes (% change since 2000)
Travel time to work - 40 to 59 minutes (%)
Travel time to work - 40 to 59 minutes (% change since 2000)
Travel time to work - 60 to 89 minutes (%)
Travel time to work - 60 to 89 minutes (% change since 2000)
Travel time to work - 90 or more minutes (%)
Travel time to work - 90 or more minutes (% change since 2000)
Marital status - Never married (%)
Marital status - Now married (%)
Marital status - Separated (%)
Marital status - Widowed (%)
Marital status - Divorced (%)
Median family income ($)
Median family income (% change since 2000)
Median non-family income ($)
Median non-family income (% change since 2000)
Median per capita income ($)
Median per capita income (% change since 2000)
Median family income ($) - White
Median family income ($) - Black or African American
Median family income ($) - Asian
Median family income ($) - Hispanic or Latino
Median family income ($) - American Indian and Alaska Native
Median family income ($) - Multirace
Median family income ($) - Other Race
Median year house/condo built
Median year apartment built
Year house built - Built 2005 or later (%)
Year house built - Built 2000 to 2004 (%)
Year house built - Built 1990 to 1999 (%)
Year house built - Built 1980 to 1989 (%)
Year house built - Built 1970 to 1979 (%)
Year house built - Built 1960 to 1969 (%)
Year house built - Built 1950 to 1959 (%)
Year house built - Built 1940 to 1949 (%)
Year house built - Built 1939 or earlier (%)
Average household size
Household density (households per square mile)
Average household size - White
Average household size - Black or African American
Average household size - Asian
Average household size - Hispanic or Latino
Average household size - American Indian and Alaska Native
Average household size - Multirace
Average household size - Other Race
Occupied housing units (%)
Vacant housing units (%)
Owner occupied housing units (%)
Renter occupied housing units (%)
Vacancy status - For rent (%)
Vacancy status - For sale only (%)
Vacancy status - Rented or sold, not occupied (%)
Vacancy status - For seasonal, recreational, or occasional use (%)
Vacancy status - For migrant workers (%)
Vacancy status - Other vacant (%)
Residents with income below the poverty level (%)
Residents with income below 50% of the poverty level (%)
Children below poverty level (%)
Poor families by family type - Married-couple family (%)
Poor families by family type - Male, no wife present (%)
Poor families by family type - Female, no husband present (%)
Poverty status for native-born residents (%)
Poverty status for foreign-born residents (%)
Poverty among high school graduates not in families (%)
Poverty among people who did not graduate high school not in families (%)
Residents with income below the poverty level (%) - White
Residents with income below the poverty level (%) - Black or African American
Residents with income below the poverty level (%) - Asian
Residents with income below the poverty level (%) - Hispanic or Latino
Residents with income below the poverty level (%) - American Indian and Alaska Native
Residents with income below the poverty level (%) - Multirace
Residents with income below the poverty level (%) - Other Race
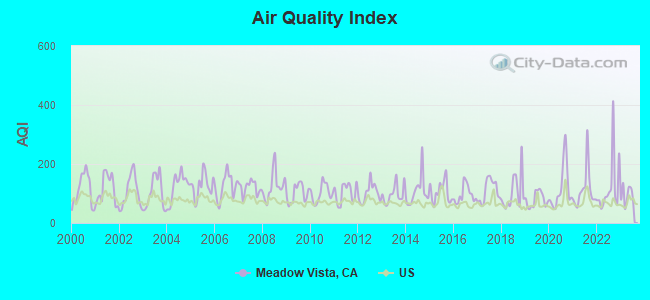
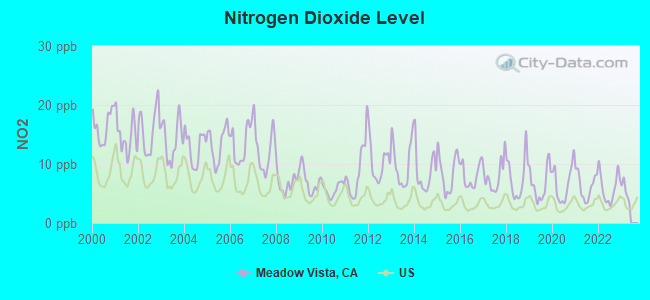
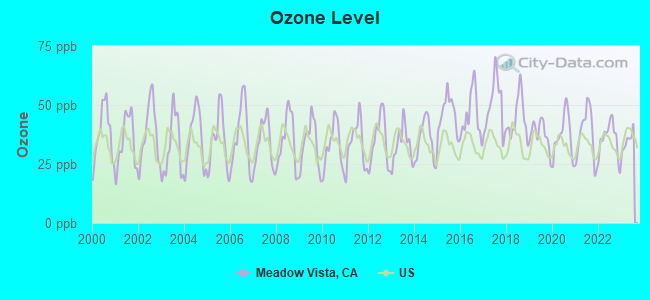
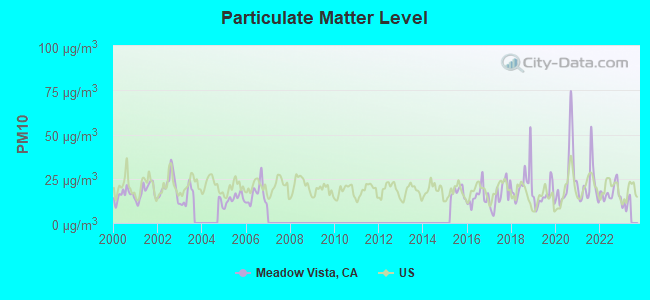
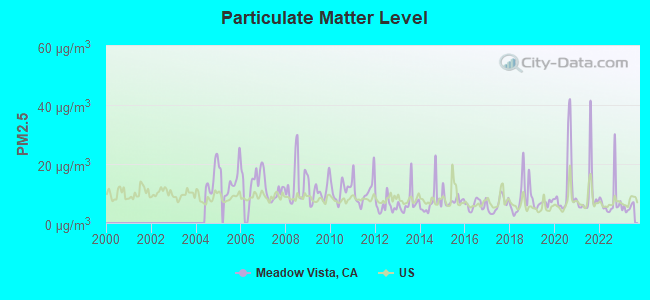
Air pollution - Air Quality Index (AQI)
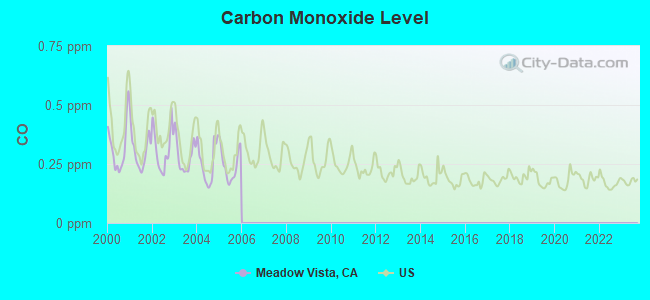
Air pollution - CO
Air pollution - NO2
Air pollution - SO2
Air pollution - Ozone
Air pollution - PM10
Air pollution - PM25
Air pollution - Pb
Crime - Murders per 100,000 population
Crime - Rapes per 100,000 population
Crime - Robberies per 100,000 population
Crime - Assaults per 100,000 population
Crime - Burglaries per 100,000 population
Crime - Thefts per 100,000 population
Crime - Auto thefts per 100,000 population
Crime - Arson per 100,000 population
Crime - City-data.com crime index
Crime - Violent crime index
Crime - Property crime index
Crime - Murders per 100,000 population (5 year average)
Crime - Rapes per 100,000 population (5 year average)
Crime - Robberies per 100,000 population (5 year average)
Crime - Assaults per 100,000 population (5 year average)
Crime - Burglaries per 100,000 population (5 year average)
Crime - Thefts per 100,000 population (5 year average)
Crime - Auto thefts per 100,000 population (5 year average)
Crime - Arson per 100,000 population (5 year average)
Crime - City-data.com crime index (5 year average)
Crime - Violent crime index (5 year average)
Crime - Property crime index (5 year average)
1996 Presidential Elections Results (%) - Democratic Party (Clinton)
1996 Presidential Elections Results (%) - Republican Party (Dole)
1996 Presidential Elections Results (%) - Other
2000 Presidential Elections Results (%) - Democratic Party (Gore)
2000 Presidential Elections Results (%) - Republican Party (Bush)
2000 Presidential Elections Results (%) - Other
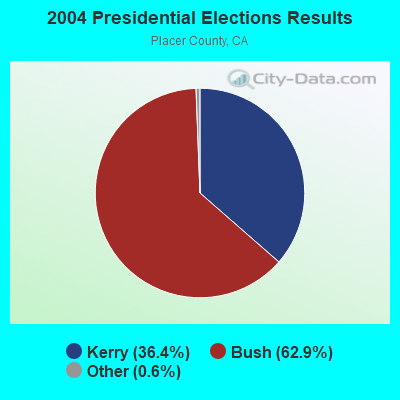
2004 Presidential Elections Results (%) - Democratic Party (Kerry)
2004 Presidential Elections Results (%) - Republican Party (Bush)
2004 Presidential Elections Results (%) - Other
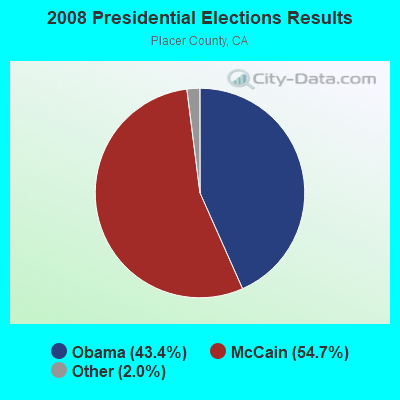
2008 Presidential Elections Results (%) - Democratic Party (Obama)
2008 Presidential Elections Results (%) - Republican Party (McCain)
2008 Presidential Elections Results (%) - Other
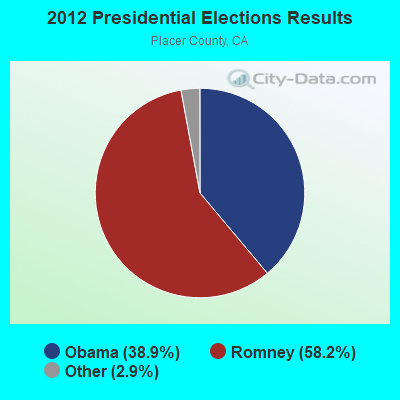
2012 Presidential Elections Results (%) - Democratic Party (Obama)
2012 Presidential Elections Results (%) - Republican Party (Romney)
2012 Presidential Elections Results (%) - Other
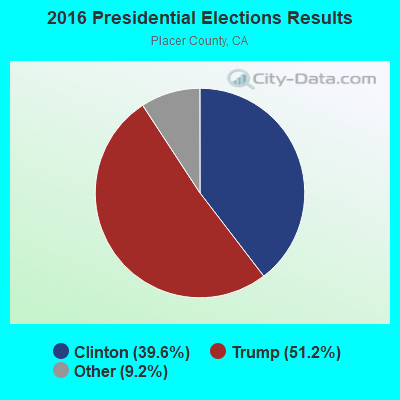
2016 Presidential Elections Results (%) - Democratic Party (Clinton)
2016 Presidential Elections Results (%) - Republican Party (Trump)
2016 Presidential Elections Results (%) - Other
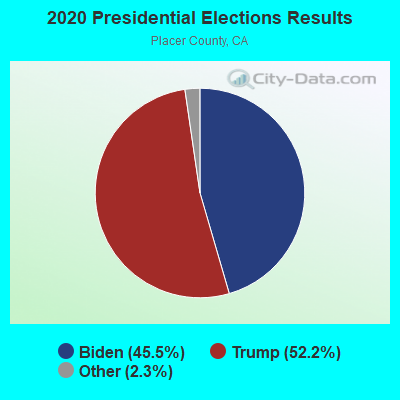
2020 Presidential Elections Results (%) - Democratic Party (Biden)
2020 Presidential Elections Results (%) - Republican Party (Trump)
2020 Presidential Elections Results (%) - Other
Ancestries Reported - Arab (%)
Ancestries Reported - Czech (%)
Ancestries Reported - Danish (%)
Ancestries Reported - Dutch (%)
Ancestries Reported - English (%)
Ancestries Reported - French (%)
Ancestries Reported - French Canadian (%)
Ancestries Reported - German (%)
Ancestries Reported - Greek (%)
Ancestries Reported - Hungarian (%)
Ancestries Reported - Irish (%)
Ancestries Reported - Italian (%)
Ancestries Reported - Lithuanian (%)
Ancestries Reported - Norwegian (%)
Ancestries Reported - Polish (%)
Ancestries Reported - Portuguese (%)
Ancestries Reported - Russian (%)
Ancestries Reported - Scotch-Irish (%)
Ancestries Reported - Scottish (%)
Ancestries Reported - Slovak (%)
Ancestries Reported - Subsaharan African (%)
Ancestries Reported - Swedish (%)
Ancestries Reported - Swiss (%)
Ancestries Reported - Ukrainian (%)
Ancestries Reported - United States (%)
Ancestries Reported - Welsh (%)
Ancestries Reported - West Indian (%)
Ancestries Reported - Other (%)
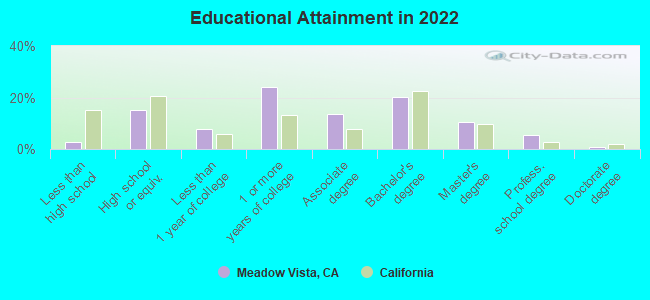
Educational Attainment - No schooling completed (%)
Educational Attainment - Less than high school (%)
Educational Attainment - High school or equivalent (%)
Educational Attainment - Less than 1 year of college (%)
Educational Attainment - 1 or more years of college (%)
Educational Attainment - Associate degree (%)
Educational Attainment - Bachelor's degree (%)
Educational Attainment - Master's degree (%)
Educational Attainment - Professional school degree (%)
Educational Attainment - Doctorate degree (%)
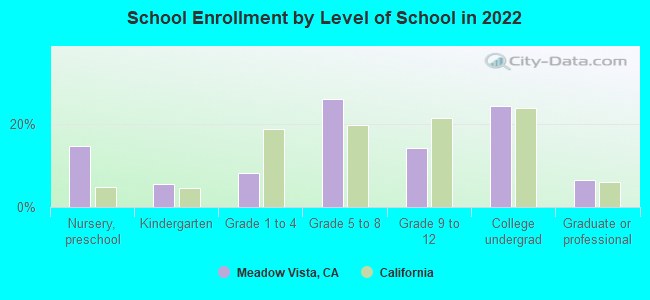
School Enrollment - Nursery, preschool (%)
School Enrollment - Kindergarten (%)
School Enrollment - Grade 1 to 4 (%)
School Enrollment - Grade 5 to 8 (%)
School Enrollment - Grade 9 to 12 (%)
School Enrollment - College undergrad (%)
School Enrollment - Graduate or professional (%)
School Enrollment - Not enrolled in school (%)
School enrollment - Public schools (%)
School enrollment - Private schools (%)
School enrollment - Not enrolled (%)
Median number of rooms in houses and condos
Median number of rooms in apartments
Housing units lacking complete plumbing facilities (%)
Housing units lacking complete kitchen facilities (%)
Density of houses
Urban houses (%)
Rural houses (%)
Households with people 60 years and over (%)
Households with people 65 years and over (%)
Households with people 75 years and over (%)
Households with one or more nonrelatives (%)
Households with no nonrelatives (%)
Population in households (%)
Family households (%)
Nonfamily households (%)
Population in families (%)
Family households with own children (%)
Median number of bedrooms in owner occupied houses
Mean number of bedrooms in owner occupied houses
Median number of bedrooms in renter occupied houses
Mean number of bedrooms in renter occupied houses
Median number of vehichles in owner occupied houses
Mean number of vehichles in owner occupied houses
Median number of vehichles in renter occupied houses
Mean number of vehichles in renter occupied houses
Mortgage status - with mortgage (%)
Mortgage status - with second mortgage (%)
Mortgage status - with home equity loan (%)
Mortgage status - with both second mortgage and home equity loan (%)
Mortgage status - without a mortgage (%)
Average family size
Average family size - White
Average family size - Black or African American
Average family size - Asian
Average family size - Hispanic or Latino
Average family size - American Indian and Alaska Native
Average family size - Multirace
Average family size - Other Race
Geographical mobility - Same house 1 year ago (%)
Geographical mobility - Moved within same county (%)
Geographical mobility - Moved from different county within same state (%)
Geographical mobility - Moved from different state (%)
Geographical mobility - Moved from abroad (%)
Place of birth - Born in state of residence (%)
Place of birth - Born in other state (%)
Place of birth - Native, outside of US (%)
Place of birth - Foreign born (%)
Housing units in structures - 1, detached (%)
Housing units in structures - 1, attached (%)
Housing units in structures - 2 (%)
Housing units in structures - 3 or 4 (%)
Housing units in structures - 5 to 9 (%)
Housing units in structures - 10 to 19 (%)
Housing units in structures - 20 to 49 (%)
Housing units in structures - 50 or more (%)
Housing units in structures - Mobile home (%)
Housing units in structures - Boat, RV, van, etc. (%)
House/condo owner moved in on average (years ago)
Renter moved in on average (years ago)
Year householder moved into unit - Moved in 1999 to March 2000 (%)
Year householder moved into unit - Moved in 1995 to 1998 (%)
Year householder moved into unit - Moved in 1990 to 1994 (%)
Year householder moved into unit - Moved in 1980 to 1989 (%)
Year householder moved into unit - Moved in 1970 to 1979 (%)
Year householder moved into unit - Moved in 1969 or earlier (%)
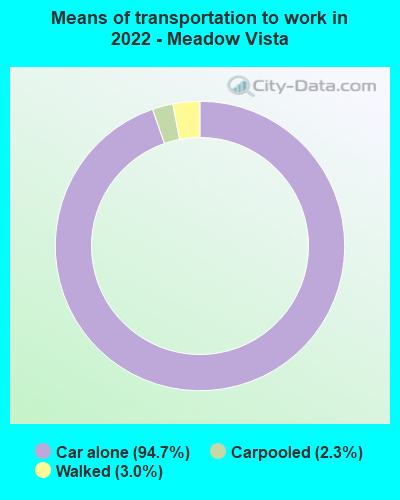
Means of transportation to work - Drove car alone (%)
Means of transportation to work - Carpooled (%)
Means of transportation to work - Public transportation (%)
Means of transportation to work - Bus or trolley bus (%)
Means of transportation to work - Streetcar or trolley car (%)
Means of transportation to work - Subway or elevated (%)
Means of transportation to work - Railroad (%)
Means of transportation to work - Ferryboat (%)
Means of transportation to work - Taxicab (%)
Means of transportation to work - Motorcycle (%)
Means of transportation to work - Bicycle (%)
Means of transportation to work - Walked (%)
Means of transportation to work - Other means (%)
Working at home (%)
Industry diversity
Most Common Industries - Agriculture, forestry, fishing and hunting, and mining (%)
Most Common Industries - Agriculture, forestry, fishing and hunting (%)
Most Common Industries - Mining, quarrying, and oil and gas extraction (%)
Most Common Industries - Construction (%)
Most Common Industries - Manufacturing (%)
Most Common Industries - Wholesale trade (%)
Most Common Industries - Retail trade (%)
Most Common Industries - Transportation and warehousing, and utilities (%)
Most Common Industries - Transportation and warehousing (%)
Most Common Industries - Utilities (%)
Most Common Industries - Information (%)
Most Common Industries - Finance and insurance, and real estate and rental and leasing (%)
Most Common Industries - Finance and insurance (%)
Most Common Industries - Real estate and rental and leasing (%)
Most Common Industries - Professional, scientific, and management, and administrative and waste management services (%)
Most Common Industries - Professional, scientific, and technical services (%)
Most Common Industries - Management of companies and enterprises (%)
Most Common Industries - Administrative and support and waste management services (%)
Most Common Industries - Educational services, and health care and social assistance (%)
Most Common Industries - Educational services (%)
Most Common Industries - Health care and social assistance (%)
Most Common Industries - Arts, entertainment, and recreation, and accommodation and food services (%)
Most Common Industries - Arts, entertainment, and recreation (%)
Most Common Industries - Accommodation and food services (%)
Most Common Industries - Other services, except public administration (%)
Most Common Industries - Public administration (%)
Occupation diversity
Most Common Occupations - Management, business, science, and arts occupations (%)
Most Common Occupations - Management, business, and financial occupations (%)
Most Common Occupations - Management occupations (%)
Most Common Occupations - Business and financial operations occupations (%)
Most Common Occupations - Computer, engineering, and science occupations (%)
Most Common Occupations - Computer and mathematical occupations (%)
Most Common Occupations - Architecture and engineering occupations (%)
Most Common Occupations - Life, physical, and social science occupations (%)
Most Common Occupations - Education, legal, community service, arts, and media occupations (%)
Most Common Occupations - Community and social service occupations (%)
Most Common Occupations - Legal occupations (%)
Most Common Occupations - Education, training, and library occupations (%)
Most Common Occupations - Arts, design, entertainment, sports, and media occupations (%)
Most Common Occupations - Healthcare practitioners and technical occupations (%)
Most Common Occupations - Health diagnosing and treating practitioners and other technical occupations (%)
Most Common Occupations - Health technologists and technicians (%)
Most Common Occupations - Service occupations (%)
Most Common Occupations - Healthcare support occupations (%)
Most Common Occupations - Protective service occupations (%)
Most Common Occupations - Fire fighting and prevention, and other protective service workers including supervisors (%)
Most Common Occupations - Law enforcement workers including supervisors (%)
Most Common Occupations - Food preparation and serving related occupations (%)
Most Common Occupations - Building and grounds cleaning and maintenance occupations (%)
Most Common Occupations - Personal care and service occupations (%)
Most Common Occupations - Sales and office occupations (%)
Most Common Occupations - Sales and related occupations (%)
Most Common Occupations - Office and administrative support occupations (%)
Most Common Occupations - Natural resources, construction, and maintenance occupations (%)
Most Common Occupations - Farming, fishing, and forestry occupations (%)
Most Common Occupations - Construction and extraction occupations (%)
Most Common Occupations - Installation, maintenance, and repair occupations (%)
Most Common Occupations - Production, transportation, and material moving occupations (%)
Most Common Occupations - Production occupations (%)
Most Common Occupations - Transportation occupations (%)
Most Common Occupations - Material moving occupations (%)
People in Group quarters - Institutionalized population (%)
People in Group quarters - Correctional institutions (%)
People in Group quarters - Federal prisons and detention centers (%)
People in Group quarters - Halfway houses (%)
People in Group quarters - Local jails and other confinement facilities (including police lockups) (%)
People in Group quarters - Military disciplinary barracks (%)
People in Group quarters - State prisons (%)
People in Group quarters - Other types of correctional institutions (%)
People in Group quarters - Nursing homes (%)
People in Group quarters - Hospitals/wards, hospices, and schools for the handicapped (%)
People in Group quarters - Hospitals/wards and hospices for chronically ill (%)
People in Group quarters - Hospices or homes for chronically ill (%)
People in Group quarters - Military hospitals or wards for chronically ill (%)
People in Group quarters - Other hospitals or wards for chronically ill (%)
People in Group quarters - Hospitals or wards for drug/alcohol abuse (%)
People in Group quarters - Mental (Psychiatric) hospitals or wards (%)
People in Group quarters - Schools, hospitals, or wards for the mentally retarded (%)
People in Group quarters - Schools, hospitals, or wards for the physically handicapped (%)
People in Group quarters - Institutions for the deaf (%)
People in Group quarters - Institutions for the blind (%)
People in Group quarters - Orthopedic wards and institutions for the physically handicapped (%)
People in Group quarters - Wards in general hospitals for patients who have no usual home elsewhere (%)
People in Group quarters - Wards in military hospitals for patients who have no usual home elsewhere (%)
People in Group quarters - Juvenile institutions (%)
People in Group quarters - Long-term care (%)
People in Group quarters - Homes for abused, dependent, and neglected children (%)
People in Group quarters - Residential treatment centers for emotionally disturbed children (%)
People in Group quarters - Training schools for juvenile delinquents (%)
People in Group quarters - Short-term care, detention or diagnostic centers for delinquent children (%)
People in Group quarters - Type of juvenile institution unknown (%)
People in Group quarters - Noninstitutionalized population (%)
People in Group quarters - College dormitories (includes college quarters off campus) (%)
People in Group quarters - Military quarters (%)
People in Group quarters - On base (%)
People in Group quarters - Barracks, unaccompanied personnel housing (UPH), (Enlisted/Officer), ;and similar group living quarters for military personnel (%)
People in Group quarters - Transient quarters for temporary residents (%)
People in Group quarters - Military ships (%)
People in Group quarters - Group homes (%)
People in Group quarters - Homes or halfway houses for drug/alcohol abuse (%)
People in Group quarters - Homes for the mentally ill (%)
People in Group quarters - Homes for the mentally retarded (%)
People in Group quarters - Homes for the physically handicapped (%)
People in Group quarters - Other group homes (%)
People in Group quarters - Religious group quarters (%)
People in Group quarters - Dormitories (%)
People in Group quarters - Agriculture workers' dormitories on farms (%)
People in Group quarters - Job Corps and vocational training facilities (%)
People in Group quarters - Other workers' dormitories (%)
People in Group quarters - Crews of maritime vessels (%)
People in Group quarters - Other nonhousehold living situations (%)
People in Group quarters - Other noninstitutional group quarters (%)
Residents speaking English at home (%)
Residents speaking English at home - Born in the United States (%)
Residents speaking English at home - Native, born elsewhere (%)
Residents speaking English at home - Foreign born (%)
Residents speaking Spanish at home (%)
Residents speaking Spanish at home - Born in the United States (%)
Residents speaking Spanish at home - Native, born elsewhere (%)
Residents speaking Spanish at home - Foreign born (%)
Residents speaking other language at home (%)
Residents speaking other language at home - Born in the United States (%)
Residents speaking other language at home - Native, born elsewhere (%)
Residents speaking other language at home - Foreign born (%)
Class of Workers - Employee of private company (%)
Class of Workers - Self-employed in own incorporated business (%)
Class of Workers - Private not-for-profit wage and salary workers (%)
Class of Workers - Local government workers (%)
Class of Workers - State government workers (%)
Class of Workers - Federal government workers (%)
Class of Workers - Self-employed workers in own not incorporated business and Unpaid family workers (%)
House heating fuel used in houses and condos - Utility gas (%)
House heating fuel used in houses and condos - Bottled, tank, or LP gas (%)
House heating fuel used in houses and condos - Electricity (%)
House heating fuel used in houses and condos - Fuel oil, kerosene, etc. (%)
House heating fuel used in houses and condos - Coal or coke (%)
House heating fuel used in houses and condos - Wood (%)
House heating fuel used in houses and condos - Solar energy (%)
House heating fuel used in houses and condos - Other fuel (%)
House heating fuel used in houses and condos - No fuel used (%)
House heating fuel used in apartments - Utility gas (%)
House heating fuel used in apartments - Bottled, tank, or LP gas (%)
House heating fuel used in apartments - Electricity (%)
House heating fuel used in apartments - Fuel oil, kerosene, etc. (%)
House heating fuel used in apartments - Coal or coke (%)
House heating fuel used in apartments - Wood (%)
House heating fuel used in apartments - Solar energy (%)
House heating fuel used in apartments - Other fuel (%)
House heating fuel used in apartments - No fuel used (%)
Armed forces status - In Armed Forces (%)
Armed forces status - Civilian (%)
Armed forces status - Civilian - Veteran (%)
Armed forces status - Civilian - Nonveteran (%)
Fatal accidents locations in years 2005-2021
Fatal accidents locations in 2005
Fatal accidents locations in 2006
Fatal accidents locations in 2007
Fatal accidents locations in 2008
Fatal accidents locations in 2009
Fatal accidents locations in 2010
Fatal accidents locations in 2011
Fatal accidents locations in 2012
Fatal accidents locations in 2013
Fatal accidents locations in 2014
Fatal accidents locations in 2015
Fatal accidents locations in 2016
Fatal accidents locations in 2017
Fatal accidents locations in 2018
Fatal accidents locations in 2019
Fatal accidents locations in 2020
Fatal accidents locations in 2021
Alcohol use - People drinking some alcohol every month (%)
Alcohol use - People not drinking at all (%)
Alcohol use - Average days/month drinking alcohol
Alcohol use - Average drinks/week
Alcohol use - Average days/year people drink much
Audiometry - Average condition of hearing (%)
Audiometry - People that can hear a whisper from across a quiet room (%)
Audiometry - People that can hear normal voice from across a quiet room (%)
Audiometry - Ears ringing, roaring, buzzing (%)
Audiometry - Had a job exposure to loud noise (%)
Audiometry - Had off-work exposure to loud noise (%)
Blood Pressure & Cholesterol - Has high blood pressure (%)
Blood Pressure & Cholesterol - Checking blood pressure at home (%)
Blood Pressure & Cholesterol - Frequently checking blood cholesterol (%)
Blood Pressure & Cholesterol - Has high cholesterol level (%)
Consumer Behavior - Money monthly spent on food at supermarket/grocery store
Consumer Behavior - Money monthly spent on food at other stores
Consumer Behavior - Money monthly spent on eating out
Consumer Behavior - Money monthly spent on carryout/delivered foods
Consumer Behavior - Income spent on food at supermarket/grocery store (%)
Consumer Behavior - Income spent on food at other stores (%)
Consumer Behavior - Income spent on eating out (%)
Consumer Behavior - Income spent on carryout/delivered foods (%)
Current Health Status - General health condition (%)
Current Health Status - Blood donors (%)
Current Health Status - Has blood ever tested for HIV virus (%)
Current Health Status - Left-handed people (%)
Dermatology - People using sunscreen (%)
Diabetes - Diabetics (%)
Diabetes - Had a blood test for high blood sugar (%)
Diabetes - People taking insulin (%)
Diet Behavior & Nutrition - Diet health (%)
Diet Behavior & Nutrition - Milk product consumption (# of products/month)
Diet Behavior & Nutrition - Meals not home prepared (#/week)
Diet Behavior & Nutrition - Meals from fast food or pizza place (#/week)
Diet Behavior & Nutrition - Ready-to-eat foods (#/month)
Diet Behavior & Nutrition - Frozen meals/pizza (#/month)
Drug Use - People that ever used marijuana or hashish (%)
Drug Use - Ever used hard drugs (%)
Drug Use - Ever used any form of cocaine (%)
Drug Use - Ever used heroin (%)
Drug Use - Ever used methamphetamine (%)
Health Insurance - People covered by health insurance (%)
Kidney Conditions-Urology - Avg. # of times urinating at night
Medical Conditions - People with asthma (%)
Medical Conditions - People with anemia (%)
Medical Conditions - People with psoriasis (%)
Medical Conditions - People with overweight (%)
Medical Conditions - Elderly people having difficulties in thinking or remembering (%)
Medical Conditions - People who ever received blood transfusion (%)
Medical Conditions - People having trouble seeing even with glass/contacts (%)
Medical Conditions - People with arthritis (%)
Medical Conditions - People with gout (%)
Medical Conditions - People with congestive heart failure (%)
Medical Conditions - People with coronary heart disease (%)
Medical Conditions - People with angina pectoris (%)
Medical Conditions - People who ever had heart attack (%)
Medical Conditions - People who ever had stroke (%)
Medical Conditions - People with emphysema (%)
Medical Conditions - People with thyroid problem (%)
Medical Conditions - People with chronic bronchitis (%)
Medical Conditions - People with any liver condition (%)
Medical Conditions - People who ever had cancer or malignancy (%)
Mental Health - People who have little interest in doing things (%)
Mental Health - People feeling down, depressed, or hopeless (%)
Mental Health - People who have trouble sleeping or sleeping too much (%)
Mental Health - People feeling tired or having little energy (%)
Mental Health - People with poor appetite or overeating (%)
Mental Health - People feeling bad about themself (%)
Mental Health - People who have trouble concentrating on things (%)
Mental Health - People moving or speaking slowly or too fast (%)
Mental Health - People having thoughts they would be better off dead (%)
Oral Health - Average years since last visit a dentist
Oral Health - People embarrassed because of mouth (%)
Oral Health - People with gum disease (%)
Oral Health - General health of teeth and gums (%)
Oral Health - Average days a week using dental floss/device
Oral Health - Average days a week using mouthwash for dental problem
Oral Health - Average number of teeth
Pesticide Use - Households using pesticides to control insects (%)
Pesticide Use - Households using pesticides to kill weeds (%)
Physical Activity - People doing vigorous-intensity work activities (%)
Physical Activity - People doing moderate-intensity work activities (%)
Physical Activity - People walking or bicycling (%)
Physical Activity - People doing vigorous-intensity recreational activities (%)
Physical Activity - People doing moderate-intensity recreational activities (%)
Physical Activity - Average hours a day doing sedentary activities
Physical Activity - Average hours a day watching TV or videos
Physical Activity - Average hours a day using computer
Physical Functioning - People having limitations keeping them from working (%)
Physical Functioning - People limited in amount of work they can do (%)
Physical Functioning - People that need special equipment to walk (%)
Physical Functioning - People experiencing confusion/memory problems (%)
Physical Functioning - People requiring special healthcare equipment (%)
Prescription Medications - Average number of prescription medicines taking
Preventive Aspirin Use - Adults 40+ taking low-dose aspirin (%)
Reproductive Health - Vaginal deliveries (%)
Reproductive Health - Cesarean deliveries (%)
Reproductive Health - Deliveries resulted in a live birth (%)
Reproductive Health - Pregnancies resulted in a delivery (%)
Reproductive Health - Women breastfeeding newborns (%)
Reproductive Health - Women that had a hysterectomy (%)
Reproductive Health - Women that had both ovaries removed (%)
Reproductive Health - Women that have ever taken birth control pills (%)
Reproductive Health - Women taking birth control pills (%)
Reproductive Health - Women that have ever used Depo-Provera or injectables (%)
Reproductive Health - Women that have ever used female hormones (%)
Sexual Behavior - People 18+ that ever had sex (vaginal, anal, or oral) (%)
Sexual Behavior - Males 18+ that ever had vaginal sex with a woman (%)
Sexual Behavior - Males 18+ that ever performed oral sex on a woman (%)
Sexual Behavior - Males 18+ that ever had anal sex with a woman (%)
Sexual Behavior - Males 18+ that ever had any sex with a man (%)
Sexual Behavior - Females 18+ that ever had vaginal sex with a man (%)
Sexual Behavior - Females 18+ that ever performed oral sex on a man (%)
Sexual Behavior - Females 18+ that ever had anal sex with a man (%)
Sexual Behavior - Females 18+ that ever had any kind of sex with a woman (%)
Sexual Behavior - Average age people first had sex
Sexual Behavior - Average number of female sex partners in lifetime (males 18+)
Sexual Behavior - Average number of female vaginal sex partners in lifetime (males 18+)
Sexual Behavior - Average age people first performed oral sex on a woman (18+)
Sexual Behavior - Average number of woman performed oral sex on in lifetime (18+)
Sexual Behavior - Average number of male sex partners in lifetime (males 18+)
Sexual Behavior - Average number of male anal sex partners in lifetime (males 18+)
Sexual Behavior - Average age people first performed oral sex on a man (18+)
Sexual Behavior - Average number of male oral sex partners in lifetime (18+)
Sexual Behavior - People using protection when performing oral sex (%)
Sexual Behavior - Average number of times people have vaginal or anal sex a year
Sexual Behavior - People having sex without condom (%)
Sexual Behavior - Average number of male sex partners in lifetime (females 18+)
Sexual Behavior - Average number of male vaginal sex partners in lifetime (females 18+)
Sexual Behavior - Average number of female sex partners in lifetime (females 18+)
Sexual Behavior - Circumcised males 18+ (%)
Sleep Disorders - Average hours sleeping at night
Sleep Disorders - People that has trouble sleeping (%)
Smoking-Cigarette Use - People smoking cigarettes (%)
Taste & Smell - People 40+ having problems with smell (%)
Taste & Smell - People 40+ having problems with taste (%)
Taste & Smell - People 40+ that ever had wisdom teeth removed (%)
Taste & Smell - People 40+ that ever had tonsils teeth removed (%)
Taste & Smell - People 40+ that ever had a loss of consciousness because of a head injury (%)
Taste & Smell - People 40+ that ever had a broken nose or other serious injury to face or skull (%)
Taste & Smell - People 40+ that ever had two or more sinus infections (%)
Weight - Average height (inches)
Weight - Average weight (pounds)
Weight - Average BMI
Weight - People that are obese (%)
Weight - People that ever were obese (%)
Weight - People trying to lose weight (%)
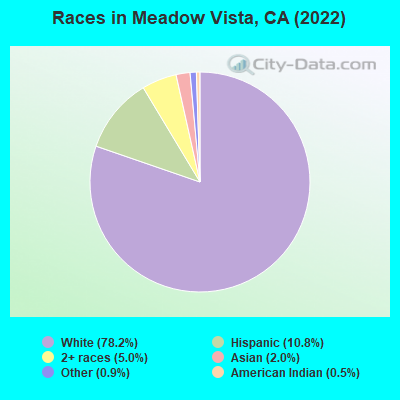
2,884 78.2% White alone 397 10.8% Hispanic 183 5.0% Two or more races 75 2.0% Asian alone 32 0.9% Other race alone 18 0.5% American Indian alone
Latest news from Meadow Vista, CA collected exclusively by city-data.com from local newspapers, TV, and radio stations
Ancestries: German (16.5%), English (15.6%), European (13.9%), French Canadian (5.8%), Scottish (3.4%), American (3.1%).
Current Local Time:
Land area: 5.37 square miles.
Population density: 599 people per square mile (low).
136 residents are foreign born (2.1% Asia , 1.2% Europe ).
This place:
3.7%California:
26.5%
Median real estate property taxes paid for housing units with mortgages in 2022: $4,108 (0.6%)Median real estate property taxes paid for housing units with no mortgage in 2022: $1,809 (0.3%)
Nearest city with pop. 50,000+: Loomis Basin-Folsom Lake, CA
Nearest city with pop. 200,000+: Sacramento, CA
Nearest city with pop. 1,000,000+: Los Angeles, CA
Nearest cities:
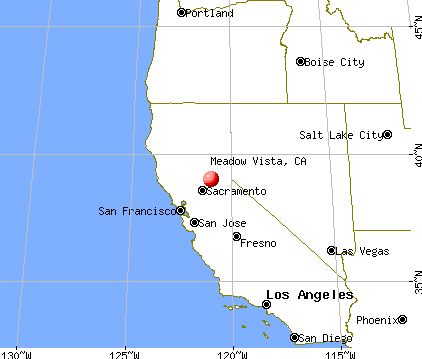
Latitude: 39.00 N, Longitude: 121.03 W
Area code commonly used in this area: 530
Unemployment in December 2023:
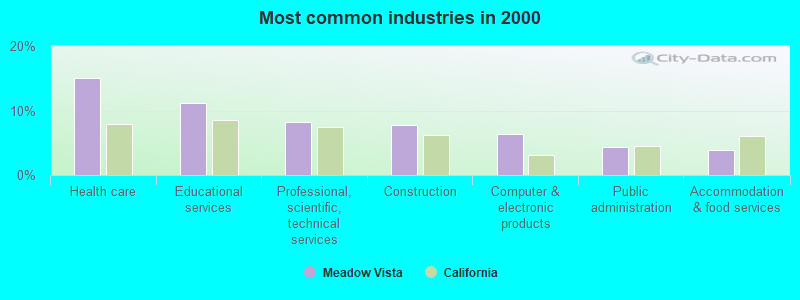
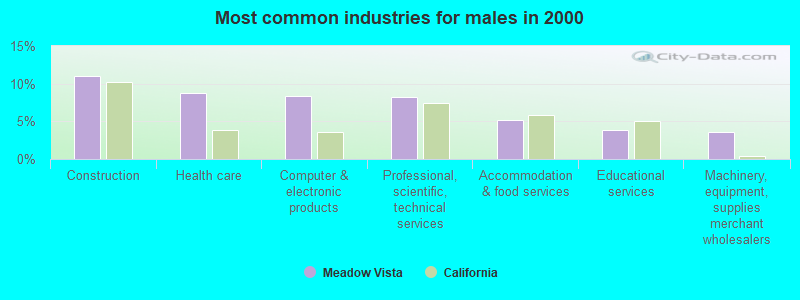
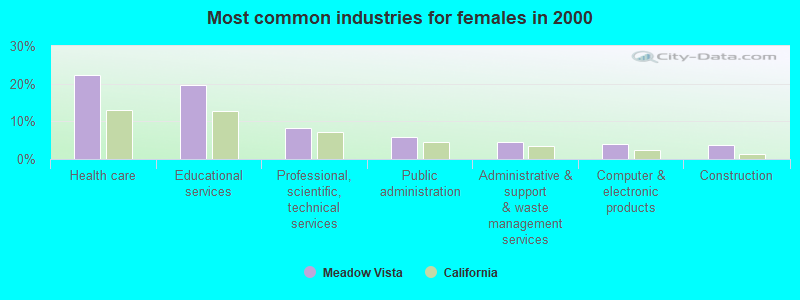
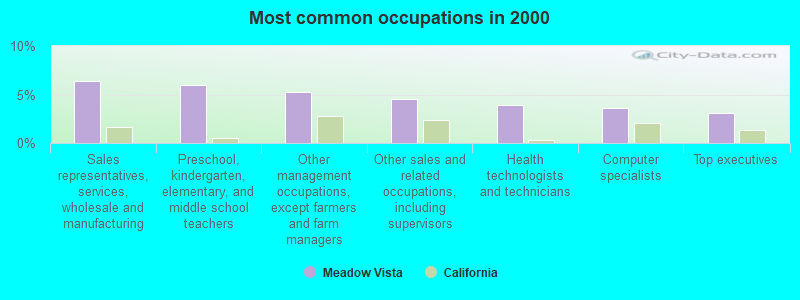
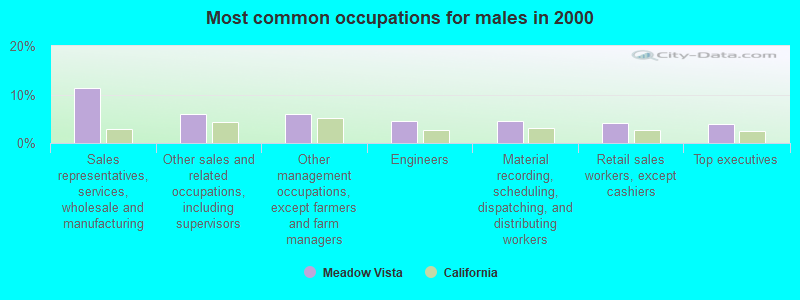
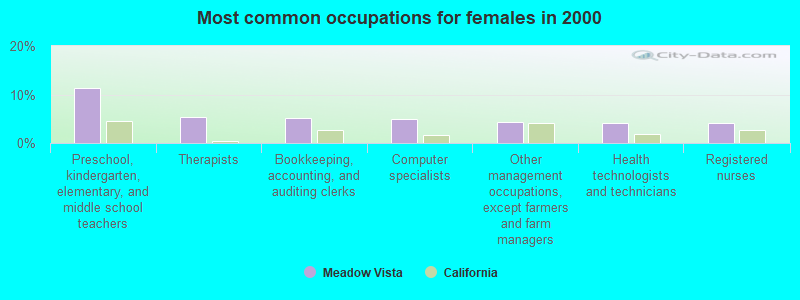
Most common occupations in Meadow Vista, CA (%)
Both Males Females
Sales representatives, services, wholesale and manufacturing (6.4%)
Preschool, kindergarten, elementary, and middle school teachers (6.0%)
Other management occupations, except farmers and farm managers (5.2%)
Other sales and related occupations, including supervisors (4.5%)
Health technologists and technicians (3.9%)
Computer specialists (3.6%)
Top executives (3.1%)
Sales representatives, services, wholesale and manufacturing (11.3%)
Other sales and related occupations, including supervisors (6.0%)
Other management occupations, except farmers and farm managers (6.0%)
Engineers (4.5%)
Material recording, scheduling, dispatching, and distributing workers (4.5%)
Retail sales workers, except cashiers (4.0%)
Top executives (3.9%)
Preschool, kindergarten, elementary, and middle school teachers (11.4%)
Therapists (5.5%)
Bookkeeping, accounting, and auditing clerks (5.2%)
Computer specialists (4.9%)
Other management occupations, except farmers and farm managers (4.3%)
Health technologists and technicians (4.2%)
Registered nurses (4.0%)
Earthquake activity:
Meadow Vista-area historical earthquake activity is significantly above California state average. It is 7390% greater than the overall U.S. average. On 4/18/1906 at 13:12:21, a magnitude 7.9 (7.9 UK, Class: Major, Intensity: VIII - XII) earthquake occurred 127.3 miles away from the city center, causing $524,000,000 total damage On 10/3/1915 at 06:52:48, a magnitude 7.6 (7.6 UK) earthquake occurred 214.3 miles away from the city center On 10/18/1989 at 00:04:15, a magnitude 7.1 (6.5 MB, 7.1 MS, 6.9 MW, 7.0 ML) earthquake occurred 137.1 miles away from the city center, causing 62 deaths ( 62 shaking deaths) and 3757 injuries, causing $1,305,032,704 total damage On 12/21/1932 at 06:10:09, a magnitude 7.2 (7.2 UK) earthquake occurred 162.5 miles away from the city center On 1/31/1922 at 13:17:28, a magnitude 7.6 (7.6 UK) earthquake occurred 267.3 miles away from the city center On 7/21/1952 at 11:52:14, a magnitude 7.7 (7.7 UK) earthquake occurred 298.7 miles away from Meadow Vista center, causing $50,000,000 total damage Magnitude types: body-wave magnitude (MB), local magnitude (ML), surface-wave magnitude (MS), moment magnitude (MW) Natural disasters: The number of natural disasters in Placer County (17) is near the US average (15).Major Disasters (Presidential) Declared: 9Emergencies Declared: 2Floods: 10, Storms: 6, Fires: 4, Landslides: 4, Mudslides: 3, Winter Storms: 3, Drought: 1, Heavy Rain: 1, Hurricane: 1, Tornado: 1, Other: 1 (Note: some incidents may be assigned to more than one category). Hospitals and medical centers near Meadow Vista: WESTVIEW HEALTHCARE CENTER (Nursing Home, about 6 miles away; AUBURN, CA)
RCCA - LOVE WAY (Hospital, about 6 miles away; AUBURN, CA)
SUTTER AUBURN FAITH HOSPITAL (about 6 miles away; AUBURN, CA)
SUTTER VNA AUBURN (Hospital, about 6 miles away; AUBURN, CA)
SUTTER AUBURN FAITH VNA AND HOSPICE (Home Health Center, about 6 miles away; AUBURN, CA)
KINDRED TRANSITIONAL CARE AND REHABILITATION - SIENA (Nursing Home, about 6 miles away; AUBURN, CA)
AUBURN DIALYSIS CENTER (Dialysis Facility, about 6 miles away; AUBURN, CA)
Amtrak stations near Meadow Vista: 2 miles: LAKE OF THE PINES JCT. (LAKE OF THE PINES JC, COMBIE DELI, 10536 COMBIE RD.) - Bus Station Services: fully wheelchair accessible, public restrooms, public payphones, snack bar, call for taxi service.
8 miles: AUBURN (NEVADA & FULWEILER STS.) - Bus Station Services: fully wheelchair accessible, public payphones, free short-term parking.
8 miles: COLFAX (CHURCH ST. & SP TRACKS) Services: partially wheelchair accessible, free short-term parking, free long-term parking.
Colleges/universities with over 2000 students nearest to Meadow Vista:
Sierra College (about 18 miles; Rocklin, CA ; Full-time enrollment: 11,488)
Folsom Lake College (about 25 miles; Folsom, CA ; FT enrollment: 5,308)
Yuba College (about 29 miles; Marysville, CA ; FT enrollment: 4,737)
American River College (about 30 miles; Sacramento, CA ; FT enrollment: 20,452)
Universal Technical Institute of Northern California Inc (about 37 miles; Sacramento, CA ; FT enrollment: 3,193)
California State University-Sacramento (about 38 miles; Sacramento, CA ; FT enrollment: 22,234)
University of Phoenix-Sacramento Valley Campus (about 38 miles; Sacramento, CA ; FT enrollment: 2,855)
Public elementary/middle school in Meadow Vista:
Private elementary/middle school in Meadow Vista: LIVE OAK WALDORF SCHOOL Students: 190, Location: 410 CROTHER RD, Grades: PK-8)
See full list of schools located in Meadow Vista Placer County has a predicted average indoor radon screening level between 2 and 4 pCi/L (pico curies per liter) - Moderate Potential Drinking water stations with addresses in Meadow Vista and their reported violations in the past:
DONNER MINE CAMP INC. WATER SYSTEM (Population served: 100, Groundwater):
Past monitoring violations:
2 routine major monitoring violations
Average household size: This place:
2.6 peopleCalifornia:
2.9 people
Percentage of family households: This place:
76.6%Whole state:
68.7%
Percentage of households with unmarried partners: This place:
4.4%Whole state:
7.2%
Likely homosexual households (counted as self-reported same-sex unmarried-partner households)
Lesbian couples: 0.3% of all households Gay men: 0.2% of all households
16 people in group homes intended for adults in 2010
Banks with branches in Meadow Vista (2011 data):
Wells Fargo Bank, National Association: Meadow Vista Branch at 16800 Placer Hills Road, branch established on 1946/01/01. Info updated 2011/04/05: Bank assets: $1,161,490.0 mil, Deposits: $905,653.0 mil, headquarters in Sioux Falls, SD, positive income , 6395 total offices , Holding Company: Wells Fargo & Company
For population 15 years and over in Meadow Vista:
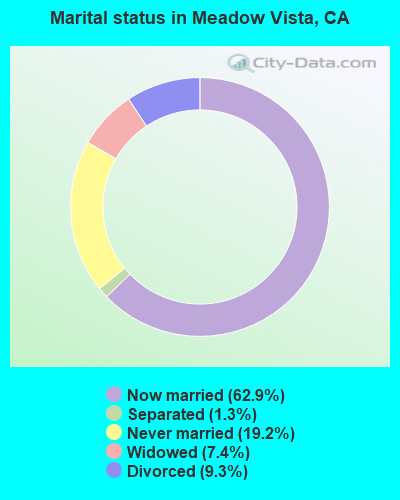
Never married: 19.2%Now married: 62.9%Separated: 1.3%Widowed: 7.4%Divorced: 9.3% For population 25 years and over in Meadow Vista:
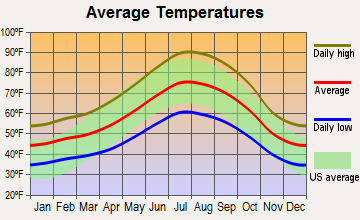
High school or higher: 96.3%Bachelor's degree or higher: 37.3%Graduate or professional degree: 16.2%Unemployed: 3.9%Mean travel time to work (commute): 24.1 minutes
Education Gini index (Inequality in education) Here:
8.4California average:
15.5
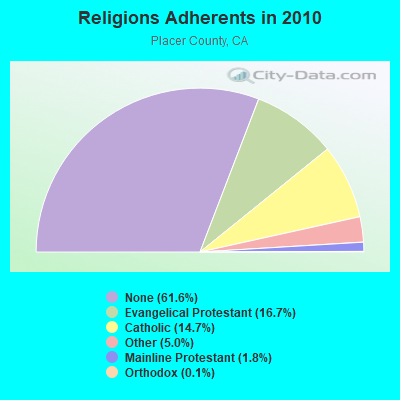
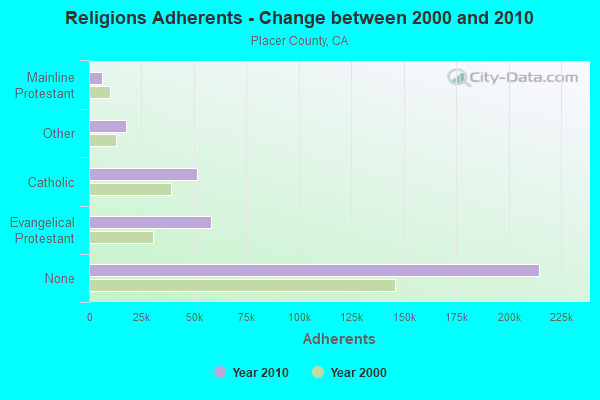
Religion statistics for Meadow Vista, CA (based on Placer County data)
Religion Adherents Congregations Evangelical Protestant 58,135 153 Catholic 51,342 12 Other 17,462 57 Mainline Protestant 6,376 30 Orthodox 400 1 None 214,717 -
Source: Clifford Grammich, Kirk Hadaway, Richard Houseal, Dale E.Jones, Alexei Krindatch, Richie Stanley and Richard H.Taylor. 2012. 2010 U.S.Religion Census: Religious Congregations & Membership Study. Association of Statisticians of American Religious Bodies. Jones, Dale E., et al. 2002. Congregations and Membership in the United States 2000. Nashville, TN: Glenmary Research Center. Graphs represent county-level data
Food Environment Statistics: Number of grocery stores : 55This county :
1.66 / 10,000 pop.State :
2.14 / 10,000 pop.
Number of supercenters and club stores : 2Placer County :
0.06 / 10,000 pop.California :
0.04 / 10,000 pop.
Number of convenience stores (no gas) : 20Placer County :
0.60 / 10,000 pop.State :
0.62 / 10,000 pop.
Number of convenience stores (with gas) : 74Placer County :
2.23 / 10,000 pop.California :
1.49 / 10,000 pop.
Number of full-service restaurants : 299Here :
9.00 / 10,000 pop.State :
7.42 / 10,000 pop.
Adult diabetes rate : Placer County :
6.7%California :
7.3%
Adult obesity rate : Here :
17.6%California :
21.3%
Low-income preschool obesity rate : This county :
14.5%State :
17.9%
Health and Nutrition: Healthy diet rate : Meadow Vista:
53.4%State:
49.4%
Average overall health of teeth and gums : Meadow Vista:
51.2%California:
48.0%
Average BMI : Meadow Vista:
28.7California:
28.1
People feeling badly about themselves : People not drinking alcohol at all : Here:
8.4%California:
11.2%
Average hours sleeping at night : Overweight people : Meadow Vista:
37.6%California:
31.5%
General health condition : This city:
59.0%California:
56.4%
Average condition of hearing : Meadow Vista:
77.8%State:
80.9%
More about Health and Nutrition of Meadow Vista, CA Residents
9.43% of this county's 2021 resident taxpayers lived in other counties in 2020 ($99,508 average adjusted gross income )
Here:
9.43%California average:
5.19%
0.03% of residents moved from foreign countries ($239 average AGI )Placer County:
0.03%California average:
0.03%
Top counties from which taxpayers relocated into this county between 2020 and 2021:
8.04% of this county's 2020 resident taxpayers moved to other counties in 2021 ($95,121 average adjusted gross income )
Here:
8.04%California average:
6.14%
0.03% of residents moved to foreign countries ($247 average AGI )Placer County:
0.03%California average:
0.02%
Top counties to which taxpayers relocated from this county between 2020 and 2021: Businesses in Meadow Vista, CA
Curves: 1True Value: 1U-Haul: 1 Strongest AM radio stations in Meadow Vista:
KAHI (950 AM; 10 kW; AUBURN, CA; Owner: IHR EDUCATIONAL BROADCASTING)
KFIA (710 AM; 25 kW; CARMICHAEL, CA; Owner: VISTA BROADCASTING INC.)
KFBK (1530 AM; 50 kW; SACRAMENTO, CA; Owner: AMFM RADIO LICENSES, L.L.C.)
KNCO (830 AM; 5 kW; GRASS VALLEY, CA; Owner: NEVADA COUNTY BROADCASTERS, INC.)
KSTE (650 AM; 25 kW; RANCHO CORDOVA, CA; Owner: AMFM RADIO LICENSES, L.L.C.)
KHTK (1140 AM; 50 kW; SACRAMENTO, CA; Owner: INFINITY RADIO SUBSIDIARY OPERATIONS INC.)
KLIB (1110 AM; 10 kW; ROSEVILLE, CA; Owner: WAY BROADCASTING, INC.)
KFSG (1690 AM; 10 kW; ROSEVILLE, CA; Owner: WAY BROADCASTING, INC.)
KKOH (780 AM; 50 kW; RENO, NV; Owner: CITADEL BROADCASTING COMPANY)
KCBC (770 AM; 50 kW; RIVERBANK, CA; Owner: KIERTRON, INC.)
KCBS (740 AM; 50 kW; SAN FRANCISCO, CA; Owner: INFINITY BROADCASTING OPERATIONS, INC.)
KTRB (860 AM; 50 kW; MODESTO, CA; Owner: PAPPAS RADIO OF CALIFORNIA, A CALIFORNIA LIMITED PARTNERSHIP)
KNBR (680 AM; 50 kW; SAN FRANCISCO, CA; Owner: KNBR LICO, INC.)
Strongest FM radio stations in Meadow Vista:
KXCL (103.9 FM; YUBA CITY, CA; Owner: HARLAN COMMUNICATIONS, INC.)
KHYL (101.1 FM; AUBURN, CA; Owner: AMFM RADIO LICENSES, L.L.C.)
KVMR (89.5 FM; NEVADA CITY, CA; Owner: NEVADA CITY COMMUNITY BROADCAST GRUP)
KLVS (99.3 FM; GRASS VALLEY, CA; Owner: EDUCATIONAL MEDIA FOUNDATION)
KNCO-FM (94.1 FM; GRASS VALLEY, CA; Owner: NEVADA COUNTY BROADCASTERS, INC.)
KRCX-FM (99.9 FM; MARYSVILLE, CA; Owner: ENTRAVISION HOLDINGS, LLC)
KWYL (102.9 FM; SOUTH LAKE TAHOE, CA; Owner: CITADEL BROADCASTING COMPANY)
KMJE (101.5 FM; GRIDLEY, CA; Owner: RESULTS RADIO LICENSEE, LLC)
K213BZ (90.5 FM; RICHVALE, CA; Owner: FAMILY STATIONS, INC.)
KRNO (106.9 FM; INCLINE VILLAGE, NV; Owner: AMERICOM LAS VEGAS LIMITED PARTNERSHIP)
KODS (103.7 FM; CARNELIAN BAY, CA; Owner: AMERICOM, A CALIFORNIA LIMITED PARTNERSHIP)
KTHX-FM (100.1 FM; DAYTON, NV; Owner: NM LICENSING, LLC)
KLCA (96.5 FM; TAHOE CITY, CA; Owner: AMERICOM LAS VEGAS LIMITED PARTNERSHIP)
KKTO (90.5 FM; TAHOE CITY, CA; Owner: CALIFORNIA STATE UNIVERSITY)
KDOT (104.5 FM; RENO, NV; Owner: LOTUS RADIO CORP.)
KOZZ-FM (105.7 FM; RENO, NV; Owner: LOTUS RADIO CORP.)
KTKE (101.5 FM; TRUCKEE, CA; Owner: TRUCKSTER BROADCASTING, INC.)
KHGQ (100.3 FM; QUINCY, CA; Owner: KEILY MILLER)
KCCL-FM (101.9 FM; SHINGLE SPRINGS, CA; Owner: ENTRAVISION HOLDINGS, LLC)
KKCY (103.1 FM; COLUSA, CA; Owner: RESULTS RADIO LICENSEE, LLC)
TV broadcast stations around Meadow Vista:
KMMK-LP (Channel 14; SACRAMENTO, CA; Owner: CABALLERO TELEVISION TEXAS, L.L.C.)
KEZT-CA (Channel 23; SACRAMENTO, CA; Owner: TELEFUTURA SACRAMENTO LLC)
KSPX (Channel 29; SACRAMENTO, CA; Owner: PAXSON SACRAMENTO LICENSE, INC.)
KTXL (Channel 40; SACRAMENTO, CA; Owner: CHANNEL 40, INC.)
KQCA (Channel 58; STOCKTON, CA; Owner: KCRA HEARST-ARGYLE TELEVISION, INC.)
KOVR (Channel 13; STOCKTON, CA; Owner: SCI - SACRAMENTO LICENSEE, LLC)
KXTV (Channel 10; SACRAMENTO, CA; Owner: KXTV, INC.)
KUVS (Channel 19; MODESTO, CA; Owner: KUVS LICENSE PARTNERSHIP, G.P.)
KVIE (Channel 6; SACRAMENTO, CA; Owner: KVIE, INC.)
KMAX-TV (Channel 31; SACRAMENTO, CA; Owner: UPN STATIONS GROUP INC.)
K27FX (Channel 27; EUREKA, CA; Owner: MS COMMUNICATIONS, LLC)
KGTN-LP (Channel 62; PLACERVILLE, CA; Owner: PRAISE THE LORD STUDIO CHAPEL)
K22FR (Channel 22; SACRAMENTO, CA; Owner: NATIONAL MINORITY T.V., INC.)
K27EU (Channel 27; SACRAMENTO, CA; Owner: ABUNDANT LIFE BROADCASTING, INC.)
K16CX (Channel 16; GRASS VALLEY, CA; Owner: SIERRA JOINT JR. COLLEGE DISTRICT)
Meadow Vista fatal accident statistics for 1975 - 2021
Meadow Vista fatal accident list:
Jun 4, 2006 09:15 PM, Placer Hills Rd, Lat: 39.013590, Lon: -121.004620, Vehicles: 1, Persons: 1, Fatalities: 1, Drunk persons involved: 1
FCC Registered Antenna Towers: 32 (
See the full list of FCC Registered Antenna Towers in Meadow Vista )
FCC Registered Broadcast Land Mobile Towers: 2
Volly Rd & Placer Hills Rd (Lat: 39.001000 Lon: -121.022722), Call Sign: KJR202, Assigned Frequencies: 154.355 MHz, Grant Date: 06/07/2014, Expiration Date: 06/14/2024, Registrant: Placer Hills Fire Protection District, Meadow Vista, CA 95722, Phone: (530) 878-0405 Lat: 38.988917 Lon: -121.047861, Call Sign: WQOE845, Assigned Frequencies: 462.237 MHz, 467.237 MHz, 462.262 MHz, 467.262 MHz, Grant Date: 12/20/2021, Expiration Date: 12/29/2030, Certifier: Jeremy Payne, Registrant: Winchester Golf, LLC, 3030 Legends Drive, Meadow Vista, CA 95722, Phone: (530) 878-3003, Fax: (530) 878-9515, Email:
FCC Registered Microwave Towers: 9 (
See the full list of FCC Registered Microwave Towers in this town )
FCC Registered Amateur Radio Licenses: 108 (
See the full list of FCC Registered Amateur Radio Licenses in Meadow Vista )
FAA Registered Aircraft: 13 (
See the full list of FAA Registered Aircraft in Meadow Vista )
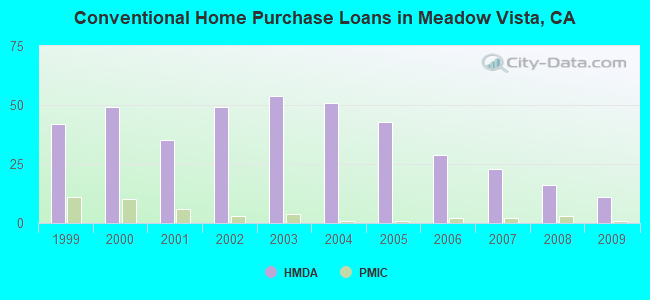
Home Mortgage Disclosure Act Aggregated Statistics For Year 2009(Based on 1 partial tract) A) FHA, FSA/RHS & VA B) Conventional C) Refinancings D) Home Improvement Loans F) Non-occupant Loans on G) Loans On Manufactured Number Average Value Number Average Value Number Average Value Number Average Value Number Average Value Number Average Value
LOANS ORIGINATED 8 $237,638 11 $415,002 99 $252,674 5 $208,796 6 $176,363 1 $6,820 APPLICATIONS APPROVED, NOT ACCEPTED 0 $0 1 $184,600 16 $309,879 0 $0 2 $216,125 1 $164,150 APPLICATIONS DENIED 3 $178,920 5 $756,122 32 $282,953 3 $89,177 3 $152,413 2 $308,140 APPLICATIONS WITHDRAWN 1 $69,300 5 $298,882 17 $334,185 3 $189,523 1 $139,730 0 $0 FILES CLOSED FOR INCOMPLETENESS 1 $119,280 1 $142,570 5 $290,134 0 $0 0 $0 0 $0
Aggregated Statistics For Year 2008(Based on 1 partial tract) A) FHA, FSA/RHS & VA B) Conventional C) Refinancings D) Home Improvement Loans F) Non-occupant Loans on G) Loans On Manufactured Number Average Value Number Average Value Number Average Value Number Average Value Number Average Value Number Average Value
LOANS ORIGINATED 3 $337,013 16 $363,484 43 $285,585 5 $169,718 6 $215,177 1 $150,520 APPLICATIONS APPROVED, NOT ACCEPTED 1 $89,180 3 $399,303 4 $299,195 1 $39,190 0 $0 1 $65,320 APPLICATIONS DENIED 1 $347,050 6 $520,288 25 $361,362 1 $71,000 3 $201,073 1 $90,880 APPLICATIONS WITHDRAWN 2 $213,570 2 $299,335 15 $251,700 3 $106,973 0 $0 1 $83,500 FILES CLOSED FOR INCOMPLETENESS 0 $0 1 $568,000 3 $332,090 1 $282,300 0 $0 0 $0
Aggregated Statistics For Year 2007(Based on 1 partial tract) B) Conventional C) Refinancings D) Home Improvement Loans F) Non-occupant Loans on G) Loans On Manufactured Number Average Value Number Average Value Number Average Value Number Average Value Number Average Value
LOANS ORIGINATED 23 $357,519 73 $351,825 13 $145,626 10 $339,323 1 $303,310 APPLICATIONS APPROVED, NOT ACCEPTED 6 $461,595 13 $311,438 4 $185,878 1 $511,200 1 $105,080 APPLICATIONS DENIED 9 $369,894 32 $389,666 7 $242,293 3 $593,750 0 $0 APPLICATIONS WITHDRAWN 8 $470,375 12 $375,590 3 $153,360 1 $457,240 1 $143,140 FILES CLOSED FOR INCOMPLETENESS 1 $273,210 5 $398,508 1 $236,860 1 $888,350 0 $0
Aggregated Statistics For Year 2006(Based on 1 partial tract) B) Conventional C) Refinancings D) Home Improvement Loans F) Non-occupant Loans on G) Loans On Manufactured Number Average Value Number Average Value Number Average Value Number Average Value Number Average Value
LOANS ORIGINATED 29 $451,540 91 $351,823 22 $192,785 9 $397,221 1 $190,280 APPLICATIONS APPROVED, NOT ACCEPTED 6 $373,177 16 $349,604 3 $88,230 2 $298,200 0 $0 APPLICATIONS DENIED 7 $359,057 30 $428,234 6 $144,840 4 $676,205 1 $188,580 APPLICATIONS WITHDRAWN 7 $434,196 26 $365,355 2 $165,570 2 $419,185 0 $0 FILES CLOSED FOR INCOMPLETENESS 1 $55,660 8 $371,685 1 $90,880 1 $675,920 0 $0
Aggregated Statistics For Year 2005(Based on 1 partial tract) B) Conventional C) Refinancings D) Home Improvement Loans E) Loans on Dwellings For 5+ Families F) Non-occupant Loans on G) Loans On Manufactured Number Average Value Number Average Value Number Average Value Number Average Value Number Average Value Number Average Value
LOANS ORIGINATED 43 $358,223 137 $308,569 25 $205,298 0 $0 18 $268,222 2 $186,020 APPLICATIONS APPROVED, NOT ACCEPTED 8 $390,855 13 $347,965 1 $573,680 0 $0 1 $138,020 0 $0 APPLICATIONS DENIED 15 $362,725 35 $374,426 6 $147,680 1 $198,800 7 $434,033 2 $124,960 APPLICATIONS WITHDRAWN 8 $354,645 41 $328,456 4 $166,282 0 $0 1 $593,560 1 $22,720 FILES CLOSED FOR INCOMPLETENESS 2 $193,405 12 $424,343 1 $516,880 0 $0 0 $0 0 $0
Aggregated Statistics For Year 2004(Based on 1 partial tract) A) FHA, FSA/RHS & VA B) Conventional C) Refinancings D) Home Improvement Loans F) Non-occupant Loans on G) Loans On Manufactured Number Average Value Number Average Value Number Average Value Number Average Value Number Average Value Number Average Value
LOANS ORIGINATED 1 $167,560 51 $364,723 124 $234,030 16 $165,217 12 $249,636 3 $233,637 APPLICATIONS APPROVED, NOT ACCEPTED 0 $0 6 $290,722 16 $335,014 2 $180,340 1 $270,940 1 $60,780 APPLICATIONS DENIED 0 $0 9 $324,454 32 $372,928 7 $169,101 3 $456,103 1 $201,640 APPLICATIONS WITHDRAWN 1 $161,880 6 $359,165 22 $325,283 6 $133,763 2 $1,105,045 1 $161,880 FILES CLOSED FOR INCOMPLETENESS 0 $0 2 $338,810 8 $331,712 0 $0 1 $79,520 0 $0
Aggregated Statistics For Year 2003(Based on 1 partial tract) A) FHA, FSA/RHS & VA B) Conventional C) Refinancings D) Home Improvement Loans F) Non-occupant Loans on Number Average Value Number Average Value Number Average Value Number Average Value Number Average Value
LOANS ORIGINATED 0 $0 54 $279,193 297 $217,010 12 $67,024 24 $255,008 APPLICATIONS APPROVED, NOT ACCEPTED 0 $0 7 $580,659 23 $256,464 3 $42,410 1 $48,280 APPLICATIONS DENIED 0 $0 12 $202,682 44 $219,726 9 $59,767 3 $143,137 APPLICATIONS WITHDRAWN 1 $189,710 6 $269,610 43 $235,892 2 $29,250 1 $159,040 FILES CLOSED FOR INCOMPLETENESS 0 $0 3 $260,900 11 $204,532 1 $55,100 0 $0
Aggregated Statistics For Year 2002(Based on 1 partial tract) A) FHA, FSA/RHS & VA B) Conventional C) Refinancings D) Home Improvement Loans F) Non-occupant Loans on Number Average Value Number Average Value Number Average Value Number Average Value Number Average Value
LOANS ORIGINATED 0 $0 49 $244,240 204 $200,109 16 $43,984 16 $222,727 APPLICATIONS APPROVED, NOT ACCEPTED 1 $24,420 5 $302,972 20 $218,538 1 $2,840 3 $237,233 APPLICATIONS DENIED 0 $0 10 $291,498 33 $186,614 7 $80,007 3 $203,343 APPLICATIONS WITHDRAWN 0 $0 7 $231,987 27 $200,799 0 $0 3 $172,860 FILES CLOSED FOR INCOMPLETENESS 0 $0 5 $253,556 6 $169,643 0 $0 1 $284,000
Aggregated Statistics For Year 2001(Based on 1 partial tract) B) Conventional C) Refinancings D) Home Improvement Loans F) Non-occupant Loans on Number Average Value Number Average Value Number Average Value Number Average Value
LOANS ORIGINATED 35 $209,771 160 $179,296 10 $27,321 13 $193,557 APPLICATIONS APPROVED, NOT ACCEPTED 7 $213,243 19 $205,048 1 $59,070 1 $181,760 APPLICATIONS DENIED 8 $222,230 36 $215,256 6 $60,870 2 $161,880 APPLICATIONS WITHDRAWN 5 $204,366 28 $206,265 1 $12,500 1 $417,480 FILES CLOSED FOR INCOMPLETENESS 3 $324,327 8 $177,358 0 $0 1 $161,880
Aggregated Statistics For Year 2000(Based on 1 partial tract) A) FHA, FSA/RHS & VA B) Conventional C) Refinancings D) Home Improvement Loans F) Non-occupant Loans on Number Average Value Number Average Value Number Average Value Number Average Value Number Average Value
LOANS ORIGINATED 1 $166,420 49 $200,237 44 $136,023 6 $22,625 5 $220,044 APPLICATIONS APPROVED, NOT ACCEPTED 0 $0 4 $142,000 11 $92,481 1 $34,080 0 $0 APPLICATIONS DENIED 0 $0 9 $163,900 15 $168,658 2 $51,120 2 $293,940 APPLICATIONS WITHDRAWN 0 $0 5 $149,044 16 $109,837 1 $13,060 1 $99,970 FILES CLOSED FOR INCOMPLETENESS 0 $0 0 $0 4 $123,540 1 $17,040 0 $0
Aggregated Statistics For Year 1999(Based on 1 partial tract) A) FHA, FSA/RHS & VA B) Conventional C) Refinancings D) Home Improvement Loans F) Non-occupant Loans on Number Average Value Number Average Value Number Average Value Number Average Value Number Average Value
LOANS ORIGINATED 4 $164,198 42 $167,789 77 $143,994 8 $36,624 8 $120,425 APPLICATIONS APPROVED, NOT ACCEPTED 0 $0 3 $226,010 16 $125,701 5 $28,864 2 $96,665 APPLICATIONS DENIED 0 $0 11 $169,371 28 $129,887 2 $26,960 3 $78,603 APPLICATIONS WITHDRAWN 1 $173,730 5 $94,760 18 $136,664 0 $0 1 $141,050 FILES CLOSED FOR INCOMPLETENESS 0 $0 0 $0 9 $168,644 0 $0 0 $0
Detailed HMDA statistics for the following Tracts:
0219.02
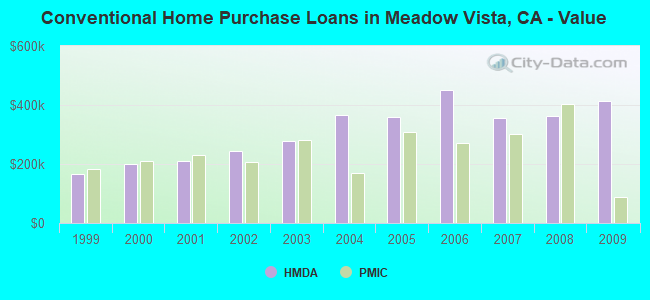
Private Mortgage Insurance Companies Aggregated Statistics For Year 2009(Based on 1 partial tract) A) Conventional B) Refinancings Number Average Value Number Average Value
LOANS ORIGINATED 1 $89,740 0 $0 APPLICATIONS APPROVED, NOT ACCEPTED 1 $361,820 0 $0 APPLICATIONS DENIED 0 $0 1 $178,920 APPLICATIONS WITHDRAWN 0 $0 0 $0 FILES CLOSED FOR INCOMPLETENESS 0 $0 0 $0
Aggregated Statistics For Year 2008(Based on 1 partial tract) A) Conventional B) Refinancings Number Average Value Number Average Value
LOANS ORIGINATED 3 $402,333 1 $373,180 APPLICATIONS APPROVED, NOT ACCEPTED 1 $143,140 2 $321,770 APPLICATIONS DENIED 2 $438,495 0 $0 APPLICATIONS WITHDRAWN 0 $0 0 $0 FILES CLOSED FOR INCOMPLETENESS 0 $0 0 $0
Aggregated Statistics For Year 2007(Based on 1 partial tract) A) Conventional B) Refinancings Number Average Value Number Average Value
LOANS ORIGINATED 2 $301,040 1 $414,640 APPLICATIONS APPROVED, NOT ACCEPTED 1 $236,860 0 $0 APPLICATIONS DENIED 1 $362,380 0 $0 APPLICATIONS WITHDRAWN 1 $235,720 0 $0 FILES CLOSED FOR INCOMPLETENESS 0 $0 0 $0
Aggregated Statistics For Year 2006(Based on 1 partial tract) A) Conventional B) Refinancings C) Non-occupant Loans on D) Loans On Manufactured Number Average Value Number Average Value Number Average Value Number Average Value
LOANS ORIGINATED 2 $270,935 1 $197,100 1 $227,200 1 $115,300 APPLICATIONS APPROVED, NOT ACCEPTED 0 $0 0 $0 0 $0 0 $0 APPLICATIONS DENIED 0 $0 0 $0 0 $0 0 $0 APPLICATIONS WITHDRAWN 0 $0 0 $0 0 $0 0 $0 FILES CLOSED FOR INCOMPLETENESS 0 $0 0 $0 0 $0 0 $0
Aggregated Statistics For Year 2005(Based on 1 partial tract) A) Conventional B) Refinancings C) Non-occupant Loans on Number Average Value Number Average Value Number Average Value
LOANS ORIGINATED 1 $310,130 1 $190,850 1 $310,130 APPLICATIONS APPROVED, NOT ACCEPTED 0 $0 1 $85,770 0 $0 APPLICATIONS DENIED 0 $0 0 $0 0 $0 APPLICATIONS WITHDRAWN 0 $0 0 $0 0 $0 FILES CLOSED FOR INCOMPLETENESS 0 $0 0 $0 0 $0
Aggregated Statistics For Year 2004(Based on 1 partial tract) A) Conventional B) Refinancings Number Average Value Number Average Value
LOANS ORIGINATED 1 $169,830 1 $360,680 APPLICATIONS APPROVED, NOT ACCEPTED 1 $374,880 1 $118,140 APPLICATIONS DENIED 0 $0 0 $0 APPLICATIONS WITHDRAWN 0 $0 1 $190,850 FILES CLOSED FOR INCOMPLETENESS 0 $0 0 $0
Aggregated Statistics For Year 2003(Based on 1 partial tract) A) Conventional B) Refinancings C) Non-occupant Loans on Number Average Value Number Average Value Number Average Value
LOANS ORIGINATED 4 $281,018 1 $396,460 0 $0 APPLICATIONS APPROVED, NOT ACCEPTED 1 $291,950 0 $0 0 $0 APPLICATIONS DENIED 1 $169,830 0 $0 0 $0 APPLICATIONS WITHDRAWN 1 $146,540 0 $0 1 $146,540 FILES CLOSED FOR INCOMPLETENESS 0 $0 0 $0 0 $0
Aggregated Statistics For Year 2002(Based on 1 partial tract) A) Conventional B) Refinancings C) Non-occupant Loans on Number Average Value Number Average Value Number Average Value
LOANS ORIGINATED 3 $205,993 2 $262,700 1 $105,080 APPLICATIONS APPROVED, NOT ACCEPTED 1 $369,200 0 $0 0 $0 APPLICATIONS DENIED 0 $0 0 $0 0 $0 APPLICATIONS WITHDRAWN 1 $215,840 0 $0 0 $0 FILES CLOSED FOR INCOMPLETENESS 0 $0 0 $0 0 $0
Aggregated Statistics For Year 2001(Based on 1 partial tract) A) Conventional B) Refinancings C) Non-occupant Loans on Number Average Value Number Average Value Number Average Value
LOANS ORIGINATED 6 $228,903 1 $214,700 0 $0 APPLICATIONS APPROVED, NOT ACCEPTED 0 $0 1 $276,050 0 $0 APPLICATIONS DENIED 0 $0 1 $194,820 0 $0 APPLICATIONS WITHDRAWN 0 $0 1 $156,200 1 $156,200 FILES CLOSED FOR INCOMPLETENESS 0 $0 0 $0 0 $0
Aggregated Statistics For Year 2000(Based on 1 partial tract) A) Conventional B) Refinancings C) Non-occupant Loans on Number Average Value Number Average Value Number Average Value
LOANS ORIGINATED 10 $209,478 1 $257,870 1 $107,350 APPLICATIONS APPROVED, NOT ACCEPTED 1 $324,330 0 $0 0 $0 APPLICATIONS DENIED 2 $157,620 0 $0 0 $0 APPLICATIONS WITHDRAWN 0 $0 0 $0 0 $0 FILES CLOSED FOR INCOMPLETENESS 0 $0 0 $0 0 $0
Aggregated Statistics For Year 1999(Based on 1 partial tract) A) Conventional B) Refinancings C) Non-occupant Loans on Number Average Value Number Average Value Number Average Value
LOANS ORIGINATED 11 $181,995 3 $201,320 0 $0 APPLICATIONS APPROVED, NOT ACCEPTED 1 $62,080 1 $132,340 1 $65,350 APPLICATIONS DENIED 1 $95,300 1 $203,680 0 $0 APPLICATIONS WITHDRAWN 1 $62,630 1 $106,200 0 $0 FILES CLOSED FOR INCOMPLETENESS 0 $0 0 $0 0 $0
Detailed PMIC statistics for the following Tracts:
0219.02
Most common first names in Meadow Vista, CA among deceased individuals Name Count Lived (average)
Robert 25 71.6 years John 24 80.4 years William 24 72.7 years Mary 17 81.0 years George 14 74.7 years David 12 71.9 years Henry 12 80.0 years Charles 12 74.9 years Dorothy 11 85.3 years James 10 70.3 years
Most common last names in Meadow Vista, CA among deceased individuals Last name Count Lived (average)
Nelson 6 72.2 years Williams 6 85.8 years Johnson 5 68.8 years Brown 5 80.0 years Thompson 5 68.2 years Wyatt 4 80.7 years Clark 4 92.5 years King 4 71.3 years Duncan 4 68.5 years Hansen 4 75.7 years
Meadow Vista compared to California state average:
Unemployed percentage significantly below state average. Black race population percentage significantly below state average. Hispanic race population percentage significantly below state average. Median age significantly above state average. Foreign-born population percentage significantly below state average. Renting percentage significantly below state average. Length of stay since moving in significantly above state average. Number of rooms per house above state average. Meadow Vista on our top lists :
#28 on the list of "Top 101 cities with the most residents born in Oceania, n.e.c. (population 500+)"
#37 on the list of "Top 101 cities with the most residents born in Oceania (population 500+)"
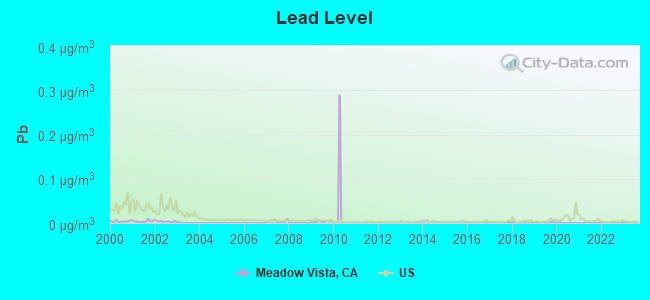
#11 on the list of "Top 101 counties with the highest lead air pollution readings in 2012 (µg/m3 )"
#19 on the list of "Top 101 counties with the lowest lead air pollution readings in 2012 (µg/m3 )"
#31 on the list of "Top 101 counties with the highest Nitrogen Dioxide air pollution readings in 2012 (ppm)"
#32 on the list of "Top 101 counties with the lowest Particulate Matter (PM2.5 ) Annual air pollution readings in 2012 (µg/m3 )"
#48 on the list of "Top 101 counties with the lowest Particulate Matter (PM10 ) Annual air pollution readings in 2012 (µg/m3 )"
Top Patent Applicants
David Dudley (4)
Richard L. Miller (4)
Carlos C. Reyes (3)
Samuel Hall Bousfield (3)
Alan L. Winick (2)
Nicholas Peter Bajka (2)
Bryan John Cowger (2)
David J. Losko (1)
Ronald Leo Wollenberg (1)
Jonathan Richards (1)
Total of 29 patent applications in 2008-2024.


 Recent articles from our blog. Our writers, many of them Ph.D. graduates or candidates, create easy-to-read articles on a wide variety of topics.

 (17.3 miles

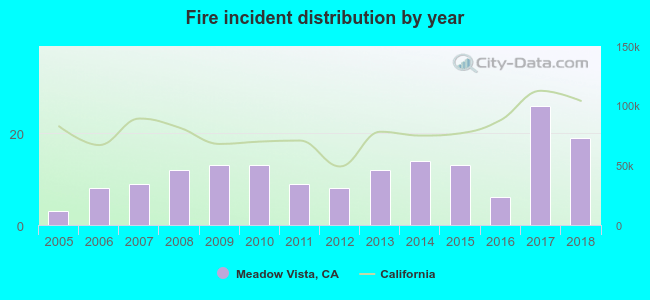 According to the data from the years 2005 - 2018 the average number of fires per year is 12. The highest number of reported fire incidents - 26 took place in 2017, and the least - 3 in 2005. The data has a rising trend.
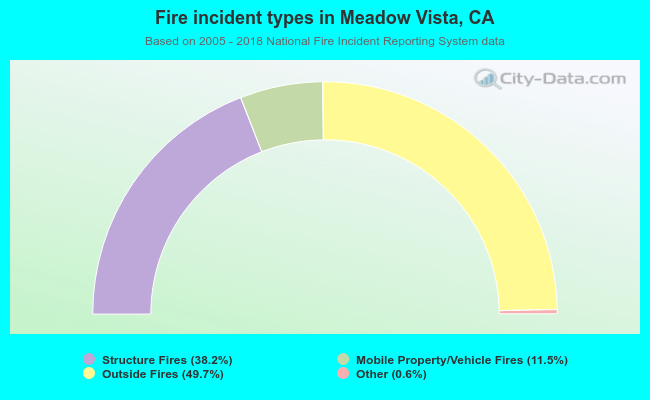 When looking into fire subcategories, the most incidents belonged to: Outside Fires (49.7%), and Structure Fires (38.2%).