Medina, Ohio Submit your own pictures of this city and show them to the world
OSM Map
General Map
Google Map
MSN Map
OSM Map
General Map
Google Map
MSN Map
OSM Map
General Map
Google Map
MSN Map
OSM Map
General Map
Google Map
MSN Map
Please wait while loading the map...
Population in 2022: 26,033 (100% urban, 0% rural). Population change since 2000: +3.6%Males: 12,912 Females: 13,121
March 2022 cost of living index in Medina: 95.0 (less than average, U.S. average is 100) Percentage of residents living in poverty in 2022: 8.9%for White Non-Hispanic residents , 38.5% for Black residents , 33.3% for Hispanic or Latino residents , 8.8% for other race residents , 20.6% for two or more races residents )
Profiles of local businesses
Business Search - 14 Million verified businesses
Data:
Median household income ($)
Median household income (% change since 2000)
Household income diversity
Ratio of average income to average house value (%)
Ratio of average income to average rent
Median household income ($) - White
Median household income ($) - Black or African American
Median household income ($) - Asian
Median household income ($) - Hispanic or Latino
Median household income ($) - American Indian and Alaska Native
Median household income ($) - Multirace
Median household income ($) - Other Race
Median household income for houses/condos with a mortgage ($)
Median household income for apartments without a mortgage ($)
Races - White alone (%)
Races - White alone (% change since 2000)
Races - Black alone (%)
Races - Black alone (% change since 2000)
Races - American Indian alone (%)
Races - American Indian alone (% change since 2000)
Races - Asian alone (%)
Races - Asian alone (% change since 2000)
Races - Hispanic (%)
Races - Hispanic (% change since 2000)
Races - Native Hawaiian and Other Pacific Islander alone (%)
Races - Native Hawaiian and Other Pacific Islander alone (% change since 2000)
Races - Two or more races (%)
Races - Two or more races (% change since 2000)
Races - Other race alone (%)
Races - Other race alone (% change since 2000)
Racial diversity
Unemployment (%)
Unemployment (% change since 2000)
Unemployment (%) - White
Unemployment (%) - Black or African American
Unemployment (%) - Asian
Unemployment (%) - Hispanic or Latino
Unemployment (%) - American Indian and Alaska Native
Unemployment (%) - Multirace
Unemployment (%) - Other Race
Population density (people per square mile)
Population - Males (%)
Population - Females (%)
Population - Males (%) - White
Population - Males (%) - Black or African American
Population - Males (%) - Asian
Population - Males (%) - Hispanic or Latino
Population - Males (%) - American Indian and Alaska Native
Population - Males (%) - Multirace
Population - Males (%) - Other Race
Population - Females (%) - White
Population - Females (%) - Black or African American
Population - Females (%) - Asian
Population - Females (%) - Hispanic or Latino
Population - Females (%) - American Indian and Alaska Native
Population - Females (%) - Multirace
Population - Females (%) - Other Race
Coronavirus confirmed cases (Apr 27, 2024)
Deaths caused by coronavirus (Apr 27, 2024)
Coronavirus confirmed cases (per 100k population) (Apr 27, 2024)
Deaths caused by coronavirus (per 100k population) (Apr 27, 2024)
Daily increase in number of cases (Apr 27, 2024)
Weekly increase in number of cases (Apr 27, 2024)
Cases doubled (in days) (Apr 27, 2024)
Hospitalized patients (Apr 18, 2022)
Negative test results (Apr 18, 2022)
Total test results (Apr 18, 2022)
COVID Vaccine doses distributed (per 100k population) (Sep 19, 2023)
COVID Vaccine doses administered (per 100k population) (Sep 19, 2023)
COVID Vaccine doses distributed (Sep 19, 2023)
COVID Vaccine doses administered (Sep 19, 2023)
Likely homosexual households (%)
Likely homosexual households (% change since 2000)
Likely homosexual households - Lesbian couples (%)
Likely homosexual households - Lesbian couples (% change since 2000)
Likely homosexual households - Gay men (%)
Likely homosexual households - Gay men (% change since 2000)
Cost of living index
Median gross rent ($)
Median contract rent ($)
Median monthly housing costs ($)
Median house or condo value ($)
Median house or condo value ($ change since 2000)
Mean house or condo value by units in structure - 1, detached ($)
Mean house or condo value by units in structure - 1, attached ($)
Mean house or condo value by units in structure - 2 ($)
Mean house or condo value by units in structure by units in structure - 3 or 4 ($)
Mean house or condo value by units in structure - 5 or more ($)
Mean house or condo value by units in structure - Boat, RV, van, etc. ($)
Mean house or condo value by units in structure - Mobile home ($)
Median house or condo value ($) - White
Median house or condo value ($) - Black or African American
Median house or condo value ($) - Asian
Median house or condo value ($) - Hispanic or Latino
Median house or condo value ($) - American Indian and Alaska Native
Median house or condo value ($) - Multirace
Median house or condo value ($) - Other Race
Median resident age
Resident age diversity
Median resident age - Males
Median resident age - Females
Median resident age - White
Median resident age - Black or African American
Median resident age - Asian
Median resident age - Hispanic or Latino
Median resident age - American Indian and Alaska Native
Median resident age - Multirace
Median resident age - Other Race
Median resident age - Males - White
Median resident age - Males - Black or African American
Median resident age - Males - Asian
Median resident age - Males - Hispanic or Latino
Median resident age - Males - American Indian and Alaska Native
Median resident age - Males - Multirace
Median resident age - Males - Other Race
Median resident age - Females - White
Median resident age - Females - Black or African American
Median resident age - Females - Asian
Median resident age - Females - Hispanic or Latino
Median resident age - Females - American Indian and Alaska Native
Median resident age - Females - Multirace
Median resident age - Females - Other Race
Commute - mean travel time to work (minutes)
Travel time to work - Less than 5 minutes (%)
Travel time to work - Less than 5 minutes (% change since 2000)
Travel time to work - 5 to 9 minutes (%)
Travel time to work - 5 to 9 minutes (% change since 2000)
Travel time to work - 10 to 19 minutes (%)
Travel time to work - 10 to 19 minutes (% change since 2000)
Travel time to work - 20 to 29 minutes (%)
Travel time to work - 20 to 29 minutes (% change since 2000)
Travel time to work - 30 to 39 minutes (%)
Travel time to work - 30 to 39 minutes (% change since 2000)
Travel time to work - 40 to 59 minutes (%)
Travel time to work - 40 to 59 minutes (% change since 2000)
Travel time to work - 60 to 89 minutes (%)
Travel time to work - 60 to 89 minutes (% change since 2000)
Travel time to work - 90 or more minutes (%)
Travel time to work - 90 or more minutes (% change since 2000)
Marital status - Never married (%)
Marital status - Now married (%)
Marital status - Separated (%)
Marital status - Widowed (%)
Marital status - Divorced (%)
Median family income ($)
Median family income (% change since 2000)
Median non-family income ($)
Median non-family income (% change since 2000)
Median per capita income ($)
Median per capita income (% change since 2000)
Median family income ($) - White
Median family income ($) - Black or African American
Median family income ($) - Asian
Median family income ($) - Hispanic or Latino
Median family income ($) - American Indian and Alaska Native
Median family income ($) - Multirace
Median family income ($) - Other Race
Median year house/condo built
Median year apartment built
Year house built - Built 2005 or later (%)
Year house built - Built 2000 to 2004 (%)
Year house built - Built 1990 to 1999 (%)
Year house built - Built 1980 to 1989 (%)
Year house built - Built 1970 to 1979 (%)
Year house built - Built 1960 to 1969 (%)
Year house built - Built 1950 to 1959 (%)
Year house built - Built 1940 to 1949 (%)
Year house built - Built 1939 or earlier (%)
Average household size
Household density (households per square mile)
Average household size - White
Average household size - Black or African American
Average household size - Asian
Average household size - Hispanic or Latino
Average household size - American Indian and Alaska Native
Average household size - Multirace
Average household size - Other Race
Occupied housing units (%)
Vacant housing units (%)
Owner occupied housing units (%)
Renter occupied housing units (%)
Vacancy status - For rent (%)
Vacancy status - For sale only (%)
Vacancy status - Rented or sold, not occupied (%)
Vacancy status - For seasonal, recreational, or occasional use (%)
Vacancy status - For migrant workers (%)
Vacancy status - Other vacant (%)
Residents with income below the poverty level (%)
Residents with income below 50% of the poverty level (%)
Children below poverty level (%)
Poor families by family type - Married-couple family (%)
Poor families by family type - Male, no wife present (%)
Poor families by family type - Female, no husband present (%)
Poverty status for native-born residents (%)
Poverty status for foreign-born residents (%)
Poverty among high school graduates not in families (%)
Poverty among people who did not graduate high school not in families (%)
Residents with income below the poverty level (%) - White
Residents with income below the poverty level (%) - Black or African American
Residents with income below the poverty level (%) - Asian
Residents with income below the poverty level (%) - Hispanic or Latino
Residents with income below the poverty level (%) - American Indian and Alaska Native
Residents with income below the poverty level (%) - Multirace
Residents with income below the poverty level (%) - Other Race
Air pollution - Air Quality Index (AQI)
Air pollution - CO
Air pollution - NO2
Air pollution - SO2
Air pollution - Ozone
Air pollution - PM10
Air pollution - PM25
Air pollution - Pb
Crime - Murders per 100,000 population
Crime - Rapes per 100,000 population
Crime - Robberies per 100,000 population
Crime - Assaults per 100,000 population
Crime - Burglaries per 100,000 population
Crime - Thefts per 100,000 population
Crime - Auto thefts per 100,000 population
Crime - Arson per 100,000 population
Crime - City-data.com crime index
Crime - Violent crime index
Crime - Property crime index
Crime - Murders per 100,000 population (5 year average)
Crime - Rapes per 100,000 population (5 year average)
Crime - Robberies per 100,000 population (5 year average)
Crime - Assaults per 100,000 population (5 year average)
Crime - Burglaries per 100,000 population (5 year average)
Crime - Thefts per 100,000 population (5 year average)
Crime - Auto thefts per 100,000 population (5 year average)
Crime - Arson per 100,000 population (5 year average)
Crime - City-data.com crime index (5 year average)
Crime - Violent crime index (5 year average)
Crime - Property crime index (5 year average)
1996 Presidential Elections Results (%) - Democratic Party (Clinton)
1996 Presidential Elections Results (%) - Republican Party (Dole)
1996 Presidential Elections Results (%) - Other
2000 Presidential Elections Results (%) - Democratic Party (Gore)
2000 Presidential Elections Results (%) - Republican Party (Bush)
2000 Presidential Elections Results (%) - Other
2004 Presidential Elections Results (%) - Democratic Party (Kerry)
2004 Presidential Elections Results (%) - Republican Party (Bush)
2004 Presidential Elections Results (%) - Other
2008 Presidential Elections Results (%) - Democratic Party (Obama)
2008 Presidential Elections Results (%) - Republican Party (McCain)
2008 Presidential Elections Results (%) - Other
2012 Presidential Elections Results (%) - Democratic Party (Obama)
2012 Presidential Elections Results (%) - Republican Party (Romney)
2012 Presidential Elections Results (%) - Other
2016 Presidential Elections Results (%) - Democratic Party (Clinton)
2016 Presidential Elections Results (%) - Republican Party (Trump)
2016 Presidential Elections Results (%) - Other
2020 Presidential Elections Results (%) - Democratic Party (Biden)
2020 Presidential Elections Results (%) - Republican Party (Trump)
2020 Presidential Elections Results (%) - Other
Ancestries Reported - Arab (%)
Ancestries Reported - Czech (%)
Ancestries Reported - Danish (%)
Ancestries Reported - Dutch (%)
Ancestries Reported - English (%)
Ancestries Reported - French (%)
Ancestries Reported - French Canadian (%)
Ancestries Reported - German (%)
Ancestries Reported - Greek (%)
Ancestries Reported - Hungarian (%)
Ancestries Reported - Irish (%)
Ancestries Reported - Italian (%)
Ancestries Reported - Lithuanian (%)
Ancestries Reported - Norwegian (%)
Ancestries Reported - Polish (%)
Ancestries Reported - Portuguese (%)
Ancestries Reported - Russian (%)
Ancestries Reported - Scotch-Irish (%)
Ancestries Reported - Scottish (%)
Ancestries Reported - Slovak (%)
Ancestries Reported - Subsaharan African (%)
Ancestries Reported - Swedish (%)
Ancestries Reported - Swiss (%)
Ancestries Reported - Ukrainian (%)
Ancestries Reported - United States (%)
Ancestries Reported - Welsh (%)
Ancestries Reported - West Indian (%)
Ancestries Reported - Other (%)
Educational Attainment - No schooling completed (%)
Educational Attainment - Less than high school (%)
Educational Attainment - High school or equivalent (%)
Educational Attainment - Less than 1 year of college (%)
Educational Attainment - 1 or more years of college (%)
Educational Attainment - Associate degree (%)
Educational Attainment - Bachelor's degree (%)
Educational Attainment - Master's degree (%)
Educational Attainment - Professional school degree (%)
Educational Attainment - Doctorate degree (%)
School Enrollment - Nursery, preschool (%)
School Enrollment - Kindergarten (%)
School Enrollment - Grade 1 to 4 (%)
School Enrollment - Grade 5 to 8 (%)
School Enrollment - Grade 9 to 12 (%)
School Enrollment - College undergrad (%)
School Enrollment - Graduate or professional (%)
School Enrollment - Not enrolled in school (%)
School enrollment - Public schools (%)
School enrollment - Private schools (%)
School enrollment - Not enrolled (%)
Median number of rooms in houses and condos
Median number of rooms in apartments
Housing units lacking complete plumbing facilities (%)
Housing units lacking complete kitchen facilities (%)
Density of houses
Urban houses (%)
Rural houses (%)
Households with people 60 years and over (%)
Households with people 65 years and over (%)
Households with people 75 years and over (%)
Households with one or more nonrelatives (%)
Households with no nonrelatives (%)
Population in households (%)
Family households (%)
Nonfamily households (%)
Population in families (%)
Family households with own children (%)
Median number of bedrooms in owner occupied houses
Mean number of bedrooms in owner occupied houses
Median number of bedrooms in renter occupied houses
Mean number of bedrooms in renter occupied houses
Median number of vehichles in owner occupied houses
Mean number of vehichles in owner occupied houses
Median number of vehichles in renter occupied houses
Mean number of vehichles in renter occupied houses
Mortgage status - with mortgage (%)
Mortgage status - with second mortgage (%)
Mortgage status - with home equity loan (%)
Mortgage status - with both second mortgage and home equity loan (%)
Mortgage status - without a mortgage (%)
Average family size
Average family size - White
Average family size - Black or African American
Average family size - Asian
Average family size - Hispanic or Latino
Average family size - American Indian and Alaska Native
Average family size - Multirace
Average family size - Other Race
Geographical mobility - Same house 1 year ago (%)
Geographical mobility - Moved within same county (%)
Geographical mobility - Moved from different county within same state (%)
Geographical mobility - Moved from different state (%)
Geographical mobility - Moved from abroad (%)
Place of birth - Born in state of residence (%)
Place of birth - Born in other state (%)
Place of birth - Native, outside of US (%)
Place of birth - Foreign born (%)
Housing units in structures - 1, detached (%)
Housing units in structures - 1, attached (%)
Housing units in structures - 2 (%)
Housing units in structures - 3 or 4 (%)
Housing units in structures - 5 to 9 (%)
Housing units in structures - 10 to 19 (%)
Housing units in structures - 20 to 49 (%)
Housing units in structures - 50 or more (%)
Housing units in structures - Mobile home (%)
Housing units in structures - Boat, RV, van, etc. (%)
House/condo owner moved in on average (years ago)
Renter moved in on average (years ago)
Year householder moved into unit - Moved in 1999 to March 2000 (%)
Year householder moved into unit - Moved in 1995 to 1998 (%)
Year householder moved into unit - Moved in 1990 to 1994 (%)
Year householder moved into unit - Moved in 1980 to 1989 (%)
Year householder moved into unit - Moved in 1970 to 1979 (%)
Year householder moved into unit - Moved in 1969 or earlier (%)
Means of transportation to work - Drove car alone (%)
Means of transportation to work - Carpooled (%)
Means of transportation to work - Public transportation (%)
Means of transportation to work - Bus or trolley bus (%)
Means of transportation to work - Streetcar or trolley car (%)
Means of transportation to work - Subway or elevated (%)
Means of transportation to work - Railroad (%)
Means of transportation to work - Ferryboat (%)
Means of transportation to work - Taxicab (%)
Means of transportation to work - Motorcycle (%)
Means of transportation to work - Bicycle (%)
Means of transportation to work - Walked (%)
Means of transportation to work - Other means (%)
Working at home (%)
Industry diversity
Most Common Industries - Agriculture, forestry, fishing and hunting, and mining (%)
Most Common Industries - Agriculture, forestry, fishing and hunting (%)
Most Common Industries - Mining, quarrying, and oil and gas extraction (%)
Most Common Industries - Construction (%)
Most Common Industries - Manufacturing (%)
Most Common Industries - Wholesale trade (%)
Most Common Industries - Retail trade (%)
Most Common Industries - Transportation and warehousing, and utilities (%)
Most Common Industries - Transportation and warehousing (%)
Most Common Industries - Utilities (%)
Most Common Industries - Information (%)
Most Common Industries - Finance and insurance, and real estate and rental and leasing (%)
Most Common Industries - Finance and insurance (%)
Most Common Industries - Real estate and rental and leasing (%)
Most Common Industries - Professional, scientific, and management, and administrative and waste management services (%)
Most Common Industries - Professional, scientific, and technical services (%)
Most Common Industries - Management of companies and enterprises (%)
Most Common Industries - Administrative and support and waste management services (%)
Most Common Industries - Educational services, and health care and social assistance (%)
Most Common Industries - Educational services (%)
Most Common Industries - Health care and social assistance (%)
Most Common Industries - Arts, entertainment, and recreation, and accommodation and food services (%)
Most Common Industries - Arts, entertainment, and recreation (%)
Most Common Industries - Accommodation and food services (%)
Most Common Industries - Other services, except public administration (%)
Most Common Industries - Public administration (%)
Occupation diversity
Most Common Occupations - Management, business, science, and arts occupations (%)
Most Common Occupations - Management, business, and financial occupations (%)
Most Common Occupations - Management occupations (%)
Most Common Occupations - Business and financial operations occupations (%)
Most Common Occupations - Computer, engineering, and science occupations (%)
Most Common Occupations - Computer and mathematical occupations (%)
Most Common Occupations - Architecture and engineering occupations (%)
Most Common Occupations - Life, physical, and social science occupations (%)
Most Common Occupations - Education, legal, community service, arts, and media occupations (%)
Most Common Occupations - Community and social service occupations (%)
Most Common Occupations - Legal occupations (%)
Most Common Occupations - Education, training, and library occupations (%)
Most Common Occupations - Arts, design, entertainment, sports, and media occupations (%)
Most Common Occupations - Healthcare practitioners and technical occupations (%)
Most Common Occupations - Health diagnosing and treating practitioners and other technical occupations (%)
Most Common Occupations - Health technologists and technicians (%)
Most Common Occupations - Service occupations (%)
Most Common Occupations - Healthcare support occupations (%)
Most Common Occupations - Protective service occupations (%)
Most Common Occupations - Fire fighting and prevention, and other protective service workers including supervisors (%)
Most Common Occupations - Law enforcement workers including supervisors (%)
Most Common Occupations - Food preparation and serving related occupations (%)
Most Common Occupations - Building and grounds cleaning and maintenance occupations (%)
Most Common Occupations - Personal care and service occupations (%)
Most Common Occupations - Sales and office occupations (%)
Most Common Occupations - Sales and related occupations (%)
Most Common Occupations - Office and administrative support occupations (%)
Most Common Occupations - Natural resources, construction, and maintenance occupations (%)
Most Common Occupations - Farming, fishing, and forestry occupations (%)
Most Common Occupations - Construction and extraction occupations (%)
Most Common Occupations - Installation, maintenance, and repair occupations (%)
Most Common Occupations - Production, transportation, and material moving occupations (%)
Most Common Occupations - Production occupations (%)
Most Common Occupations - Transportation occupations (%)
Most Common Occupations - Material moving occupations (%)
People in Group quarters - Institutionalized population (%)
People in Group quarters - Correctional institutions (%)
People in Group quarters - Federal prisons and detention centers (%)
People in Group quarters - Halfway houses (%)
People in Group quarters - Local jails and other confinement facilities (including police lockups) (%)
People in Group quarters - Military disciplinary barracks (%)
People in Group quarters - State prisons (%)
People in Group quarters - Other types of correctional institutions (%)
People in Group quarters - Nursing homes (%)
People in Group quarters - Hospitals/wards, hospices, and schools for the handicapped (%)
People in Group quarters - Hospitals/wards and hospices for chronically ill (%)
People in Group quarters - Hospices or homes for chronically ill (%)
People in Group quarters - Military hospitals or wards for chronically ill (%)
People in Group quarters - Other hospitals or wards for chronically ill (%)
People in Group quarters - Hospitals or wards for drug/alcohol abuse (%)
People in Group quarters - Mental (Psychiatric) hospitals or wards (%)
People in Group quarters - Schools, hospitals, or wards for the mentally retarded (%)
People in Group quarters - Schools, hospitals, or wards for the physically handicapped (%)
People in Group quarters - Institutions for the deaf (%)
People in Group quarters - Institutions for the blind (%)
People in Group quarters - Orthopedic wards and institutions for the physically handicapped (%)
People in Group quarters - Wards in general hospitals for patients who have no usual home elsewhere (%)
People in Group quarters - Wards in military hospitals for patients who have no usual home elsewhere (%)
People in Group quarters - Juvenile institutions (%)
People in Group quarters - Long-term care (%)
People in Group quarters - Homes for abused, dependent, and neglected children (%)
People in Group quarters - Residential treatment centers for emotionally disturbed children (%)
People in Group quarters - Training schools for juvenile delinquents (%)
People in Group quarters - Short-term care, detention or diagnostic centers for delinquent children (%)
People in Group quarters - Type of juvenile institution unknown (%)
People in Group quarters - Noninstitutionalized population (%)
People in Group quarters - College dormitories (includes college quarters off campus) (%)
People in Group quarters - Military quarters (%)
People in Group quarters - On base (%)
People in Group quarters - Barracks, unaccompanied personnel housing (UPH), (Enlisted/Officer), ;and similar group living quarters for military personnel (%)
People in Group quarters - Transient quarters for temporary residents (%)
People in Group quarters - Military ships (%)
People in Group quarters - Group homes (%)
People in Group quarters - Homes or halfway houses for drug/alcohol abuse (%)
People in Group quarters - Homes for the mentally ill (%)
People in Group quarters - Homes for the mentally retarded (%)
People in Group quarters - Homes for the physically handicapped (%)
People in Group quarters - Other group homes (%)
People in Group quarters - Religious group quarters (%)
People in Group quarters - Dormitories (%)
People in Group quarters - Agriculture workers' dormitories on farms (%)
People in Group quarters - Job Corps and vocational training facilities (%)
People in Group quarters - Other workers' dormitories (%)
People in Group quarters - Crews of maritime vessels (%)
People in Group quarters - Other nonhousehold living situations (%)
People in Group quarters - Other noninstitutional group quarters (%)
Residents speaking English at home (%)
Residents speaking English at home - Born in the United States (%)
Residents speaking English at home - Native, born elsewhere (%)
Residents speaking English at home - Foreign born (%)
Residents speaking Spanish at home (%)
Residents speaking Spanish at home - Born in the United States (%)
Residents speaking Spanish at home - Native, born elsewhere (%)
Residents speaking Spanish at home - Foreign born (%)
Residents speaking other language at home (%)
Residents speaking other language at home - Born in the United States (%)
Residents speaking other language at home - Native, born elsewhere (%)
Residents speaking other language at home - Foreign born (%)
Class of Workers - Employee of private company (%)
Class of Workers - Self-employed in own incorporated business (%)
Class of Workers - Private not-for-profit wage and salary workers (%)
Class of Workers - Local government workers (%)
Class of Workers - State government workers (%)
Class of Workers - Federal government workers (%)
Class of Workers - Self-employed workers in own not incorporated business and Unpaid family workers (%)
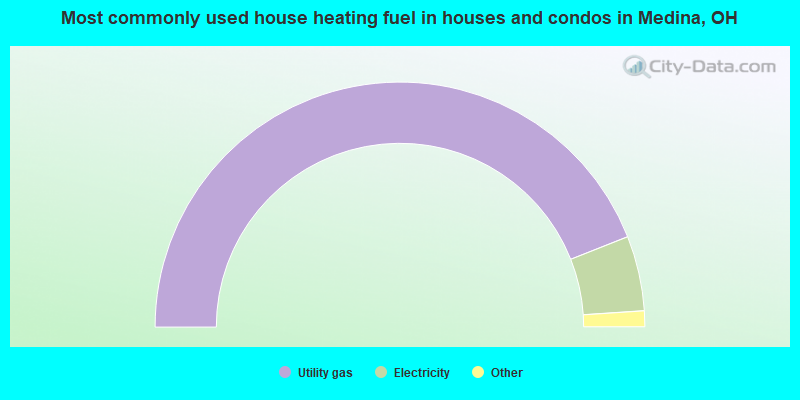
House heating fuel used in houses and condos - Utility gas (%)
House heating fuel used in houses and condos - Bottled, tank, or LP gas (%)
House heating fuel used in houses and condos - Electricity (%)
House heating fuel used in houses and condos - Fuel oil, kerosene, etc. (%)
House heating fuel used in houses and condos - Coal or coke (%)
House heating fuel used in houses and condos - Wood (%)
House heating fuel used in houses and condos - Solar energy (%)
House heating fuel used in houses and condos - Other fuel (%)
House heating fuel used in houses and condos - No fuel used (%)
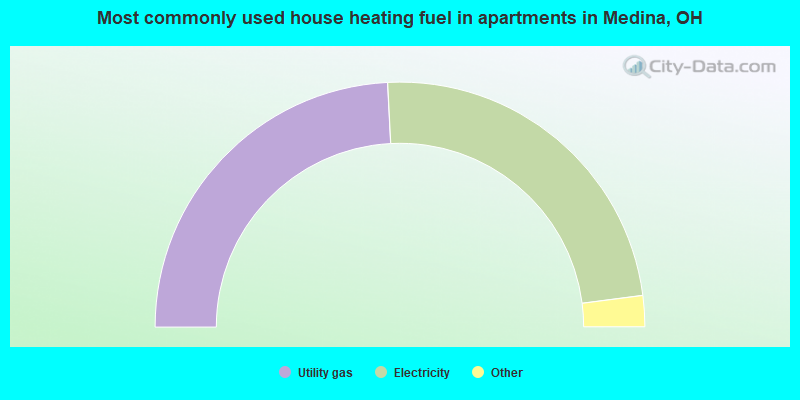
House heating fuel used in apartments - Utility gas (%)
House heating fuel used in apartments - Bottled, tank, or LP gas (%)
House heating fuel used in apartments - Electricity (%)
House heating fuel used in apartments - Fuel oil, kerosene, etc. (%)
House heating fuel used in apartments - Coal or coke (%)
House heating fuel used in apartments - Wood (%)
House heating fuel used in apartments - Solar energy (%)
House heating fuel used in apartments - Other fuel (%)
House heating fuel used in apartments - No fuel used (%)
Armed forces status - In Armed Forces (%)
Armed forces status - Civilian (%)
Armed forces status - Civilian - Veteran (%)
Armed forces status - Civilian - Nonveteran (%)
Fatal accidents locations in years 2005-2021
Fatal accidents locations in 2005
Fatal accidents locations in 2006
Fatal accidents locations in 2007
Fatal accidents locations in 2008
Fatal accidents locations in 2009
Fatal accidents locations in 2010
Fatal accidents locations in 2011
Fatal accidents locations in 2012
Fatal accidents locations in 2013
Fatal accidents locations in 2014
Fatal accidents locations in 2015
Fatal accidents locations in 2016
Fatal accidents locations in 2017
Fatal accidents locations in 2018
Fatal accidents locations in 2019
Fatal accidents locations in 2020
Fatal accidents locations in 2021
Alcohol use - People drinking some alcohol every month (%)
Alcohol use - People not drinking at all (%)
Alcohol use - Average days/month drinking alcohol
Alcohol use - Average drinks/week
Alcohol use - Average days/year people drink much
Audiometry - Average condition of hearing (%)
Audiometry - People that can hear a whisper from across a quiet room (%)
Audiometry - People that can hear normal voice from across a quiet room (%)
Audiometry - Ears ringing, roaring, buzzing (%)
Audiometry - Had a job exposure to loud noise (%)
Audiometry - Had off-work exposure to loud noise (%)
Blood Pressure & Cholesterol - Has high blood pressure (%)
Blood Pressure & Cholesterol - Checking blood pressure at home (%)
Blood Pressure & Cholesterol - Frequently checking blood cholesterol (%)
Blood Pressure & Cholesterol - Has high cholesterol level (%)
Consumer Behavior - Money monthly spent on food at supermarket/grocery store
Consumer Behavior - Money monthly spent on food at other stores
Consumer Behavior - Money monthly spent on eating out
Consumer Behavior - Money monthly spent on carryout/delivered foods
Consumer Behavior - Income spent on food at supermarket/grocery store (%)
Consumer Behavior - Income spent on food at other stores (%)
Consumer Behavior - Income spent on eating out (%)
Consumer Behavior - Income spent on carryout/delivered foods (%)
Current Health Status - General health condition (%)
Current Health Status - Blood donors (%)
Current Health Status - Has blood ever tested for HIV virus (%)
Current Health Status - Left-handed people (%)
Dermatology - People using sunscreen (%)
Diabetes - Diabetics (%)
Diabetes - Had a blood test for high blood sugar (%)
Diabetes - People taking insulin (%)
Diet Behavior & Nutrition - Diet health (%)
Diet Behavior & Nutrition - Milk product consumption (# of products/month)
Diet Behavior & Nutrition - Meals not home prepared (#/week)
Diet Behavior & Nutrition - Meals from fast food or pizza place (#/week)
Diet Behavior & Nutrition - Ready-to-eat foods (#/month)
Diet Behavior & Nutrition - Frozen meals/pizza (#/month)
Drug Use - People that ever used marijuana or hashish (%)
Drug Use - Ever used hard drugs (%)
Drug Use - Ever used any form of cocaine (%)
Drug Use - Ever used heroin (%)
Drug Use - Ever used methamphetamine (%)
Health Insurance - People covered by health insurance (%)
Kidney Conditions-Urology - Avg. # of times urinating at night
Medical Conditions - People with asthma (%)
Medical Conditions - People with anemia (%)
Medical Conditions - People with psoriasis (%)
Medical Conditions - People with overweight (%)
Medical Conditions - Elderly people having difficulties in thinking or remembering (%)
Medical Conditions - People who ever received blood transfusion (%)
Medical Conditions - People having trouble seeing even with glass/contacts (%)
Medical Conditions - People with arthritis (%)
Medical Conditions - People with gout (%)
Medical Conditions - People with congestive heart failure (%)
Medical Conditions - People with coronary heart disease (%)
Medical Conditions - People with angina pectoris (%)
Medical Conditions - People who ever had heart attack (%)
Medical Conditions - People who ever had stroke (%)
Medical Conditions - People with emphysema (%)
Medical Conditions - People with thyroid problem (%)
Medical Conditions - People with chronic bronchitis (%)
Medical Conditions - People with any liver condition (%)
Medical Conditions - People who ever had cancer or malignancy (%)
Mental Health - People who have little interest in doing things (%)
Mental Health - People feeling down, depressed, or hopeless (%)
Mental Health - People who have trouble sleeping or sleeping too much (%)
Mental Health - People feeling tired or having little energy (%)
Mental Health - People with poor appetite or overeating (%)
Mental Health - People feeling bad about themself (%)
Mental Health - People who have trouble concentrating on things (%)
Mental Health - People moving or speaking slowly or too fast (%)
Mental Health - People having thoughts they would be better off dead (%)
Oral Health - Average years since last visit a dentist
Oral Health - People embarrassed because of mouth (%)
Oral Health - People with gum disease (%)
Oral Health - General health of teeth and gums (%)
Oral Health - Average days a week using dental floss/device
Oral Health - Average days a week using mouthwash for dental problem
Oral Health - Average number of teeth
Pesticide Use - Households using pesticides to control insects (%)
Pesticide Use - Households using pesticides to kill weeds (%)
Physical Activity - People doing vigorous-intensity work activities (%)
Physical Activity - People doing moderate-intensity work activities (%)
Physical Activity - People walking or bicycling (%)
Physical Activity - People doing vigorous-intensity recreational activities (%)
Physical Activity - People doing moderate-intensity recreational activities (%)
Physical Activity - Average hours a day doing sedentary activities
Physical Activity - Average hours a day watching TV or videos
Physical Activity - Average hours a day using computer
Physical Functioning - People having limitations keeping them from working (%)
Physical Functioning - People limited in amount of work they can do (%)
Physical Functioning - People that need special equipment to walk (%)
Physical Functioning - People experiencing confusion/memory problems (%)
Physical Functioning - People requiring special healthcare equipment (%)
Prescription Medications - Average number of prescription medicines taking
Preventive Aspirin Use - Adults 40+ taking low-dose aspirin (%)
Reproductive Health - Vaginal deliveries (%)
Reproductive Health - Cesarean deliveries (%)
Reproductive Health - Deliveries resulted in a live birth (%)
Reproductive Health - Pregnancies resulted in a delivery (%)
Reproductive Health - Women breastfeeding newborns (%)
Reproductive Health - Women that had a hysterectomy (%)
Reproductive Health - Women that had both ovaries removed (%)
Reproductive Health - Women that have ever taken birth control pills (%)
Reproductive Health - Women taking birth control pills (%)
Reproductive Health - Women that have ever used Depo-Provera or injectables (%)
Reproductive Health - Women that have ever used female hormones (%)
Sexual Behavior - People 18+ that ever had sex (vaginal, anal, or oral) (%)
Sexual Behavior - Males 18+ that ever had vaginal sex with a woman (%)
Sexual Behavior - Males 18+ that ever performed oral sex on a woman (%)
Sexual Behavior - Males 18+ that ever had anal sex with a woman (%)
Sexual Behavior - Males 18+ that ever had any sex with a man (%)
Sexual Behavior - Females 18+ that ever had vaginal sex with a man (%)
Sexual Behavior - Females 18+ that ever performed oral sex on a man (%)
Sexual Behavior - Females 18+ that ever had anal sex with a man (%)
Sexual Behavior - Females 18+ that ever had any kind of sex with a woman (%)
Sexual Behavior - Average age people first had sex
Sexual Behavior - Average number of female sex partners in lifetime (males 18+)
Sexual Behavior - Average number of female vaginal sex partners in lifetime (males 18+)
Sexual Behavior - Average age people first performed oral sex on a woman (18+)
Sexual Behavior - Average number of woman performed oral sex on in lifetime (18+)
Sexual Behavior - Average number of male sex partners in lifetime (males 18+)
Sexual Behavior - Average number of male anal sex partners in lifetime (males 18+)
Sexual Behavior - Average age people first performed oral sex on a man (18+)
Sexual Behavior - Average number of male oral sex partners in lifetime (18+)
Sexual Behavior - People using protection when performing oral sex (%)
Sexual Behavior - Average number of times people have vaginal or anal sex a year
Sexual Behavior - People having sex without condom (%)
Sexual Behavior - Average number of male sex partners in lifetime (females 18+)
Sexual Behavior - Average number of male vaginal sex partners in lifetime (females 18+)
Sexual Behavior - Average number of female sex partners in lifetime (females 18+)
Sexual Behavior - Circumcised males 18+ (%)
Sleep Disorders - Average hours sleeping at night
Sleep Disorders - People that has trouble sleeping (%)
Smoking-Cigarette Use - People smoking cigarettes (%)
Taste & Smell - People 40+ having problems with smell (%)
Taste & Smell - People 40+ having problems with taste (%)
Taste & Smell - People 40+ that ever had wisdom teeth removed (%)
Taste & Smell - People 40+ that ever had tonsils teeth removed (%)
Taste & Smell - People 40+ that ever had a loss of consciousness because of a head injury (%)
Taste & Smell - People 40+ that ever had a broken nose or other serious injury to face or skull (%)
Taste & Smell - People 40+ that ever had two or more sinus infections (%)
Weight - Average height (inches)
Weight - Average weight (pounds)
Weight - Average BMI
Weight - People that are obese (%)
Weight - People that ever were obese (%)
Weight - People trying to lose weight (%)
Officers per 1,000 residents here:
0.98Ohio average:
2.31
Latest news from Medina, OH collected exclusively by city-data.com from local newspapers, TV, and radio stations
Ancestries: German (17.3%), American (10.4%), Irish (10.3%), English (10.3%), Polish (7.6%), Italian (4.9%).
Current Local Time:
Land area: 11.1 square miles.
Population density: 2,340 people per square mile (low).
604 residents are foreign born (0.8% Latin America , 0.7% Europe , 0.3% Asia , 0.3% Africa , 0.2% North America ).
Median real estate property taxes paid for housing units with mortgages in 2022: $2,878 (1.2%)Median real estate property taxes paid for housing units with no mortgage in 2022: $2,714 (1.2%)
Nearest city with pop. 50,000+: Akron, OH
Nearest city with pop. 1,000,000+: Chicago, IL
Nearest cities:
Latitude: 41.14 N, Longitude: 81.86 W
Daytime population change due to commuting: +4,628 (+17.6%)Workers who live and work in this city: 5,978 (45.7%)
Single-family new house construction building permits:
2022: 6 buildings , average cost: $361,7002021: 35 buildings , average cost: $154,5002020: 34 buildings , average cost: $136,9002019: 13 buildings , average cost: $166,5002017: 3 buildings , average cost: $255,7002016: 4 buildings , average cost: $254,1002015: 3 buildings , average cost: $242,5002013: 1 building , cost: $213,1002012: 2 buildings , average cost: $207,3002011: 2 buildings , average cost: $90,0002009: 1 building , cost: $60,0002008: 1 building , cost: $203,1002007: 3 buildings , average cost: $130,0002006: 4 buildings , average cost: $159,4002005: 32 buildings , average cost: $162,5002004: 86 buildings , average cost: $167,7002003: 104 buildings , average cost: $173,8002002: 147 buildings , average cost: $162,5002001: 170 buildings , average cost: $142,9002000: 254 buildings , average cost: $130,6001999: 281 buildings , average cost: $136,8001998: 292 buildings , average cost: $130,9001997: 292 buildings , average cost: $103,900Unemployment in December 2023:
Population change in the 1990s: +5,785 (+29.9%).
Most common occupations in Medina, OH (%)
Both Males Females
Other sales and related occupations, including supervisors (5.5%)
Preschool, kindergarten, elementary, and middle school teachers (4.0%)
Other production occupations, including supervisors (3.9%)
Sales representatives, services, wholesale and manufacturing (3.8%)
Other management occupations, except farmers and farm managers (3.6%)
Other office and administrative support workers, including supervisors (3.6%)
Secretaries and administrative assistants (3.5%)
Other sales and related occupations, including supervisors (6.4%)
Sales representatives, services, wholesale and manufacturing (5.5%)
Other production occupations, including supervisors (4.7%)
Other management occupations, except farmers and farm managers (4.6%)
Metal workers and plastic workers (4.5%)
Driver/sales workers and truck drivers (4.5%)
Electrical equipment mechanics and other installation, maintenance, and repair workers, including supervisors (3.7%)
Secretaries and administrative assistants (7.5%)
Preschool, kindergarten, elementary, and middle school teachers (7.4%)
Other office and administrative support workers, including supervisors (6.0%)
Registered nurses (4.8%)
Other sales and related occupations, including supervisors (4.5%)
Cashiers (3.1%)
Other production occupations, including supervisors (3.0%)
Tornado activity:
Medina-area historical tornado activity is near Ohio state average. It is 13% greater than the overall U.S. average.
On 4/11/1965, a category F4 (max. wind speeds 207-260 mph) tornado 13.5 miles away from the Medina city center killed 18 people and injured 200 people and caused between $5,000,000 and $50,000,000 in damages.
On 5/31/1985, a category F5 (max. wind speeds 261-318 mph) tornado 37.4 miles away from the city center killed 18 people and injured 310 people and caused between $50,000,000 and $500,000,000 in damages.
Earthquake activity:
Medina-area historical earthquake activity is significantly above Ohio state average. It is 45% smaller than the overall U.S. average. On 9/25/1998 at 19:52:52, a magnitude 5.2 (4.8 MB, 4.3 MS, 5.2 LG, 4.5 MW, Depth: 3.1 mi, Class: Moderate, Intensity: VI - VII) earthquake occurred 80.1 miles away from the city center On 1/31/1986 at 16:46:43, a magnitude 5.0 (5.0 MB) earthquake occurred 48.7 miles away from the city center On 8/23/2011 at 17:51:04, a magnitude 5.8 (5.8 MW, Depth: 3.7 mi) earthquake occurred 306.1 miles away from Medina center On 7/27/1980 at 18:52:21, a magnitude 5.2 (5.1 MB, 4.7 MS, 5.0 UK, 5.2 UK) earthquake occurred 231.0 miles away from the city center On 7/12/1986 at 08:19:37, a magnitude 4.5 (4.5 MB, Class: Light, Intensity: IV - V) earthquake occurred 137.6 miles away from Medina center On 6/10/2019 at 14:50:45, a magnitude 4.0 (4.0 MB, Depth: 1.2 mi) earthquake occurred 43.2 miles away from Medina center Magnitude types: regional Lg-wave magnitude (LG), body-wave magnitude (MB), surface-wave magnitude (MS), moment magnitude (MW) Natural disasters: The number of natural disasters in Medina County (11) is smaller than the US average (15).Major Disasters (Presidential) Declared: 7Emergencies Declared: 3Storms: 6, Floods: 5, Tornadoes: 5, Snowstorms: 2, Blizzard: 1, Hurricane: 1, Mudslide: 1, Wind: 1, Winter Storm: 1, Other: 1 (Note: some incidents may be assigned to more than one category). Main business address for: CORRPRO COMPANIES INC /OH/ SERVICES-ENGINEERING SERVICES ), RPM INTERNATIONAL INC/DE/ PAINTS, VARNISHES, LACQUERS, ENAMELS & ALLIED PRODUCTS ).
Hospitals in Medina: DEERVIEW LANE HOME (5810 DEERVIEW LANE) HOSPICE OF MEDINA COUNTY (797 NORTH COURT STREET) LAFAYETTE ROAD HOME (202 WEST LAFAYETTE ROAD) MEDINA HOSPITAL (Voluntary non-profit - Private, 1000 EAST WASHINGTON STREET) Nursing Homes in Medina: EVERGREEN CARE CENTER (555 SPRINGSBROOK DRIVE) LIFE CARE CENTER OF MEDINA (2400 COLUMBIA RD) MEDINA MEADOWS REHAB AND NURSING CENTRE (550 MINER DR) MEDINA VILLAGE RETIREMENT COMMUNITY, LTD (555 SPRINGBROOK DR) OAKS AT MEDINA,THE (4931 NETTLETON ROAD) OHIO PYTHIAN SISTERS HOME OF MEDINA (550 MINER DR) SAMARITAN CARE CENTER (806 E WASHINGTON STREET) WESTERN RESERVE MASONIC COMM (4931 NETTLETON ROAD) Dialysis Facilities in Medina: FMC - VALLEY CITY (2400 COLUMBIA ROAD) FMC - MEDINA COUNTY KIDNEY CENTER (970 E WASHINGTON STREET SUITE B3) Home Health Centers in Medina: BRIDGESHOME HEALTH CARE (110 HIGHLAND DRIVE) Amtrak station near Medina: 19 miles: AKRON (906 E. BOWERY ST.) Services: enclosed waiting area, public restrooms, public payphones, free short-term parking, free long-term parking, taxi stand.
Colleges/Universities in Medina: Hamrick School Full-time enrollment: 126; Location: 1156 Medina Rd; Private, for-profit; Website: hamrickschool.edu)
Medina County Career Center Full-time enrollment: 63; Location: 1101 W Liberty St; Public; Website: www.mcjvs.edu/ui/)
Colleges/universities with over 2000 students nearest to Medina:
Baldwin Wallace University (about 17 miles; Berea, OH ; Full-time enrollment: 3,699)
University of Akron Main Campus (about 19 miles; Akron, OH ; FT enrollment: 22,216)
Oberlin College (about 22 miles; Oberlin, OH ; FT enrollment: 2,795)
Lorain County Community College (about 22 miles; Elyria, OH ; FT enrollment: 7,690)
The College of Wooster (about 23 miles; Wooster, OH ; FT enrollment: 2,112)
Cuyahoga Community College District (about 27 miles; Cleveland, OH ; FT enrollment: 20,271)
Kent State University at Kent (about 28 miles; Kent, OH ; FT enrollment: 25,431)
Public high schools in Medina: MEDINA HIGH SCHOOL Students: 2,366, Location: 777 E UNION ST, Grades: 9-12)HIGHLAND HIGH SCHOOL Students: 1,098, Location: 4150 RIDGE RD, Grades: 9-12)BUCKEYE HIGH SCHOOL Students: 757, Location: 3084 COLUMBIA RD, Grades: 9-12)MEDINA COUNTY CAREER CENTER Students: 94, Location: 1101 W LIBERTY ST, Grades: PK-12)EVOLVE ACADEMY Location: 222 S BROADWAY ST, Grades: 4-12)
Biggest public elementary/middle schools in Medina: CLAGGETT MIDDLE SCHOOL Students: 925, Location: 420 E UNION ST, Grades: 6-8)A. I. ROOT MIDDLE SCHOOL Students: 810, Location: 333 W STURBRIDGE DR, Grades: 6-8)BUCKEYE PRIMARY SCHOOL Students: 607, Location: 3180 COLUMBIA RD, Grades: KG-3)BUCKEYE INTERMEDIATE SCHOOL Students: 556, Location: 3140 COLUMBIA RD, Grades: PK-6)ELLA CANAVAN ELEMENTARY SCHOOL Students: 531, Location: 825 LAWRENCE ST, Grades: KG-5)H G BLAKE ELEMENTARY SCHOOL Students: 520, Location: 4704 LEXINGTON RIDGE DR, Grades: KG-5)SIDNEY FENN ELEMENTARY SCHOOL Students: 499, Location: 320 N SPRING GROVE ST, Grades: KG-5)GRANGER ELEMENTARY SCHOOL Students: 499, Location: 3940 RIDGE RD, Grades: PK-5)BUCKEYE JUNIOR HIGH SCHOOL Students: 366, Location: 3024 COLUMBIA RD, Grades: 7-8)ELIZA NORTHROP ELEMENTARY Location: 950 EAST REAGAN PARKWAY, Grades: PK-5)
Private elementary/middle schools in Medina: ST FRANCIS XAVIER SCHOOL Students: 502, Location: 612 E WASHINGTON ST, Grades: PK-8)
MEDINA CHRISTIAN ACADEMY Students: 163, Location: 3646 MEDINA RD, Grades: PK-8)
See full list of schools located in Medina Library in Medina: MEDINA COUNTY DISTRICT LIBRARY Operating income: $8,969,589; Location: 210 S. BROADWAY; 395,541 books ; 18,801 e-books ; 61,162 audio materials ; 89,143 video materials ; 266 state licensed databases ; 40 other licensed databases ; 1,370 print serial subscriptions )
User-submitted facts and corrections:
Church in Medina: Fountain of Grace Church, 101 Public Square, Medina, OH (330)722-4847, Pastor: Will Lohnes
New Hope Christian Fellowship(denomination:The Brethren Church)815 N. Court St, Medina,OH 330-721-4594 www.newhope4medina.org
First Baptist Christian Academy also known as Medina Christian Academy no longer houses a high school. It is for grades Pre-K through 6
Notable locations in Medina: (A) , Lifecare Medical Services Medina Substation (B) , Medina City Fire Department (C) , Medina City Hall (D) , Medina County Courthouse (E) , Medina County District Library (F) , Pythian Sisters Home (G) , Medina Fire Department Station 2 (H) , Medina Fire Department Station 3 (I) , Medina County Law Library (J) . Display/hide their locations on the map
Shopping Centers: (1) , North Court Plaza Shopping Center (2) , Victorian Village Shopping Center (3) . Display/hide their locations on the map
Main business address in Medina: (A) . Display/hide its location on the map
Churches in Medina include: (A) , Church of God (B) , Church of God in Christ (C) , First Baptist Church (D) , First Christian Church (E) , Friendship Baptist Church (F) , Saint Francis Xavier Roman Catholic Church (G) , Saint Matthew Evangelical Lutheran Church (H) , Second Baptist Church (I) . Display/hide their locations on the map
Cemeteries: (1) , Medina Catholic Cemetery (2) , Old Medina Cemetery (3) . Display/hide their locations on the map
Reservoir: (A) . Display/hide its location on the map
Rivers and creeks: (A) , North Branch West Branch Rocky River (B) . Display/hide their locations on the map
Parks in Medina include: (1) , Memorial Park (2) , Ray Mellert Park (3) , Crestwood Park (4) , Roscoe Ewing Park (5) , Medina Public Square Historic District (6) . Display/hide their locations on the map
Tourist attractions:
Hotels:
Courts:
Birthplace of: Ryan Dunn - Television personality and stunt performer, Greg Paulus - Football player, Bruce King Hallock - World War II pilot, Scott Fahlman - Computer scientist, Marta Martin - Actress, Roy Bonds - Roy Bonds is a retired power-lifter and MMA fighter, Tony Stockman - College basketball player (Ohio State Buckeyes).
Medina County has a predicted average indoor radon screening level between 2 and 4 pCi/L (pico curies per liter) - Moderate Potential Drinking water stations with addresses in Medina and their reported violations in the past:
GRANGER LAKE CONDO 1 PWS (Population served: 185, Groundwater):
Past health violations:
MCL, Average - Between JAN-2007 and MAR-2007, Contaminant: Arsenic. Follow-up actions: St Compliance achieved (MAY-17-2007), St Public Notif requested (MAY-24-2007), St Violation/Reminder Notice (MAY-24-2007), St Public Notif received (JUN-18-2007)
MCL, Average - Between OCT-2006 and DEC-2006, Contaminant: Arsenic. Follow-up actions: St Public Notif requested (FEB-16-2007), St Violation/Reminder Notice (FEB-16-2007), St Public Notif received (MAR-12-2007), St Compliance achieved (MAY-17-2007)
MCL, Average - Between JUL-2006 and SEP-2006, Contaminant: Arsenic. Follow-up actions: St Public Notif requested (NOV-30-2006), St Violation/Reminder Notice (NOV-30-2006), St Public Notif received (JAN-16-2007), St Compliance achieved (MAY-17-2007)
Past monitoring violations:
One routine major monitoring violation
Population served: 150, Groundwater):
Past monitoring violations:
One routine major monitoring violation
Population served: 150, Groundwater):
Past monitoring violations:
One routine major monitoring violation
Address: UNIT 138 Population served: 108, Groundwater):
Past monitoring violations:
Lead Consumer Notice - In DEC-31-2010, Contaminant: Lead and Copper Rule. Follow-up actions: St Violation/Reminder Notice (FEB-23-2011), St Compliance achieved (MAR-10-2011)
Population served: 100, Groundwater):
Past health violations:
MCL, Monthly (TCR) - In SEP-2010, Contaminant: Coliform. Follow-up actions: St Public Notif requested (SEP-14-2010), St Violation/Reminder Notice (SEP-14-2010), St Public Notif received (DEC-02-2010), St Compliance achieved (JAN-12-2011)
MCL, Monthly (TCR) - In AUG-2010, Contaminant: Coliform. Follow-up actions: St Public Notif requested (AUG-26-2010), St Violation/Reminder Notice (AUG-26-2010), St Compliance achieved (JAN-12-2011)
MCL, Monthly (TCR) - Between JUL-2010 and SEP-2010, Contaminant: Coliform. Follow-up actions: St Public Notif requested (JUL-22-2010), St Violation/Reminder Notice (JUL-22-2010), St Public Notif received (SEP-22-2010), St Compliance achieved (JAN-12-2011)
Population served: 100, Groundwater):
Past health violations:
MCL, Monthly (TCR) - Between OCT-2013 and DEC-2013, Contaminant: Coliform. Follow-up actions: St Violation/Reminder Notice (OCT-28-2013), St Public Notif requested (OCT-28-2013)
MCL, Acute (TCR) - Between JUL-2005 and SEP-2005, Contaminant: Coliform. Follow-up actions: St Public Notif requested (JUL-05-2005), St Violation/Reminder Notice (JUL-05-2005), St Compliance achieved (APR-19-2007)
Past monitoring violations:
Monitoring, Repeat Major (TCR) - Between JUL-2005 and SEP-2005, Contaminant: Coliform (TCR). Follow-up actions: St Public Notif requested (JUL-05-2005), St Violation/Reminder Notice (JUL-05-2005), St Compliance achieved (AUG-09-2007)
2 routine major monitoring violations
One regular monitoring violation
Population served: 85, Groundwater):
Past health violations:
MCL, Monthly (TCR) - Between JUL-2008 and SEP-2008, Contaminant: Coliform. Follow-up actions: St Public Notif requested (OCT-14-2008), St Violation/Reminder Notice (OCT-14-2008), St Public Notif received (DEC-24-2008), St Compliance achieved (JUN-04-2009)
MCL, Monthly (TCR) - Between OCT-2005 and DEC-2005, Contaminant: Coliform. Follow-up actions: St Public Notif requested (OCT-06-2005), St Violation/Reminder Notice (OCT-06-2005), St Public Notif received (NOV-02-2005), St Compliance achieved (APR-19-2007)
MCL, Acute (TCR) - Between OCT-2005 and DEC-2005, Contaminant: Coliform. Follow-up actions: St Violation/Reminder Notice (NOV-18-2005), St Public Notif requested (NOV-18-2005), St Boil Water Order (NOV-18-2005), St Compliance achieved (APR-19-2007)
Past monitoring violations:
Monitoring, Repeat Major (TCR) - Between JUL-2008 and SEP-2008, Contaminant: Coliform (TCR). Follow-up actions: St Public Notif requested (OCT-14-2008), St Violation/Reminder Notice (OCT-14-2008), St Public Notif received (DEC-24-2008), St Compliance achieved (JUN-04-2009)
Monitoring, Repeat Major (TCR) - Between OCT-2005 and DEC-2005, Contaminant: Coliform (TCR). Follow-up actions: St Violation/Reminder Notice (NOV-18-2005), St Public Notif requested (NOV-18-2005), St Compliance achieved (APR-19-2007)
2 routine major monitoring violations
Population served: 63, Groundwater):
Past monitoring violations:
Lead Consumer Notice - In DEC-31-2009, Contaminant: Lead and Copper Rule. Follow-up actions: St Violation/Reminder Notice (JUN-30-2010), St Compliance achieved (SEP-14-2010)
Drinking water stations with addresses in Medina that have no violations reported:
STYX HILL CROSSING (Population served: 50, Primary Water Source Type: Groundwater)
Average household size: This city:
2.5 peopleOhio:
2.4 people
Percentage of family households: This city:
67.3%Whole state:
65.0%
Percentage of households with unmarried partners: This city:
5.6%Whole state:
6.8%
Likely homosexual households (counted as self-reported same-sex unmarried-partner households)
Lesbian couples: 0.3% of all households Gay men: 0.2% of all households
People in group quarters in Medina in 2010:
186 people in nursing facilities/skilled-nursing facilities
136 people in local jails and other municipal confinement facilities
23 people in correctional facilities intended for juveniles
12 people in other noninstitutional facilities
4 people in group homes intended for adults
People in group quarters in Medina in 2000:
266 people in nursing homes
228 people in local jails and other confinement facilities (including police lockups)
15 people in other nonhousehold living situations
8 people in homes for the mentally retarded
4 people in other noninstitutional group quarters
Banks with most branches in Medina (2011 data):
Firstmerit Bank, National Association: Montville Branch, South Court Branch, Extension Branch, Public Square Branch, Northland Branch. Info updated 2010/05/17: Bank assets: $14,420.6 mil, Deposits: $11,497.6 mil, headquarters in Akron, OH, positive income , Commercial Lending Specialization, 213 total offices , Holding Company: Firstmerit Corporation
Fifth Third Bank: Medina North Court Banking Center Br at 810 North Court, branch established on 2004/04/19; Medina Road Branch at 3303 Medina Road, branch established on 1994/11/01. Info updated 2009/10/05: Bank assets: $114,540.4 mil, Deposits: $89,689.1 mil, headquarters in Cincinnati, OH, positive income , Commercial Lending Specialization, 1378 total offices , Holding Company: Fifth Third Bancorp
RBS Citizens, National Association: Res. Mtg Lending Akron - Medina Lpo at 725 N. Court Street, branch established on 2002/07/01; N. Court Street-Medina/Tops Branch at 870 N. Court Street, branch established on 2003/02/28. Info updated 2007/09/19: Bank assets: $106,940.6 mil, Deposits: $75,690.2 mil, headquarters in Providence, RI, positive income , 1135 total offices , Holding Company: Uk Financial Investments Limited
JPMorgan Chase Bank, National Association: Medina Buehlers Branch at 3626 Medina Road, branch established on 1992/03/01; Medina Branch at 285 East Reagan Parkway, branch established on 1981/09/15. Info updated 2011/11/10: Bank assets: $1,811,678.0 mil, Deposits: $1,190,738.0 mil, headquarters in Columbus, OH, positive income , International Specialization, 5577 total offices , Holding Company: Jpmorgan Chase & Co.
Western Reserve Bank: Western Reserve Masonic Branch at 4931 Nettleton Road, branch established on 2000/07/11; at 4015 Medina Road, branch established on 1998/11/06. Info updated 2006/11/03: Bank assets: $192.2 mil, Deposits: $171.8 mil, local headquarters , positive income , Commercial Lending Specialization, 3 total offices , Holding Company: Western Reserve Bancorp, Inc.
KeyBank National Association: Medina Main Branch at 119 Public Square, branch established on 1892/01/01; Medina North Branch at 1090 North Cout Street, branch established on 2008/11/01. Info updated 2008/03/03: Bank assets: $86,198.8 mil, Deposits: $64,214.8 mil, headquarters in Cleveland, OH, positive income , Commercial Lending Specialization, 1067 total offices , Holding Company: Keycorp
U.S. Bank National Association: Medina Branch at 830 N Court St, branch established on 1891/01/01; Medina The Reserve Branch at 3705-A Medina Road, Suite 3, branch established on 2011/10/11. Info updated 2012/01/30: Bank assets: $330,470.8 mil, Deposits: $236,091.5 mil, headquarters in Cincinnati, OH, positive income , 3121 total offices , Holding Company: U.S. Bancorp
PNC Bank, National Association: Medina-Buehlers Branch at 275 Forest Meadows Drive, branch established on 1999/09/09; Medina - River Styx Branch at 5120 Buehlers Drive, branch established on 1974/04/01. Info updated 2012/03/20: Bank assets: $263,309.6 mil, Deposits: $197,343.0 mil, headquarters in Wilmington, DE, positive income , Commercial Lending Specialization, 3085 total offices , Holding Company: Pnc Financial Services Group, Inc., The
Westfield Bank, FSB: Medina Branch at 4992 Foote Rd., branch established on 2006/06/12. Info updated 2011/07/21: Bank assets: $583.4 mil, Deposits: $464.4 mil, headquarters in Westfield Center, OH, positive income , Commercial Lending Specialization, 4 total offices
4 other banks with 4 local branches
For population 15 years and over in Medina:
Never married: 28.4%Now married: 49.1%Separated: 0.8%Widowed: 7.6%Divorced: 14.1% For population 25 years and over in Medina:
High school or higher: 96.0%Bachelor's degree or higher: 35.6%Graduate or professional degree: 11.2%Unemployed: 2.9%Mean travel time to work (commute): 20.4 minutes
Education Gini index (Inequality in education) Here:
9.4Ohio average:
11.0
Religion statistics for Medina, OH (based on Medina County data)
Religion Adherents Congregations Catholic 48,514 9 Mainline Protestant 19,057 48 Evangelical Protestant 18,538 75 Other 2,607 9 Black Protestant 248 2 Orthodox 40 1 None 83,328 -
Source: Clifford Grammich, Kirk Hadaway, Richard Houseal, Dale E.Jones, Alexei Krindatch, Richie Stanley and Richard H.Taylor. 2012. 2010 U.S.Religion Census: Religious Congregations & Membership Study. Association of Statisticians of American Religious Bodies. Jones, Dale E., et al. 2002. Congregations and Membership in the United States 2000. Nashville, TN: Glenmary Research Center. Graphs represent county-level data
Food Environment Statistics: Number of grocery stores : 23Medina County :
1.36 / 10,000 pop.Ohio :
1.89 / 10,000 pop.
Number of supercenters and club stores : 1This county :
0.06 / 10,000 pop.Ohio :
0.13 / 10,000 pop.
Number of convenience stores (no gas) : 11Medina County :
0.65 / 10,000 pop.Ohio :
1.25 / 10,000 pop.
Number of convenience stores (with gas) : 50This county :
2.95 / 10,000 pop.State :
2.93 / 10,000 pop.
Number of full-service restaurants : 101This county :
5.97 / 10,000 pop.State :
6.25 / 10,000 pop.
Adult diabetes rate : This county :
8.2%Ohio :
10.3%
Low-income preschool obesity rate : Medina County :
11.4%Ohio :
11.9%
Health and Nutrition: Healthy diet rate : This city:
49.8%Ohio:
50.4%
Average overall health of teeth and gums : This city:
47.6%State:
47.8%
People feeling badly about themselves : People not drinking alcohol at all : Average hours sleeping at night : General health condition : Average condition of hearing : This city:
79.5%Ohio:
79.1%
More about Health and Nutrition of Medina, OH Residents
Local government employment and payroll (March 2022)
Function
Full-time employees
Monthly full-time payroll
Average yearly full-time wage
Part-time employees
Monthly part-time payroll
Police Protection - Officers
39 $301,259 $92,695 0 $0 Judicial and Legal
27 $119,342 $53,041 12 $41,157 Other and Unallocable
16 $112,723 $84,542 6 $11,422 Solid Waste Management
15 $75,920 $60,736 2 $6,635 Water Supply
10 $60,030 $72,036 0 $0 Streets and Highways
9 $49,927 $66,569 1 $2,737 Parks and Recreation
9 $52,057 $69,409 89 $50,247 Police - Other
8 $49,871 $74,807 5 $13,069 Correction
6 $31,452 $62,904 3 $7,275 Financial Administration
6 $38,832 $77,664 1 $4,953 Housing and Community Development (Local)
5 $27,119 $65,086 0 $0 Other Government Administration
4 $25,586 $76,758 8 $13,257 Firefighters
3 $21,202 $84,808 35 $42,906 Natural Resources
3 $14,180 $56,720 1 $2,441 Fire - Other
0 $0 1 $2,433
Totals for Government
160 $979,499 $73,462 164 $198,531
Medina government finances - Expenditure in 2021 (per resident):
Construction - General - Other: $4,849,000 ($186.26)
Regular Highways: $4,365,000 ($167.67)Judicial and Legal Services: $1,127,000 ($43.29)Air Transportation: $304,000 ($11.68)Miscellaneous Commercial Activities - Other: $81,000 ($3.11)Natural Resources - Other: $11,000 ($0.42)Current Operations - Police Protection: $5,753,000 ($220.99)
Water Utilities: $4,024,000 ($154.57)Parks and Recreation: $3,906,000 ($150.04)Judicial and Legal Services: $3,474,000 ($133.45)Solid Waste Management: $3,212,000 ($123.38)Regular Highways: $1,910,000 ($73.37)Health - Other: $1,461,000 ($56.12)Financial Administration: $1,087,000 ($41.75)General - Other: $1,037,000 ($39.83)Central Staff Services: $1,025,000 ($39.37)Housing and Community Development: $616,000 ($23.66)Miscellaneous Commercial Activities - Other: $551,000 ($21.17)Protective Inspection and Regulation - Other: $401,000 ($15.40)General Public Buildings: $342,000 ($13.14)Local Fire Protection: $310,000 ($11.91)Corrections - Other: $172,000 ($6.61)Natural Resources - Other: $127,000 ($4.88)Air Transportation: $72,000 ($2.77)Parking Facilities: $62,000 ($2.38)General - Interest on Debt: $358,000 ($13.75)
Intergovernmental to State - Water Utilities: $133,000 ($5.11)
Regular Highways: $19,000 ($0.73)Other Capital Outlay - Solid Waste Management: $288,000 ($11.06)
Judicial and Legal Services: $227,000 ($8.72)Air Transportation: $184,000 ($7.07)General - Other: $178,000 ($6.84)Police Protection: $144,000 ($5.53)Parks and Recreation: $143,000 ($5.49)Miscellaneous Commercial Activities - Other: $69,000 ($2.65)Natural Resources - Other: $21,000 ($0.81)Water Utilities: $14,000 ($0.54)Water Utilities - Interest on Debt: $175,000 ($6.72)
Medina government finances - Revenue in 2021 (per resident):
Charges - Solid Waste Management: $3,186,000 ($122.38)
Parks and Recreation: $1,743,000 ($66.95)Other: $829,000 ($31.84)Miscellaneous Commercial Activities: $83,000 ($3.19)Air Transportation: $66,000 ($2.54)Regular Highways: $5,000 ($0.19)Parking Facilities: $3,000 ($0.12)Federal Intergovernmental - Other: $47,000 ($1.81)
Local Intergovernmental - Highways: $61,000 ($2.34)
Other: $47,000 ($1.81)Miscellaneous - Fines and Forfeits: $1,564,000 ($60.08)
Interest Earnings: $744,000 ($28.58)General Revenue - Other: $70,000 ($2.69)Donations From Private Sources: $38,000 ($1.46)Rents: $24,000 ($0.92)Special Assessments: $9,000 ($0.35)Sale of Property: $7,000 ($0.27)Revenue - Water Utilities: $5,218,000 ($200.44)
State Intergovernmental - Other: $2,708,000 ($104.02)
Highways: $1,532,000 ($58.85)Housing and Community Development: $425,000 ($16.33)Health and Hospitals: $167,000 ($6.41)Tax - Individual Income: $15,446,000 ($593.32)
Property: $2,653,000 ($101.91)Public Utilities Sales: $339,000 ($13.02)Other License: $318,000 ($12.22)Other Selective Sales: $1,000 ($0.04)
Medina government finances - Debt in 2021 (per resident):
Long Term Debt - Beginning Outstanding - Unspecified Public Purpose: $15,780,000 ($606.15)
Outstanding Unspecified Public Purpose: $13,860,000 ($532.40)Retired Unspecified Public Purpose: $1,920,000 ($73.75)
Medina government finances - Cash and Securities in 2021 (per resident):
Other Funds - Cash and Securities: $54,386,000 ($2089.12)
Sinking Funds - Cash and Securities: $777,000 ($29.85)
Businesses in Medina, OH
Name Count Name Count
AMF Bowling 1 MasterBrand Cabinets 7 AT&T 1 Mazda 1 Ace Hardware 1 McDonald's 3 Advance Auto Parts 1 Motel 6 1 Applebee's 1 New Balance 1 Arby's 2 Nike 2 AutoZone 1 Nissan 1 Baskin-Robbins 1 OfficeMax 1 Bath & Body Works 1 Old Navy 1 Bed Bath & Beyond 1 Panera Bread 1 Best Western 1 Papa John's Pizza 1 Buffalo Wild Wings 1 Payless 1 Burger King 2 Penske 2 CVS 1 PetSmart 1 Chevrolet 1 Pier 1 Imports 1 Chipotle 1 Pizza Hut 2 Circle K 2 RadioShack 1 Cold Stone Creamery 1 Red Roof Inn 1 Curves 1 Rite Aid 1 Dairy Queen 2 Rodeway Inn 1 Decora Cabinetry 3 Ruby Tuesday 1 DressBarn 1 Sears 2 Dressbarn 1 Shoe Carnival 1 Dunkin Donuts 2 Sprint Nextel 1 Fashion Bug 1 Staples 1 FedEx 6 Starbucks 2 GNC 1 Subway 5 GameStop 2 Super 8 1 Goodwill 1 T-Mobile 2 H&R Block 2 Taco Bell 1 Hilton 1 Target 1 Hobby Lobby 1 The Room Place 1 Home Depot 1 U-Haul 4 Honda 1 UPS 14 Jimmy John's 1 Verizon Wireless 1 KFC 1 Waffle House 1 Kincaid 1 Walgreens 1 Kmart 1 Walmart 1 Kohl's 1 Wendy's 2 Little Caesars Pizza 1 YMCA 1 Marshalls 1
Strongest AM radio stations in Medina:
WKNR (850 AM; 50 kW; CLEVELAND, OH; Owner: CARON BROADCASTING, INC.)
WHK (1220 AM; 50 kW; CLEVELAND, OH; Owner: CARON BROADCASTING, INC.)
WTAM (1100 AM; 50 kW; CLEVELAND, OH; Owner: JACOR BROADCASTING CORPORATION)
WHLO (640 AM; 5 kW; AKRON, OH; Owner: CLEAR CHANNEL BROADCASTING LICENSES, INC.)
WWMK (1260 AM; 10 kW; CLEVELAND, OH; Owner: ABC, INC.)
WERE (1300 AM; 5 kW; CLEVELAND, OH)
WJTB (1040 AM; daytime; 5 kW; NORTH RIDGEVILLE, OH; Owner: TAYLOR BROADCASTING CO)
WCUE (1150 AM; 5 kW; CUYAHOGA FALLS, OH; Owner: FAMILY STATIONS, INC.)
WTOU (1350 AM; 5 kW; AKRON, OH)
WRMR (1420 AM; 5 kW; CLEVELAND, OH; Owner: CLEVELAND CLASSICAL RADIO, LLC)
WHBC (1480 AM; 15 kW; CANTON, OH; Owner: NM LICENSING, LLC)
WAKR (1590 AM; 5 kW; AKRON, OH; Owner: RUBBER CITY RADIO GROUP, INC.)
WEOL (930 AM; 1 kW; ELYRIA, OH; Owner: ELYRIA-LORAIN BROADCASTING CO.)
Strongest FM radio stations in Medina:
WKSU-FM (89.7 FM; KENT, OH; Owner: KENT STATE UNIVERSITY)
WQMX (94.9 FM; MEDINA, OH; Owner: RUBBER CITY RADIO GROUP, INC)
WNWV (107.3 FM; ELYRIA, OH; Owner: ELYRIA-LORAIN BROADCASTING CO.)
WZIP (88.1 FM; AKRON, OH; Owner: THE UNIVERSITY OF AKRON)
WNCX (98.5 FM; CLEVELAND, OH; Owner: INFINITY RADIO OF CLEVELAND INC.)
WONE-FM (97.5 FM; AKRON, OH; Owner: RUBBER CITY RADIO GROUP, INC.)
WMJI (105.7 FM; CLEVELAND, OH; Owner: CITICASTERS LICENSES, L.P.)
WQAL (104.1 FM; CLEVELAND, OH; Owner: INFINITY RADIO OPERATIONS INC.)
WMVX (106.5 FM; CLEVELAND, OH; Owner: JACOR BROADCASTING CORPORATION)
WDOK (102.1 FM; CLEVELAND, OH; Owner: INFINITY RADIO OPERATIONS INC.)
WCRF-FM (103.3 FM; CLEVELAND, OH; Owner: THE MOODY BIBLE INSTITUTE OF CHICAGO)
WZAK (93.1 FM; CLEVELAND, OH; Owner: RADIO ONE LICENSES, LLC)
WAKS (96.5 FM; AKRON, OH; Owner: CAPSTAR TX LIMITED PARTNERSHIP)
WMMS (100.7 FM; CLEVELAND, OH; Owner: CITICASTERS LICENSES, L.P.)
WCPN (90.3 FM; CLEVELAND, OH; Owner: IDEASTREAM)
WGAR-FM (99.5 FM; CLEVELAND, OH; Owner: CITICASTERS LICENSES, L.P.)
WKDD (98.1 FM; CANTON, OH; Owner: CITICASTERS LICENSES, L.P.)
WAPS (91.3 FM; AKRON, OH; Owner: BOARD OF EDUCATION, AKRON CITY SCHOOL DISTRICT)
WENZ (107.9 FM; CLEVELAND, OH; Owner: RADIO ONE LICENSES, LLC)
WFHM-FM (95.5 FM; CLEVELAND, OH; Owner: SCA LICENSE CORPORATION)
TV broadcast stations around Medina:
WEAO (Channel 49; AKRON, OH; Owner: NORTHEASTERN EDUCATIONAL TELEVISION OF OHIO, INC.)
WVPX (Channel 23; AKRON, OH; Owner: PAXSON AKRON LICENSE, INC.)
WEWS-TV (Channel 5; CLEVELAND, OH; Owner: SCRIPPS HOWARD BROADCASTING COMPANY)
WKYC-TV (Channel 3; CLEVELAND, OH; Owner: WKYC-TV, INC.)
WVIZ (Channel 25; CLEVELAND, OH; Owner: IDEASTREAM)
WBNX-TV (Channel 55; AKRON, OH; Owner: WINSTON BROADCASTING NETWORK, INC.)
WOIO (Channel 19; SHAKER HEIGHTS, OH; Owner: RAYCOM NATIONAL, INC.)
WQHS-TV (Channel 61; CLEVELAND, OH; Owner: UNIVISION CLEVELAND LLC)
W35AX (Channel 35; CLEVELAND, OH; Owner: MEDIA-COM TELEVISION, INC.)
WUAB (Channel 43; LORAIN, OH; Owner: RAYCOM NATIONAL, INC.)
WJW (Channel 8; CLEVELAND, OH; Owner: WJW LICENSE, INC.)
WAKN-LP (Channel 11; AKRON, OH; Owner: AKRON TELEVISION, INC.)
WRAP-CA (Channel 32; CLEVELAND, OH; Owner: COMMERCIAL BROADCASTING CORP.)
WMFD-TV (Channel 68; MANSFIELD, OH; Owner: MID-STATE TELEVISION,INC.)
WDLI (Channel 17; CANTON, OH; Owner: TRINITY BROADCASTING NETWORK, INC.)
WAOH-LP (Channel 29; AKRON, OH; Owner: MEDIA-COM TELEVISION, INC.)
WXOX-LP (Channel 65; CLEVELAND, OH; Owner: VENTURE TECHNOLOGIES GROUP, LLC)
W53AX (Channel 53; CLEVELAND, OH; Owner: WORD OF GOD FELLOWSHIP, INC.)
WOAC (Channel 67; CANTON, OH; Owner: WRAY, INC.)
National Bridge Inventory (NBI) Statistics 70 Number of bridges607ft / 185m Total length782,259 Total average daily traffic58,153 Total average daily truck traffic
New bridges - historical statistics
1 1920-1929 2 1930-1939 1 1940-1949 7 1950-1959 13 1960-1969 5 1970-1979 9 1990-1999 23 2000-2009 9 2010-2019
See full National Bridge Inventory statistics for Medina, OH
Home Mortgage Disclosure Act Aggregated Statistics For Year 2009(Based on 5 partial tracts) A) FHA, FSA/RHS & VA B) Conventional C) Refinancings D) Home Improvement Loans E) Loans on Dwellings For 5+ Families F) Non-occupant Loans on G) Loans On Manufactured Number Average Value Number Average Value Number Average Value Number Average Value Number Average Value Number Average Value Number Average Value
LOANS ORIGINATED 87 $156,615 99 $150,081 345 $153,376 11 $24,965 0 $0 10 $88,572 2 $50,825 APPLICATIONS APPROVED, NOT ACCEPTED 1 $163,530 8 $163,405 27 $154,880 5 $18,090 0 $0 1 $109,950 0 $0 APPLICATIONS DENIED 10 $143,315 5 $157,384 114 $166,214 13 $28,510 0 $0 5 $108,742 0 $0 APPLICATIONS WITHDRAWN 5 $156,260 8 $177,044 60 $175,348 0 $0 1 $132,280 2 $90,485 0 $0 FILES CLOSED FOR INCOMPLETENESS 2 $136,065 1 $248,830 20 $156,538 0 $0 0 $0 0 $0 0 $0
Aggregated Statistics For Year 2008(Based on 5 partial tracts) A) FHA, FSA/RHS & VA B) Conventional C) Refinancings D) Home Improvement Loans E) Loans on Dwellings For 5+ Families F) Non-occupant Loans on G) Loans On Manufactured Number Average Value Number Average Value Number Average Value Number Average Value Number Average Value Number Average Value Number Average Value
LOANS ORIGINATED 75 $155,819 118 $165,802 185 $155,743 27 $38,347 1 $1,143,520 17 $96,109 3 $16,097 APPLICATIONS APPROVED, NOT ACCEPTED 5 $155,372 8 $204,760 18 $167,356 8 $30,359 0 $0 0 $0 0 $0 APPLICATIONS DENIED 10 $135,928 15 $197,207 117 $155,623 34 $33,838 0 $0 8 $125,221 2 $98,850 APPLICATIONS WITHDRAWN 3 $185,803 8 $133,540 47 $162,248 6 $57,967 0 $0 2 $133,655 0 $0 FILES CLOSED FOR INCOMPLETENESS 1 $73,180 4 $157,752 10 $148,228 2 $33,445 0 $0 0 $0 0 $0
Aggregated Statistics For Year 2007(Based on 5 partial tracts) A) FHA, FSA/RHS & VA B) Conventional C) Refinancings D) Home Improvement Loans E) Loans on Dwellings For 5+ Families F) Non-occupant Loans on G) Loans On Manufactured Number Average Value Number Average Value Number Average Value Number Average Value Number Average Value Number Average Value Number Average Value
LOANS ORIGINATED 26 $157,827 322 $153,513 205 $128,316 51 $34,756 1 $1,893,330 22 $111,133 4 $44,170 APPLICATIONS APPROVED, NOT ACCEPTED 0 $0 25 $132,550 48 $131,554 14 $30,729 0 $0 4 $93,708 0 $0 APPLICATIONS DENIED 3 $205,813 47 $154,619 172 $147,822 52 $49,135 0 $0 14 $79,384 7 $30,200 APPLICATIONS WITHDRAWN 2 $125,370 19 $159,682 59 $149,476 6 $76,493 1 $1,989,850 3 $94,127 0 $0 FILES CLOSED FOR INCOMPLETENESS 0 $0 12 $117,996 23 $169,168 1 $219,880 0 $0 1 $115,250 0 $0
Aggregated Statistics For Year 2006(Based on 5 partial tracts) A) FHA, FSA/RHS & VA B) Conventional C) Refinancings D) Home Improvement Loans E) Loans on Dwellings For 5+ Families F) Non-occupant Loans on G) Loans On Manufactured Number Average Value Number Average Value Number Average Value Number Average Value Number Average Value Number Average Value Number Average Value
LOANS ORIGINATED 20 $173,319 436 $144,177 293 $124,848 43 $38,025 1 $6,237,920 36 $120,339 3 $27,443 APPLICATIONS APPROVED, NOT ACCEPTED 0 $0 33 $115,226 71 $115,795 11 $33,919 0 $0 5 $150,838 0 $0 APPLICATIONS DENIED 2 $144,390 48 $121,140 194 $137,986 50 $51,426 0 $0 12 $131,623 5 $25,384 APPLICATIONS WITHDRAWN 1 $194,830 43 $132,470 101 $139,382 12 $100,315 0 $0 7 $123,166 0 $0 FILES CLOSED FOR INCOMPLETENESS 0 $0 12 $115,572 33 $153,624 2 $15,510 0 $0 3 $83,673 0 $0
Aggregated Statistics For Year 2005(Based on 5 partial tracts) A) FHA, FSA/RHS & VA B) Conventional C) Refinancings D) Home Improvement Loans E) Loans on Dwellings For 5+ Families F) Non-occupant Loans on G) Loans On Manufactured Number Average Value Number Average Value Number Average Value Number Average Value Number Average Value Number Average Value Number Average Value
LOANS ORIGINATED 30 $153,976 453 $148,362 357 $138,558 34 $34,127 1 $386,250 47 $95,543 2 $82,075 APPLICATIONS APPROVED, NOT ACCEPTED 1 $83,940 37 $122,893 62 $142,283 7 $26,167 0 $0 4 $99,962 3 $26,893 APPLICATIONS DENIED 4 $146,570 57 $130,263 225 $145,981 45 $37,909 0 $0 11 $77,913 7 $45,554 APPLICATIONS WITHDRAWN 2 $207,970 51 $140,047 161 $152,726 22 $160,136 0 $0 8 $101,608 0 $0 FILES CLOSED FOR INCOMPLETENESS 1 $140,380 10 $129,672 30 $169,598 4 $115,612 0 $0 2 $122,865 0 $0
Aggregated Statistics For Year 2004(Based on 5 partial tracts) A) FHA, FSA/RHS & VA B) Conventional C) Refinancings D) Home Improvement Loans E) Loans on Dwellings For 5+ Families F) Non-occupant Loans on G) Loans On Manufactured Number Average Value Number Average Value Number Average Value Number Average Value Number Average Value Number Average Value Number Average Value
LOANS ORIGINATED 39 $148,738 450 $147,852 405 $138,093 39 $40,344 0 $0 37 $101,231 1 $79,290 APPLICATIONS APPROVED, NOT ACCEPTED 1 $80,290 42 $156,709 80 $138,446 9 $34,477 0 $0 3 $104,730 1 $64,450 APPLICATIONS DENIED 4 $185,142 43 $149,634 207 $144,778 53 $34,504 1 $562,510 7 $87,407 5 $25,826 APPLICATIONS WITHDRAWN 2 $120,405 35 $146,461 170 $142,685 11 $54,142 0 $0 5 $123,032 0 $0 FILES CLOSED FOR INCOMPLETENESS 1 $213,820 12 $131,011 37 $165,610 3 $41,633 0 $0 2 $64,185 0 $0
Aggregated Statistics For Year 2003(Based on 5 partial tracts) A) FHA, FSA/RHS & VA B) Conventional C) Refinancings D) Home Improvement Loans E) Loans on Dwellings For 5+ Families F) Non-occupant Loans on Number Average Value Number Average Value Number Average Value Number Average Value Number Average Value Number Average Value
LOANS ORIGINATED 54 $155,739 462 $144,212 1,103 $136,564 37 $28,099 1 $2,599,440 46 $103,084 APPLICATIONS APPROVED, NOT ACCEPTED 0 $0 27 $143,243 130 $129,784 11 $21,858 0 $0 5 $135,188 APPLICATIONS DENIED 3 $164,157 40 $131,406 223 $129,236 33 $17,382 0 $0 11 $100,872 APPLICATIONS WITHDRAWN 6 $151,025 43 $154,326 196 $137,998 6 $14,583 0 $0 4 $123,845 FILES CLOSED FOR INCOMPLETENESS 0 $0 9 $146,781 45 $136,257 5 $32,884 0 $0 3 $91,907
Aggregated Statistics For Year 2002(Based on 3 partial tracts) A) FHA, FSA/RHS & VA B) Conventional C) Refinancings D) Home Improvement Loans F) Non-occupant Loans on Number Average Value Number Average Value Number Average Value Number Average Value Number Average Value
LOANS ORIGINATED 39 $149,148 243 $133,083 462 $134,095 23 $24,201 26 $91,766 APPLICATIONS APPROVED, NOT ACCEPTED 0 $0 22 $132,215 65 $125,785 9 $15,438 3 $93,450 APPLICATIONS DENIED 2 $130,085 21 $95,604 130 $117,489 22 $13,908 2 $107,705 APPLICATIONS WITHDRAWN 5 $147,852 17 $147,276 89 $136,210 3 $44,493 4 $118,985 FILES CLOSED FOR INCOMPLETENESS 0 $0 2 $130,800 22 $131,435 1 $28,480 0 $0
Aggregated Statistics For Year 2001(Based on 3 partial tracts) A) FHA, FSA/RHS & VA B) Conventional C) Refinancings D) Home Improvement Loans E) Loans on Dwellings For 5+ Families F) Non-occupant Loans on Number Average Value Number Average Value Number Average Value Number Average Value Number Average Value Number Average Value
LOANS ORIGINATED 41 $129,286 224 $129,541 377 $126,146 28 $25,954 0 $0 16 $107,313 APPLICATIONS APPROVED, NOT ACCEPTED 0 $0 15 $136,393 56 $122,546 7 $36,200 0 $0 2 $64,610 APPLICATIONS DENIED 1 $219,780 22 $73,417 141 $107,088 25 $13,431 0 $0 3 $59,720 APPLICATIONS WITHDRAWN 3 $90,423 14 $152,889 96 $125,768 11 $20,754 1 $263,400 5 $86,644 FILES CLOSED FOR INCOMPLETENESS 0 $0 3 $114,110 23 $129,559 0 $0 0 $0 0 $0
Aggregated Statistics For Year 2000(Based on 3 partial tracts) A) FHA, FSA/RHS & VA B) Conventional C) Refinancings D) Home Improvement Loans F) Non-occupant Loans on Number Average Value Number Average Value Number Average Value Number Average Value Number Average Value
LOANS ORIGINATED 33 $127,165 245 $127,021 81 $93,908 26 $16,705 13 $72,673 APPLICATIONS APPROVED, NOT ACCEPTED 1 $159,510 20 $85,643 31 $77,275 9 $19,429 2 $32,525 APPLICATIONS DENIED 3 $109,020 36 $78,908 59 $80,487 20 $24,710 2 $89,105 APPLICATIONS WITHDRAWN 1 $200,590 19 $122,768 25 $99,086 4 $50,140 0 $0 FILES CLOSED FOR INCOMPLETENESS 0 $0 4 $123,722 8 $103,454 0 $0 0 $0
Aggregated Statistics For Year 1999(Based on 4 partial tracts) A) FHA, FSA/RHS & VA B) Conventional C) Refinancings D) Home Improvement Loans F) Non-occupant Loans on Number Average Value Number Average Value Number Average Value Number Average Value Number Average Value
LOANS ORIGINATED 61 $122,498 359 $131,466 233 $104,376 28 $21,649 28 $108,645 APPLICATIONS APPROVED, NOT ACCEPTED 1 $127,060 27 $112,561 49 $97,778 19 $17,462 2 $50,325 APPLICATIONS DENIED 3 $98,580 35 $100,285 91 $88,535 23 $26,140 7 $59,913 APPLICATIONS WITHDRAWN 3 $117,060 20 $144,326 52 $101,608 4 $109,620 1 $126,840 FILES CLOSED FOR INCOMPLETENESS 0 $0 5 $112,406 14 $114,879 0 $0 1 $42,930
Detailed HMDA statistics for the following Tracts:
4080.00
, 4081.00 , 4082.00 , 4083.01 , 4083.02
Private Mortgage Insurance Companies Aggregated Statistics For Year 2009(Based on 5 partial tracts) A) Conventional B) Refinancings Number Average Value Number Average Value
LOANS ORIGINATED 17 $174,542 11 $188,345 APPLICATIONS APPROVED, NOT ACCEPTED 2 $103,035 3 $138,013 APPLICATIONS DENIED 1 $283,440 4 $148,290 APPLICATIONS WITHDRAWN 1 $163,800 0 $0 FILES CLOSED FOR INCOMPLETENESS 0 $0 0 $0
Aggregated Statistics For Year 2008(Based on 5 partial tracts) A) Conventional B) Refinancings C) Non-occupant Loans on Number Average Value Number Average Value Number Average Value
LOANS ORIGINATED 40 $192,000 14 $185,574 1 $91,010 APPLICATIONS APPROVED, NOT ACCEPTED 12 $147,342 14 $188,334 0 $0 APPLICATIONS DENIED 1 $165,180 1 $218,180 1 $120,720 APPLICATIONS WITHDRAWN 1 $197,580 1 $169,070 0 $0 FILES CLOSED FOR INCOMPLETENESS 1 $180,230 2 $158,425 1 $217,130
Aggregated Statistics For Year 2007(Based on 5 partial tracts) A) Conventional B) Refinancings C) Non-occupant Loans on Number Average Value Number Average Value Number Average Value
LOANS ORIGINATED 95 $155,300 28 $173,765 3 $104,973 APPLICATIONS APPROVED, NOT ACCEPTED 7 $145,031 10 $176,238 0 $0 APPLICATIONS DENIED 2 $136,570 0 $0 2 $116,410 APPLICATIONS WITHDRAWN 3 $152,810 2 $219,115 0 $0 FILES CLOSED FOR INCOMPLETENESS 1 $127,250 0 $0 0 $0
Aggregated Statistics For Year 2006(Based on 5 partial tracts) A) Conventional B) Refinancings C) Non-occupant Loans on Number Average Value Number Average Value Number Average Value
LOANS ORIGINATED 60 $162,395 21 $170,927 1 $167,250 APPLICATIONS APPROVED, NOT ACCEPTED 6 $139,003 7 $183,931 1 $132,840 APPLICATIONS DENIED 0 $0 1 $181,700 0 $0 APPLICATIONS WITHDRAWN 2 $135,100 2 $223,145 0 $0 FILES CLOSED FOR INCOMPLETENESS 0 $0 0 $0 0 $0
Aggregated Statistics For Year 2005(Based on 5 partial tracts) A) Conventional B) Refinancings C) Non-occupant Loans on Number Average Value Number Average Value Number Average Value
LOANS ORIGINATED 66 $166,407 25 $178,402 4 $88,860 APPLICATIONS APPROVED, NOT ACCEPTED 6 $172,445 10 $163,406 1 $72,420 APPLICATIONS DENIED 0 $0 1 $102,310 0 $0 APPLICATIONS WITHDRAWN 3 $165,520 4 $160,412 1 $143,280 FILES CLOSED FOR INCOMPLETENESS 0 $0 0 $0 0 $0
Aggregated Statistics For Year 2004(Based on 5 partial tracts) A) Conventional B) Refinancings C) Non-occupant Loans on Number Average Value Number Average Value Number Average Value
LOANS ORIGINATED 78 $170,918 38 $163,054 7 $130,410 APPLICATIONS APPROVED, NOT ACCEPTED 11 $180,621 24 $176,097 0 $0 APPLICATIONS DENIED 1 $319,100 0 $0 0 $0 APPLICATIONS WITHDRAWN 3 $204,910 4 $197,125 0 $0 FILES CLOSED FOR INCOMPLETENESS 0 $0 0 $0 0 $0
Aggregated Statistics For Year 2003(Based on 5 partial tracts) A) Conventional B) Refinancings C) Non-occupant Loans on Number Average Value Number Average Value Number Average Value
LOANS ORIGINATED 125 $171,199 123 $157,260 3 $98,393 APPLICATIONS APPROVED, NOT ACCEPTED 15 $180,295 46 $159,370 3 $141,353 APPLICATIONS DENIED 1 $170,580 1 $166,190 0 $0 APPLICATIONS WITHDRAWN 5 $200,084 9 $152,610 1 $130,460 FILES CLOSED FOR INCOMPLETENESS 0 $0 1 $131,310 0 $0
Aggregated Statistics For Year 2002(Based on 3 partial tracts) A) Conventional B) Refinancings C) Non-occupant Loans on Number Average Value Number Average Value Number Average Value
LOANS ORIGINATED 51 $141,556 58 $153,548 2 $138,735 APPLICATIONS APPROVED, NOT ACCEPTED 5 $177,578 15 $156,691 0 $0 APPLICATIONS DENIED 0 $0 0 $0 0 $0 APPLICATIONS WITHDRAWN 3 $104,317 6 $153,967 0 $0 FILES CLOSED FOR INCOMPLETENESS 0 $0 0 $0 0 $0
Aggregated Statistics For Year 2001(Based on 3 partial tracts) A) Conventional B) Refinancings C) Non-occupant Loans on Number Average Value Number Average Value Number Average Value
LOANS ORIGINATED 56 $145,636 56 $145,184 1 $98,190 APPLICATIONS APPROVED, NOT ACCEPTED 10 $150,538 8 $146,521 0 $0 APPLICATIONS DENIED 0 $0 2 $160,010 0 $0 APPLICATIONS WITHDRAWN 1 $104,580 2 $145,815 0 $0 FILES CLOSED FOR INCOMPLETENESS 0 $0 1 $107,790 0 $0
Aggregated Statistics For Year 2000(Based on 3 partial tracts) A) Conventional B) Refinancings C) Non-occupant Loans on Number Average Value Number Average Value Number Average Value
LOANS ORIGINATED 83 $145,493 9 $137,063 3 $94,667 APPLICATIONS APPROVED, NOT ACCEPTED 9 $145,157 3 $139,887 0 $0 APPLICATIONS DENIED 1 $82,520 1 $114,480 0 $0 APPLICATIONS WITHDRAWN 2 $127,950 0 $0 0 $0 FILES CLOSED FOR INCOMPLETENESS 0 $0 0 $0 0 $0
Aggregated Statistics For Year 1999(Based on 4 partial tracts) A) Conventional B) Refinancings C) Non-occupant Loans on Number Average Value Number Average Value Number Average Value
LOANS ORIGINATED 138 $142,904 27 $139,162 3 $96,470 APPLICATIONS APPROVED, NOT ACCEPTED 8 $165,659 6 $111,780 0 $0 APPLICATIONS DENIED 5 $136,454 3 $147,447 0 $0 APPLICATIONS WITHDRAWN 1 $189,770 1 $138,740 0 $0 FILES CLOSED FOR INCOMPLETENESS 1 $138,710 0 $0 0 $0
Detailed PMIC statistics for the following Tracts:
4080.00
, 4081.00 , 4082.00 , 4083.01 , 4083.02 Fire-safe hotels and motels in Medina, Ohio:
Quality Inn & Suites, 2850 Medina Rd, Medina, Ohio 44256 Phone: (330) 723-4994
Red Roof Inn, 5021 Eastpointe Dr, Medina, Ohio 44256 Phone: (330) 725-1395, Fax: (330) 722-5099
Hampton Inn, 3073 Eastpointe Dr, Medina, Ohio 44256 Phone: (330) 721-8955, Fax: (330) 721-8954
Holiday Inn Express & Suites Medina, 5185 Gateway Dr, Medina, Ohio 44256 Phone: (330) 722-6006, Fax: (330) 722-6007
Days Inn, 5200 Montville Dr, Medina, Ohio 44256 Phone: (330) 722-4335, Fax: (330) 725-6101
All 5 fire-safe hotels and motels in Medina, Ohio
Most common first names in Medina, OH among deceased individuals Name Count Lived (average)
John 270 77.5 years Mary 247 81.8 years William 199 74.6 years Robert 185 71.3 years Helen 149 83.1 years James 145 71.4 years Charles 138 76.3 years George 105 78.2 years Ruth 104 80.5 years Frank 101 78.2 years
Most common last names in Medina, OH among deceased individuals Last name Count Lived (average)
Smith 77 78.0 years Miller 51 77.0 years Johnson 48 76.1 years Davis 47 73.7 years Jones 41 76.7 years Williams 31 75.7 years Thomas 28 74.2 years Martin 27 81.3 years Wilson 26 77.7 years Anderson 25 80.9 years
Medina compared to Ohio state average:
Unemployed percentage significantly below state average. Black race population percentage significantly below state average. Median age below state average. Foreign-born population percentage below state average. Percentage of population with a bachelor's degree or higher above state average.
Top Patent Applicants
Richard C. Darr (18)
Emil Sturniolo (18)
Andres Ignacio Delgado (16)
Robert Bekoscke (15)
Robert Anthony Neubauer (15)
Eugene J. Kozlowski (13)
Mark A. Schubert (12)
Lee S. Weinerman (12)
Mark Vanderaar (11)
Christopher M. Charlton (11)
Total of 782 patent applications in 2008-2024.

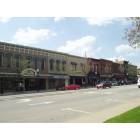
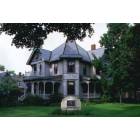
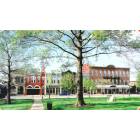
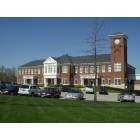
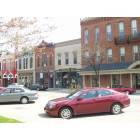


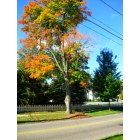
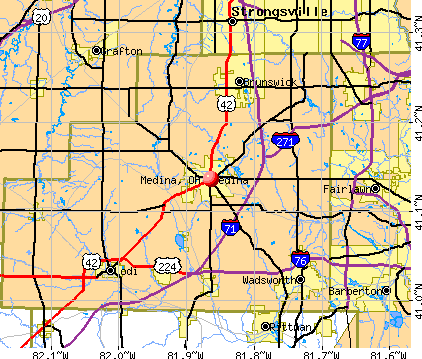


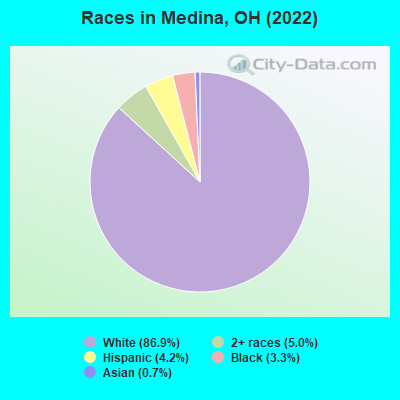
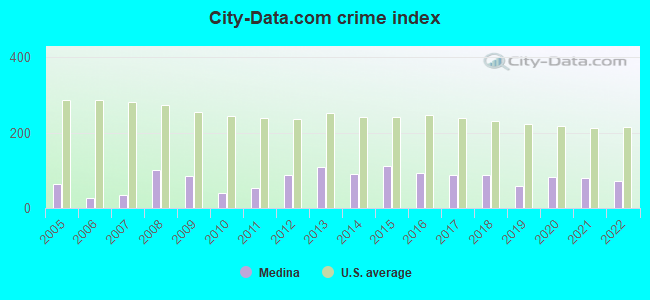
 Recent articles from our blog. Our writers, many of them Ph.D. graduates or candidates, create easy-to-read articles on a wide variety of topics.

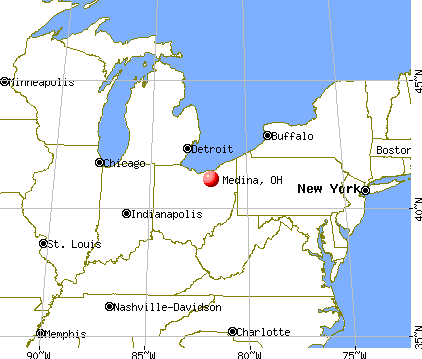
 (18.6 miles
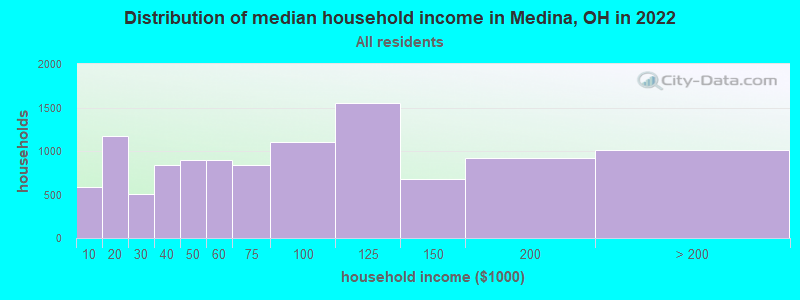
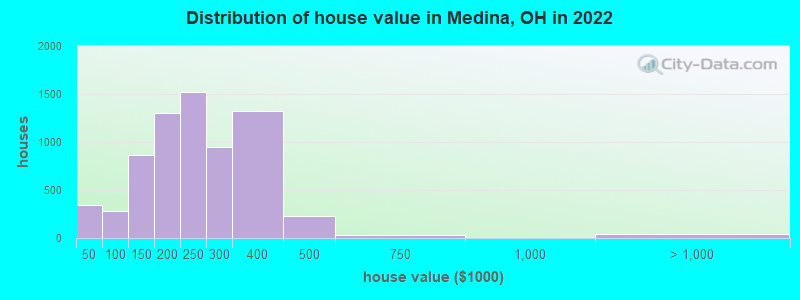
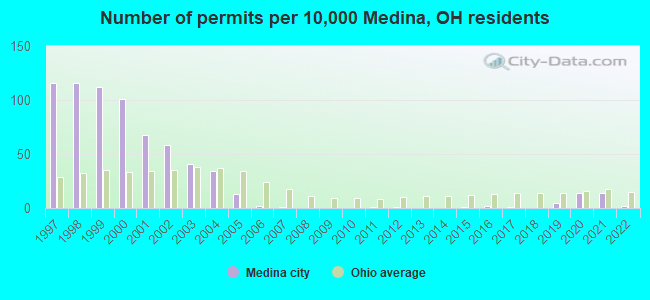
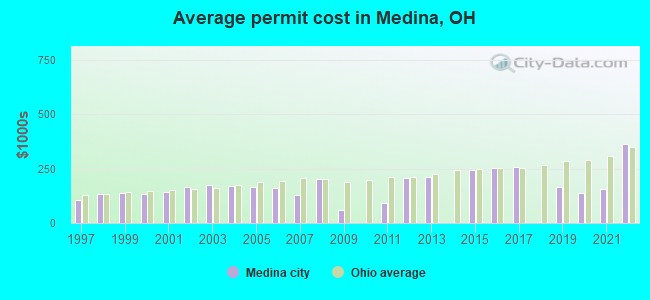
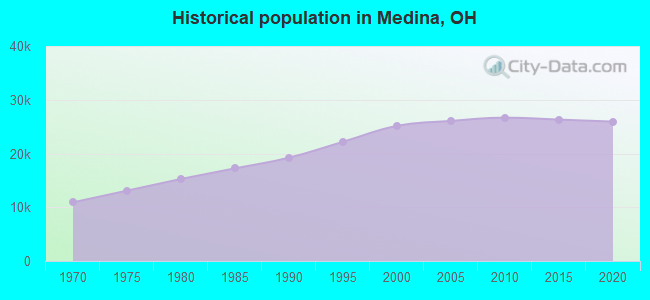
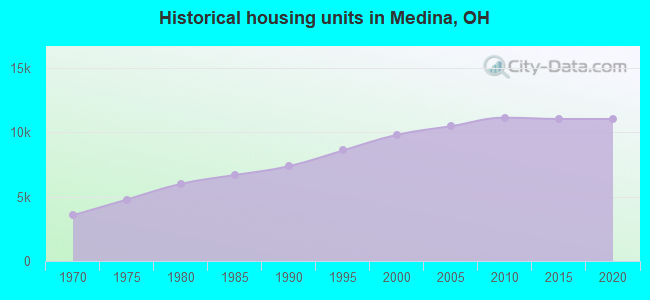
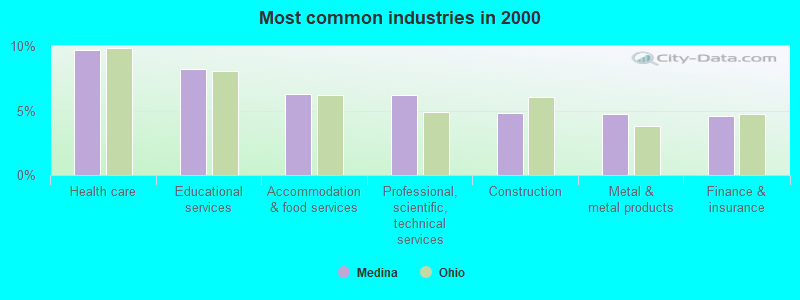
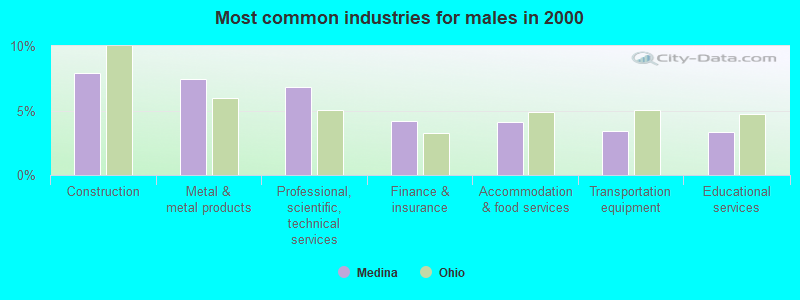
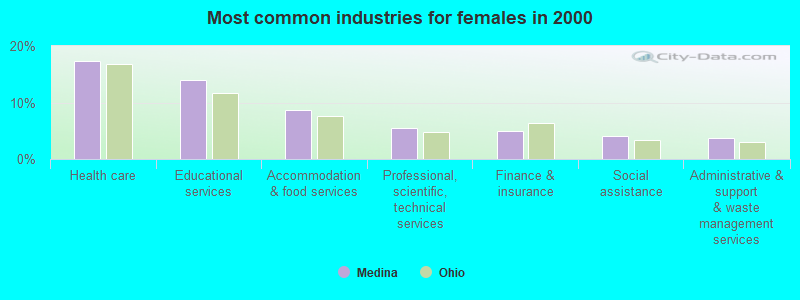
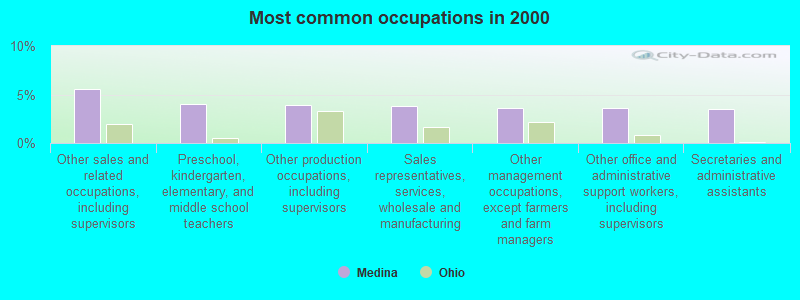
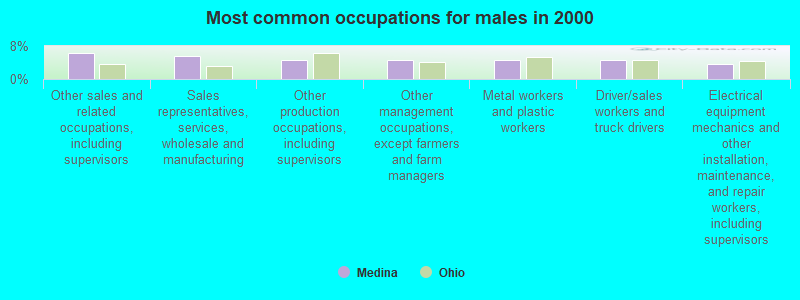
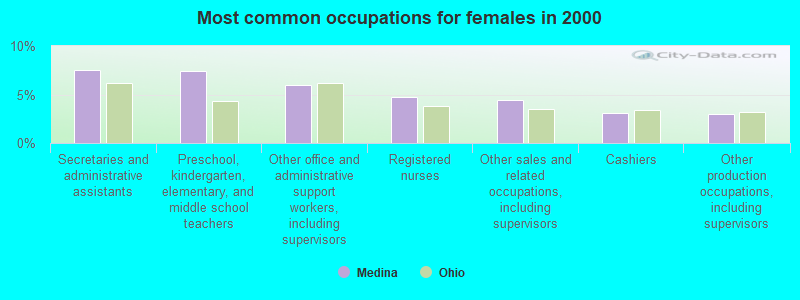
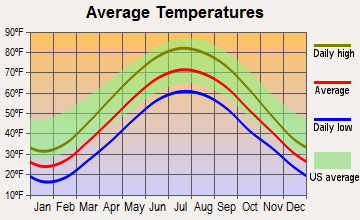
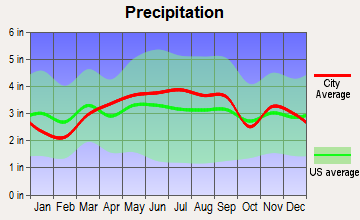
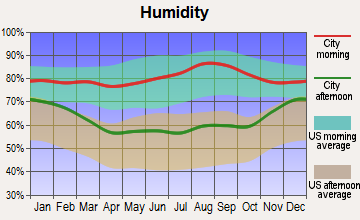
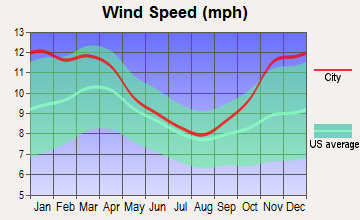
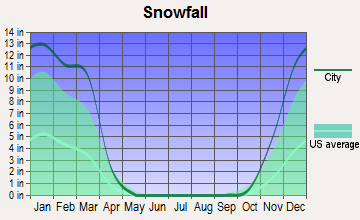
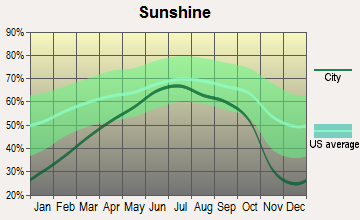
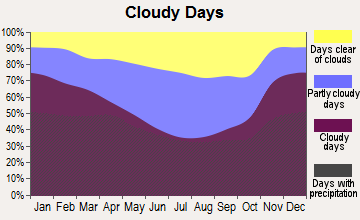
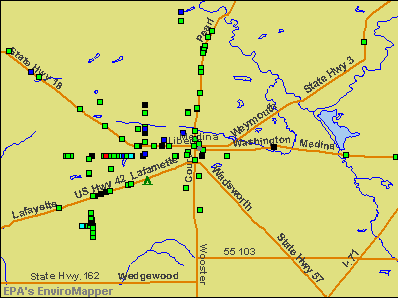

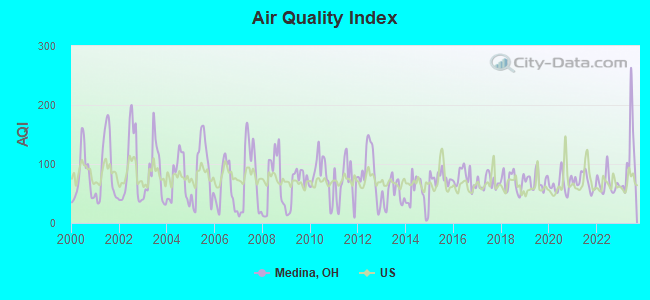
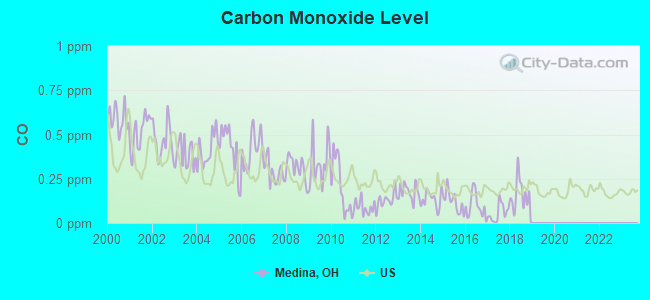
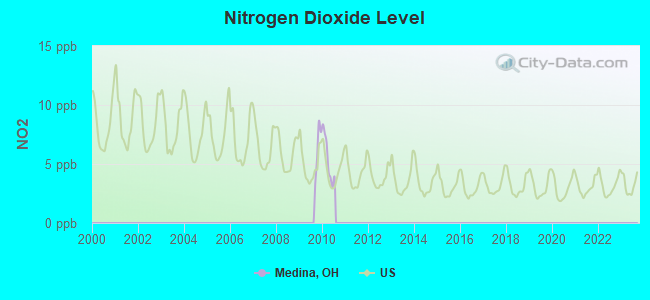
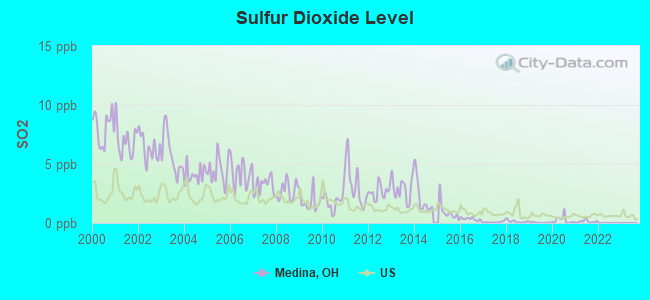
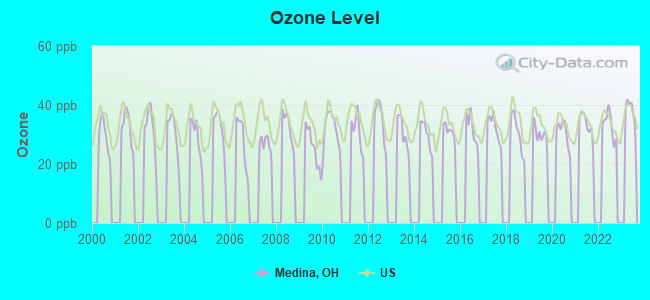
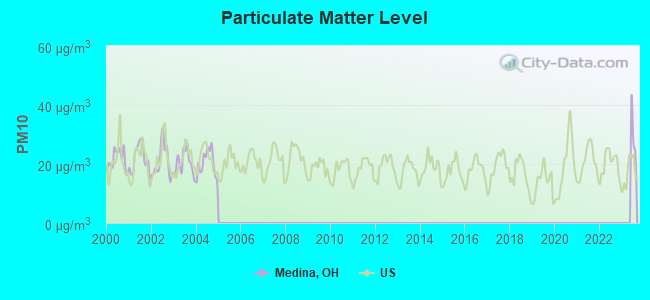
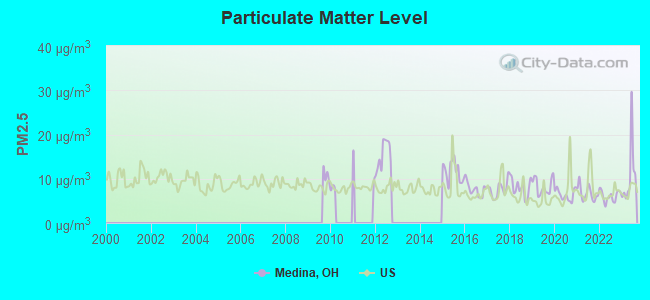

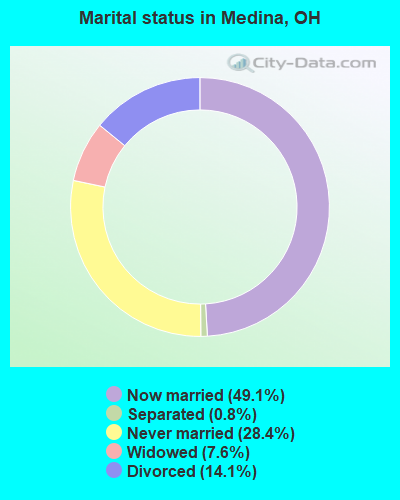
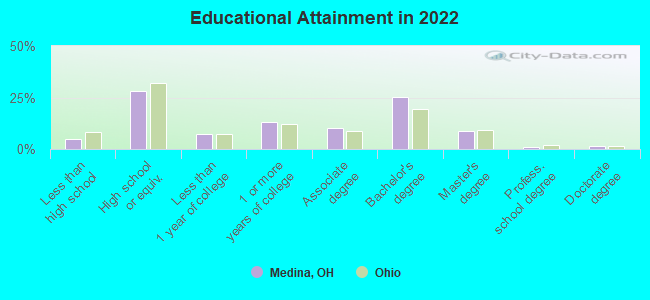
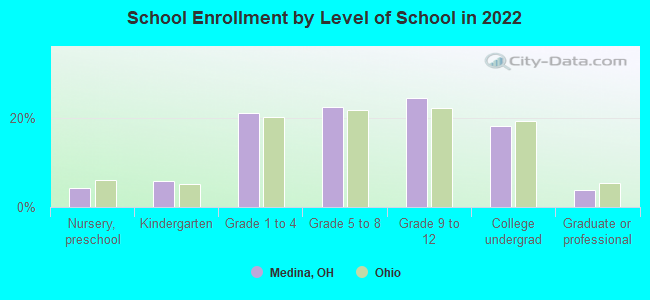
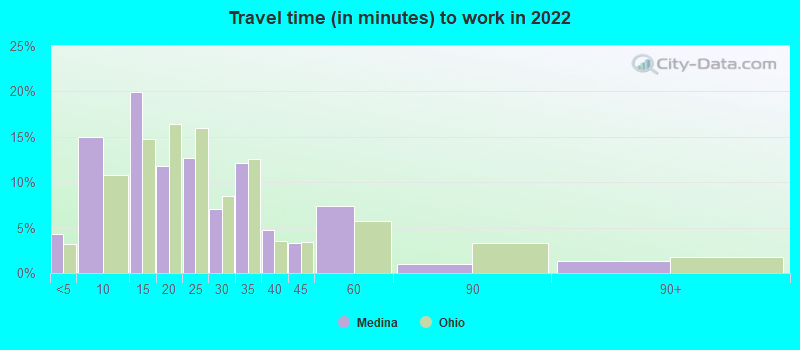
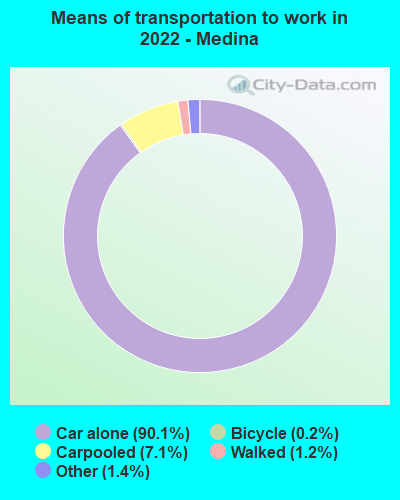
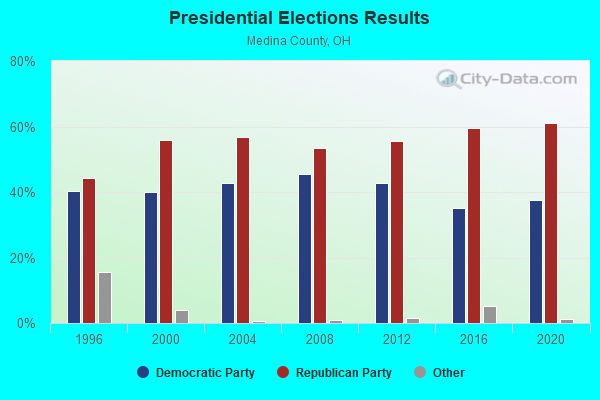
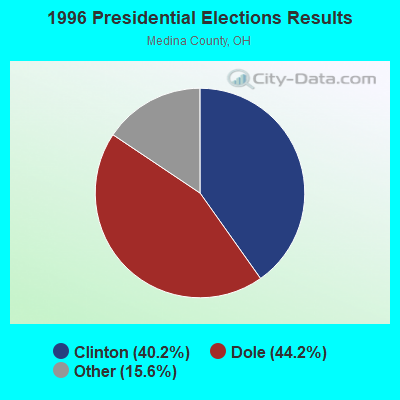
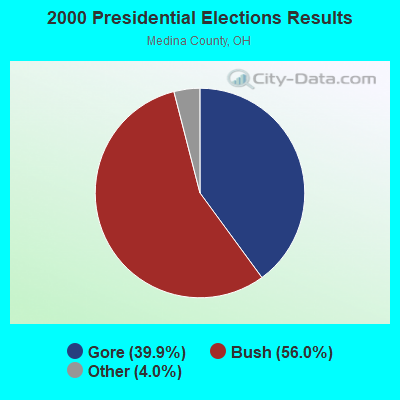
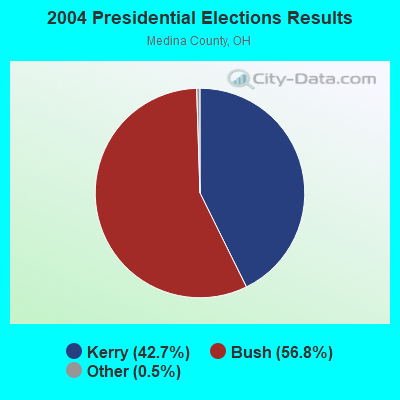
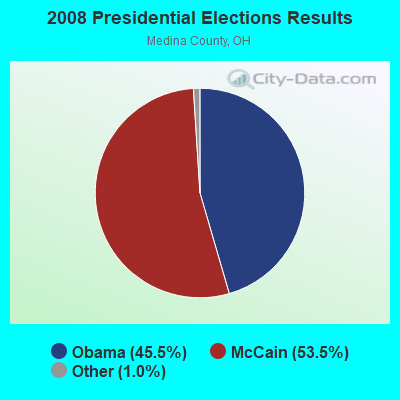
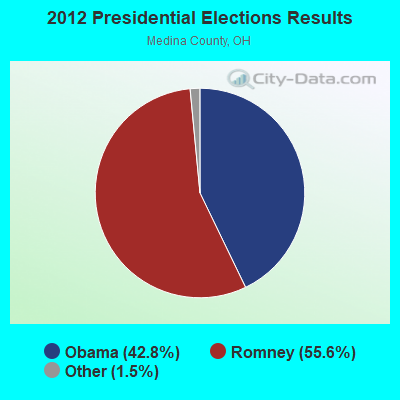
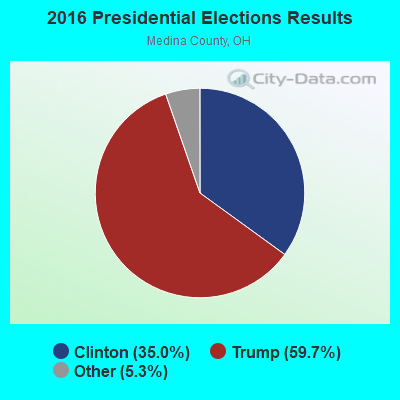
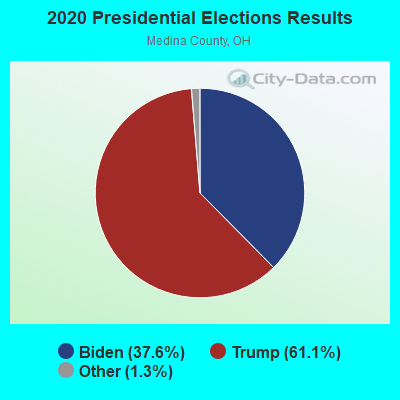
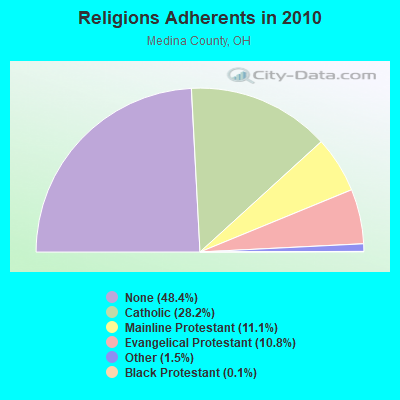

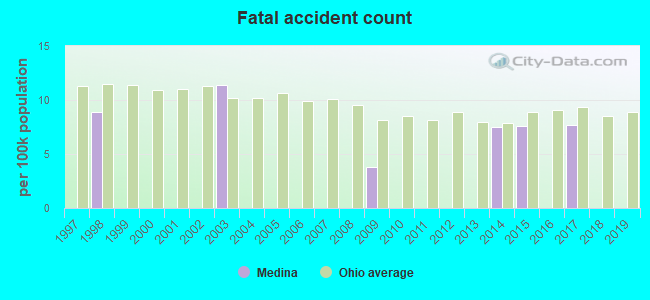
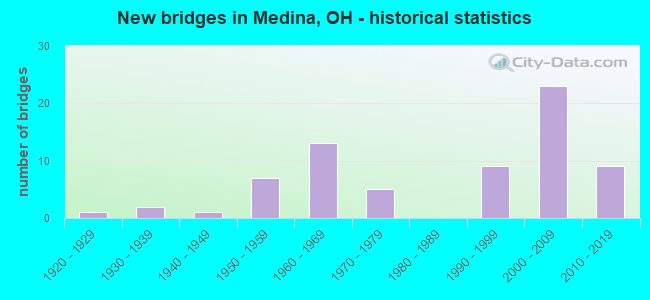
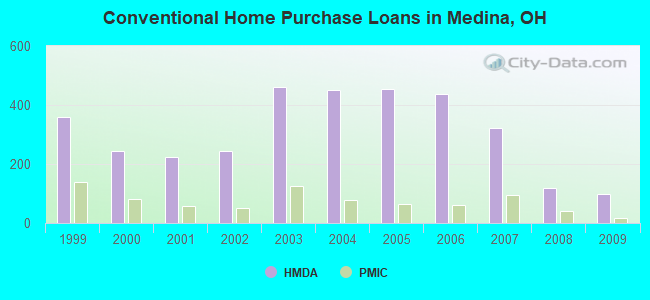
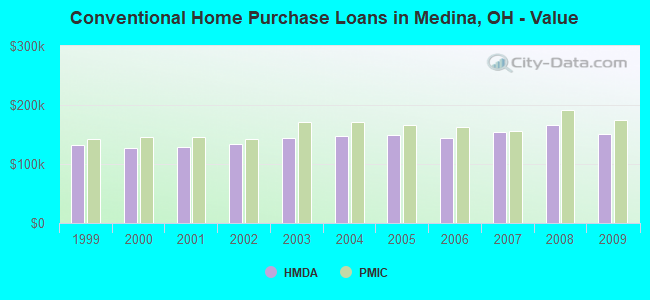
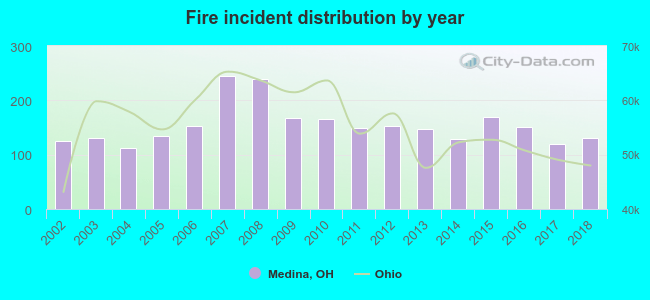 According to the data from the years 2002 - 2018 the average number of fires per year is 154. The highest number of reported fires - 244 took place in 2007, and the least - 113 in 2004. The data has a rising trend.
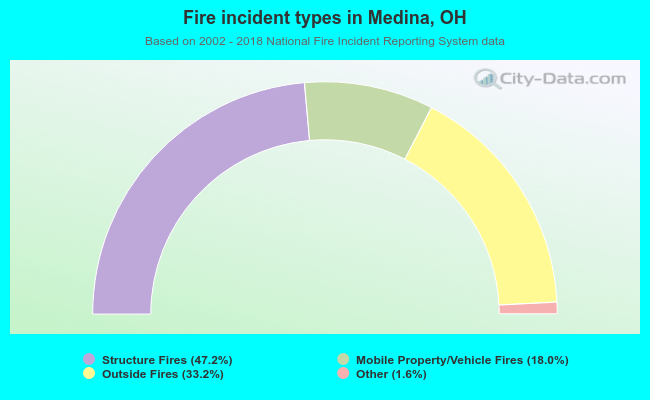 When looking into fire subcategories, the most incidents belonged to: Structure Fires (47.2%), and Outside Fires (33.2%).