Middletown, Pennsylvania Submit your own pictures of this borough and show them to the world
OSM Map
General Map
Google Map
MSN Map
OSM Map
General Map
Google Map
MSN Map
OSM Map
General Map
Google Map
MSN Map
OSM Map
General Map
Google Map
MSN Map
Please wait while loading the map...
Population in 2022: 9,593 (100% urban, 0% rural). Population change since 2000: +3.8%Males: 4,691 Females: 4,902
March 2022 cost of living index in Middletown: 96.0 (near average, U.S. average is 100) Percentage of residents living in poverty in 2022: 16.0%for White Non-Hispanic residents , 24.0% for Black residents , 30.7% for Hispanic or Latino residents , 3.3% for other race residents , 27.6% for two or more races residents )
Profiles of local businesses
Business Search - 14 Million verified businesses
Data:
Median household income ($)
Median household income (% change since 2000)
Household income diversity
Ratio of average income to average house value (%)
Ratio of average income to average rent
Median household income ($) - White
Median household income ($) - Black or African American
Median household income ($) - Asian
Median household income ($) - Hispanic or Latino
Median household income ($) - American Indian and Alaska Native
Median household income ($) - Multirace
Median household income ($) - Other Race
Median household income for houses/condos with a mortgage ($)
Median household income for apartments without a mortgage ($)
Races - White alone (%)
Races - White alone (% change since 2000)
Races - Black alone (%)
Races - Black alone (% change since 2000)
Races - American Indian alone (%)
Races - American Indian alone (% change since 2000)
Races - Asian alone (%)
Races - Asian alone (% change since 2000)
Races - Hispanic (%)
Races - Hispanic (% change since 2000)
Races - Native Hawaiian and Other Pacific Islander alone (%)
Races - Native Hawaiian and Other Pacific Islander alone (% change since 2000)
Races - Two or more races (%)
Races - Two or more races (% change since 2000)
Races - Other race alone (%)
Races - Other race alone (% change since 2000)
Racial diversity
Unemployment (%)
Unemployment (% change since 2000)
Unemployment (%) - White
Unemployment (%) - Black or African American
Unemployment (%) - Asian
Unemployment (%) - Hispanic or Latino
Unemployment (%) - American Indian and Alaska Native
Unemployment (%) - Multirace
Unemployment (%) - Other Race
Population density (people per square mile)
Population - Males (%)
Population - Females (%)
Population - Males (%) - White
Population - Males (%) - Black or African American
Population - Males (%) - Asian
Population - Males (%) - Hispanic or Latino
Population - Males (%) - American Indian and Alaska Native
Population - Males (%) - Multirace
Population - Males (%) - Other Race
Population - Females (%) - White
Population - Females (%) - Black or African American
Population - Females (%) - Asian
Population - Females (%) - Hispanic or Latino
Population - Females (%) - American Indian and Alaska Native
Population - Females (%) - Multirace
Population - Females (%) - Other Race
Coronavirus confirmed cases (Apr 27, 2024)
Deaths caused by coronavirus (Apr 27, 2024)
Coronavirus confirmed cases (per 100k population) (Apr 27, 2024)
Deaths caused by coronavirus (per 100k population) (Apr 27, 2024)
Daily increase in number of cases (Apr 27, 2024)
Weekly increase in number of cases (Apr 27, 2024)
Cases doubled (in days) (Apr 27, 2024)
Hospitalized patients (Apr 18, 2022)
Negative test results (Apr 18, 2022)
Total test results (Apr 18, 2022)
COVID Vaccine doses distributed (per 100k population) (Sep 19, 2023)
COVID Vaccine doses administered (per 100k population) (Sep 19, 2023)
COVID Vaccine doses distributed (Sep 19, 2023)
COVID Vaccine doses administered (Sep 19, 2023)
Likely homosexual households (%)
Likely homosexual households (% change since 2000)
Likely homosexual households - Lesbian couples (%)
Likely homosexual households - Lesbian couples (% change since 2000)
Likely homosexual households - Gay men (%)
Likely homosexual households - Gay men (% change since 2000)
Cost of living index
Median gross rent ($)
Median contract rent ($)
Median monthly housing costs ($)
Median house or condo value ($)
Median house or condo value ($ change since 2000)
Mean house or condo value by units in structure - 1, detached ($)
Mean house or condo value by units in structure - 1, attached ($)
Mean house or condo value by units in structure - 2 ($)
Mean house or condo value by units in structure by units in structure - 3 or 4 ($)
Mean house or condo value by units in structure - 5 or more ($)
Mean house or condo value by units in structure - Boat, RV, van, etc. ($)
Mean house or condo value by units in structure - Mobile home ($)
Median house or condo value ($) - White
Median house or condo value ($) - Black or African American
Median house or condo value ($) - Asian
Median house or condo value ($) - Hispanic or Latino
Median house or condo value ($) - American Indian and Alaska Native
Median house or condo value ($) - Multirace
Median house or condo value ($) - Other Race
Median resident age
Resident age diversity
Median resident age - Males
Median resident age - Females
Median resident age - White
Median resident age - Black or African American
Median resident age - Asian
Median resident age - Hispanic or Latino
Median resident age - American Indian and Alaska Native
Median resident age - Multirace
Median resident age - Other Race
Median resident age - Males - White
Median resident age - Males - Black or African American
Median resident age - Males - Asian
Median resident age - Males - Hispanic or Latino
Median resident age - Males - American Indian and Alaska Native
Median resident age - Males - Multirace
Median resident age - Males - Other Race
Median resident age - Females - White
Median resident age - Females - Black or African American
Median resident age - Females - Asian
Median resident age - Females - Hispanic or Latino
Median resident age - Females - American Indian and Alaska Native
Median resident age - Females - Multirace
Median resident age - Females - Other Race
Commute - mean travel time to work (minutes)
Travel time to work - Less than 5 minutes (%)
Travel time to work - Less than 5 minutes (% change since 2000)
Travel time to work - 5 to 9 minutes (%)
Travel time to work - 5 to 9 minutes (% change since 2000)
Travel time to work - 10 to 19 minutes (%)
Travel time to work - 10 to 19 minutes (% change since 2000)
Travel time to work - 20 to 29 minutes (%)
Travel time to work - 20 to 29 minutes (% change since 2000)
Travel time to work - 30 to 39 minutes (%)
Travel time to work - 30 to 39 minutes (% change since 2000)
Travel time to work - 40 to 59 minutes (%)
Travel time to work - 40 to 59 minutes (% change since 2000)
Travel time to work - 60 to 89 minutes (%)
Travel time to work - 60 to 89 minutes (% change since 2000)
Travel time to work - 90 or more minutes (%)
Travel time to work - 90 or more minutes (% change since 2000)
Marital status - Never married (%)
Marital status - Now married (%)
Marital status - Separated (%)
Marital status - Widowed (%)
Marital status - Divorced (%)
Median family income ($)
Median family income (% change since 2000)
Median non-family income ($)
Median non-family income (% change since 2000)
Median per capita income ($)
Median per capita income (% change since 2000)
Median family income ($) - White
Median family income ($) - Black or African American
Median family income ($) - Asian
Median family income ($) - Hispanic or Latino
Median family income ($) - American Indian and Alaska Native
Median family income ($) - Multirace
Median family income ($) - Other Race
Median year house/condo built
Median year apartment built
Year house built - Built 2005 or later (%)
Year house built - Built 2000 to 2004 (%)
Year house built - Built 1990 to 1999 (%)
Year house built - Built 1980 to 1989 (%)
Year house built - Built 1970 to 1979 (%)
Year house built - Built 1960 to 1969 (%)
Year house built - Built 1950 to 1959 (%)
Year house built - Built 1940 to 1949 (%)
Year house built - Built 1939 or earlier (%)
Average household size
Household density (households per square mile)
Average household size - White
Average household size - Black or African American
Average household size - Asian
Average household size - Hispanic or Latino
Average household size - American Indian and Alaska Native
Average household size - Multirace
Average household size - Other Race
Occupied housing units (%)
Vacant housing units (%)
Owner occupied housing units (%)
Renter occupied housing units (%)
Vacancy status - For rent (%)
Vacancy status - For sale only (%)
Vacancy status - Rented or sold, not occupied (%)
Vacancy status - For seasonal, recreational, or occasional use (%)
Vacancy status - For migrant workers (%)
Vacancy status - Other vacant (%)
Residents with income below the poverty level (%)
Residents with income below 50% of the poverty level (%)
Children below poverty level (%)
Poor families by family type - Married-couple family (%)
Poor families by family type - Male, no wife present (%)
Poor families by family type - Female, no husband present (%)
Poverty status for native-born residents (%)
Poverty status for foreign-born residents (%)
Poverty among high school graduates not in families (%)
Poverty among people who did not graduate high school not in families (%)
Residents with income below the poverty level (%) - White
Residents with income below the poverty level (%) - Black or African American
Residents with income below the poverty level (%) - Asian
Residents with income below the poverty level (%) - Hispanic or Latino
Residents with income below the poverty level (%) - American Indian and Alaska Native
Residents with income below the poverty level (%) - Multirace
Residents with income below the poverty level (%) - Other Race
Air pollution - Air Quality Index (AQI)
Air pollution - CO
Air pollution - NO2
Air pollution - SO2
Air pollution - Ozone
Air pollution - PM10
Air pollution - PM25
Air pollution - Pb
Crime - Murders per 100,000 population
Crime - Rapes per 100,000 population
Crime - Robberies per 100,000 population
Crime - Assaults per 100,000 population
Crime - Burglaries per 100,000 population
Crime - Thefts per 100,000 population
Crime - Auto thefts per 100,000 population
Crime - Arson per 100,000 population
Crime - City-data.com crime index
Crime - Violent crime index
Crime - Property crime index
Crime - Murders per 100,000 population (5 year average)
Crime - Rapes per 100,000 population (5 year average)
Crime - Robberies per 100,000 population (5 year average)
Crime - Assaults per 100,000 population (5 year average)
Crime - Burglaries per 100,000 population (5 year average)
Crime - Thefts per 100,000 population (5 year average)
Crime - Auto thefts per 100,000 population (5 year average)
Crime - Arson per 100,000 population (5 year average)
Crime - City-data.com crime index (5 year average)
Crime - Violent crime index (5 year average)
Crime - Property crime index (5 year average)
1996 Presidential Elections Results (%) - Democratic Party (Clinton)
1996 Presidential Elections Results (%) - Republican Party (Dole)
1996 Presidential Elections Results (%) - Other
2000 Presidential Elections Results (%) - Democratic Party (Gore)
2000 Presidential Elections Results (%) - Republican Party (Bush)
2000 Presidential Elections Results (%) - Other
2004 Presidential Elections Results (%) - Democratic Party (Kerry)
2004 Presidential Elections Results (%) - Republican Party (Bush)
2004 Presidential Elections Results (%) - Other
2008 Presidential Elections Results (%) - Democratic Party (Obama)
2008 Presidential Elections Results (%) - Republican Party (McCain)
2008 Presidential Elections Results (%) - Other
2012 Presidential Elections Results (%) - Democratic Party (Obama)
2012 Presidential Elections Results (%) - Republican Party (Romney)
2012 Presidential Elections Results (%) - Other
2016 Presidential Elections Results (%) - Democratic Party (Clinton)
2016 Presidential Elections Results (%) - Republican Party (Trump)
2016 Presidential Elections Results (%) - Other
2020 Presidential Elections Results (%) - Democratic Party (Biden)
2020 Presidential Elections Results (%) - Republican Party (Trump)
2020 Presidential Elections Results (%) - Other
Ancestries Reported - Arab (%)
Ancestries Reported - Czech (%)
Ancestries Reported - Danish (%)
Ancestries Reported - Dutch (%)
Ancestries Reported - English (%)
Ancestries Reported - French (%)
Ancestries Reported - French Canadian (%)
Ancestries Reported - German (%)
Ancestries Reported - Greek (%)
Ancestries Reported - Hungarian (%)
Ancestries Reported - Irish (%)
Ancestries Reported - Italian (%)
Ancestries Reported - Lithuanian (%)
Ancestries Reported - Norwegian (%)
Ancestries Reported - Polish (%)
Ancestries Reported - Portuguese (%)
Ancestries Reported - Russian (%)
Ancestries Reported - Scotch-Irish (%)
Ancestries Reported - Scottish (%)
Ancestries Reported - Slovak (%)
Ancestries Reported - Subsaharan African (%)
Ancestries Reported - Swedish (%)
Ancestries Reported - Swiss (%)
Ancestries Reported - Ukrainian (%)
Ancestries Reported - United States (%)
Ancestries Reported - Welsh (%)
Ancestries Reported - West Indian (%)
Ancestries Reported - Other (%)
Educational Attainment - No schooling completed (%)
Educational Attainment - Less than high school (%)
Educational Attainment - High school or equivalent (%)
Educational Attainment - Less than 1 year of college (%)
Educational Attainment - 1 or more years of college (%)
Educational Attainment - Associate degree (%)
Educational Attainment - Bachelor's degree (%)
Educational Attainment - Master's degree (%)
Educational Attainment - Professional school degree (%)
Educational Attainment - Doctorate degree (%)
School Enrollment - Nursery, preschool (%)
School Enrollment - Kindergarten (%)
School Enrollment - Grade 1 to 4 (%)
School Enrollment - Grade 5 to 8 (%)
School Enrollment - Grade 9 to 12 (%)
School Enrollment - College undergrad (%)
School Enrollment - Graduate or professional (%)
School Enrollment - Not enrolled in school (%)
School enrollment - Public schools (%)
School enrollment - Private schools (%)
School enrollment - Not enrolled (%)
Median number of rooms in houses and condos
Median number of rooms in apartments
Housing units lacking complete plumbing facilities (%)
Housing units lacking complete kitchen facilities (%)
Density of houses
Urban houses (%)
Rural houses (%)
Households with people 60 years and over (%)
Households with people 65 years and over (%)
Households with people 75 years and over (%)
Households with one or more nonrelatives (%)
Households with no nonrelatives (%)
Population in households (%)
Family households (%)
Nonfamily households (%)
Population in families (%)
Family households with own children (%)
Median number of bedrooms in owner occupied houses
Mean number of bedrooms in owner occupied houses
Median number of bedrooms in renter occupied houses
Mean number of bedrooms in renter occupied houses
Median number of vehichles in owner occupied houses
Mean number of vehichles in owner occupied houses
Median number of vehichles in renter occupied houses
Mean number of vehichles in renter occupied houses
Mortgage status - with mortgage (%)
Mortgage status - with second mortgage (%)
Mortgage status - with home equity loan (%)
Mortgage status - with both second mortgage and home equity loan (%)
Mortgage status - without a mortgage (%)
Average family size
Average family size - White
Average family size - Black or African American
Average family size - Asian
Average family size - Hispanic or Latino
Average family size - American Indian and Alaska Native
Average family size - Multirace
Average family size - Other Race
Geographical mobility - Same house 1 year ago (%)
Geographical mobility - Moved within same county (%)
Geographical mobility - Moved from different county within same state (%)
Geographical mobility - Moved from different state (%)
Geographical mobility - Moved from abroad (%)
Place of birth - Born in state of residence (%)
Place of birth - Born in other state (%)
Place of birth - Native, outside of US (%)
Place of birth - Foreign born (%)
Housing units in structures - 1, detached (%)
Housing units in structures - 1, attached (%)
Housing units in structures - 2 (%)
Housing units in structures - 3 or 4 (%)
Housing units in structures - 5 to 9 (%)
Housing units in structures - 10 to 19 (%)
Housing units in structures - 20 to 49 (%)
Housing units in structures - 50 or more (%)
Housing units in structures - Mobile home (%)
Housing units in structures - Boat, RV, van, etc. (%)
House/condo owner moved in on average (years ago)
Renter moved in on average (years ago)
Year householder moved into unit - Moved in 1999 to March 2000 (%)
Year householder moved into unit - Moved in 1995 to 1998 (%)
Year householder moved into unit - Moved in 1990 to 1994 (%)
Year householder moved into unit - Moved in 1980 to 1989 (%)
Year householder moved into unit - Moved in 1970 to 1979 (%)
Year householder moved into unit - Moved in 1969 or earlier (%)
Means of transportation to work - Drove car alone (%)
Means of transportation to work - Carpooled (%)
Means of transportation to work - Public transportation (%)
Means of transportation to work - Bus or trolley bus (%)
Means of transportation to work - Streetcar or trolley car (%)
Means of transportation to work - Subway or elevated (%)
Means of transportation to work - Railroad (%)
Means of transportation to work - Ferryboat (%)
Means of transportation to work - Taxicab (%)
Means of transportation to work - Motorcycle (%)
Means of transportation to work - Bicycle (%)
Means of transportation to work - Walked (%)
Means of transportation to work - Other means (%)
Working at home (%)
Industry diversity
Most Common Industries - Agriculture, forestry, fishing and hunting, and mining (%)
Most Common Industries - Agriculture, forestry, fishing and hunting (%)
Most Common Industries - Mining, quarrying, and oil and gas extraction (%)
Most Common Industries - Construction (%)
Most Common Industries - Manufacturing (%)
Most Common Industries - Wholesale trade (%)
Most Common Industries - Retail trade (%)
Most Common Industries - Transportation and warehousing, and utilities (%)
Most Common Industries - Transportation and warehousing (%)
Most Common Industries - Utilities (%)
Most Common Industries - Information (%)
Most Common Industries - Finance and insurance, and real estate and rental and leasing (%)
Most Common Industries - Finance and insurance (%)
Most Common Industries - Real estate and rental and leasing (%)
Most Common Industries - Professional, scientific, and management, and administrative and waste management services (%)
Most Common Industries - Professional, scientific, and technical services (%)
Most Common Industries - Management of companies and enterprises (%)
Most Common Industries - Administrative and support and waste management services (%)
Most Common Industries - Educational services, and health care and social assistance (%)
Most Common Industries - Educational services (%)
Most Common Industries - Health care and social assistance (%)
Most Common Industries - Arts, entertainment, and recreation, and accommodation and food services (%)
Most Common Industries - Arts, entertainment, and recreation (%)
Most Common Industries - Accommodation and food services (%)
Most Common Industries - Other services, except public administration (%)
Most Common Industries - Public administration (%)
Occupation diversity
Most Common Occupations - Management, business, science, and arts occupations (%)
Most Common Occupations - Management, business, and financial occupations (%)
Most Common Occupations - Management occupations (%)
Most Common Occupations - Business and financial operations occupations (%)
Most Common Occupations - Computer, engineering, and science occupations (%)
Most Common Occupations - Computer and mathematical occupations (%)
Most Common Occupations - Architecture and engineering occupations (%)
Most Common Occupations - Life, physical, and social science occupations (%)
Most Common Occupations - Education, legal, community service, arts, and media occupations (%)
Most Common Occupations - Community and social service occupations (%)
Most Common Occupations - Legal occupations (%)
Most Common Occupations - Education, training, and library occupations (%)
Most Common Occupations - Arts, design, entertainment, sports, and media occupations (%)
Most Common Occupations - Healthcare practitioners and technical occupations (%)
Most Common Occupations - Health diagnosing and treating practitioners and other technical occupations (%)
Most Common Occupations - Health technologists and technicians (%)
Most Common Occupations - Service occupations (%)
Most Common Occupations - Healthcare support occupations (%)
Most Common Occupations - Protective service occupations (%)
Most Common Occupations - Fire fighting and prevention, and other protective service workers including supervisors (%)
Most Common Occupations - Law enforcement workers including supervisors (%)
Most Common Occupations - Food preparation and serving related occupations (%)
Most Common Occupations - Building and grounds cleaning and maintenance occupations (%)
Most Common Occupations - Personal care and service occupations (%)
Most Common Occupations - Sales and office occupations (%)
Most Common Occupations - Sales and related occupations (%)
Most Common Occupations - Office and administrative support occupations (%)
Most Common Occupations - Natural resources, construction, and maintenance occupations (%)
Most Common Occupations - Farming, fishing, and forestry occupations (%)
Most Common Occupations - Construction and extraction occupations (%)
Most Common Occupations - Installation, maintenance, and repair occupations (%)
Most Common Occupations - Production, transportation, and material moving occupations (%)
Most Common Occupations - Production occupations (%)
Most Common Occupations - Transportation occupations (%)
Most Common Occupations - Material moving occupations (%)
People in Group quarters - Institutionalized population (%)
People in Group quarters - Correctional institutions (%)
People in Group quarters - Federal prisons and detention centers (%)
People in Group quarters - Halfway houses (%)
People in Group quarters - Local jails and other confinement facilities (including police lockups) (%)
People in Group quarters - Military disciplinary barracks (%)
People in Group quarters - State prisons (%)
People in Group quarters - Other types of correctional institutions (%)
People in Group quarters - Nursing homes (%)
People in Group quarters - Hospitals/wards, hospices, and schools for the handicapped (%)
People in Group quarters - Hospitals/wards and hospices for chronically ill (%)
People in Group quarters - Hospices or homes for chronically ill (%)
People in Group quarters - Military hospitals or wards for chronically ill (%)
People in Group quarters - Other hospitals or wards for chronically ill (%)
People in Group quarters - Hospitals or wards for drug/alcohol abuse (%)
People in Group quarters - Mental (Psychiatric) hospitals or wards (%)
People in Group quarters - Schools, hospitals, or wards for the mentally retarded (%)
People in Group quarters - Schools, hospitals, or wards for the physically handicapped (%)
People in Group quarters - Institutions for the deaf (%)
People in Group quarters - Institutions for the blind (%)
People in Group quarters - Orthopedic wards and institutions for the physically handicapped (%)
People in Group quarters - Wards in general hospitals for patients who have no usual home elsewhere (%)
People in Group quarters - Wards in military hospitals for patients who have no usual home elsewhere (%)
People in Group quarters - Juvenile institutions (%)
People in Group quarters - Long-term care (%)
People in Group quarters - Homes for abused, dependent, and neglected children (%)
People in Group quarters - Residential treatment centers for emotionally disturbed children (%)
People in Group quarters - Training schools for juvenile delinquents (%)
People in Group quarters - Short-term care, detention or diagnostic centers for delinquent children (%)
People in Group quarters - Type of juvenile institution unknown (%)
People in Group quarters - Noninstitutionalized population (%)
People in Group quarters - College dormitories (includes college quarters off campus) (%)
People in Group quarters - Military quarters (%)
People in Group quarters - On base (%)
People in Group quarters - Barracks, unaccompanied personnel housing (UPH), (Enlisted/Officer), ;and similar group living quarters for military personnel (%)
People in Group quarters - Transient quarters for temporary residents (%)
People in Group quarters - Military ships (%)
People in Group quarters - Group homes (%)
People in Group quarters - Homes or halfway houses for drug/alcohol abuse (%)
People in Group quarters - Homes for the mentally ill (%)
People in Group quarters - Homes for the mentally retarded (%)
People in Group quarters - Homes for the physically handicapped (%)
People in Group quarters - Other group homes (%)
People in Group quarters - Religious group quarters (%)
People in Group quarters - Dormitories (%)
People in Group quarters - Agriculture workers' dormitories on farms (%)
People in Group quarters - Job Corps and vocational training facilities (%)
People in Group quarters - Other workers' dormitories (%)
People in Group quarters - Crews of maritime vessels (%)
People in Group quarters - Other nonhousehold living situations (%)
People in Group quarters - Other noninstitutional group quarters (%)
Residents speaking English at home (%)
Residents speaking English at home - Born in the United States (%)
Residents speaking English at home - Native, born elsewhere (%)
Residents speaking English at home - Foreign born (%)
Residents speaking Spanish at home (%)
Residents speaking Spanish at home - Born in the United States (%)
Residents speaking Spanish at home - Native, born elsewhere (%)
Residents speaking Spanish at home - Foreign born (%)
Residents speaking other language at home (%)
Residents speaking other language at home - Born in the United States (%)
Residents speaking other language at home - Native, born elsewhere (%)
Residents speaking other language at home - Foreign born (%)
Class of Workers - Employee of private company (%)
Class of Workers - Self-employed in own incorporated business (%)
Class of Workers - Private not-for-profit wage and salary workers (%)
Class of Workers - Local government workers (%)
Class of Workers - State government workers (%)
Class of Workers - Federal government workers (%)
Class of Workers - Self-employed workers in own not incorporated business and Unpaid family workers (%)
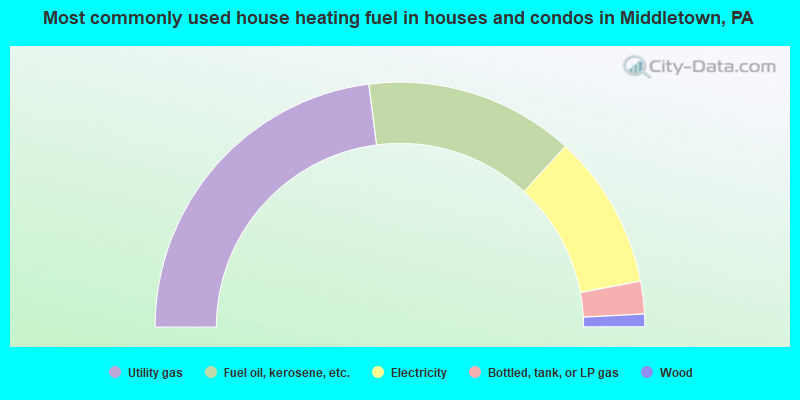
House heating fuel used in houses and condos - Utility gas (%)
House heating fuel used in houses and condos - Bottled, tank, or LP gas (%)
House heating fuel used in houses and condos - Electricity (%)
House heating fuel used in houses and condos - Fuel oil, kerosene, etc. (%)
House heating fuel used in houses and condos - Coal or coke (%)
House heating fuel used in houses and condos - Wood (%)
House heating fuel used in houses and condos - Solar energy (%)
House heating fuel used in houses and condos - Other fuel (%)
House heating fuel used in houses and condos - No fuel used (%)
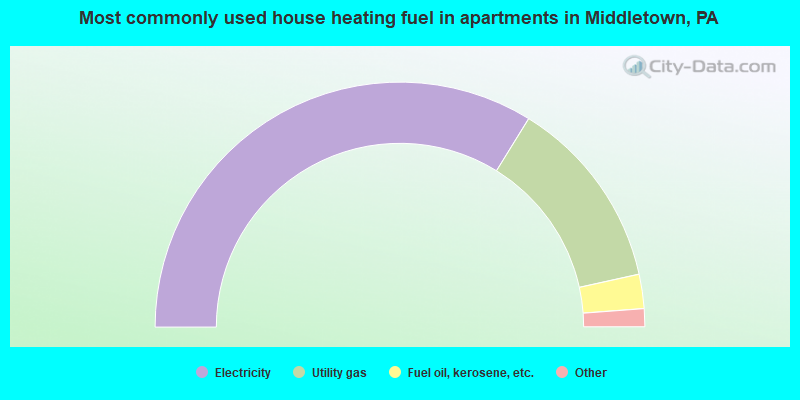
House heating fuel used in apartments - Utility gas (%)
House heating fuel used in apartments - Bottled, tank, or LP gas (%)
House heating fuel used in apartments - Electricity (%)
House heating fuel used in apartments - Fuel oil, kerosene, etc. (%)
House heating fuel used in apartments - Coal or coke (%)
House heating fuel used in apartments - Wood (%)
House heating fuel used in apartments - Solar energy (%)
House heating fuel used in apartments - Other fuel (%)
House heating fuel used in apartments - No fuel used (%)
Armed forces status - In Armed Forces (%)
Armed forces status - Civilian (%)
Armed forces status - Civilian - Veteran (%)
Armed forces status - Civilian - Nonveteran (%)
Fatal accidents locations in years 2005-2021
Fatal accidents locations in 2005
Fatal accidents locations in 2006
Fatal accidents locations in 2007
Fatal accidents locations in 2008
Fatal accidents locations in 2009
Fatal accidents locations in 2010
Fatal accidents locations in 2011
Fatal accidents locations in 2012
Fatal accidents locations in 2013
Fatal accidents locations in 2014
Fatal accidents locations in 2015
Fatal accidents locations in 2016
Fatal accidents locations in 2017
Fatal accidents locations in 2018
Fatal accidents locations in 2019
Fatal accidents locations in 2020
Fatal accidents locations in 2021
Alcohol use - People drinking some alcohol every month (%)
Alcohol use - People not drinking at all (%)
Alcohol use - Average days/month drinking alcohol
Alcohol use - Average drinks/week
Alcohol use - Average days/year people drink much
Audiometry - Average condition of hearing (%)
Audiometry - People that can hear a whisper from across a quiet room (%)
Audiometry - People that can hear normal voice from across a quiet room (%)
Audiometry - Ears ringing, roaring, buzzing (%)
Audiometry - Had a job exposure to loud noise (%)
Audiometry - Had off-work exposure to loud noise (%)
Blood Pressure & Cholesterol - Has high blood pressure (%)
Blood Pressure & Cholesterol - Checking blood pressure at home (%)
Blood Pressure & Cholesterol - Frequently checking blood cholesterol (%)
Blood Pressure & Cholesterol - Has high cholesterol level (%)
Consumer Behavior - Money monthly spent on food at supermarket/grocery store
Consumer Behavior - Money monthly spent on food at other stores
Consumer Behavior - Money monthly spent on eating out
Consumer Behavior - Money monthly spent on carryout/delivered foods
Consumer Behavior - Income spent on food at supermarket/grocery store (%)
Consumer Behavior - Income spent on food at other stores (%)
Consumer Behavior - Income spent on eating out (%)
Consumer Behavior - Income spent on carryout/delivered foods (%)
Current Health Status - General health condition (%)
Current Health Status - Blood donors (%)
Current Health Status - Has blood ever tested for HIV virus (%)
Current Health Status - Left-handed people (%)
Dermatology - People using sunscreen (%)
Diabetes - Diabetics (%)
Diabetes - Had a blood test for high blood sugar (%)
Diabetes - People taking insulin (%)
Diet Behavior & Nutrition - Diet health (%)
Diet Behavior & Nutrition - Milk product consumption (# of products/month)
Diet Behavior & Nutrition - Meals not home prepared (#/week)
Diet Behavior & Nutrition - Meals from fast food or pizza place (#/week)
Diet Behavior & Nutrition - Ready-to-eat foods (#/month)
Diet Behavior & Nutrition - Frozen meals/pizza (#/month)
Drug Use - People that ever used marijuana or hashish (%)
Drug Use - Ever used hard drugs (%)
Drug Use - Ever used any form of cocaine (%)
Drug Use - Ever used heroin (%)
Drug Use - Ever used methamphetamine (%)
Health Insurance - People covered by health insurance (%)
Kidney Conditions-Urology - Avg. # of times urinating at night
Medical Conditions - People with asthma (%)
Medical Conditions - People with anemia (%)
Medical Conditions - People with psoriasis (%)
Medical Conditions - People with overweight (%)
Medical Conditions - Elderly people having difficulties in thinking or remembering (%)
Medical Conditions - People who ever received blood transfusion (%)
Medical Conditions - People having trouble seeing even with glass/contacts (%)
Medical Conditions - People with arthritis (%)
Medical Conditions - People with gout (%)
Medical Conditions - People with congestive heart failure (%)
Medical Conditions - People with coronary heart disease (%)
Medical Conditions - People with angina pectoris (%)
Medical Conditions - People who ever had heart attack (%)
Medical Conditions - People who ever had stroke (%)
Medical Conditions - People with emphysema (%)
Medical Conditions - People with thyroid problem (%)
Medical Conditions - People with chronic bronchitis (%)
Medical Conditions - People with any liver condition (%)
Medical Conditions - People who ever had cancer or malignancy (%)
Mental Health - People who have little interest in doing things (%)
Mental Health - People feeling down, depressed, or hopeless (%)
Mental Health - People who have trouble sleeping or sleeping too much (%)
Mental Health - People feeling tired or having little energy (%)
Mental Health - People with poor appetite or overeating (%)
Mental Health - People feeling bad about themself (%)
Mental Health - People who have trouble concentrating on things (%)
Mental Health - People moving or speaking slowly or too fast (%)
Mental Health - People having thoughts they would be better off dead (%)
Oral Health - Average years since last visit a dentist
Oral Health - People embarrassed because of mouth (%)
Oral Health - People with gum disease (%)
Oral Health - General health of teeth and gums (%)
Oral Health - Average days a week using dental floss/device
Oral Health - Average days a week using mouthwash for dental problem
Oral Health - Average number of teeth
Pesticide Use - Households using pesticides to control insects (%)
Pesticide Use - Households using pesticides to kill weeds (%)
Physical Activity - People doing vigorous-intensity work activities (%)
Physical Activity - People doing moderate-intensity work activities (%)
Physical Activity - People walking or bicycling (%)
Physical Activity - People doing vigorous-intensity recreational activities (%)
Physical Activity - People doing moderate-intensity recreational activities (%)
Physical Activity - Average hours a day doing sedentary activities
Physical Activity - Average hours a day watching TV or videos
Physical Activity - Average hours a day using computer
Physical Functioning - People having limitations keeping them from working (%)
Physical Functioning - People limited in amount of work they can do (%)
Physical Functioning - People that need special equipment to walk (%)
Physical Functioning - People experiencing confusion/memory problems (%)
Physical Functioning - People requiring special healthcare equipment (%)
Prescription Medications - Average number of prescription medicines taking
Preventive Aspirin Use - Adults 40+ taking low-dose aspirin (%)
Reproductive Health - Vaginal deliveries (%)
Reproductive Health - Cesarean deliveries (%)
Reproductive Health - Deliveries resulted in a live birth (%)
Reproductive Health - Pregnancies resulted in a delivery (%)
Reproductive Health - Women breastfeeding newborns (%)
Reproductive Health - Women that had a hysterectomy (%)
Reproductive Health - Women that had both ovaries removed (%)
Reproductive Health - Women that have ever taken birth control pills (%)
Reproductive Health - Women taking birth control pills (%)
Reproductive Health - Women that have ever used Depo-Provera or injectables (%)
Reproductive Health - Women that have ever used female hormones (%)
Sexual Behavior - People 18+ that ever had sex (vaginal, anal, or oral) (%)
Sexual Behavior - Males 18+ that ever had vaginal sex with a woman (%)
Sexual Behavior - Males 18+ that ever performed oral sex on a woman (%)
Sexual Behavior - Males 18+ that ever had anal sex with a woman (%)
Sexual Behavior - Males 18+ that ever had any sex with a man (%)
Sexual Behavior - Females 18+ that ever had vaginal sex with a man (%)
Sexual Behavior - Females 18+ that ever performed oral sex on a man (%)
Sexual Behavior - Females 18+ that ever had anal sex with a man (%)
Sexual Behavior - Females 18+ that ever had any kind of sex with a woman (%)
Sexual Behavior - Average age people first had sex
Sexual Behavior - Average number of female sex partners in lifetime (males 18+)
Sexual Behavior - Average number of female vaginal sex partners in lifetime (males 18+)
Sexual Behavior - Average age people first performed oral sex on a woman (18+)
Sexual Behavior - Average number of woman performed oral sex on in lifetime (18+)
Sexual Behavior - Average number of male sex partners in lifetime (males 18+)
Sexual Behavior - Average number of male anal sex partners in lifetime (males 18+)
Sexual Behavior - Average age people first performed oral sex on a man (18+)
Sexual Behavior - Average number of male oral sex partners in lifetime (18+)
Sexual Behavior - People using protection when performing oral sex (%)
Sexual Behavior - Average number of times people have vaginal or anal sex a year
Sexual Behavior - People having sex without condom (%)
Sexual Behavior - Average number of male sex partners in lifetime (females 18+)
Sexual Behavior - Average number of male vaginal sex partners in lifetime (females 18+)
Sexual Behavior - Average number of female sex partners in lifetime (females 18+)
Sexual Behavior - Circumcised males 18+ (%)
Sleep Disorders - Average hours sleeping at night
Sleep Disorders - People that has trouble sleeping (%)
Smoking-Cigarette Use - People smoking cigarettes (%)
Taste & Smell - People 40+ having problems with smell (%)
Taste & Smell - People 40+ having problems with taste (%)
Taste & Smell - People 40+ that ever had wisdom teeth removed (%)
Taste & Smell - People 40+ that ever had tonsils teeth removed (%)
Taste & Smell - People 40+ that ever had a loss of consciousness because of a head injury (%)
Taste & Smell - People 40+ that ever had a broken nose or other serious injury to face or skull (%)
Taste & Smell - People 40+ that ever had two or more sinus infections (%)
Weight - Average height (inches)
Weight - Average weight (pounds)
Weight - Average BMI
Weight - People that are obese (%)
Weight - People that ever were obese (%)
Weight - People trying to lose weight (%)
Officers per 1,000 residents here:
1.13Pennsylvania average:
2.55
Latest news from Middletown, PA collected exclusively by city-data.com from local newspapers, TV, and radio stations
Ancestries: German (31.5%), American (8.7%), Irish (7.7%), Italian (5.8%), English (2.6%), Polish (2.1%).
Current Local Time:
Incorporated on 02/19/1828
Land area: 2.04 square miles.
Population density: 4,709 people per square mile (average).
714 residents are foreign born (5.2% Asia , 1.2% Europe ).
This borough:
7.4%Pennsylvania:
7.3%
Median real estate property taxes paid for housing units with mortgages in 2022: $2,762 (1.8%)Median real estate property taxes paid for housing units with no mortgage in 2022: $2,198 (1.5%)
Nearest city with pop. 50,000+: Lancaster, PA
Nearest city with pop. 200,000+: Baltimore, MD
Nearest city with pop. 1,000,000+: Philadelphia, PA
Nearest cities:
Latitude: 40.20 N, Longitude: 76.73 W
Daytime population change due to commuting: -2,473 (-25.7%)Workers who live and work in this borough: 863 (18.1%)
Area code commonly used in this area: 717
Unemployment in December 2023: Here:
2.7%Pennsylvania:
2.9%
Population change in the 1990s: +106 (+1.2%).
Most common occupations in Middletown, PA (%)
Both Males Females
Other office and administrative support workers, including supervisors (8.2%)
Secretaries and administrative assistants (5.8%)
Material recording, scheduling, dispatching, and distributing workers (4.5%)
Laborers and material movers, hand (3.9%)
Building and grounds cleaning and maintenance occupations (3.5%)
Driver/sales workers and truck drivers (3.0%)
Electrical equipment mechanics and other installation, maintenance, and repair workers, including supervisors (3.0%)
Laborers and material movers, hand (6.9%)
Driver/sales workers and truck drivers (5.9%)
Electrical equipment mechanics and other installation, maintenance, and repair workers, including supervisors (5.8%)
Material recording, scheduling, dispatching, and distributing workers (5.3%)
Building and grounds cleaning and maintenance occupations (4.9%)
Other office and administrative support workers, including supervisors (4.3%)
Computer specialists (4.0%)
Other office and administrative support workers, including supervisors (12.2%)
Secretaries and administrative assistants (11.5%)
Information and record clerks, except customer service representatives (4.2%)
Registered nurses (4.0%)
Customer service representatives (3.9%)
Material recording, scheduling, dispatching, and distributing workers (3.6%)
Nursing, psychiatric, and home health aides (3.1%)
Tornado activity:
Middletown-area historical tornado activity is slightly above Pennsylvania state average. It is 12% greater than the overall U.S. average.
On 7/14/2004, a category F3 (max. wind speeds 158-206 mph) tornado 9.7 miles away from the Middletown borough center caused $18 million in damages.
On 4/5/1952, a category F3 tornado 17.2 miles away from the borough center injured 4 people and caused between $500,000 and $5,000,000 in damages.
Earthquake activity:
Middletown-area historical earthquake activity is significantly above Pennsylvania state average. It is 63% smaller than the overall U.S. average. On 8/23/2011 at 17:51:04, a magnitude 5.8 (5.8 MW, Depth: 3.7 mi, Class: Moderate, Intensity: VI - VII) earthquake occurred 171.1 miles away from the city center On 1/16/1994 at 01:49:16, a magnitude 4.6 (4.6 MB, 4.6 LG, Depth: 3.1 mi, Class: Light, Intensity: IV - V) earthquake occurred 37.7 miles away from the city center On 9/25/1998 at 19:52:52, a magnitude 5.2 (4.8 MB, 4.3 MS, 5.2 LG, 4.5 MW, Depth: 3.1 mi) earthquake occurred 211.6 miles away from Middletown center On 1/16/1994 at 00:42:43, a magnitude 4.2 (4.2 MB, 4.0 LG, Depth: 3.1 mi) earthquake occurred 39.1 miles away from the city center On 10/7/1983 at 10:18:46, a magnitude 5.3 (5.1 MB, 5.3 LG, 5.1 ML) earthquake occurred 287.1 miles away from Middletown center On 1/31/1986 at 16:46:43, a magnitude 5.0 (5.0 MB) earthquake occurred 251.1 miles away from Middletown center Magnitude types: regional Lg-wave magnitude (LG), body-wave magnitude (MB), local magnitude (ML), surface-wave magnitude (MS), moment magnitude (MW) Natural disasters: The number of natural disasters in Dauphin County (19) is greater than the US average (15).Major Disasters (Presidential) Declared: 15Emergencies Declared: 4Floods: 4, Storms: 4, Winter Storms: 4, Hurricanes: 3, Snowstorms: 3, Tropical Storms: 3, Tropical Depressions: 2, Blizzard: 1, Flash Flood: 1, Heavy Rain: 1, Mudslide: 1, Snowfall: 1, Other: 1 (Note: some incidents may be assigned to more than one category). Hospitals and medical centers in Middletown: COMPASSIONATE CARE HOSPICE CEN (100 EAST BROWN STREET, SUITE 23) COURTYARD GARDENS NURSING AND REHAB CTR (999 WEST HARRISBURG PIKE)
FREY VILLAGE (1020 NORTH UNION STREET)
Amtrak stations near Middletown: 8 miles: ELIZABETHTOWN (WILSON AVE.) Services: public payphones, free short-term parking, free long-term parking, call for taxi service.
9 miles: HARRISBURG (4TH & CHESTNUT STS.) Services: ticket office, fully wheelchair accessible, enclosed waiting area, public restrooms, public payphones, snack bar, ATM, paid short-term parking, paid long-term parking, call for car rental service, taxi stand, intercity bus service, public transit connection.
14 miles: MOUNT JOY (DELTA & HENRY STS.) Services: public payphones, free short-term parking, call for taxi service, public transit connection.
College/University in Middletown: Pennsylvania State University-Penn State Harrisburg Full-time enrollment: 3,797; Location: 777 West Harrisburg Pike; Public; Website: hbg.psu.edu/; Offers Doctor's degree )
Other colleges/universities with over 2000 students near Middletown:
Harrisburg Area Community College-Harrisburg (about 11 miles; Harrisburg, PA ; Full-time enrollment: 13,276)
Messiah College (about 14 miles; Mechanicsburg, PA ; FT enrollment: 3,035)
YTI Career Institute-York (about 15 miles; York, PA ; FT enrollment: 2,212)
York College Pennsylvania (about 18 miles; York, PA ; FT enrollment: 5,140)
Franklin and Marshall College (about 25 miles; Lancaster, PA ; FT enrollment: 2,585)
Millersville University of Pennsylvania (about 25 miles; Millersville, PA ; FT enrollment: 7,743)
Dickinson College (about 25 miles; Carlisle, PA ; FT enrollment: 2,505)
Public high school in Middletown:
Public elementary/middle schools in Middletown:
Private elementary/middle school in Middletown: SEVEN SORROWS OF BVM SCHOOL Students: 231, Location: 360 E WATER ST, Grades: PK-8)
See full list of schools located in Middletown Library in Middletown: MIDDLETOWN PUBLIC LIBRARY Operating income: $403,519; Location: 20 NORTH CATHERINE ST; 21,411 books ; 973 audio materials ; 1,488 video materials ; 1 local licensed databases ; 41 state licensed databases ; 3 other licensed databases ; 69 print serial subscriptions )
Notable locations in Middletown: (A) , Borough of Middletown Mill Street Substation (B) , Borough of Middletown Water Treatment Plant (C) , Rescue Hose Company Number Three (D) , Middletown Public Library (E) , Middletown Volunteer Fire Department Station 88 (F) , Union Hose Company Number One (G) , Nancy Run Fire Company (H) , Bethlehem Township Volunteer Fire Company Station 17 (I) . Display/hide their locations on the map
Churches in Middletown include: (A) , Congregation Bnai Jacob (B) , Middletown Presbyterian Congregation (C) , Evangelical United Methodist Church (D) , Seven Sorrows of the Blessed Virgin Mary Catholic Church (E) , Calvary Orthodox Presbyterian Church (F) , Saint Michael and All Angels Church (G) , Ebenezer A. M. E. Church (H) , Wesley United Methodist Church (I) . Display/hide their locations on the map
Cemetery: (1) . Display/hide its location on the map
Park in Middletown: (1) . Display/hide its location on the map
Tourist attractions: (1) , Covenco Incorporated (Amusement & Theme Parks; 3201 Fulling Mill Road) (2) . Display/hide their approximate locations on the map
Hotels: (1) , Days Inn - Middletown/Hershey (800 S Eisenhower Blvd) (2) , Days Inn-Harrisburg East (800 South Eisenhower Boulevard) (3) , Best Western Inn & Suites (815 South Eisenhower Boulevard) (4) . Display/hide their approximate locations on the map
Birthplace of: Eleanor King - Dancer, Jonathan Kearsley - Politician, Jason Pelletier - Soccer player, Patricia Crawford - Politician.
Dauphin County has a predicted average indoor radon screening level greater than 4 pCi/L (pico curies per liter) - Highest Potential Drinking water stations with addresses in Middletown and their reported violations in the past:
MIDDLETOWN HUNTERS & ANGLERS (Population served: 400, Groundwater):
Past monitoring violations:
Monitoring, Repeat Major (TCR) - Between APR-2009 and JUN-2009, Contaminant: Coliform (TCR). Follow-up actions: St Compliance achieved (JAN-04-2010), St Violation/Reminder Notice (JAN-04-2010), St Public Notif received (APR-12-2010)
One routine major monitoring violation
5 minor monitoring violations
One regular monitoring violation
Population served: 200, Groundwater):
Past monitoring violations:
Monitoring, Repeat Major (TCR) - Between APR-2008 and JUN-2008, Contaminant: Coliform (TCR). Follow-up actions: St Public Notif requested (JUN-20-2008), St Public Notif received (JUN-20-2008), St Compliance achieved (JUN-20-2008), St Formal NOV issued (JUN-20-2008)
Population served: 200, Groundwater):
Past monitoring violations:
11 routine major monitoring violations
4 regular monitoring violations
Population served: 200, Groundwater):
Past monitoring violations:
One routine major monitoring violation
Population served: 100, Groundwater):
Past health violations:
MCL, Single Sample - Between JAN-2008 and DEC-2008, Contaminant: Nitrate. Follow-up actions: St Public Notif requested (MAY-07-2008), St Public Notif received (MAY-07-2008), St Compliance achieved (MAY-07-2008), St Formal NOV issued (MAY-07-2008)
Past monitoring violations:
Monitoring, Check/Repeat/Confirmation - Between JAN-2008 and MAR-2008, Contaminant: Nitrate. Follow-up actions: St Compliance achieved (MAY-07-2008), St Violation/Reminder Notice (MAY-07-2008)
4 regular monitoring violations
Population served: 60, Groundwater):
Past monitoring violations:
Monitoring, Source Water (GWR) - Between JUL-29-2014 and AUG-29-2014, Contaminant: E. COLI. Follow-up actions: St Violation/Reminder Notice (AUG-28-2014), St Compliance achieved (AUG-28-2014)
Monitoring, Source Water (GWR) - Between JUN-18-2014 and JUL-18-2014, Contaminant: E. COLI. Follow-up actions: St Violation/Reminder Notice (AUG-05-2014), St Public Notif requested (AUG-05-2014)
One minor monitoring violation
Population served: 50, Groundwater):
Past monitoring violations:
2 routine major monitoring violations
Average household size: This borough:
2.2 peoplePennsylvania:
2.5 people
Percentage of family households: This borough:
53.2%Whole state:
65.0%
Percentage of households with unmarried partners: This borough:
9.3%Whole state:
6.6%
Likely homosexual households (counted as self-reported same-sex unmarried-partner households)
Lesbian couples: 0.4% of all households Gay men: 0.2% of all households
131 people in nursing facilities/skilled-nursing facilities in 2010people in nursing homes in 2000people in religious group quarters in 2000
Banks with branches in Middletown (2011 data):
Wells Fargo Bank, National Association: West Middletown at 310 West Main Street, branch established on 1968/01/15. Info updated 2011/04/05: Bank assets: $1,161,490.0 mil, Deposits: $905,653.0 mil, headquarters in Sioux Falls, SD, positive income , 6395 total offices , Holding Company: Wells Fargo & Company
Mid Penn Bank: Middletown Branch at 1100 Spring Garden Drive, branch established on 1997/10/01. Info updated 2007/03/02: Bank assets: $715.4 mil, Deposits: $634.1 mil, headquarters in Millersburg, PA, positive income , Commercial Lending Specialization, 14 total offices , Holding Company: Mid Penn Bancorp, Inc.
Manufacturers and Traders Trust Company: South Union Street Branch at 120 South Union Street, branch established on 1991/08/30. Info updated 2011/08/08: Bank assets: $76,887.1 mil, Deposits: $60,064.2 mil, headquarters in Buffalo, NY, positive income , Commercial Lending Specialization, 808 total offices , Holding Company: M&T Bank Corporation
Citizens Bank of Pennsylvania: Middletown Pa Branch at 100 South Union Street, branch established on 1961/03/21. Info updated 2010/09/24: Bank assets: $32,316.9 mil, Deposits: $25,297.1 mil, headquarters in Philadelphia, PA, positive income , 396 total offices , Holding Company: Uk Financial Investments Limited
For population 15 years and over in Middletown:
Never married: 39.9%Now married: 35.4%Separated: 3.6%Widowed: 6.9%Divorced: 14.2% For population 25 years and over in Middletown:
High school or higher: 92.1%Bachelor's degree or higher: 22.6%Graduate or professional degree: 9.0%Unemployed: 5.2%Mean travel time to work (commute): 20.1 minutes
Education Gini index (Inequality in education) Here:
9.7Pennsylvania average:
11.4
Religion statistics for Middletown, PA (based on Dauphin County data)
Religion Adherents Congregations Mainline Protestant 43,691 122 Catholic 39,739 16 Evangelical Protestant 27,374 164 Other 10,390 26 Black Protestant 6,464 31 Orthodox 689 5 None 139,753 -
Source: Clifford Grammich, Kirk Hadaway, Richard Houseal, Dale E.Jones, Alexei Krindatch, Richie Stanley and Richard H.Taylor. 2012. 2010 U.S.Religion Census: Religious Congregations & Membership Study. Association of Statisticians of American Religious Bodies. Jones, Dale E., et al. 2002. Congregations and Membership in the United States 2000. Nashville, TN: Glenmary Research Center. Graphs represent county-level data
Food Environment Statistics: Number of grocery stores : 51Here :
2.00 / 10,000 pop.Pennsylvania :
2.04 / 10,000 pop.
Number of supercenters and club stores : 3This county :
0.12 / 10,000 pop.Pennsylvania :
0.09 / 10,000 pop.
Number of convenience stores (no gas) : 20Dauphin County :
0.78 / 10,000 pop.Pennsylvania :
0.88 / 10,000 pop.
Number of convenience stores (with gas) : 90This county :
3.52 / 10,000 pop.Pennsylvania :
2.52 / 10,000 pop.
Number of full-service restaurants : 224Dauphin County :
8.76 / 10,000 pop.Pennsylvania :
7.12 / 10,000 pop.
Adult diabetes rate : Here :
9.4%Pennsylvania :
9.1%
Adult obesity rate : Dauphin County :
30.9%Pennsylvania :
27.2%
Low-income preschool obesity rate : Dauphin County :
12.6%Pennsylvania :
11.5%
Health and Nutrition: Healthy diet rate : This city:
52.8%Pennsylvania:
50.2%
Average overall health of teeth and gums : This city:
51.8%State:
47.1%
Average BMI : This city:
28.6Pennsylvania:
28.7
People feeling badly about themselves : This city:
19.4%Pennsylvania:
20.8%
People not drinking alcohol at all : Here:
9.9%Pennsylvania:
10.9%
Average hours sleeping at night : This city:
6.9Pennsylvania:
6.8
Overweight people : Middletown:
34.8%State:
34.3%
General health condition : Middletown:
59.5%State:
56.2%
Average condition of hearing : Middletown:
79.8%Pennsylvania:
78.3%
More about Health and Nutrition of Middletown, PA Residents
Local government employment and payroll (March 2022)
Function
Full-time employees
Monthly full-time payroll
Average yearly full-time wage
Part-time employees
Monthly part-time payroll
Police Protection - Officers
11 $93,301 $101,783 3 $5,883 Streets and Highways
7 $38,409 $65,844 0 $0 Electric Power
4 $34,946 $104,838 1 $698 Other Government Administration
4 $22,564 $67,692 9 $2,079 Financial Administration
3 $16,401 $65,604 1 $1,083 Other and Unallocable
1 $5,863 $70,356 0 $0 Police - Other
0 $0 1 $1,508
Totals for Government
30 $211,484 $84,594 15 $11,250
Middletown government finances - Expenditure in 2018 (per resident):
Construction - Regular Highways: $270,000 ($28.15)
General Public Buildings: $39,000 ($4.07)Current Operations - Electric Utilities: $5,237,000 ($545.92)
Police Protection: $2,642,000 ($275.41)Sewerage: $1,317,000 ($137.29)Regular Highways: $1,019,000 ($106.22)Solid Waste Management: $720,000 ($75.05)Central Staff Services: $551,000 ($57.44)Financial Administration: $176,000 ($18.35)Protective Inspection and Regulation - Other: $137,000 ($14.28)Parks and Recreation: $126,000 ($13.13)Housing and Community Development: $106,000 ($11.05)Local Fire Protection: $86,000 ($8.96)General Public Buildings: $78,000 ($8.13)Libraries: $64,000 ($6.67)Transit Utilities: $63,000 ($6.57)Health - Other: $57,000 ($5.94)General - Other: $9,000 ($0.94)General - Interest on Debt: $86,000 ($8.96)
Other Capital Outlay - Regular Highways: $113,000 ($11.78)
Libraries: $10,000 ($1.04)Total Salaries and Wages: $2,484,000 ($258.94)
Middletown government finances - Revenue in 2018 (per resident):
Charges - Other: $1,546,000 ($161.16)
Solid Waste Management: $883,000 ($92.05)Regular Highways: $9,000 ($0.94)Local Intergovernmental - Other: $82,000 ($8.55)
Miscellaneous - Interest Earnings: $314,000 ($32.73)
Donations From Private Sources: $84,000 ($8.76)Fines and Forfeits: $60,000 ($6.25)Rents: $32,000 ($3.34)General Revenue - Other: $29,000 ($3.02)Sale of Property: $14,000 ($1.46)Revenue - Electric Utilities: $8,427,000 ($878.45)
State Intergovernmental - Highways: $234,000 ($24.39)
Other: $225,000 ($23.45)General Local Government Support: $5,000 ($0.52)Tax - Property: $1,592,000 ($165.95)
Individual Income: $818,000 ($85.27)Public Utility License: $159,000 ($16.57)Occupation and Business License - Other: $139,000 ($14.49)Documentary and Stock Transfer: $71,000 ($7.40)
Middletown government finances - Debt in 2018 (per resident):
Long Term Debt - Beginning Outstanding - Unspecified Public Purpose: $2,152,000 ($224.33)
Outstanding Unspecified Public Purpose: $2,004,000 ($208.90)Retired Unspecified Public Purpose: $535,000 ($55.77)Issue, Unspecified Public Purpose: $387,000 ($40.34)
Middletown government finances - Cash and Securities in 2018 (per resident):
Bond Funds - Cash and Securities: $261,000 ($27.21)
Other Funds - Cash and Securities: $25,469,000 ($2654.96)
Sinking Funds - Cash and Securities: $341,000 ($35.55)
6.58% of this county's 2021 resident taxpayers lived in other counties in 2020 ($50,717 average adjusted gross income )
Here:
6.58%Pennsylvania average:
5.27%
0.02% of residents moved from foreign countries ($63 average AGI )Dauphin County:
0.02%Pennsylvania average:
0.01%
Top counties from which taxpayers relocated into this county between 2020 and 2021:
6.69% of this county's 2020 resident taxpayers moved to other counties in 2021 ($57,278 average adjusted gross income )
Here:
6.69%Pennsylvania average:
5.44%
0.04% of residents moved to foreign countries ($249 average AGI )Dauphin County:
0.04%Pennsylvania average:
0.01%
Top counties to which taxpayers relocated from this county between 2020 and 2021:
Businesses in Middletown, PA
Name Count Name Count
7-Eleven 1 MasterBrand Cabinets 2 Best Western 1 McDonald's 2 Budget Car Rental 2 New Balance 1 CVS 1 Penske 1 Dairy Queen 1 Pizza Hut 1 FedEx 3 Rite Aid 1 GNC 1 Starbucks 1 Giant 1 Taco Bell 1 H&R Block 1 U-Haul 1 Hardee's 1 UPS 3 Kroger 1 Wendy's 1
Strongest AM radio stations in Middletown:
WHP (580 AM; 5 kW; HARRISBURG, PA; Owner: CLEAR CHANNEL BROADCASTING LICENSES, INC.)
WTKT (1460 AM; 5 kW; HARRISBURG, PA; Owner: CLEAR CHANNEL BROADCASTING LICENSES, INC.)
WSBA (910 AM; 5 kW; YORK, PA; Owner: WSBA LICO, INC.)
WCBM (680 AM; 50 kW; BALTIMORE, MD; Owner: WCBM MARYLAND, INC.)
WWII (720 AM; daytime; 2 kW; SHIREMANSTOWN, PA; Owner: HENSLEY BROADCASTING)
WBAL (1090 AM; 50 kW; BALTIMORE, MD; Owner: HEARST RADIO, INC.)
WEEU (830 AM; 20 kW; READING, PA; Owner: WEEU BROADCASTING COMPANY)
WWSM (1510 AM; daytime; 5 kW; ANNVILLE-CLEONA, PA; Owner: PATRICK H. SICKAFUS)
WLBR (1270 AM; 5 kW; LEBANON, PA; Owner: LEBANON BROADCASTING COMPANY)
WVCH (740 AM; 50 kW; CHESTER, PA; Owner: WVCH COMMUNICATIONS, INC.)
WWJZ (640 AM; 50 kW; MOUNT HOLLY, NJ; Owner: ABC, INC.)
WTCY (1400 AM; 1 kW; HARRISBURG, PA; Owner: CUMULUS LICENSING CORP.)
WOYK (1350 AM; 5 kW; YORK, PA; Owner: WOYK, INC.)
Strongest FM radio stations in Middletown:
WMSS (91.1 FM; MIDDLETOWN, PA; Owner: MIDDLETOWN AREA SCHOOL DISTRICT)
WCAT-FM (106.7 FM; HERSHEY, PA; Owner: CITADEL BROADCASTING COMPANY)
WHBO (92.7 FM; STARVIEW, PA; Owner: HALL COMMUNICATIONS, INC.)
WITF-FM (89.5 FM; HARRISBURG, PA; Owner: WITF, INC.)
WTPA (93.5 FM; MECHANICSBURG, PA; Owner: CUMULUS LICENSING CORP.)
WROZ (101.3 FM; LANCASTER, PA; Owner: HALL COMMUNICATIONS, INC.)
WARM-FM (103.3 FM; YORK, PA; Owner: WSBA LICO, INC.)
WHKF (99.3 FM; HARRISBURG, PA; Owner: CLEAR CHANNEL BROADCASTING LICENSES, INC.)
WRVV (97.3 FM; HARRISBURG, PA; Owner: CLEAR CHANNEL BROADCASTING LICENSES, INC.)
WQXA-FM (105.7 FM; YORK, PA; Owner: CITADEL BROADCASTING COMPANY)
WNNK-FM (104.1 FM; HARRISBURG, PA; Owner: CUMULUS LICENSING CORP.)
WRBT (94.9 FM; HARRISBURG, PA; Owner: CLEAR CHANNEL BROADCASTING LICENSES, INC.)
W220BX (91.9 FM; MARIETTA, PA; Owner: CALVARY CHAPEL OF TWIN FALLS, INC.)
WJAZ (91.7 FM; SUMMERDALE, PA; Owner: TEMPLE UNIV. COMMWEALTH SYS. HGHR ED)
WSOX (96.1 FM; RED LION, PA; Owner: LANCASTER-YORK BROADCASTING, LLC)
WWKL (92.1 FM; PALMYRA, PA; Owner: CUMULUS LICENSING CORP.)
WYCR (98.5 FM; YORK-HANOVER, PA; Owner: RADIO HANOVER, INC.)
WXPH (88.1 FM; HARRISBURG, PA; Owner: THE TRUSTEES OF THE UNIV. OF PA.)
WGTY (107.7 FM; GETTYSBURG, PA; Owner: TIMES AND NEWS PUBLISHING COMPANY)
WIOV-FM (105.1 FM; EPHRATA, PA; Owner: REGENT BROADCASTING OF LANCASTER, INC.)
TV broadcast stations around Middletown:
WLYH-TV (Channel 15; LANCASTER, PA; Owner: TELEVISION STATION GROUP LICENSE SUBSIDIARY, LLC)
WPMT (Channel 43; YORK, PA; Owner: TRIBUNE TELEVISION COMPANY)
WGAL (Channel 8; LANCASTER, PA; Owner: WGAL HEARST-ARGYLE TELEVISION, INC.)
WITF-TV (Channel 33; HARRISBURG, PA; Owner: WITF, INC.)
WHP-TV (Channel 21; HARRISBURG, PA; Owner: CLEAR CHANNEL BROADCASTING LICENSES, INC.)
WHTM-TV (Channel 27; HARRISBURG, PA; Owner: HARRISBURG TELEVISION, INC.)
WGCB-TV (Channel 49; RED LION, PA; Owner: RED LION BROADCASTING CO., INC.)
W23AY (Channel 23; YORK, PA; Owner: WIRELESS CABLE TV OF PA, INC.)
W40AF (Channel 40; DILLSBURG, PA; Owner: PENNSYLVANIA SPORTS ENTERTAINMENT NETWORK, LLC)
National Bridge Inventory (NBI) Statistics 59 Number of bridges597ft / 182m Total length $7,196,000 Total costs705,289 Total average daily traffic99,994 Total average daily truck traffic
New bridges - historical statistics
1 1910-1919 4 1930-1939 4 1940-1949 5 1950-1959 16 1960-1969 20 1970-1979 2 1980-1989 2 1990-1999 1 2000-2009 4 2010-2019
See full National Bridge Inventory statistics for Middletown, PA
Home Mortgage Disclosure Act Aggregated Statistics For Year 2009(Based on 3 full tracts) A) FHA, FSA/RHS & VA B) Conventional C) Refinancings D) Home Improvement Loans E) Loans on Dwellings For 5+ Families F) Non-occupant Loans on G) Loans On Manufactured Number Average Value Number Average Value Number Average Value Number Average Value Number Average Value Number Average Value Number Average Value
LOANS ORIGINATED 48 $114,521 27 $91,481 94 $106,596 25 $32,840 3 $716,667 12 $73,417 5 $23,000 APPLICATIONS APPROVED, NOT ACCEPTED 1 $99,000 2 $43,500 10 $91,500 2 $85,500 0 $0 0 $0 1 $50,000 APPLICATIONS DENIED 11 $111,364 5 $87,600 62 $118,242 20 $22,350 2 $392,500 5 $67,000 4 $12,000 APPLICATIONS WITHDRAWN 2 $144,000 5 $56,800 29 $119,483 0 $0 0 $0 1 $113,000 1 $10,000 FILES CLOSED FOR INCOMPLETENESS 2 $120,500 1 $114,000 9 $130,778 1 $145,000 0 $0 1 $114,000 0 $0
Aggregated Statistics For Year 2008(Based on 3 full tracts) A) FHA, FSA/RHS & VA B) Conventional C) Refinancings D) Home Improvement Loans E) Loans on Dwellings For 5+ Families F) Non-occupant Loans on G) Loans On Manufactured Number Average Value Number Average Value Number Average Value Number Average Value Number Average Value Number Average Value Number Average Value
LOANS ORIGINATED 38 $129,789 46 $107,000 108 $104,917 26 $33,538 5 $305,200 27 $79,481 2 $14,500 APPLICATIONS APPROVED, NOT ACCEPTED 1 $126,000 8 $82,500 18 $84,222 5 $47,600 0 $0 2 $50,500 4 $42,250 APPLICATIONS DENIED 3 $98,000 21 $57,286 108 $121,287 29 $62,655 0 $0 7 $106,143 16 $34,562 APPLICATIONS WITHDRAWN 2 $105,000 4 $42,750 32 $119,969 2 $12,000 0 $0 2 $102,000 1 $17,000 FILES CLOSED FOR INCOMPLETENESS 1 $127,000 3 $70,333 4 $133,750 1 $12,000 0 $0 0 $0 1 $12,000
Aggregated Statistics For Year 2007(Based on 3 full tracts) A) FHA, FSA/RHS & VA B) Conventional C) Refinancings D) Home Improvement Loans E) Loans on Dwellings For 5+ Families F) Non-occupant Loans on G) Loans On Manufactured Number Average Value Number Average Value Number Average Value Number Average Value Number Average Value Number Average Value Number Average Value
LOANS ORIGINATED 11 $124,273 118 $94,839 126 $91,929 49 $45,204 2 $185,500 28 $78,571 2 $27,500 APPLICATIONS APPROVED, NOT ACCEPTED 0 $0 16 $99,812 26 $82,231 3 $99,333 0 $0 9 $69,444 4 $58,000 APPLICATIONS DENIED 1 $69,000 27 $92,296 154 $109,760 65 $56,062 2 $62,000 17 $133,824 8 $20,875 APPLICATIONS WITHDRAWN 1 $169,000 11 $112,818 54 $125,241 6 $72,167 0 $0 3 $79,667 0 $0 FILES CLOSED FOR INCOMPLETENESS 0 $0 6 $113,333 12 $101,583 1 $15,000 0 $0 0 $0 1 $32,000
Aggregated Statistics For Year 2006(Based on 3 full tracts) A) FHA, FSA/RHS & VA B) Conventional C) Refinancings D) Home Improvement Loans E) Loans on Dwellings For 5+ Families F) Non-occupant Loans on G) Loans On Manufactured Number Average Value Number Average Value Number Average Value Number Average Value Number Average Value Number Average Value Number Average Value
LOANS ORIGINATED 13 $122,769 152 $89,763 159 $79,686 36 $29,500 3 $193,667 42 $89,167 11 $20,182 APPLICATIONS APPROVED, NOT ACCEPTED 0 $0 18 $79,667 24 $82,000 6 $24,667 0 $0 4 $106,500 4 $52,000 APPLICATIONS DENIED 0 $0 49 $77,531 163 $100,166 57 $42,596 0 $0 22 $114,455 13 $25,077 APPLICATIONS WITHDRAWN 2 $123,500 12 $64,500 76 $97,474 5 $53,800 1 $63,000 4 $193,250 1 $33,000 FILES CLOSED FOR INCOMPLETENESS 0 $0 2 $85,500 16 $117,750 0 $0 2 $85,000 4 $119,750 0 $0
Aggregated Statistics For Year 2005(Based on 3 full tracts) A) FHA, FSA/RHS & VA B) Conventional C) Refinancings D) Home Improvement Loans E) Loans on Dwellings For 5+ Families F) Non-occupant Loans on G) Loans On Manufactured Number Average Value Number Average Value Number Average Value Number Average Value Number Average Value Number Average Value Number Average Value
LOANS ORIGINATED 12 $99,500 134 $80,896 176 $75,028 43 $39,512 2 $106,500 48 $78,792 9 $28,889 APPLICATIONS APPROVED, NOT ACCEPTED 0 $0 3 $67,667 45 $80,089 8 $56,625 0 $0 5 $77,600 2 $65,000 APPLICATIONS DENIED 1 $114,000 50 $63,640 214 $87,192 64 $34,688 0 $0 33 $60,788 22 $49,227 APPLICATIONS WITHDRAWN 0 $0 21 $80,333 93 $92,516 15 $129,800 1 $30,000 8 $91,750 5 $42,600 FILES CLOSED FOR INCOMPLETENESS 0 $0 8 $61,500 24 $98,542 3 $34,333 0 $0 1 $18,000 0 $0
Aggregated Statistics For Year 2004(Based on 3 full tracts) A) FHA, FSA/RHS & VA B) Conventional C) Refinancings D) Home Improvement Loans E) Loans on Dwellings For 5+ Families F) Non-occupant Loans on G) Loans On Manufactured Number Average Value Number Average Value Number Average Value Number Average Value Number Average Value Number Average Value Number Average Value
LOANS ORIGINATED 10 $93,800 111 $81,180 190 $73,884 46 $32,674 5 $191,400 49 $74,224 4 $19,750 APPLICATIONS APPROVED, NOT ACCEPTED 1 $83,000 7 $100,429 43 $72,256 13 $28,615 0 $0 2 $105,000 1 $31,000 APPLICATIONS DENIED 2 $75,000 30 $61,533 171 $84,339 42 $25,524 0 $0 16 $41,938 12 $32,417 APPLICATIONS WITHDRAWN 2 $93,500 15 $68,933 94 $84,872 1 $50,000 0 $0 3 $119,667 1 $22,000 FILES CLOSED FOR INCOMPLETENESS 1 $84,000 3 $72,667 38 $90,316 3 $45,333 0 $0 1 $108,000 0 $0
Aggregated Statistics For Year 2003(Based on 3 full tracts) A) FHA, FSA/RHS & VA B) Conventional C) Refinancings D) Home Improvement Loans E) Loans on Dwellings For 5+ Families F) Non-occupant Loans on Number Average Value Number Average Value Number Average Value Number Average Value Number Average Value Number Average Value
LOANS ORIGINATED 28 $94,357 90 $77,900 299 $77,104 37 $23,892 1 $95,000 45 $74,378 APPLICATIONS APPROVED, NOT ACCEPTED 1 $84,000 10 $49,700 57 $73,684 7 $32,571 0 $0 9 $66,444 APPLICATIONS DENIED 2 $93,000 21 $59,810 157 $89,701 21 $20,476 0 $0 12 $32,000 APPLICATIONS WITHDRAWN 3 $103,000 8 $126,000 80 $92,100 7 $12,286 0 $0 2 $79,000 FILES CLOSED FOR INCOMPLETENESS 2 $83,000 5 $57,600 10 $90,500 0 $0 0 $0 0 $0
Aggregated Statistics For Year 2002(Based on 3 full tracts) A) FHA, FSA/RHS & VA B) Conventional C) Refinancings D) Home Improvement Loans F) Non-occupant Loans on Number Average Value Number Average Value Number Average Value Number Average Value Number Average Value
LOANS ORIGINATED 28 $84,821 59 $74,322 185 $73,459 24 $21,375 18 $69,667 APPLICATIONS APPROVED, NOT ACCEPTED 1 $65,000 6 $45,333 42 $68,810 6 $12,833 5 $58,800 APPLICATIONS DENIED 3 $105,333 15 $73,000 122 $75,877 23 $24,391 7 $42,000 APPLICATIONS WITHDRAWN 4 $97,500 6 $75,333 70 $87,086 2 $20,000 2 $76,500 FILES CLOSED FOR INCOMPLETENESS 0 $0 1 $88,000 18 $79,167 0 $0 1 $90,000
Aggregated Statistics For Year 2001(Based on 3 full tracts) A) FHA, FSA/RHS & VA B) Conventional C) Refinancings D) Home Improvement Loans E) Loans on Dwellings For 5+ Families F) Non-occupant Loans on Number Average Value Number Average Value Number Average Value Number Average Value Number Average Value Number Average Value
LOANS ORIGINATED 42 $86,143 63 $56,619 167 $70,365 36 $18,972 2 $319,000 17 $49,647 APPLICATIONS APPROVED, NOT ACCEPTED 2 $98,500 18 $33,278 45 $67,378 8 $10,750 0 $0 3 $42,333 APPLICATIONS DENIED 2 $53,000 44 $37,795 140 $72,843 22 $16,000 1 $350,000 5 $60,800 APPLICATIONS WITHDRAWN 2 $96,000 5 $59,400 51 $70,412 9 $24,111 2 $94,500 0 $0 FILES CLOSED FOR INCOMPLETENESS 1 $122,000 0 $0 18 $72,167 0 $0 0 $0 0 $0
Aggregated Statistics For Year 2000(Based on 3 full tracts) A) FHA, FSA/RHS & VA B) Conventional C) Refinancings D) Home Improvement Loans E) Loans on Dwellings For 5+ Families F) Non-occupant Loans on Number Average Value Number Average Value Number Average Value Number Average Value Number Average Value Number Average Value
LOANS ORIGINATED 28 $81,964 61 $56,508 103 $57,320 63 $22,063 2 $255,000 18 $57,889 APPLICATIONS APPROVED, NOT ACCEPTED 4 $82,500 20 $44,150 32 $76,312 7 $23,143 0 $0 4 $58,750 APPLICATIONS DENIED 1 $63,000 42 $32,429 75 $62,133 19 $14,684 0 $0 3 $63,333 APPLICATIONS WITHDRAWN 3 $61,667 8 $68,250 28 $69,964 5 $14,400 0 $0 0 $0 FILES CLOSED FOR INCOMPLETENESS 1 $149,000 0 $0 15 $72,800 0 $0 0 $0 0 $0
Aggregated Statistics For Year 1999(Based on 3 full tracts) A) FHA, FSA/RHS & VA B) Conventional C) Refinancings D) Home Improvement Loans E) Loans on Dwellings For 5+ Families F) Non-occupant Loans on Number Average Value Number Average Value Number Average Value Number Average Value Number Average Value Number Average Value
LOANS ORIGINATED 34 $80,469 59 $71,316 142 $59,751 53 $19,062 1 $143,890 15 $52,881 APPLICATIONS APPROVED, NOT ACCEPTED 3 $69,793 19 $60,690 52 $61,624 10 $17,884 0 $0 4 $50,410 APPLICATIONS DENIED 4 $80,495 38 $43,263 80 $58,119 36 $18,978 0 $0 5 $45,112 APPLICATIONS WITHDRAWN 3 $74,060 13 $65,347 47 $60,176 8 $33,191 0 $0 4 $51,168 FILES CLOSED FOR INCOMPLETENESS 0 $0 1 $54,670 22 $61,313 2 $12,555 0 $0 1 $54,670
Detailed HMDA statistics for the following Tracts:
0237.00
, 0238.00 , 0239.00
Private Mortgage Insurance Companies Aggregated Statistics For Year 2009(Based on 3 full tracts) A) Conventional B) Refinancings Number Average Value Number Average Value
LOANS ORIGINATED 7 $126,000 3 $130,667 APPLICATIONS APPROVED, NOT ACCEPTED 2 $110,500 1 $135,000 APPLICATIONS DENIED 2 $96,000 1 $150,000 APPLICATIONS WITHDRAWN 0 $0 0 $0 FILES CLOSED FOR INCOMPLETENESS 1 $152,000 0 $0
Aggregated Statistics For Year 2008(Based on 3 full tracts) A) Conventional B) Refinancings C) Non-occupant Loans on Number Average Value Number Average Value Number Average Value
LOANS ORIGINATED 13 $124,385 7 $114,857 2 $72,500 APPLICATIONS APPROVED, NOT ACCEPTED 7 $163,000 3 $146,000 0 $0 APPLICATIONS DENIED 1 $257,000 0 $0 0 $0 APPLICATIONS WITHDRAWN 2 $257,000 0 $0 0 $0 FILES CLOSED FOR INCOMPLETENESS 2 $110,500 0 $0 1 $129,000
Aggregated Statistics For Year 2007(Based on 3 full tracts) A) Conventional B) Refinancings C) Non-occupant Loans on Number Average Value Number Average Value Number Average Value
LOANS ORIGINATED 47 $121,979 12 $127,333 2 $72,500 APPLICATIONS APPROVED, NOT ACCEPTED 6 $114,167 2 $83,500 0 $0 APPLICATIONS DENIED 3 $80,333 0 $0 0 $0 APPLICATIONS WITHDRAWN 6 $120,000 0 $0 0 $0 FILES CLOSED FOR INCOMPLETENESS 0 $0 0 $0 0 $0
Aggregated Statistics For Year 2006(Based on 3 full tracts) A) Conventional B) Refinancings C) Non-occupant Loans on Number Average Value Number Average Value Number Average Value
LOANS ORIGINATED 34 $119,853 10 $120,500 3 $92,333 APPLICATIONS APPROVED, NOT ACCEPTED 2 $73,500 2 $238,500 2 $73,500 APPLICATIONS DENIED 0 $0 0 $0 0 $0 APPLICATIONS WITHDRAWN 0 $0 1 $59,000 0 $0 FILES CLOSED FOR INCOMPLETENESS 0 $0 0 $0 0 $0
Aggregated Statistics For Year 2005(Based on 3 full tracts) A) Conventional B) Refinancings C) Non-occupant Loans on Number Average Value Number Average Value Number Average Value
LOANS ORIGINATED 27 $92,519 5 $96,400 7 $87,857 APPLICATIONS APPROVED, NOT ACCEPTED 3 $109,000 5 $88,800 0 $0 APPLICATIONS DENIED 0 $0 0 $0 0 $0 APPLICATIONS WITHDRAWN 0 $0 0 $0 0 $0 FILES CLOSED FOR INCOMPLETENESS 0 $0 0 $0 0 $0
Aggregated Statistics For Year 2004(Based on 3 full tracts) A) Conventional B) Refinancings C) Non-occupant Loans on Number Average Value Number Average Value Number Average Value
LOANS ORIGINATED 22 $87,409 4 $81,250 2 $86,500 APPLICATIONS APPROVED, NOT ACCEPTED 3 $82,333 2 $91,000 0 $0 APPLICATIONS DENIED 0 $0 0 $0 0 $0 APPLICATIONS WITHDRAWN 1 $84,000 2 $107,000 0 $0 FILES CLOSED FOR INCOMPLETENESS 0 $0 0 $0 0 $0
Aggregated Statistics For Year 2003(Based on 3 full tracts) A) Conventional B) Refinancings C) Non-occupant Loans on Number Average Value Number Average Value Number Average Value
LOANS ORIGINATED 24 $83,708 25 $93,160 2 $66,000 APPLICATIONS APPROVED, NOT ACCEPTED 3 $104,333 6 $105,833 0 $0 APPLICATIONS DENIED 1 $61,000 0 $0 0 $0 APPLICATIONS WITHDRAWN 2 $92,500 1 $106,000 0 $0 FILES CLOSED FOR INCOMPLETENESS 0 $0 0 $0 0 $0
Aggregated Statistics For Year 2002(Based on 3 full tracts) A) Conventional B) Refinancings C) Non-occupant Loans on Number Average Value Number Average Value Number Average Value
LOANS ORIGINATED 18 $83,444 27 $98,000 2 $72,500 APPLICATIONS APPROVED, NOT ACCEPTED 2 $74,000 5 $71,200 0 $0 APPLICATIONS DENIED 2 $85,000 0 $0 0 $0 APPLICATIONS WITHDRAWN 1 $125,000 2 $84,000 0 $0 FILES CLOSED FOR INCOMPLETENESS 0 $0 0 $0 0 $0
Aggregated Statistics For Year 2001(Based on 3 full tracts) A) Conventional B) Refinancings C) Non-occupant Loans on Number Average Value Number Average Value Number Average Value
LOANS ORIGINATED 21 $71,143 17 $100,471 3 $52,333 APPLICATIONS APPROVED, NOT ACCEPTED 0 $0 2 $86,000 0 $0 APPLICATIONS DENIED 1 $97,000 0 $0 1 $97,000 APPLICATIONS WITHDRAWN 0 $0 1 $69,000 0 $0 FILES CLOSED FOR INCOMPLETENESS 0 $0 1 $88,000 0 $0
Aggregated Statistics For Year 2000(Based on 3 full tracts) A) Conventional B) Refinancings C) Non-occupant Loans on Number Average Value Number Average Value Number Average Value
LOANS ORIGINATED 18 $75,222 12 $81,250 2 $64,000 APPLICATIONS APPROVED, NOT ACCEPTED 6 $65,333 3 $55,333 2 $65,000 APPLICATIONS DENIED 1 $125,000 1 $88,000 0 $0 APPLICATIONS WITHDRAWN 0 $0 0 $0 0 $0 FILES CLOSED FOR INCOMPLETENESS 0 $0 0 $0 0 $0
Aggregated Statistics For Year 1999(Based on 3 full tracts) A) Conventional B) Refinancings C) Non-occupant Loans on Number Average Value Number Average Value Number Average Value
LOANS ORIGINATED 21 $75,701 13 $67,829 1 $69,060 APPLICATIONS APPROVED, NOT ACCEPTED 1 $69,060 1 $54,330 1 $69,060 APPLICATIONS DENIED 1 $79,020 2 $65,135 0 $0 APPLICATIONS WITHDRAWN 0 $0 0 $0 0 $0 FILES CLOSED FOR INCOMPLETENESS 0 $0 0 $0 0 $0
Detailed PMIC statistics for the following Tracts:
0237.00
, 0238.00 , 0239.00 Fire-safe hotels and motels in Middletown, Pennsylvania:
Holiday Inn Harrisburg East, 815 S Eisenhower Blvd, Middletown, Pennsylvania 17057 Phone: (717) 939-1600, Fax: (717) 939-2069
Days Inn, 800 Eisenhower Blvd, Middletown, Pennsylvania 17057 Phone: (717) 939-4147, Fax: (717) 939-5291
Restin One, LLC - DBA Comfort Inn & Suites - Harrisburg Airport - Hershey South, 1589 W Harrisburg Pike, Middletown, Pennsylvania 17057 Phone: (877) 424-6423, Fax: (717) 857-9776
Fairfield Inn & Suites Harrisburg International Airport, 2 Terminal Dr, Middletown, Pennsylvania 17057 Phone: (717) 944-1361, Fax: (717) 944-1371
All 4 fire-safe hotels and motels in Middletown, Pennsylvania Middletown compared to Pennsylvania state average:
Median house value below state average. Unemployed percentage below state average. Renting percentage above state average.
Top Patent Applicants
Robert Neil Whiteman, Jr. (28)
Steven David Dunwoody (15)
John Mongold (13)
Lou Castagna (11)
Douglas John Hardy (11)
Matthew Ryan Schmitt (8)
David Patrick Orris (8)
Bruce Eltringham Barry (6)
Edward John Bright (6)
Hurley Chester Moll (5)
Total of 190 patent applications in 2008-2024.
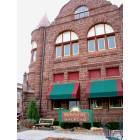

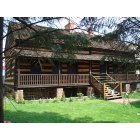
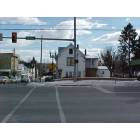
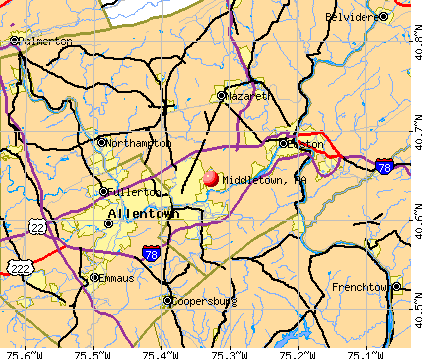


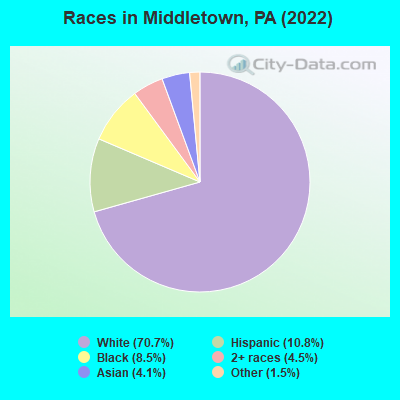
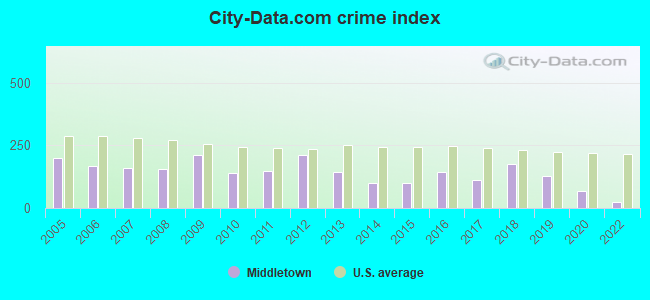
 Recent articles from our blog. Our writers, many of them Ph.D. graduates or candidates, create easy-to-read articles on a wide variety of topics.

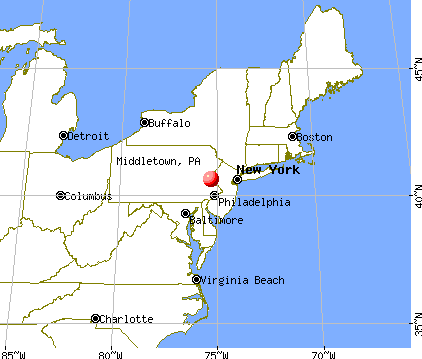
 (25.0 miles
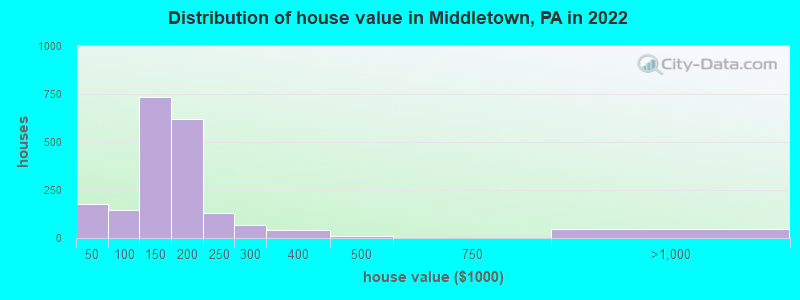

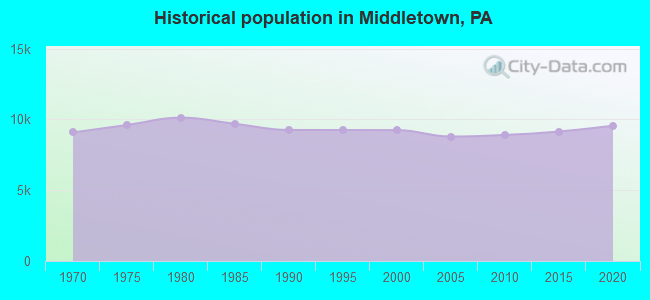
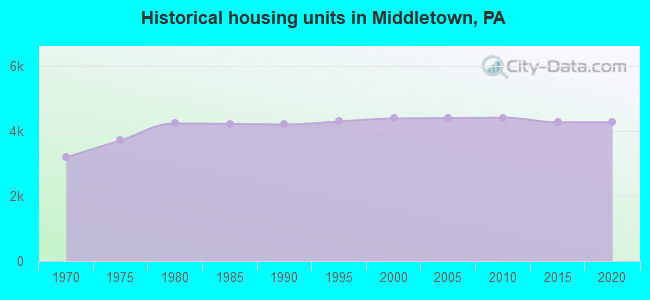
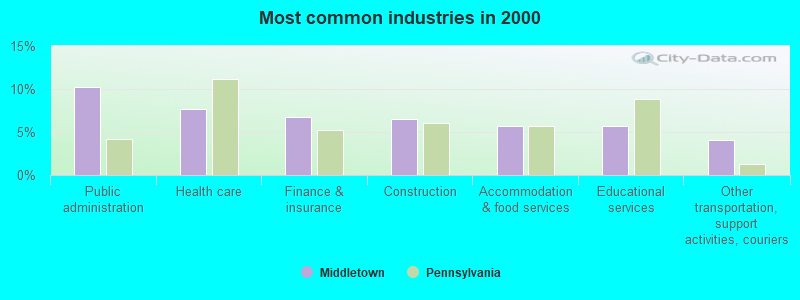
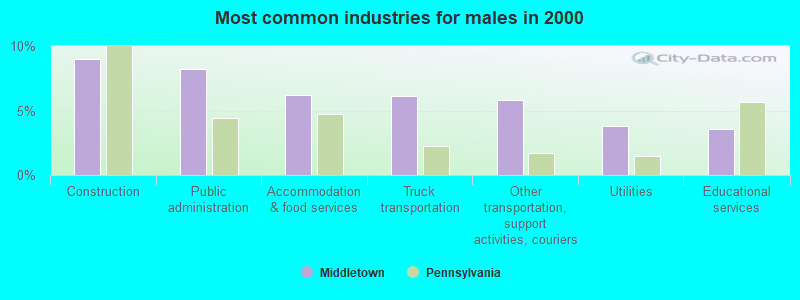
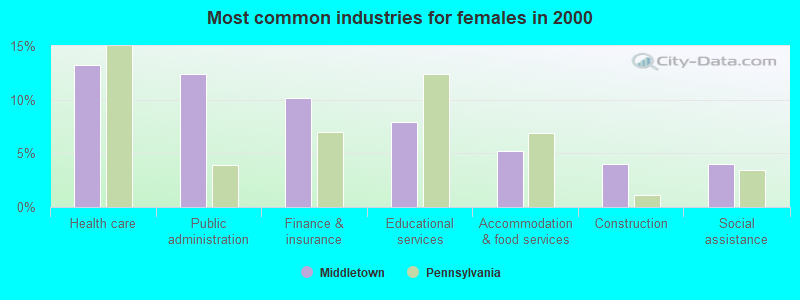
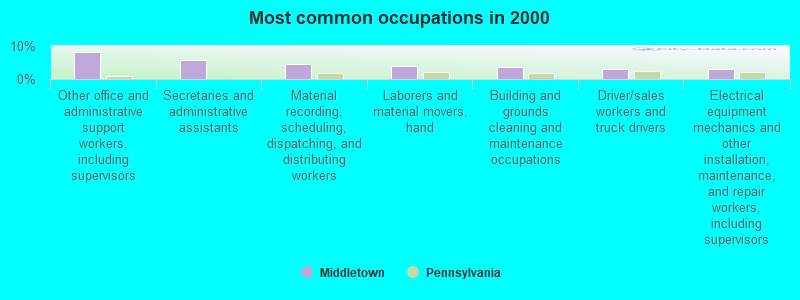
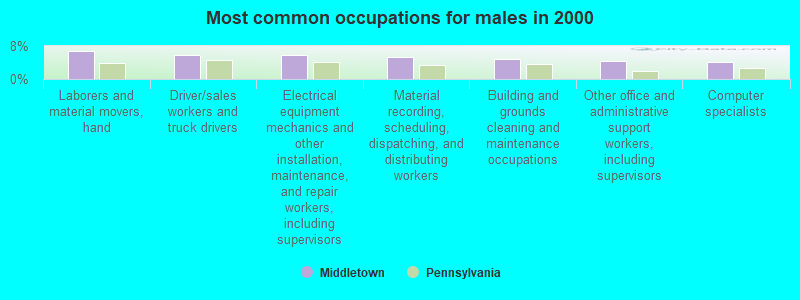
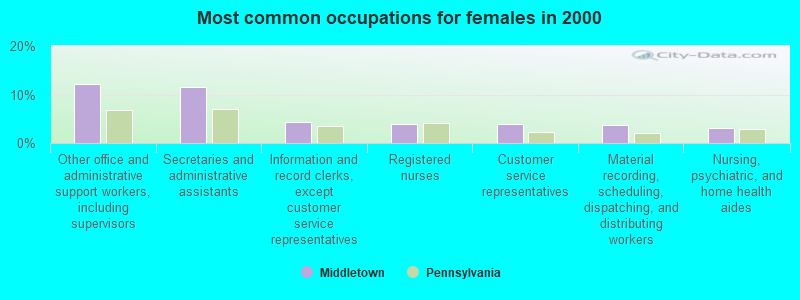
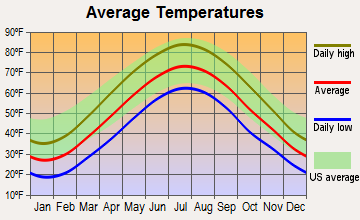
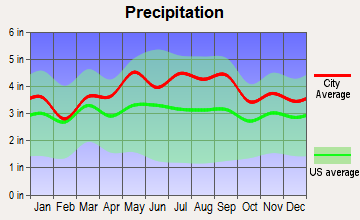
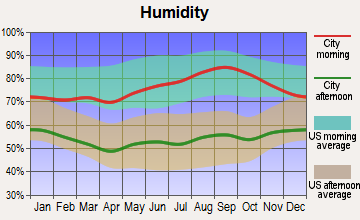
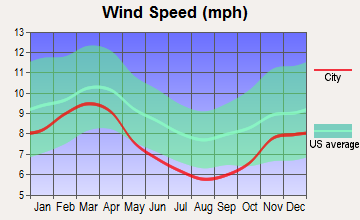
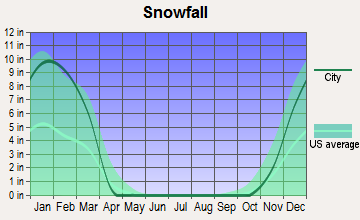
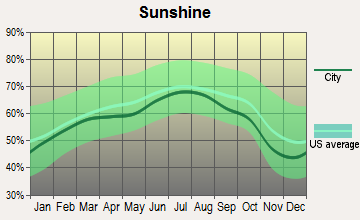
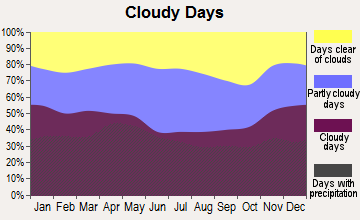
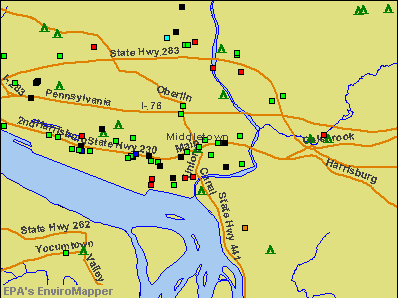

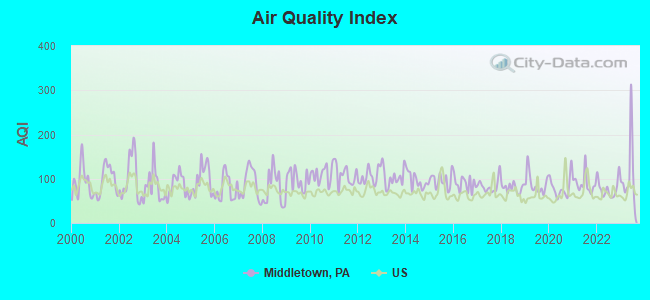
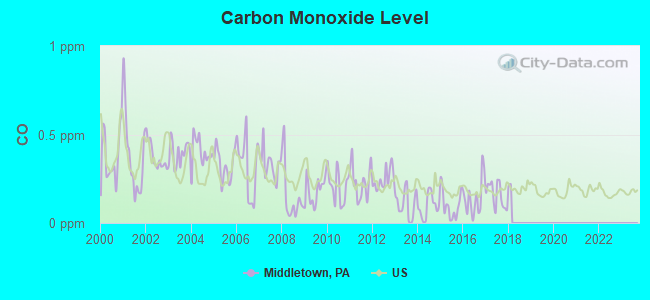
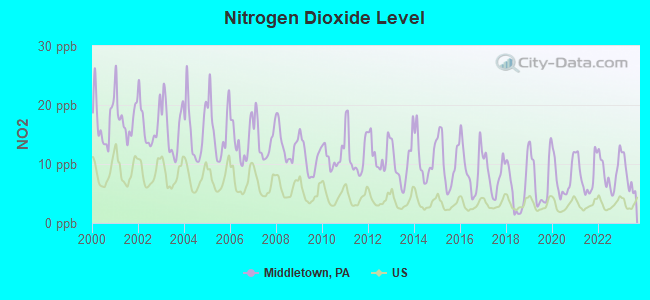
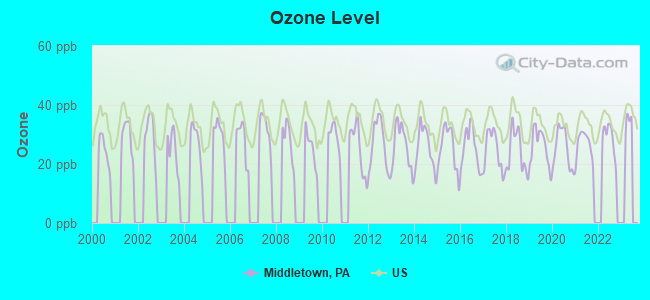
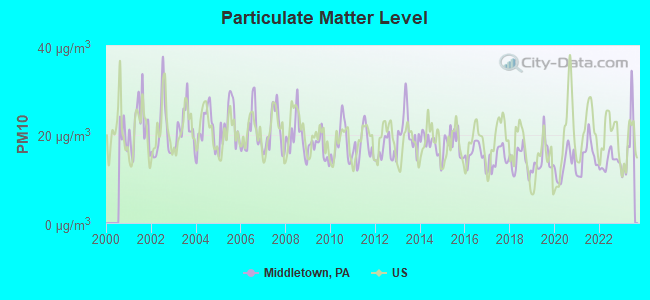
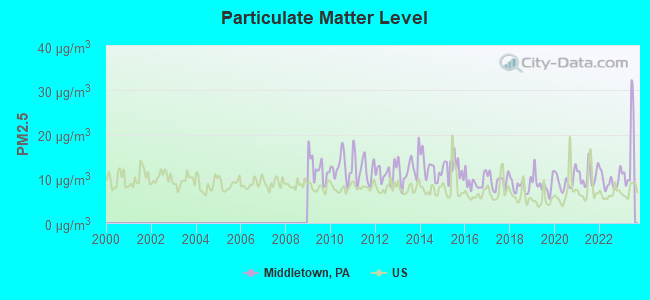

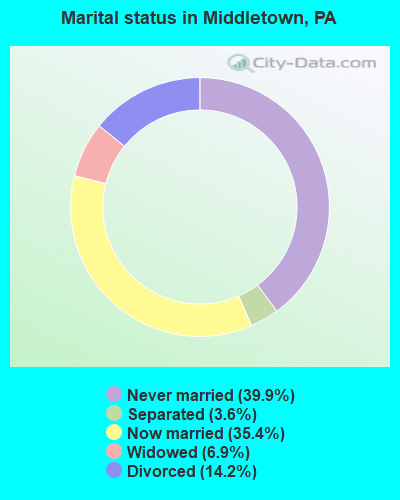
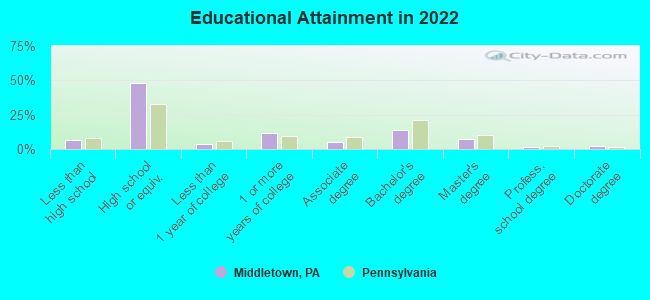
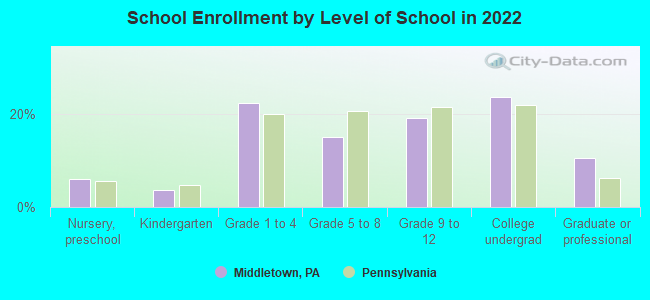
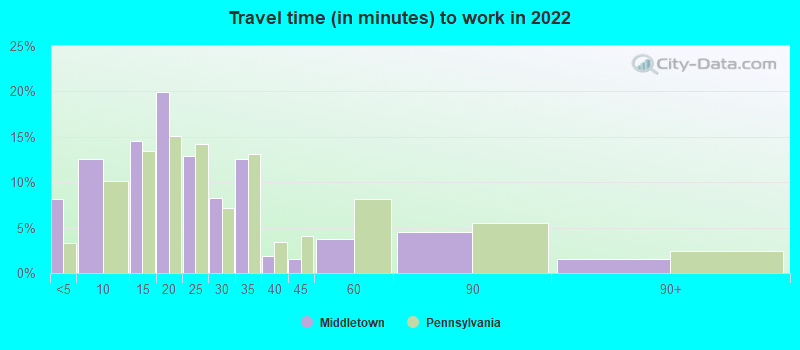
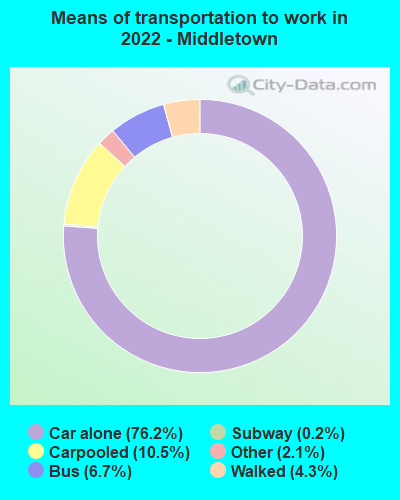
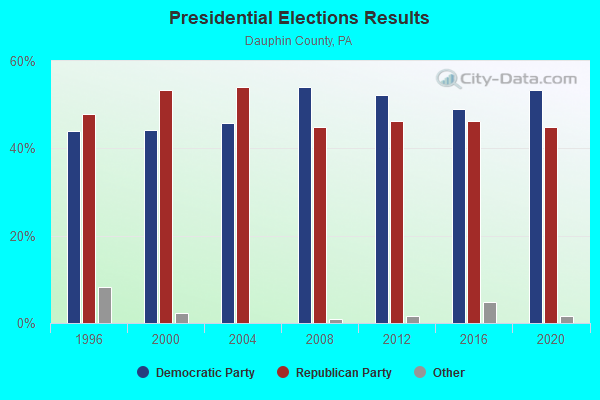
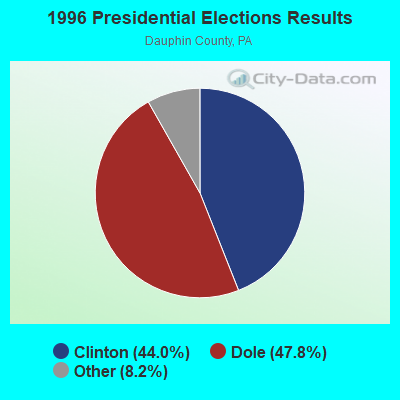
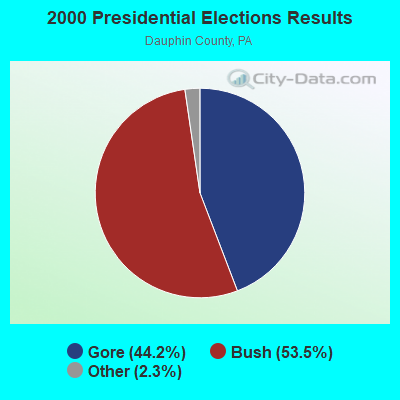
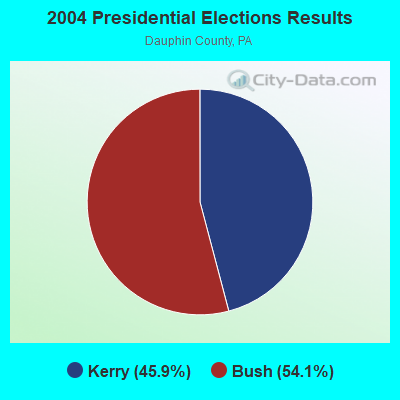
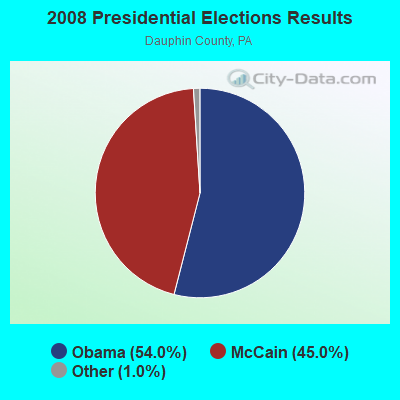
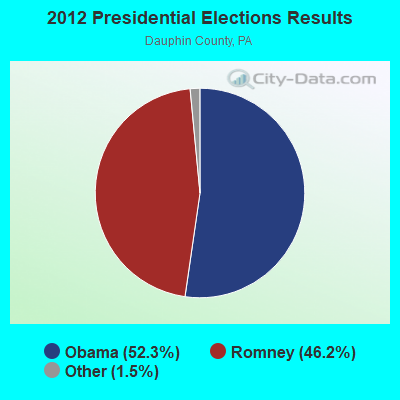
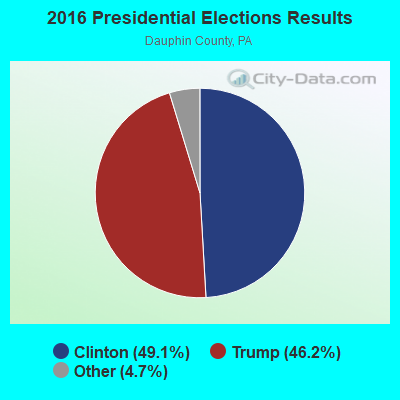
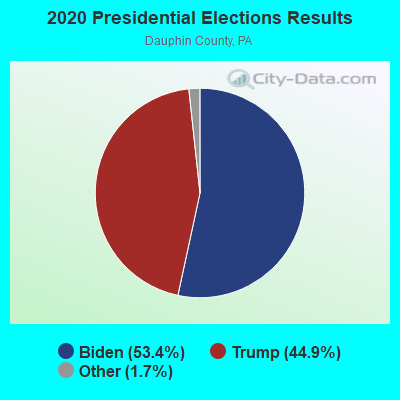
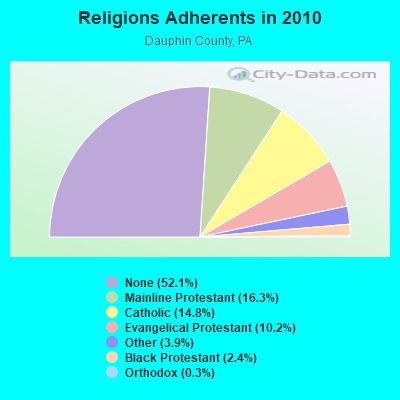
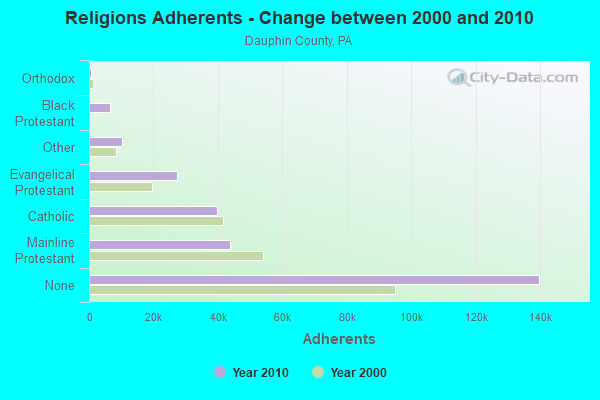
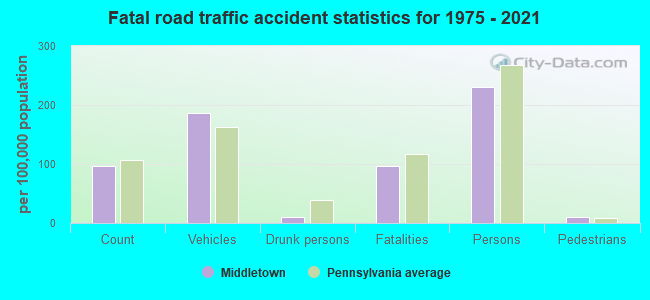
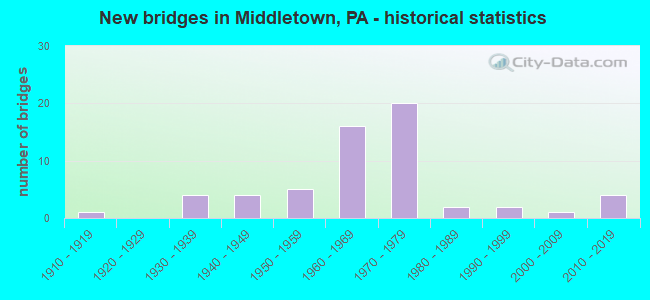
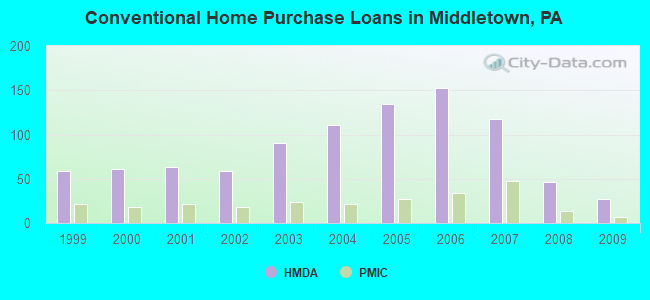
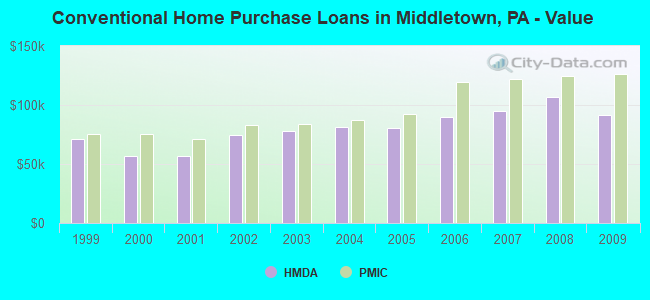
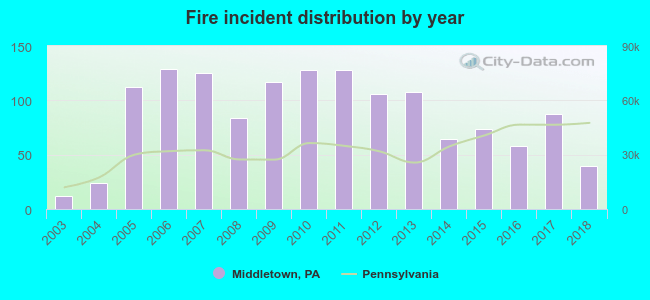 Based on the data from the years 2003 - 2018 the average number of fires per year is 87. The highest number of fire incidents - 129 took place in 2006, and the least - 12 in 2003. The data has a rising trend.
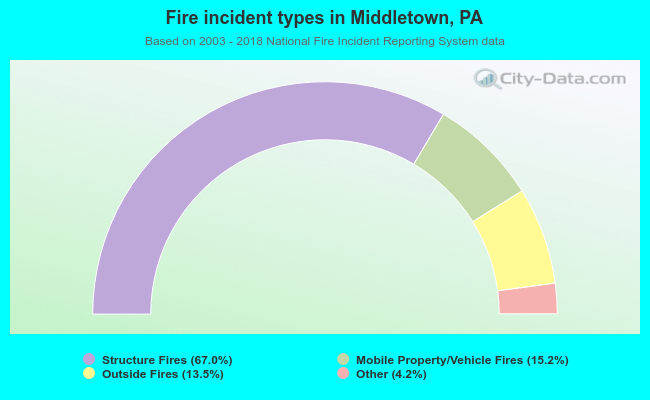 When looking into fire subcategories, the most incidents belonged to: Structure Fires (67.0%), and Mobile Property/Vehicle Fires (15.2%).