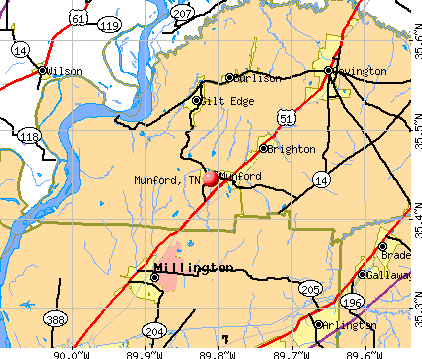
Munford, Tennessee

Munford: Munford at Night
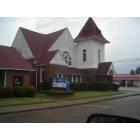
Munford: Munford Pres. church
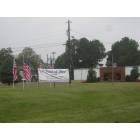
Munford: in front of city hall
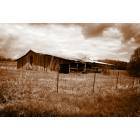
Munford: Taken in Munford
- add
your
Submit your own pictures of this town and show them to the world
- OSM Map
- General Map
- Google Map
- MSN Map
Population change since 2000: +40.3%
| Males: 3,417 | |
| Females: 3,190 |
| Median resident age: | 33.8 years |
| Tennessee median age: | 39.2 years |
Zip codes: 38058.
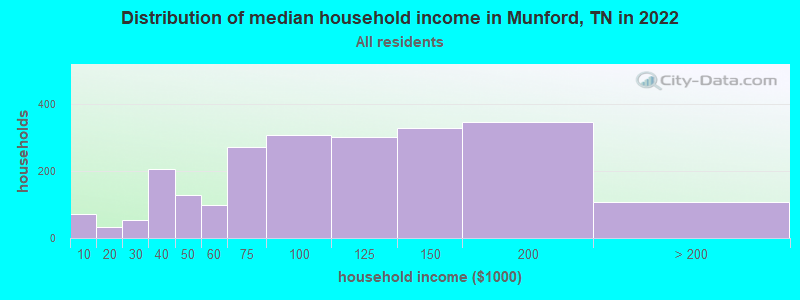
| Munford: | $91,099 |
| TN: | $65,254 |
Estimated per capita income in 2022: $34,332 (it was $19,656 in 2000)
Munford town income, earnings, and wages data
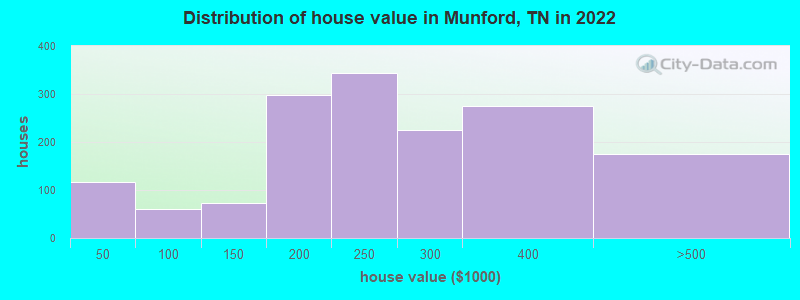
Estimated median house or condo value in 2022: $263,695 (it was $103,400 in 2000)
| Munford: | $263,695 |
| TN: | $284,800 |
Median gross rent in 2022: $1,169.
(2.0% for White Non-Hispanic residents, 23.6% for Black residents)
Detailed information about poverty and poor residents in Munford, TN

Compare current foreclosures in Munford, TN:
| Photo | Address | Area | Beds / Baths | Price | Details |
|---|---|---|---|---|---|

|
#1
Baltic Ave
Munford, TN 38058
|
1,341 sq. feet
|
2 baths 3 beds |
show details | |

|
#2
Marshall Rd
Munford, TN 38058
|
1,305 sq. feet
|
2 baths 3 beds |
show details | |

|
#3
Parkwood Ln
Munford, TN 38058
|
1,286 sq. feet
|
2 baths - beds |
show details | |

|
#4
Fleming Dr
Munford, TN 38058
|
1,354 sq. feet
|
2 baths - beds |
show details | |

|
#5
Campground Rd
Munford, TN 38058
|
2,280 sq. feet
|
2 baths - beds |
show details | |

|
#6
Beaver Rd
Munford, TN 38058
|
1,193 sq. feet
|
2 baths - beds |
show details | |

|
#7
Walker Field Rd
Munford, TN 38058
|
1,456 sq. feet
|
2 baths - beds |
show details | |

|
#8
N Gretna Green Dr
Munford, TN 38058
|
2,423 sq. feet
|
2 baths - beds |
show details | |

|
#9
Egypt Rd
Munford, TN 38058
|
2,387 sq. feet
|
2 baths - beds |
show details | |

|
#10
Kathleen Dr
Munford, TN 38058
|
1,546 sq. feet
|
2 baths - beds |
show details |
| Photo | Address | Area | Beds / Baths | Price | Details |
|---|---|---|---|---|---|

|
#11
Kathleen Dr
Munford, TN 38058
|
1,510 sq. feet
|
2 baths - beds |
show details | |

|
#12
Buford Rd W
Munford, TN 38058
|
1,346 sq. feet
|
2 baths - beds |
show details | |

|
#13
Plantation Ln
Munford, TN 38058
|
1,534 sq. feet
|
2 baths - beds |
show details | |

|
#14
Karen St
Munford, TN 38058
|
1,438 sq. feet
|
2 baths - beds |
show details | |

|
#15
New York Ave
Munford, TN 38058
|
1,350 sq. feet
|
2 baths - beds |
show details | |

|
#16
Munford Giltedge Rd
Munford, TN 38058
|
1,123 sq. feet
|
2 baths - beds |
show details | |

|
#17
Maple Hill Dr
Munford, TN 38058
|
1,435 sq. feet
|
2 baths - beds |
show details | |

|
#18
Ruth Shankle Dr
Munford, TN 38058
|
2,279 sq. feet
|
2 baths - beds |
show details | |

|
#19
Fite Rd
Munford, TN 38058
|
1,836 sq. feet
|
2 baths - beds |
show details | |

|
#20
Chance St
Munford, TN 38058
|
1,392 sq. feet
|
2 baths - beds |
show details |
| Photo | Address | Area | Beds / Baths | Price | Details |
|---|---|---|---|---|---|

|
#21
Boardwalk St
Munford, TN 38058
|
1,407 sq. feet
|
2 baths - beds |
show details | |

|
#22
Rolling Oaks Dr
Munford, TN 38058
|
1,140 sq. feet
|
1 baths - beds |
show details | |

|
#23
Education Ave
Munford, TN 38058
|
2,171 sq. feet
|
2 baths - beds |
show details | |

|
#24
Mattie Ann Ln
Munford, TN 38058
|
896 sq. feet
|
1 baths - beds |
show details | |

|
#25
Rachel Shankle Dr
Munford, TN 38058
|
3,085 sq. feet
|
3 baths - beds |
show details | |

|
#26
Pw Reed Dr
Munford, TN 38058
|
3,043 sq. feet
|
3 baths - beds |
show details | |

|
#27
Connecticut Ave
Munford, TN 38058
|
1,306 sq. feet
|
2 baths - beds |
show details | |

|
#28
Laurel Ln
Munford, TN 38058
|
1,284 sq. feet
|
2 baths - beds |
show details | |

|
#29
Beaver Rd
Munford, TN 38058
|
1,418 sq. feet
|
1 baths - beds |
show details | |

|
#30
Charles Ave
Munford, TN 38058
|
1,957 sq. feet
|
2 baths - beds |
show details |
| Photo | Address | Area | Beds / Baths | Price | Details |
|---|---|---|---|---|---|

|
#31
Nancye Reeder Dr
Munford, TN 38058
|
1,424 sq. feet
|
2 baths - beds |
show details | |

|
#32
Frances Ln
Munford, TN 38058
|
- sq. feet
|
- baths - beds |
show details | |

|
#33
Lawrence Cv
Munford, TN 38058
|
- sq. feet
|
- baths - beds |
show details | |

|
#34
S Meadows Cv
Munford, TN 38058
|
- sq. feet
|
- baths - beds |
show details | |

|
#35
Wooten Ave
Munford, TN 38058
|
- sq. feet
|
- baths - beds |
show details | |

|
#36
S Meadows Cv
Munford, TN 38058
|
- sq. feet
|
- baths - beds |
show details | |

|
#37
Campground Rd
Munford, TN 38058
|
- sq. feet
|
- baths - beds |
show details | |

|
#38
Walker Field Ln
Munford, TN 38058
|
- sq. feet
|
- baths - beds |
show details | |

|
Check over 1 million property listings on Foreclosure.com!
|
browse all offers | |||


- 5,19280.2%White alone
- 4507.0%Black alone
- 3225.0%Hispanic
- 2594.0%Two or more races
- 1963.0%Other race alone
- 891.4%Asian alone
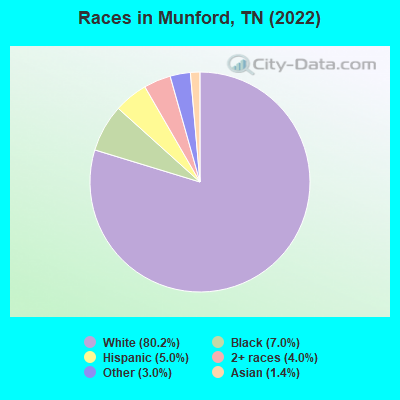
Races in Munford detailed stats: ancestries, foreign born residents, place of birth
According to our research of Tennessee and other state lists, there were 15 registered sex offenders living in Munford, Tennessee as of April 28, 2024.
The ratio of all residents to sex offenders in Munford is 408 to 1.
The ratio of registered sex offenders to all residents in this city is near the state average.
Type |
2009 |
2010 |
2011 |
2012 |
2013 |
2014 |
2015 |
2016 |
2017 |
2018 |
2019 |
2020 |
2021 |
2022 |
|---|---|---|---|---|---|---|---|---|---|---|---|---|---|---|
| Murders (per 100,000) | 1 (14.6) | 0 (0.0) | 2 (33.4) | 0 (0.0) | 0 (0.0) | 0 (0.0) | 0 (0.0) | 0 (0.0) | 0 (0.0) | 1 (16.4) | 1 (16.4) | 0 (0.0) | 0 (0.0) | 0 (0.0) |
| Rapes (per 100,000) | 6 (87.6) | 1 (16.9) | 1 (16.7) | 0 (0.0) | 5 (82.8) | 4 (66.2) | 0 (0.0) | 1 (16.3) | 3 (49.4) | 7 (114.9) | 3 (49.3) | 4 (65.2) | 2 (32.1) | 3 (46.4) |
| Robberies (per 100,000) | 1 (14.6) | 0 (0.0) | 1 (16.7) | 4 (66.6) | 1 (16.6) | 1 (16.5) | 1 (16.4) | 1 (16.3) | 1 (16.5) | 1 (16.4) | 1 (16.4) | 0 (0.0) | 0 (0.0) | 0 (0.0) |
| Assaults (per 100,000) | 7 (102.2) | 8 (135.0) | 24 (401.3) | 21 (349.9) | 8 (132.5) | 20 (330.8) | 18 (296.0) | 14 (228.0) | 12 (197.4) | 20 (328.4) | 12 (197.3) | 8 (130.4) | 19 (304.8) | 7 (108.3) |
| Burglaries (per 100,000) | 27 (394.1) | 27 (455.5) | 26 (434.8) | 23 (383.2) | 35 (579.9) | 18 (297.7) | 25 (411.0) | 19 (309.4) | 11 (181.0) | 30 (492.6) | 18 (295.9) | 20 (326.1) | 9 (144.4) | 13 (201.1) |
| Thefts (per 100,000) | 107 (1,562) | 90 (1,518) | 97 (1,622) | 82 (1,366) | 114 (1,889) | 107 (1,770) | 95 (1,562) | 81 (1,319) | 88 (1,448) | 77 (1,264) | 60 (986.4) | 60 (978.2) | 20 (320.9) | 51 (788.7) |
| Auto thefts (per 100,000) | 9 (131.4) | 5 (84.4) | 6 (100.3) | 5 (83.3) | 1 (16.6) | 6 (99.2) | 5 (82.2) | 4 (65.1) | 8 (131.6) | 7 (114.9) | 5 (82.2) | 6 (97.8) | 3 (48.1) | 9 (139.2) |
| Arson (per 100,000) | 0 (0.0) | 0 (0.0) | 1 (16.7) | 0 (0.0) | 1 (16.6) | 1 (16.5) | 1 (16.4) | 0 (0.0) | 1 (16.5) | 0 (0.0) | 0 (0.0) | 0 (0.0) | 0 (0.0) | 1 (15.5) |
| City-Data.com crime index | 224.6 | 139.9 | 268.9 | 178.1 | 215.2 | 223.6 | 162.0 | 143.2 | 165.0 | 289.7 | 183.5 | 148.0 | 113.4 | 115.5 |
The City-Data.com crime index weighs serious crimes and violent crimes more heavily. Higher means more crime, U.S. average is 246.1. It adjusts for the number of visitors and daily workers commuting into cities.
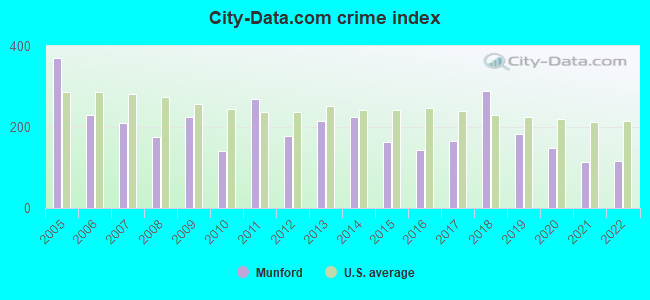
Crime rate in Munford detailed stats: murders, rapes, robberies, assaults, burglaries, thefts, arson
Full-time law enforcement employees in 2021, including police officers: 18 (18 officers - 17 male; 1 female).
| Officers per 1,000 residents here: | 2.89 |
| Tennessee average: | 2.57 |
 Recent articles from our blog. Our writers, many of them Ph.D. graduates or candidates, create easy-to-read articles on a wide variety of topics.

 | Mempis safe for young family? (27 replies) |
| Moving to munford - power, anyone? (0 replies) |
| Brighton or Munford Schools? (3 replies) |
| Most likely moving to Memphis next summer! (57 replies) |
| Single Mom thinking of relocating Memphis Suburbs (12 replies) |
| Memphis area - Brownsville job - where to live? (10 replies) |
Latest news from Munford, TN collected exclusively by city-data.com from local newspapers, TV, and radio stations
Ancestries: American (49.0%), European (9.1%), English (4.0%), Irish (3.9%), French (1.8%), Italian (1.6%).
Current Local Time: CST time zone
Incorporated in 1905
Elevation: 445 feet
Land area: 8.04 square miles.
Population density: 822 people per square mile (low).
147 residents are foreign born (1.8% Asia, 0.3% Europe).
| This town: | 2.3% |
| Tennessee: | 5.4% |
Median real estate property taxes paid for housing units with mortgages in 2022: $1,345 (0.5%)
Median real estate property taxes paid for housing units with no mortgage in 2022: $1,417 (0.7%)
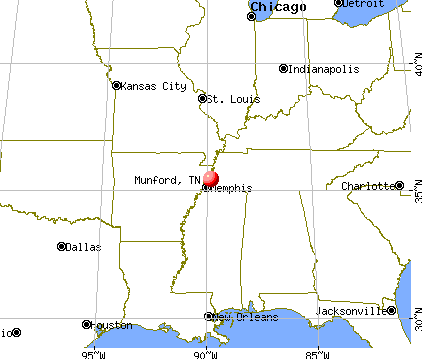
Nearest city with pop. 50,000+: Memphis, TN  (24.4 miles , pop. 650,100).
Nearest city with pop. 1,000,000+: Dallas, TX (439.2 miles , pop. 1,188,580).
Nearest cities:
), ), ), ), Latitude: 35.44 N, Longitude: 89.81 W
Area code: 901
Munford, Tennessee accommodation & food services, waste management - Economy and Business Data
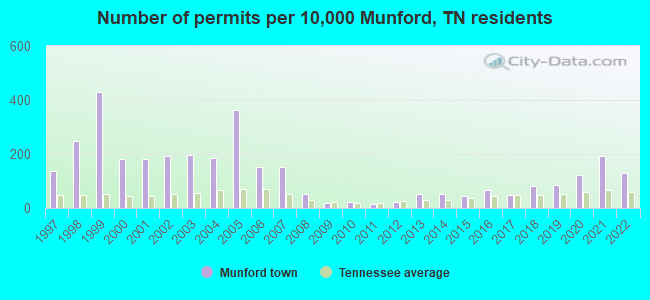
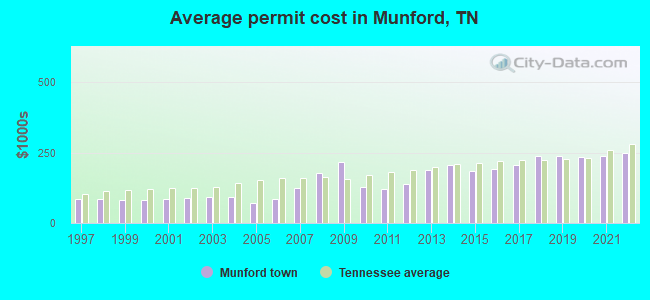
Single-family new house construction building permits:
- 2022: 61 buildings, average cost: $248,100
- 2021: 90 buildings, average cost: $238,600
- 2020: 57 buildings, average cost: $233,900
- 2019: 40 buildings, average cost: $237,200
- 2018: 39 buildings, average cost: $236,300
- 2017: 22 buildings, average cost: $206,500
- 2016: 31 buildings, average cost: $193,000
- 2015: 21 buildings, average cost: $186,400
- 2014: 24 buildings, average cost: $207,300
- 2013: 25 buildings, average cost: $188,500
- 2012: 11 buildings, average cost: $138,800
- 2011: 7 buildings, average cost: $120,700
- 2010: 11 buildings, average cost: $129,300
- 2009: 9 buildings, average cost: $215,800
- 2008: 24 buildings, average cost: $176,700
- 2007: 72 buildings, average cost: $123,400
- 2006: 71 buildings, average cost: $86,400
- 2005: 171 buildings, average cost: $72,400
- 2004: 88 buildings, average cost: $91,500
- 2003: 92 buildings, average cost: $91,400
- 2002: 91 buildings, average cost: $87,000
- 2001: 85 buildings, average cost: $85,700
- 2000: 85 buildings, average cost: $83,100
- 1999: 203 buildings, average cost: $82,600
- 1998: 117 buildings, average cost: $85,000
- 1997: 64 buildings, average cost: $85,500
| Here: | 3.6% |
| Tennessee: | 3.0% |
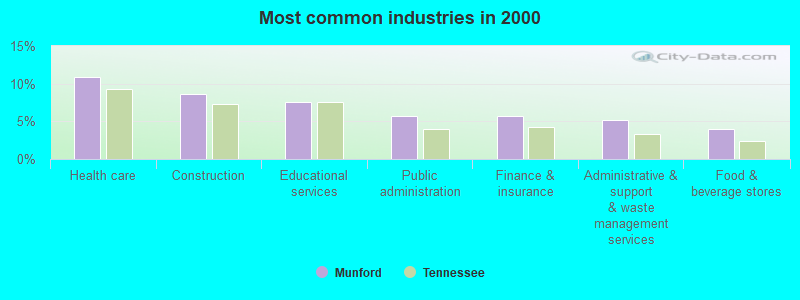
- Health care (10.9%)
- Construction (8.7%)
- Educational services (7.6%)
- Public administration (5.8%)
- Finance & insurance (5.8%)
- Administrative & support & waste management services (5.2%)
- Food & beverage stores (3.9%)
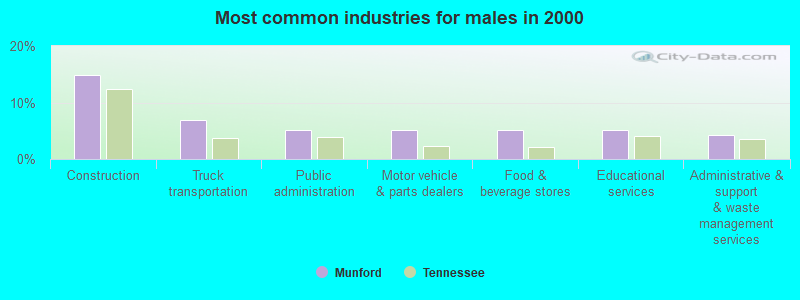
- Construction (14.9%)
- Truck transportation (6.9%)
- Public administration (5.2%)
- Motor vehicle & parts dealers (5.2%)
- Food & beverage stores (5.2%)
- Educational services (5.1%)
- Administrative & support & waste management services (4.2%)
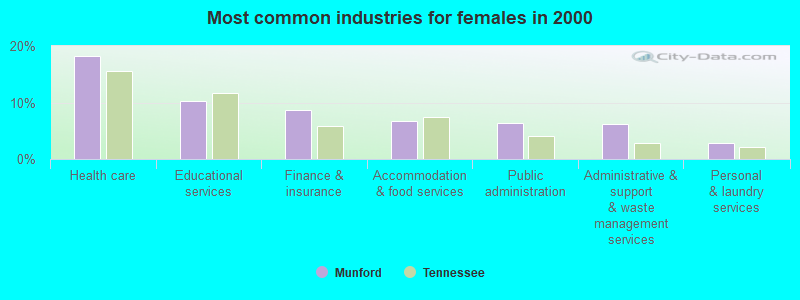
- Health care (18.3%)
- Educational services (10.2%)
- Finance & insurance (8.7%)
- Accommodation & food services (6.7%)
- Public administration (6.4%)
- Administrative & support & waste management services (6.3%)
- Personal & laundry services (2.9%)
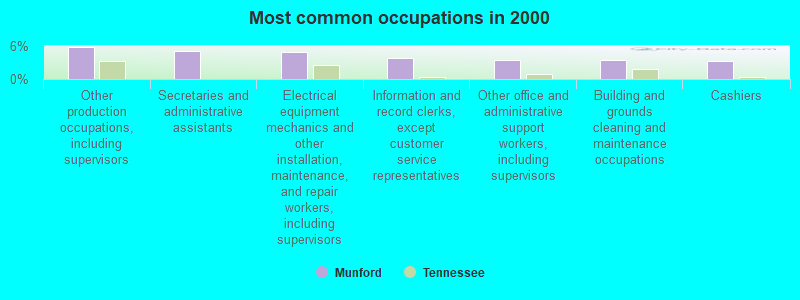
- Other production occupations, including supervisors (5.8%)
- Secretaries and administrative assistants (5.2%)
- Electrical equipment mechanics and other installation, maintenance, and repair workers, including supervisors (4.9%)
- Information and record clerks, except customer service representatives (3.9%)
- Other office and administrative support workers, including supervisors (3.5%)
- Building and grounds cleaning and maintenance occupations (3.4%)
- Cashiers (3.3%)
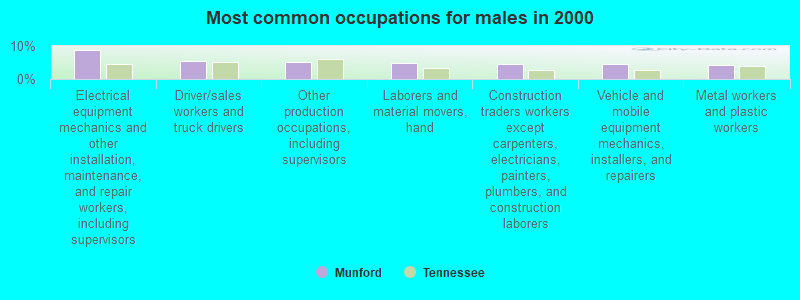
- Electrical equipment mechanics and other installation, maintenance, and repair workers, including supervisors (8.9%)
- Driver/sales workers and truck drivers (5.5%)
- Other production occupations, including supervisors (5.3%)
- Laborers and material movers, hand (4.8%)
- Construction traders workers except carpenters, electricians, painters, plumbers, and construction laborers (4.6%)
- Vehicle and mobile equipment mechanics, installers, and repairers (4.6%)
- Metal workers and plastic workers (4.4%)
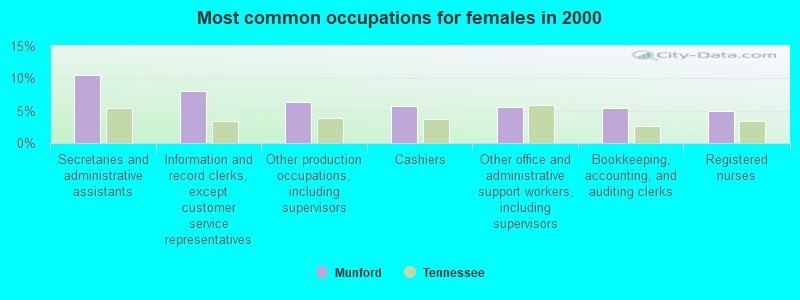
- Secretaries and administrative assistants (10.6%)
- Information and record clerks, except customer service representatives (8.0%)
- Other production occupations, including supervisors (6.3%)
- Cashiers (5.7%)
- Other office and administrative support workers, including supervisors (5.5%)
- Bookkeeping, accounting, and auditing clerks (5.3%)
- Registered nurses (4.9%)
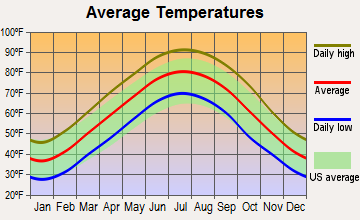
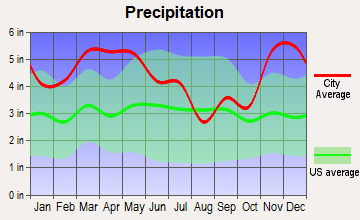
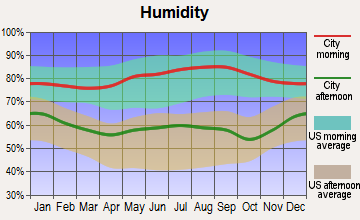
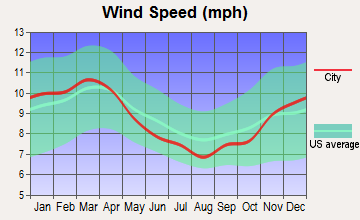
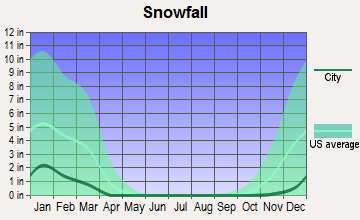
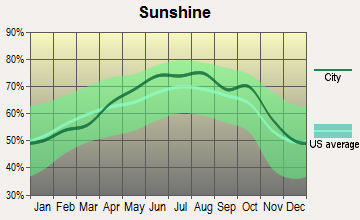
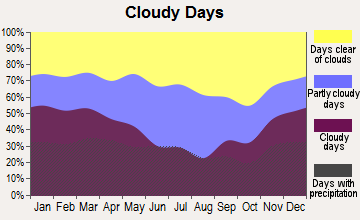
Average climate in Munford, Tennessee
Based on data reported by over 4,000 weather stations
|
|

(lower is better)
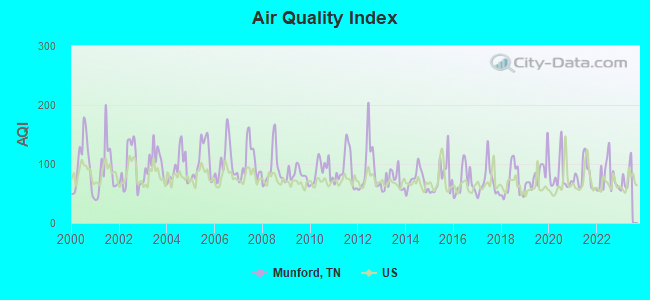
Air Quality Index (AQI) level in 2022 was 77.6. This is about average.
| City: | 77.6 |
| U.S.: | 72.6 |
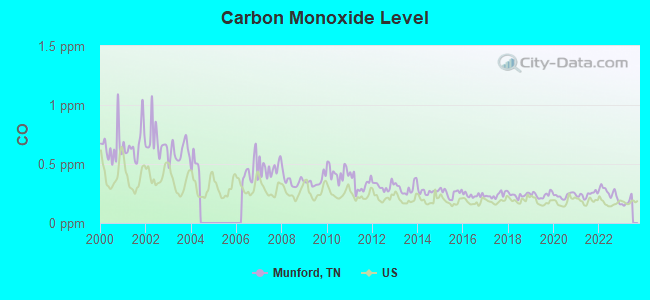
Carbon Monoxide (CO) [ppm] level in 2022 was 0.254. This is about average. Closest monitor was 19.7 miles away from the city center.
| City: | 0.254 |
| U.S.: | 0.251 |
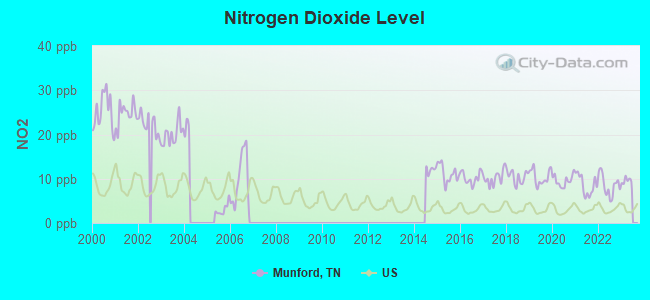
Nitrogen Dioxide (NO2) [ppb] level in 2022 was 8.52. This is significantly worse than average. Closest monitor was 13.1 miles away from the city center.
| City: | 8.52 |
| U.S.: | 5.11 |
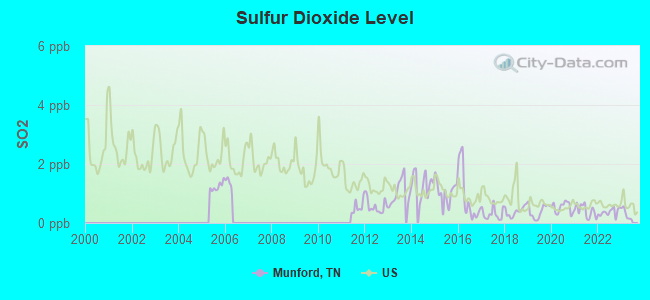
Sulfur Dioxide (SO2) [ppb] level in 2022 was 0.365. This is significantly better than average. Closest monitor was 13.1 miles away from the city center.
| City: | 0.365 |
| U.S.: | 1.515 |
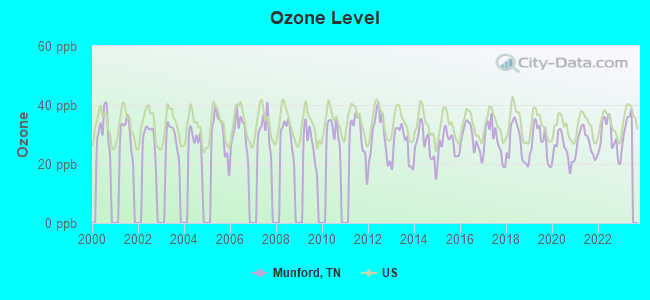
Ozone [ppb] level in 2022 was 29.2. This is about average. Closest monitor was 19.7 miles away from the city center.
| City: | 29.2 |
| U.S.: | 33.3 |
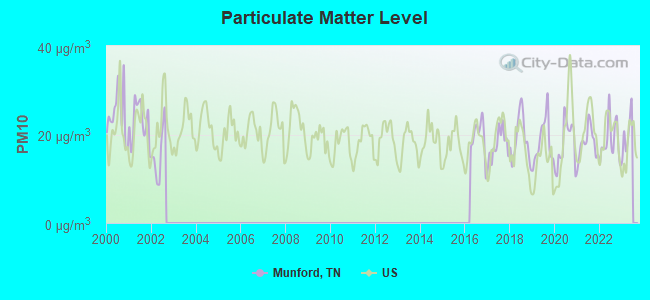
Particulate Matter (PM10) [µg/m3] level in 2022 was 18.5. This is about average. Closest monitor was 12.1 miles away from the city center.
| City: | 18.5 |
| U.S.: | 19.2 |
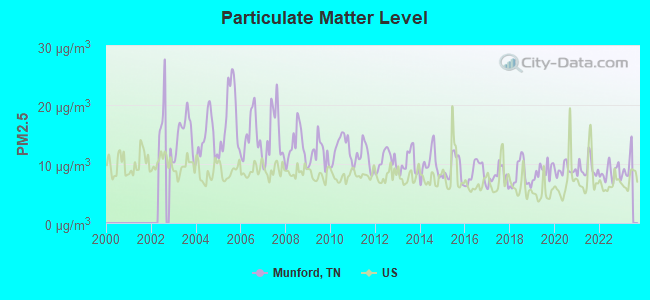
Particulate Matter (PM2.5) [µg/m3] level in 2022 was 8.53. This is about average. Closest monitor was 4.8 miles away from the city center.
| City: | 8.53 |
| U.S.: | 8.11 |
Tornado activity:
Munford-area historical tornado activity is above Tennessee state average. It is 109% greater than the overall U.S. average.
On 3/1/1997, a category F4 (max. wind speeds 207-260 mph) tornado 30.6 miles away from the Munford town center caused $30,000 in damages.
On 12/14/1987, a category F3 (max. wind speeds 158-206 mph) tornado 9.0 miles away from the town center killed 6 people and injured 121 people and caused between $5,000,000 and $50,000,000 in damages.
Earthquake activity:
Munford-area historical earthquake activity is significantly above Tennessee state average. It is 384% greater than the overall U.S. average.On 3/25/1976 at 00:41:20, a magnitude 5.0 (4.9 MB, 5.0 LG, Class: Moderate, Intensity: VI - VII) earthquake occurred 32.0 miles away from the city center
On 5/4/1991 at 01:18:54, a magnitude 5.0 (4.4 MB, 4.6 LG, 5.0 LG, Depth: 3.1 mi) earthquake occurred 77.4 miles away from Munford center
On 4/27/1989 at 16:47:49, a magnitude 4.7 (4.6 MB, 4.7 LG, 4.3 LG, Class: Light, Intensity: IV - V) earthquake occurred 38.9 miles away from Munford center
On 9/26/1990 at 13:18:51, a magnitude 5.0 (4.7 MB, 4.8 LG, 5.0 LG, Depth: 7.7 mi) earthquake occurred 120.1 miles away from Munford center
On 3/25/1976 at 01:00:11, a magnitude 4.5 (4.1 MB, 4.5 LG) earthquake occurred 39.4 miles away from Munford center
On 4/18/2008 at 09:36:59, a magnitude 5.4 (5.1 MB, 4.8 MS, 5.4 MW, 5.2 MW) earthquake occurred 233.6 miles away from the city center
Magnitude types: regional Lg-wave magnitude (LG), body-wave magnitude (MB), surface-wave magnitude (MS), moment magnitude (MW)
Natural disasters:
The number of natural disasters in Tipton County (15) is near the US average (15).Major Disasters (Presidential) Declared: 12
Emergencies Declared: 1
Causes of natural disasters: Floods: 11, Storms: 11, Tornadoes: 6, Winds: 4, Winter Storms: 2, Flash Flood: 1, Hurricane: 1, Ice Storm: 1, Landslide: 1, Mudslide: 1, Other: 1 (Note: some incidents may be assigned to more than one category).
Hospitals and medical centers near Munford:
- DAVITA MILLINGTON (Dialysis Facility, about 6 miles away; MILLINGTON, TN)
- FMC TIPTON COUNTY (Dialysis Facility, about 7 miles away; COVINGTON, TN)
- BAPTIST HOME CARE AND HOSPICE - COVINGTON (Home Health Center, about 7 miles away; COVINGTON, TN)
- BAPTIST MEMORIAL HOSPITAL TIPTON Acute Care Hospitals (about 7 miles away; COVINGTON, TN)
- MILLINGTON HEALTHCARE CENTER (Nursing Home, about 9 miles away; MILLINGTON, TN)
- FMC MILLINGTON (Dialysis Facility, about 9 miles away; MILLINGTON, TN)
- COVINGTON CARE NURSING AND REHABILITATION CENTER INC (Nursing Home, about 12 miles away; COVINGTON, TN)
Colleges/universities with over 2000 students nearest to Munford:
- Rhodes College (about 23 miles; Memphis, TN; Full-time enrollment: 2,052)
- University of Memphis (about 25 miles; Memphis, TN; FT enrollment: 17,427)
- Southwest Tennessee Community College (about 25 miles; Memphis, TN; FT enrollment: 8,043)
- Dyersburg State Community College (about 48 miles; Dyersburg, TN; FT enrollment: 2,211)
- Union University (about 56 miles; Jackson, TN; FT enrollment: 4,051)
- Arkansas State University-Main Campus (about 57 miles; Jonesboro, AR; FT enrollment: 12,323)
- Northwest Mississippi Community College (about 58 miles; Senatobia, MS; FT enrollment: 6,607)
Public high school in Munford:
- MUNFORD HIGH SCHOOL (Students: 1,391, Location: 1080 MCLAUGHLIN DR, Grades: 9-12)
Public elementary/middle schools in Munford:
- MUNFORD ELEMENTARY (Students: 977, Location: 1200 MCLAUGHLIN DR, Grades: PK-5)
- MUNFORD MIDDLE SCHOOL (Students: 949, Location: 100 EDUCATION AV, Grades: 6-8)
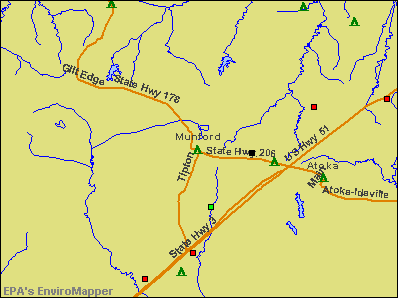
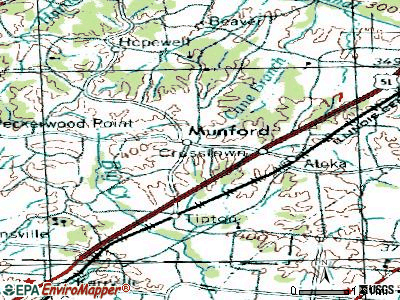
Points of interest:
Notable locations in Munford: Munford and Atoka Fire Department Station 1 (A), Munford Memorial Library (B), Munford City Hall (C). Display/hide their locations on the map
Churches in Munford include: Munford Baptist Church (A), Munford Church of Christ (B), Munford United Methodist Church (C), Pentecost Church (D), Saint Marks Church (E), Tipton Church (F). Display/hide their locations on the map
Cemetery: Crigger Cemetery (1). Display/hide its location on the map
Park in Munford: Munford City Park (1). Display/hide its location on the map
Drinking water stations with addresses in Munford and their reported violations in the past:
MUNFORD WATER DEPT (Population served: 8,957, Groundwater):Past monitoring violations:
- Monitoring and Reporting (DBP) - Between OCT-2006 and DEC-2006, Contaminant: Chlorine. Follow-up actions: St Compliance achieved (JAN-01-2007), St Public Notif requested (FEB-01-2007), St Violation/Reminder Notice (FEB-01-2007)
- Monitoring and Reporting (DBP) - Between JUL-2005 and SEP-2005, Contaminant: TTHM. Follow-up actions: St Compliance achieved (OCT-05-2005), St Public Notif requested (OCT-28-2005), St Violation/Reminder Notice (OCT-28-2005)
- Monitoring and Reporting (DBP) - Between JUL-2005 and SEP-2005, Contaminant: Total Haloacetic Acids (HAA5). Follow-up actions: St Compliance achieved (OCT-05-2005), St Public Notif requested (OCT-28-2005), St Violation/Reminder Notice (OCT-28-2005)
- One routine major monitoring violation
- One minor monitoring violation
| This town: | 2.7 people |
| Tennessee: | 2.5 people |
| This town: | 76.7% |
| Whole state: | 67.3% |
| This town: | 5.1% |
| Whole state: | 5.8% |
Likely homosexual households (counted as self-reported same-sex unmarried-partner households)
- Lesbian couples: 0.3% of all households
- Gay men: 0.1% of all households
Banks with branches in Munford (2011 data):
- First Citizens National Bank: Munford Branch at 1426 Munford Avenue, branch established on 2003/06/13; Munford Drive-Thru Branch at 1483 Munford Avenue, branch established on 2003/06/13. Info updated 2006/11/03: Bank assets: $1,053.2 mil, Deposits: $856.0 mil, headquarters in Dyersburg, TN, positive income, Commercial Lending Specialization, 19 total offices, Holding Company: First Citizens Bancshares, Inc.
- Regions Bank: Munford Branch at 157 South Tipton Street, branch established on 1984/08/20. Info updated 2011/02/24: Bank assets: $123,368.2 mil, Deposits: $98,301.3 mil, headquarters in Birmingham, AL, positive income, Commercial Lending Specialization, 1778 total offices, Holding Company: Regions Financial Corporation
For population 15 years and over in Munford:
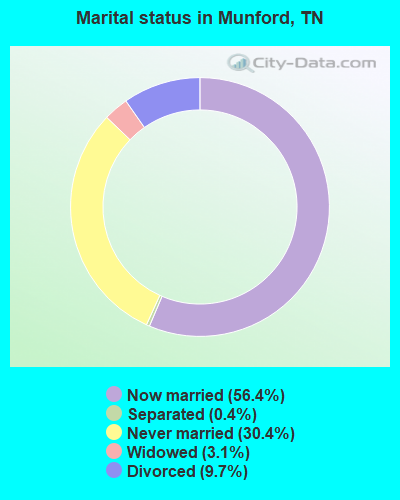
- Never married: 30.4%
- Now married: 56.4%
- Separated: 0.4%
- Widowed: 3.1%
- Divorced: 9.7%
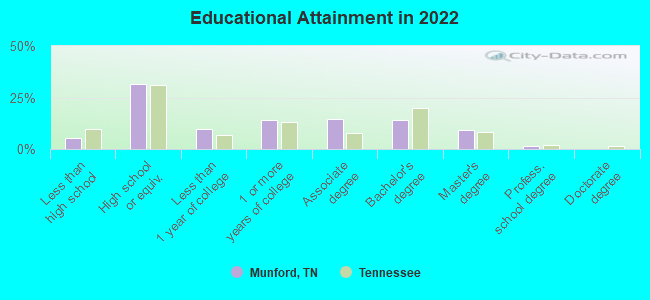
For population 25 years and over in Munford:
- High school or higher: 93.6%
- Bachelor's degree or higher: 23.7%
- Graduate or professional degree: 10.2%
- Unemployed: 3.8%
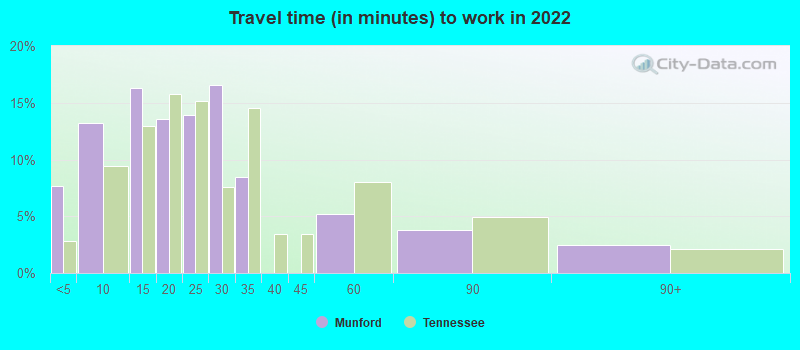
- Mean travel time to work (commute): 27.0 minutes
| Here: | 9.2 |
| Tennessee average: | 11.4 |
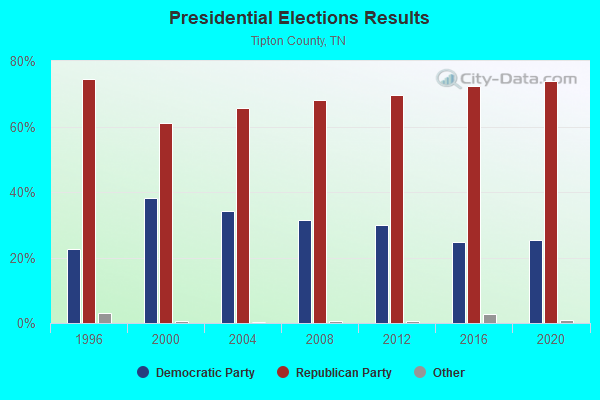
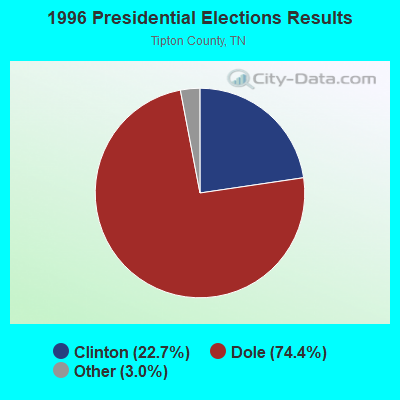
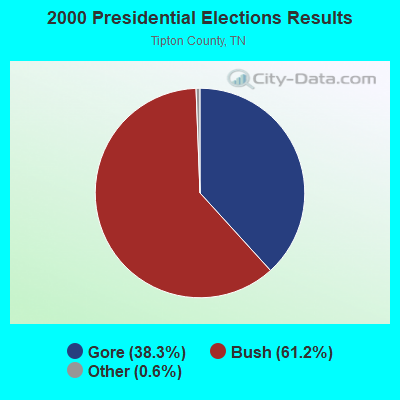

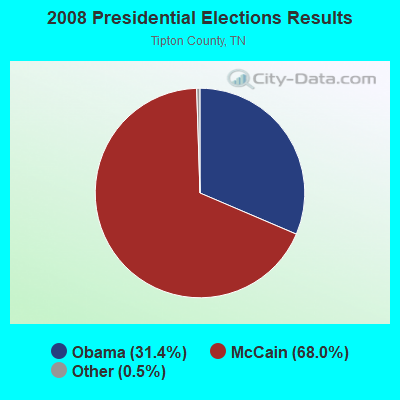
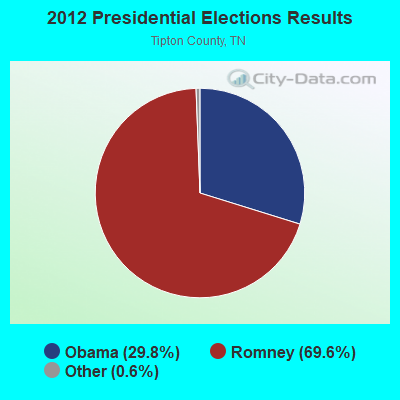
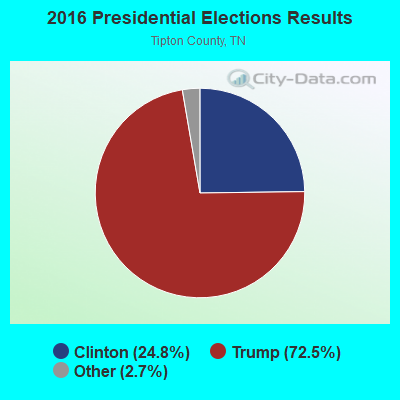
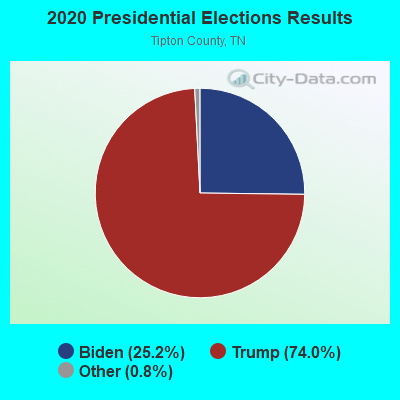
Graphs represent county-level data. Detailed 2008 Election Results
Religion statistics for Munford, TN (based on Tipton County data)
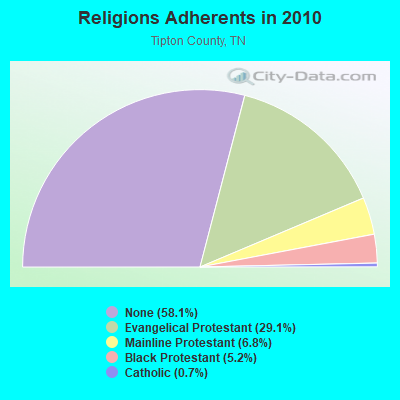
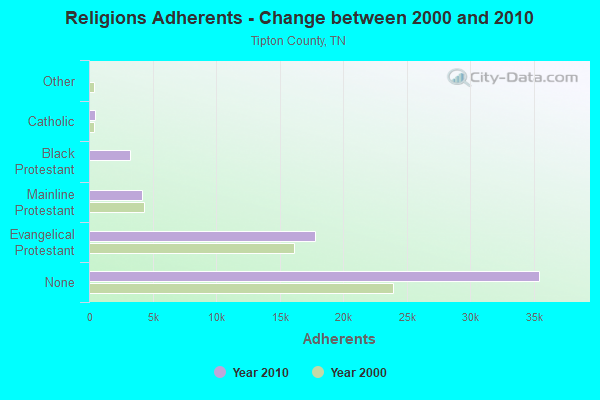
| Religion | Adherents | Congregations |
|---|---|---|
| Evangelical Protestant | 17,792 | 76 |
| Mainline Protestant | 4,172 | 20 |
| Black Protestant | 3,196 | 18 |
| Catholic | 450 | 1 |
| Other | 4 | 1 |
| None | 35,467 | - |
Food Environment Statistics:
| Tipton County: | 1.56 / 10,000 pop. |
| Tennessee: | 1.99 / 10,000 pop. |
| This county: | 0.87 / 10,000 pop. |
| Tennessee: | 0.65 / 10,000 pop. |
| Tipton County: | 5.03 / 10,000 pop. |
| Tennessee: | 5.16 / 10,000 pop. |
| Tipton County: | 3.82 / 10,000 pop. |
| Tennessee: | 6.56 / 10,000 pop. |
| Here: | 10.8% |
| State: | 11.4% |
| Tipton County: | 33.2% |
| Tennessee: | 30.2% |
| Tipton County: | 11.1% |
| Tennessee: | 13.5% |
Health and Nutrition:
| Here: | 54.2% |
| State: | 49.3% |
| Here: | 54.2% |
| Tennessee: | 46.1% |
| Munford: | 28.3 |
| Tennessee: | 28.8 |
| Munford: | 19.4% |
| State: | 21.0% |
| Munford: | 8.3% |
| Tennessee: | 10.5% |
| Munford: | 6.9 |
| Tennessee: | 6.8 |
| Munford: | 33.4% |
| Tennessee: | 33.9% |
| Munford: | 62.0% |
| Tennessee: | 55.9% |
| Munford: | 81.5% |
| Tennessee: | 79.1% |
More about Health and Nutrition of Munford, TN Residents
| Local government employment and payroll (March 2022) | |||||
| Function | Full-time employees | Monthly full-time payroll | Average yearly full-time wage | Part-time employees | Monthly part-time payroll |
|---|---|---|---|---|---|
| Police Protection - Officers | 19 | $78,000 | $49,263 | 1 | $299 |
| Firefighters | 13 | $57,699 | $53,261 | 1 | $296 |
| Water Supply | 11 | $36,504 | $39,823 | 0 | $0 |
| Gas Supply | 10 | $39,564 | $47,477 | 1 | $620 |
| Other Government Administration | 7 | $27,356 | $46,896 | 0 | $0 |
| Parks and Recreation | 6 | $9,202 | $18,404 | 20 | $7,906 |
| Sewerage | 2 | $8,485 | $50,910 | 0 | $0 |
| Local Libraries | 1 | $3,310 | $39,720 | 2 | $1,008 |
| Solid Waste Management | 1 | $4,151 | $49,812 | 0 | $0 |
| Judicial and Legal | 0 | $0 | 1 | $1,000 | |
| Police - Other | 0 | $0 | 1 | $531 | |
| Totals for Government | 70 | $264,272 | $45,304 | 27 | $11,661 |
Munford government finances - Expenditure in 2021 (per resident):
- Construction - Regular Highways: $502,000 ($75.98)
Sewerage: $492,000 ($74.47)
Water Utilities: $111,000 ($16.80)
Gas Utilities: $89,000 ($13.47)
Parks and Recreation: $43,000 ($6.51)
- Current Operations - Gas Utilities: $2,858,000 ($432.57)
Police Protection: $1,473,000 ($222.95)
Local Fire Protection: $1,134,000 ($171.64)
Sewerage: $950,000 ($143.79)
Water Utilities: $870,000 ($131.68)
Parks and Recreation: $679,000 ($102.77)
Solid Waste Management: $422,000 ($63.87)
Regular Highways: $126,000 ($19.07)
Libraries: $104,000 ($15.74)
Financial Administration: $76,000 ($11.50)
Central Staff Services: $74,000 ($11.20)
Judicial and Legal Services: $27,000 ($4.09)
- Gas Utilities - Interest on Debt: $43,000 ($6.51)
- General - Interest on Debt: $40,000 ($6.05)
- Intergovernmental to Local - Other - Gas Utilities: $29,000 ($4.39)
- Other Capital Outlay - Gas Utilities: $320,000 ($48.43)
Police Protection: $101,000 ($15.29)
Sewerage: $92,000 ($13.92)
Local Fire Protection: $60,000 ($9.08)
Water Utilities: $30,000 ($4.54)
Financial Administration: $8,000 ($1.21)
Parks and Recreation: $8,000 ($1.21)
- Total Salaries and Wages: $3,404,000 ($515.21)
- Water Utilities - Interest on Debt: $62,000 ($9.38)
Munford government finances - Revenue in 2021 (per resident):
- Charges - Sewerage: $1,243,000 ($188.13)
Solid Waste Management: $387,000 ($58.57)
Parks and Recreation: $141,000 ($21.34)
Other: $52,000 ($7.87)
- Local Intergovernmental - Other: $158,000 ($23.91)
- Miscellaneous - General Revenue - Other: $629,000 ($95.20)
Interest Earnings: $143,000 ($21.64)
Fines and Forfeits: $143,000 ($21.64)
Rents: $131,000 ($19.83)
Donations From Private Sources: $1,000 ($0.15)
- Revenue - Gas Utilities: $3,274,000 ($495.54)
Water Utilities: $1,165,000 ($176.33)
- State Intergovernmental - General Local Government Support: $759,000 ($114.88)
Highways: $301,000 ($45.56)
- Tax - Property: $1,594,000 ($241.26)
General Sales and Gross Receipts: $990,000 ($149.84)
Public Utilities Sales: $209,000 ($31.63)
Alcoholic Beverage Sales: $160,000 ($24.22)
Occupation and Business License - Other: $45,000 ($6.81)
Alcoholic Beverage License: $2,000 ($0.30)
Munford government finances - Debt in 2021 (per resident):
- Long Term Debt - Beginning Outstanding - Unspecified Public Purpose: $5,270,000 ($797.64)
Outstanding Unspecified Public Purpose: $4,775,000 ($722.72)
Beginning Outstanding - Public Debt for Private Purpose: $3,052,000 ($461.93)
Outstanding Nonguaranteed - Industrial Revenue: $2,609,000 ($394.88)
Retired Unspecified Public Purpose: $495,000 ($74.92)
Retired Nonguaranteed - Public Debt for Private Purpose: $443,000 ($67.05)
Munford government finances - Cash and Securities in 2021 (per resident):
- Other Funds - Cash and Securities: $11,137,000 ($1685.64)
- Sinking Funds - Cash and Securities: $3,566,000 ($539.73)
| Businesses in Munford, TN | ||||
| Name | Count | Name | Count | |
|---|---|---|---|---|
| FedEx | 1 | UPS | 2 | |
| La-Z-Boy | 1 | Walgreens | 1 | |
| SAS Shoes | 1 | |||
Strongest AM radio stations in Munford:
- WDIA (1070 AM; 50 kW; MEMPHIS, TN; Owner: CLEAR CHANNEL BROADCASTING LICENSES, INC.)
- WMQM (1600 AM; 50 kW; LAKELAND, TN; Owner: WMQM, INC.)
- WGSF (1030 AM; 50 kW; MEMPHIS, TN; Owner: FLINN BROADCASTING CORPORATION)
- WCRV (640 AM; 50 kW; COLLIERVILLE, TN; Owner: BOTT BROADCASTING COMPANY/TENNESSEE)
- WJCE (680 AM; 10 kW; MEMPHIS, TN; Owner: ENTERCOM MEMPHIS LICENSE, LLC)
- KWAM (990 AM; 10 kW; MEMPHIS, TN; Owner: CONCORD MEDIA GROUP, INC.)
- WHBQ (560 AM; 5 kW; MEMPHIS, TN; Owner: FLINN BROADCASTING CORPORATION)
- WREC (600 AM; 5 kW; MEMPHIS, TN; Owner: CLEAR CHANNEL BROADCASTING LICENSES, INC.)
- WMC (790 AM; 5 kW; MEMPHIS, TN; Owner: INFINITY RADIO OPERATIONS INC.)
- WLRM (1380 AM; 2 kW; MILLINGTON, TN; Owner: WORLD OVERCOMERS OUTREACH MINISTRIES)
- WPLX (1170 AM; 10 kW; GERMANTOWN, TN; Owner: EDUCATIONAL MEDIA FOUNDATION)
- KLCN (910 AM; 5 kW; BLYTHEVILLE, AR; Owner: SUDBURY SERVICES, INC.)
- WCPC (940 AM; 50 kW; HOUSTON, MS; Owner: WCPC BROADCASTING CO., INC.)
Strongest FM radio stations in Munford:
- WEGR (102.7 FM; MEMPHIS, TN; Owner: CLEAR CHANNEL BROADCASTING LICENSES, INC.)
- WSRR-FM (98.1 FM; MILLINGTON, TN; Owner: KOOL BROADCASTING, INC.)
- WYPL (89.3 FM; MEMPHIS, TN; Owner: MEMPHIS/SHELBY COUNTY PUBLIC LIBRARY & INFO CNTR.)
- WGKX (105.9 FM; MEMPHIS, TN; Owner: KIX BROADCASTING, INC.)
- WRVR-FM (104.5 FM; MEMPHIS, TN; Owner: ENTERCOM MEMPHIS LICENSE, LLC)
- WMC-FM (99.7 FM; MEMPHIS, TN; Owner: INFINITY RADIO OPERATIONS INC.)
- WKNO-FM (91.1 FM; MEMPHIS, TN; Owner: MID-SOUTH PUBLIC COMMUNICATIONS FOUNDATION)
- WKBQ (93.5 FM; COVINGTON, TN; Owner: COVINGTON BROADCASTING, INC.)
- WHRK (97.1 FM; MEMPHIS, TN; Owner: CLEAR CHANNEL BROADCASTING LICENSES, INC.)
- WMFS (92.9 FM; BARTLETT, TN; Owner: INFINITY BROADCASTING CORP. OF ILLINOIS)
- WMPS (107.5 FM; GERMANTOWN, TN; Owner: FLINN BROADCASTING CORPORATION)
- WQOX (88.5 FM; MEMPHIS, TN; Owner: MEMPHIS CITY SCHOOLS)
- WUMR (91.7 FM; MEMPHIS, TN; Owner: THE UNIVERSITY OF MEMPHIS)
- KJMS (101.1 FM; MEMPHIS, TN; Owner: CLEAR CHANNEL BROADCASTING LICENSES, INC.)
- WEVL (89.9 FM; MEMPHIS, TN; Owner: SOUTHERN COMMUNICATION VOLUNTEERS, INC.)
- KXHT (107.1 FM; MARION, AR; Owner: FLINN BROADCASTING CORPORATION)
- KQDD (107.3 FM; OSCEOLA, AR; Owner: PHOENIX BROADCASTING GROUP, INC.)
- WHAL-FM (95.7 FM; OLIVE BRANCH, MS; Owner: CLEAR CHANNEL BROADCASTING LICENSES, INC.)
TV broadcast stations around Munford:
- WMC-TV (Channel 5; MEMPHIS, TN; Owner: RAYCOM AMERICA, INC.)
- WLMT (Channel 30; MEMPHIS, TN; Owner: CLEAR CHANNEL BROADCASTING LICENSES, INC.)
- WPTY-TV (Channel 24; MEMPHIS, TN; Owner: CLEAR CHANNEL BROADCASTING LICENSES, INC.)
- WREG-TV (Channel 3; MEMPHIS, TN; Owner: NEW YORK TIMES MANAGEMENT SERVICES)
- WPXX-TV (Channel 50; MEMPHIS, TN; Owner: FLINN BROADCASTING CORPORATION)
- WHBQ-TV (Channel 13; MEMPHIS, TN; Owner: FOX TELEVISION STATIONS, INC.)
- WKNO (Channel 10; MEMPHIS, TN; Owner: MID-SOUTH PUBLIC COMMUNICATIONS FOUNDATION)
- W57CG (Channel 57; MEMPHIS, TN; Owner: GEORGE S. FLINN, JR.)
- W67CV (Channel 67; MEMPHIS, TN; Owner: GEORGE S. FLINN, JR.)
- WJRJ-LP (Channel 59; MEMPHIS, TN; Owner: WORD OF GOD FELLOWSHIP, INC.)
- WBXP-CA (Channel 44; MEMPHIS, TN; Owner: THE BOX WORLDWIDE LLC)
- KVTJ (Channel 48; JONESBORO, AR; Owner: AGAPE CHURCH, INC.)
- W42BY (Channel 42; MEMPHIS, TN; Owner: THREE ANGELS BROADCASTING NETWORK, INC,)
- WBUY (Channel 40; HOLLY SPRINGS, MS; Owner: TRINITY BROADCASTING NETWORK)
- National Bridge Inventory (NBI) Statistics
- 9Number of bridges
- 43ft / 13.4mTotal length
- $892,000Total costs
- 76,192Total average daily traffic
- 6,655Total average daily truck traffic
- 172,368Total future (year 2040) average daily traffic
FCC Registered Antenna Towers:
18 (See the full list of FCC Registered Antenna Towers in Munford)FCC Registered Broadcast Land Mobile Towers:
5- City Hall (Lat: 35.448694 Lon: -89.816750), Call Sign: KNHS945, Licensee ID: L00081078,
Assigned Frequencies: 37.2600 MHz, Grant Date: 08/17/1998, Expiration Date: 10/25/2003, Cancellation Date: 03/19/2002, Registrant: City Of Munford, City Hall, Munford, TN 38058
- City Hall (Lat: 35.448694 Lon: -89.816750), Call Sign: KNHS959,
Assigned Frequencies: 460.375 MHz, Grant Date: 10/01/2013, Expiration Date: 11/14/2023, Cancellation Date: 01/20/2024, Registrant: City Of Munford, 1397 Munford Ave, Munford, TN 38058, Phone: (901) 837-5974, Fax: (901) 837-5976, Email:
- Lat: 35.431972 Lon: -89.871417, Call Sign: WQNK393,
Assigned Frequencies: 158.317 MHz, Grant Date: 05/12/2021, Expiration Date: 03/03/2031, Certifier: Mark E Walker, Registrant: Atlas License Company & Data Services, 176 West Logan Street, Ste. 227, Noblesville, IN 46060, Phone: (317) 813-4865, Fax: (317) 900-7940, Email:
- Lat: 35.431972 Lon: -89.871417, Call Sign: WQNK795,
Assigned Frequencies: 158.317 MHz, Grant Date: 05/12/2021, Expiration Date: 03/08/2031, Certifier: Mark E Walker, Registrant: Atlas License Company & Data Services, 176 West Logan Street, Ste. 227, Noblesville, IN 46060, Phone: (317) 813-4865, Fax: (317) 900-7940, Email:
- Lat: 35.431972 Lon: -89.871417, Call Sign: WQNK796,
Assigned Frequencies: 158.317 MHz, Grant Date: 05/12/2021, Expiration Date: 03/08/2031, Certifier: Mark Walker, Registrant: Atlas License Company & Data Services, 176 West Logan Street, Ste. 227, Noblesville, IN 46060, Phone: (317) 813-4865, Fax: (317) 900-7940, Email:
FCC Registered Microwave Towers:
1- STATION, Atoka Munford Rd At Crosstown Rd (Lat: 35.446167 Lon: -89.794222), Overall height: 24.4 m, Call Sign: WNTT386,
Assigned Frequencies: 953.950 MHz, Grant Date: 11/09/2018, Expiration Date: 11/09/2028, Registrant: Southwest Tennessee Electric Membership Corp., 1009 East Main Street, Brownsville, TN 38012, Phone: (731) 585-0538, Fax: (731) 772-1037, Email:
FCC Registered Paging Towers:
1- Crosstown And Munford Roads (Lat: 35.447833 Lon: -89.797278), Call Sign: KIY442, Licensee ID: L00121922,
Assigned Frequencies: 152.570 MHz, Grant Date: 08/24/1998, Expiration Date: 07/01/2008, Cancellation Date: 12/21/2004, Registrant: Millington Telephone Company, Inc., 4880 Navy Road P O Drawer 429, Millington, TN 38053, Phone: (901) 872-3311
FCC Registered Amateur Radio Licenses:
61 (See the full list of FCC Registered Amateur Radio Licenses in Munford)FAA Registered Aircraft Manufacturers and Dealers:
2- PLATO INC, 99 Doctors Dr Ste 700, Munford, TN 38058
Certificate: D002501 (Corporation), Certificate Issue Date: 09/22/2008, Expiration Date: 09/21/2009 - MPMS INC, 99 Doctors Dr Ste 700, Munford, TN 38058
Certificate: D004492 (Corporation), Certificate Issue Date: 02/14/2020, Expiration Date: 02/13/2021
FAA Registered Aircraft:
5- Aircraft: PIPER J3C-65 (Category: Land, Seats: 2, Weight: Up to 12,499 Pounds, Speed: 67 mph), Engine: CONT MOTOR A&C65 SERIES (65 HP) (Reciprocating)
N-Number: 35702, N35702, N-35702, Serial Number: 6543, Year manufactured: 1941, Airworthiness Date: 08/27/1955
Registrant (Corporation): Mpms Inc, 99 Doctors Dr Ste 700, Munford, TN 38058 - Aircraft: AERONCA 11CC (Category: Land, Seats: 2, Weight: Up to 12,499 Pounds, Speed: 75 mph), Engine: CONT MOTOR C85 SERIES (85 HP) (Reciprocating)
N-Number: 4166E, N4166E, N-4166E, Serial Number: 11CC-69, Year manufactured: 1947, Airworthiness Date: 08/22/1958
Registrant (Corporation): Mpms Inc, 99 Doctors Dr Ste 700, Munford, TN 38058 - Aircraft: CESSNA 182Q (Category: Land, Seats: 4, Weight: Up to 12,499 Pounds, Speed: 112 mph), Engine: CONT MOTOR O-470 SERIES (230 HP) (Reciprocating)
N-Number: 759JB, N759JB, N-759JB, Serial Number: 18266968, Year manufactured: 1979, Airworthiness Date: 05/03/1979
Registrant (Corporation): Mpms Inc, 99 Doctors Dr Ste 700, Munford, TN 38058 - Aircraft: MOCK MICHAEL H CHRISTEN EAGLE II (Category: Land, Seats: 2, Weight: Up to 12,499 Pounds), Engine: LYCOMING I0360 SER A&C (200 HP) (Reciprocating)
N-Number: 82RM, N82RM, N-82RM, Serial Number: CE001MHM, Year manufactured: 1998, Airworthiness Date: 02/13/1998
Registrant (Corporation): Mpms Inc, 99 Doctors Dr Ste 700, Munford, TN 38058 - Aircraft: PORTER STEPHEN L KITFOX SERIES 5 (Category: Land, Seats: 2, Weight: Up to 12,499 Pounds), Engine: CONT MOTOR 0-200 SERIES (100 HP) (Reciprocating)
N-Number: 834SP, N834SP, N-834SP, Serial Number: S95090143, Year manufactured: 1997, Airworthiness Date: 03/19/1997, Certificate Issue Date: 10/13/2020
Registrant (Individual): Steven Paul Oneal, 595 Charles Pl, Munford, TN 38058
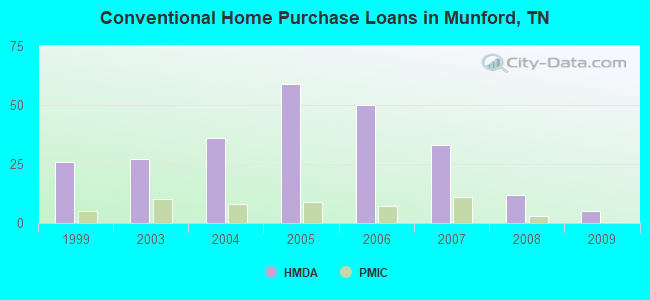
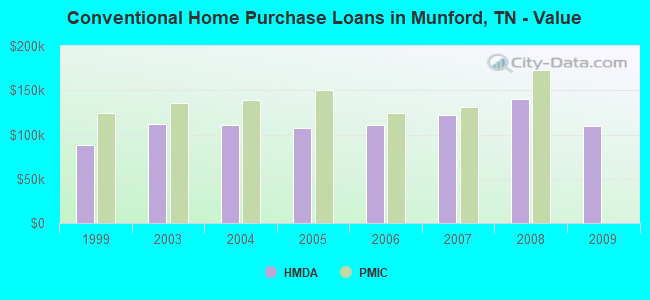
| Home Mortgage Disclosure Act Aggregated Statistics For Year 2009 (Based on 1 partial tract) | ||||||||||||
| A) FHA, FSA/RHS & VA Home Purchase Loans | B) Conventional Home Purchase Loans | C) Refinancings | D) Home Improvement Loans | F) Non-occupant Loans on < 5 Family Dwellings (A B C & D) | G) Loans On Manufactured Home Dwelling (A B C & D) | |||||||
|---|---|---|---|---|---|---|---|---|---|---|---|---|
| Number | Average Value | Number | Average Value | Number | Average Value | Number | Average Value | Number | Average Value | Number | Average Value | |
| LOANS ORIGINATED | 16 | $139,935 | 5 | $109,892 | 41 | $137,557 | 3 | $24,630 | 5 | $99,372 | 1 | $42,220 |
| APPLICATIONS APPROVED, NOT ACCEPTED | 1 | $58,970 | 0 | $0 | 3 | $127,340 | 0 | $0 | 0 | $0 | 0 | $0 |
| APPLICATIONS DENIED | 2 | $104,925 | 1 | $94,090 | 16 | $142,984 | 2 | $30,305 | 1 | $74,260 | 1 | $35,490 |
| APPLICATIONS WITHDRAWN | 2 | $154,790 | 1 | $153,970 | 12 | $143,098 | 1 | $13,830 | 1 | $64,430 | 0 | $0 |
| FILES CLOSED FOR INCOMPLETENESS | 0 | $0 | 0 | $0 | 3 | $137,833 | 0 | $0 | 0 | $0 | 0 | $0 |
Detailed HMDA statistics for the following Tracts: 0403.01
| Private Mortgage Insurance Companies Aggregated Statistics For Year 2009 (Based on 1 partial tract) | ||
| B) Refinancings | ||
|---|---|---|
| Number | Average Value | |
| LOANS ORIGINATED | 1 | $68,610 |
| APPLICATIONS APPROVED, NOT ACCEPTED | 2 | $113,475 |
| APPLICATIONS DENIED | 0 | $0 |
| APPLICATIONS WITHDRAWN | 0 | $0 |
| FILES CLOSED FOR INCOMPLETENESS | 0 | $0 |
Detailed PMIC statistics for the following Tracts: 0403.01
2002 - 2018 National Fire Incident Reporting System (NFIRS) incidents
- Fire incident types reported to NFIRS in Munford, TN
- 27744.5%Outside Fires
- 25040.2%Structure Fires
- 8714.0%Mobile Property/Vehicle Fires
- 81.3%Other
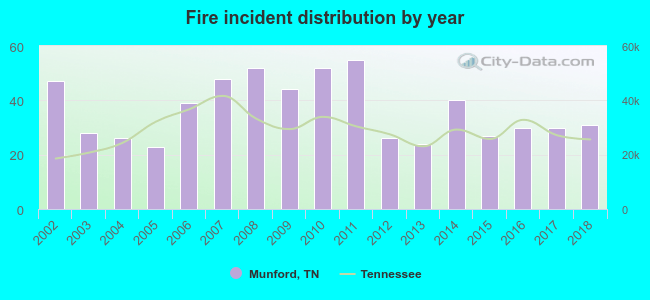 According to the data from the years 2002 - 2018 the average number of fires per year is 37. The highest number of reported fires - 55 took place in 2011, and the least - 23 in 2005. The data has a declining trend.
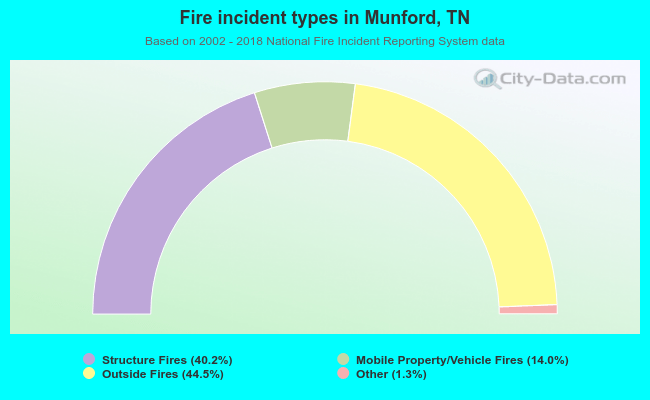 When looking into fire subcategories, the most incidents belonged to: Outside Fires (44.5%), and Structure Fires (40.2%).
| Most common first names in Munford, TN among deceased individuals | ||
| Name | Count | Lived (average) |
|---|---|---|
| James | 38 | 71.1 years |
| William | 31 | 71.1 years |
| John | 26 | 73.7 years |
| Mary | 21 | 74.7 years |
| Charles | 15 | 60.2 years |
| Robert | 12 | 70.2 years |
| Margaret | 11 | 72.6 years |
| George | 8 | 75.9 years |
| Ruth | 8 | 77.6 years |
| Edward | 7 | 65.3 years |
| Most common last names in Munford, TN among deceased individuals | ||
| Last name | Count | Lived (average) |
|---|---|---|
| Smith | 13 | 68.8 years |
| Jones | 13 | 71.8 years |
| Scott | 12 | 72.2 years |
| Wooten | 11 | 83.1 years |
| Ellis | 9 | 78.2 years |
| Gross | 9 | 76.4 years |
| Hanks | 9 | 74.3 years |
| Pinner | 8 | 75.5 years |
| Wilson | 8 | 71.1 years |
| Starnes | 8 | 72.9 years |
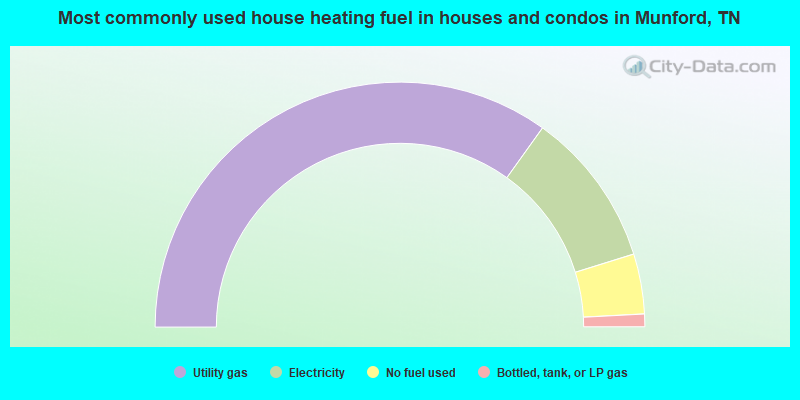
- 69.8%Utility gas
- 20.6%Electricity
- 7.9%No fuel used
- 1.7%Bottled, tank, or LP gas
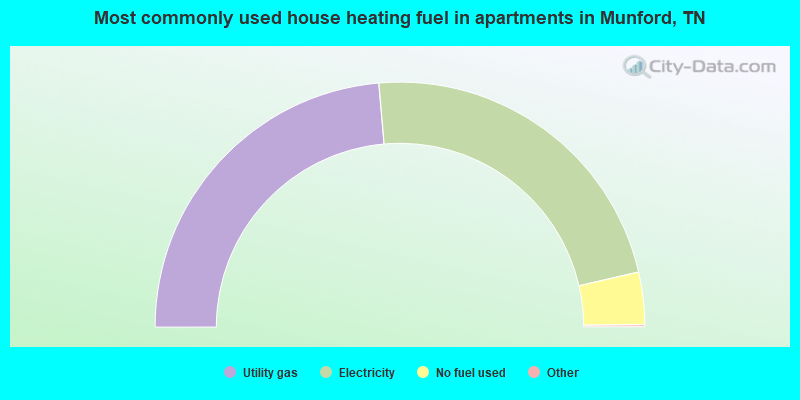
- 47.4%Utility gas
- 45.7%Electricity
- 6.9%No fuel used
Munford compared to Tennessee state average:
- Unemployed percentage significantly below state average.
- Foreign-born population percentage below state average.
- Length of stay since moving in significantly above state average.
- House age below state average.
Munford on our top lists:
- #18 on the list of "Top 101 cities with largest percentage of males in industries: retail trade (population 5,000+)"
- #33 on the list of "Top 101 cities with largest percentage of females in occupations: health technologists and technicians (population 5,000+)"

|
|
Total of 19 patent applications in 2008-2024.