North Augusta, South Carolina Submit your own pictures of this city and show them to the world
OSM Map
General Map
Google Map
MSN Map
OSM Map
General Map
Google Map
MSN Map
OSM Map
General Map
Google Map
MSN Map
OSM Map
General Map
Google Map
MSN Map
Please wait while loading the map...
Population in 2022: 25,258 (99% urban, 1% rural). Population change since 2000: +43.7%Males: 12,112 Females: 13,146
March 2022 cost of living index in North Augusta: 89.1 (less than average, U.S. average is 100) Percentage of residents living in poverty in 2022: 8.1%for White Non-Hispanic residents , 21.9% for Black residents , 7.8% for Hispanic or Latino residents , 11.2% for other race residents , 5.5% for two or more races residents )
Profiles of local businesses
Business Search - 14 Million verified businesses
Data:
Median household income ($)
Median household income (% change since 2000)
Household income diversity
Ratio of average income to average house value (%)
Ratio of average income to average rent
Median household income ($) - White
Median household income ($) - Black or African American
Median household income ($) - Asian
Median household income ($) - Hispanic or Latino
Median household income ($) - American Indian and Alaska Native
Median household income ($) - Multirace
Median household income ($) - Other Race
Median household income for houses/condos with a mortgage ($)
Median household income for apartments without a mortgage ($)
Races - White alone (%)
Races - White alone (% change since 2000)
Races - Black alone (%)
Races - Black alone (% change since 2000)
Races - American Indian alone (%)
Races - American Indian alone (% change since 2000)
Races - Asian alone (%)
Races - Asian alone (% change since 2000)
Races - Hispanic (%)
Races - Hispanic (% change since 2000)
Races - Native Hawaiian and Other Pacific Islander alone (%)
Races - Native Hawaiian and Other Pacific Islander alone (% change since 2000)
Races - Two or more races (%)
Races - Two or more races (% change since 2000)
Races - Other race alone (%)
Races - Other race alone (% change since 2000)
Racial diversity
Unemployment (%)
Unemployment (% change since 2000)
Unemployment (%) - White
Unemployment (%) - Black or African American
Unemployment (%) - Asian
Unemployment (%) - Hispanic or Latino
Unemployment (%) - American Indian and Alaska Native
Unemployment (%) - Multirace
Unemployment (%) - Other Race
Population density (people per square mile)
Population - Males (%)
Population - Females (%)
Population - Males (%) - White
Population - Males (%) - Black or African American
Population - Males (%) - Asian
Population - Males (%) - Hispanic or Latino
Population - Males (%) - American Indian and Alaska Native
Population - Males (%) - Multirace
Population - Males (%) - Other Race
Population - Females (%) - White
Population - Females (%) - Black or African American
Population - Females (%) - Asian
Population - Females (%) - Hispanic or Latino
Population - Females (%) - American Indian and Alaska Native
Population - Females (%) - Multirace
Population - Females (%) - Other Race
Coronavirus confirmed cases (Apr 27, 2024)
Deaths caused by coronavirus (Apr 27, 2024)
Coronavirus confirmed cases (per 100k population) (Apr 27, 2024)
Deaths caused by coronavirus (per 100k population) (Apr 27, 2024)
Daily increase in number of cases (Apr 27, 2024)
Weekly increase in number of cases (Apr 27, 2024)
Cases doubled (in days) (Apr 27, 2024)
Hospitalized patients (Apr 18, 2022)
Negative test results (Apr 18, 2022)
Total test results (Apr 18, 2022)
COVID Vaccine doses distributed (per 100k population) (Sep 19, 2023)
COVID Vaccine doses administered (per 100k population) (Sep 19, 2023)
COVID Vaccine doses distributed (Sep 19, 2023)
COVID Vaccine doses administered (Sep 19, 2023)
Likely homosexual households (%)
Likely homosexual households (% change since 2000)
Likely homosexual households - Lesbian couples (%)
Likely homosexual households - Lesbian couples (% change since 2000)
Likely homosexual households - Gay men (%)
Likely homosexual households - Gay men (% change since 2000)
Cost of living index
Median gross rent ($)
Median contract rent ($)
Median monthly housing costs ($)
Median house or condo value ($)
Median house or condo value ($ change since 2000)
Mean house or condo value by units in structure - 1, detached ($)
Mean house or condo value by units in structure - 1, attached ($)
Mean house or condo value by units in structure - 2 ($)
Mean house or condo value by units in structure by units in structure - 3 or 4 ($)
Mean house or condo value by units in structure - 5 or more ($)
Mean house or condo value by units in structure - Boat, RV, van, etc. ($)
Mean house or condo value by units in structure - Mobile home ($)
Median house or condo value ($) - White
Median house or condo value ($) - Black or African American
Median house or condo value ($) - Asian
Median house or condo value ($) - Hispanic or Latino
Median house or condo value ($) - American Indian and Alaska Native
Median house or condo value ($) - Multirace
Median house or condo value ($) - Other Race
Median resident age
Resident age diversity
Median resident age - Males
Median resident age - Females
Median resident age - White
Median resident age - Black or African American
Median resident age - Asian
Median resident age - Hispanic or Latino
Median resident age - American Indian and Alaska Native
Median resident age - Multirace
Median resident age - Other Race
Median resident age - Males - White
Median resident age - Males - Black or African American
Median resident age - Males - Asian
Median resident age - Males - Hispanic or Latino
Median resident age - Males - American Indian and Alaska Native
Median resident age - Males - Multirace
Median resident age - Males - Other Race
Median resident age - Females - White
Median resident age - Females - Black or African American
Median resident age - Females - Asian
Median resident age - Females - Hispanic or Latino
Median resident age - Females - American Indian and Alaska Native
Median resident age - Females - Multirace
Median resident age - Females - Other Race
Commute - mean travel time to work (minutes)
Travel time to work - Less than 5 minutes (%)
Travel time to work - Less than 5 minutes (% change since 2000)
Travel time to work - 5 to 9 minutes (%)
Travel time to work - 5 to 9 minutes (% change since 2000)
Travel time to work - 10 to 19 minutes (%)
Travel time to work - 10 to 19 minutes (% change since 2000)
Travel time to work - 20 to 29 minutes (%)
Travel time to work - 20 to 29 minutes (% change since 2000)
Travel time to work - 30 to 39 minutes (%)
Travel time to work - 30 to 39 minutes (% change since 2000)
Travel time to work - 40 to 59 minutes (%)
Travel time to work - 40 to 59 minutes (% change since 2000)
Travel time to work - 60 to 89 minutes (%)
Travel time to work - 60 to 89 minutes (% change since 2000)
Travel time to work - 90 or more minutes (%)
Travel time to work - 90 or more minutes (% change since 2000)
Marital status - Never married (%)
Marital status - Now married (%)
Marital status - Separated (%)
Marital status - Widowed (%)
Marital status - Divorced (%)
Median family income ($)
Median family income (% change since 2000)
Median non-family income ($)
Median non-family income (% change since 2000)
Median per capita income ($)
Median per capita income (% change since 2000)
Median family income ($) - White
Median family income ($) - Black or African American
Median family income ($) - Asian
Median family income ($) - Hispanic or Latino
Median family income ($) - American Indian and Alaska Native
Median family income ($) - Multirace
Median family income ($) - Other Race
Median year house/condo built
Median year apartment built
Year house built - Built 2005 or later (%)
Year house built - Built 2000 to 2004 (%)
Year house built - Built 1990 to 1999 (%)
Year house built - Built 1980 to 1989 (%)
Year house built - Built 1970 to 1979 (%)
Year house built - Built 1960 to 1969 (%)
Year house built - Built 1950 to 1959 (%)
Year house built - Built 1940 to 1949 (%)
Year house built - Built 1939 or earlier (%)
Average household size
Household density (households per square mile)
Average household size - White
Average household size - Black or African American
Average household size - Asian
Average household size - Hispanic or Latino
Average household size - American Indian and Alaska Native
Average household size - Multirace
Average household size - Other Race
Occupied housing units (%)
Vacant housing units (%)
Owner occupied housing units (%)
Renter occupied housing units (%)
Vacancy status - For rent (%)
Vacancy status - For sale only (%)
Vacancy status - Rented or sold, not occupied (%)
Vacancy status - For seasonal, recreational, or occasional use (%)
Vacancy status - For migrant workers (%)
Vacancy status - Other vacant (%)
Residents with income below the poverty level (%)
Residents with income below 50% of the poverty level (%)
Children below poverty level (%)
Poor families by family type - Married-couple family (%)
Poor families by family type - Male, no wife present (%)
Poor families by family type - Female, no husband present (%)
Poverty status for native-born residents (%)
Poverty status for foreign-born residents (%)
Poverty among high school graduates not in families (%)
Poverty among people who did not graduate high school not in families (%)
Residents with income below the poverty level (%) - White
Residents with income below the poverty level (%) - Black or African American
Residents with income below the poverty level (%) - Asian
Residents with income below the poverty level (%) - Hispanic or Latino
Residents with income below the poverty level (%) - American Indian and Alaska Native
Residents with income below the poverty level (%) - Multirace
Residents with income below the poverty level (%) - Other Race
Air pollution - Air Quality Index (AQI)
Air pollution - CO
Air pollution - NO2
Air pollution - SO2
Air pollution - Ozone
Air pollution - PM10
Air pollution - PM25
Air pollution - Pb
Crime - Murders per 100,000 population
Crime - Rapes per 100,000 population
Crime - Robberies per 100,000 population
Crime - Assaults per 100,000 population
Crime - Burglaries per 100,000 population
Crime - Thefts per 100,000 population
Crime - Auto thefts per 100,000 population
Crime - Arson per 100,000 population
Crime - City-data.com crime index
Crime - Violent crime index
Crime - Property crime index
Crime - Murders per 100,000 population (5 year average)
Crime - Rapes per 100,000 population (5 year average)
Crime - Robberies per 100,000 population (5 year average)
Crime - Assaults per 100,000 population (5 year average)
Crime - Burglaries per 100,000 population (5 year average)
Crime - Thefts per 100,000 population (5 year average)
Crime - Auto thefts per 100,000 population (5 year average)
Crime - Arson per 100,000 population (5 year average)
Crime - City-data.com crime index (5 year average)
Crime - Violent crime index (5 year average)
Crime - Property crime index (5 year average)
1996 Presidential Elections Results (%) - Democratic Party (Clinton)
1996 Presidential Elections Results (%) - Republican Party (Dole)
1996 Presidential Elections Results (%) - Other
2000 Presidential Elections Results (%) - Democratic Party (Gore)
2000 Presidential Elections Results (%) - Republican Party (Bush)
2000 Presidential Elections Results (%) - Other
2004 Presidential Elections Results (%) - Democratic Party (Kerry)
2004 Presidential Elections Results (%) - Republican Party (Bush)
2004 Presidential Elections Results (%) - Other
2008 Presidential Elections Results (%) - Democratic Party (Obama)
2008 Presidential Elections Results (%) - Republican Party (McCain)
2008 Presidential Elections Results (%) - Other
2012 Presidential Elections Results (%) - Democratic Party (Obama)
2012 Presidential Elections Results (%) - Republican Party (Romney)
2012 Presidential Elections Results (%) - Other
2016 Presidential Elections Results (%) - Democratic Party (Clinton)
2016 Presidential Elections Results (%) - Republican Party (Trump)
2016 Presidential Elections Results (%) - Other
2020 Presidential Elections Results (%) - Democratic Party (Biden)
2020 Presidential Elections Results (%) - Republican Party (Trump)
2020 Presidential Elections Results (%) - Other
Ancestries Reported - Arab (%)
Ancestries Reported - Czech (%)
Ancestries Reported - Danish (%)
Ancestries Reported - Dutch (%)
Ancestries Reported - English (%)
Ancestries Reported - French (%)
Ancestries Reported - French Canadian (%)
Ancestries Reported - German (%)
Ancestries Reported - Greek (%)
Ancestries Reported - Hungarian (%)
Ancestries Reported - Irish (%)
Ancestries Reported - Italian (%)
Ancestries Reported - Lithuanian (%)
Ancestries Reported - Norwegian (%)
Ancestries Reported - Polish (%)
Ancestries Reported - Portuguese (%)
Ancestries Reported - Russian (%)
Ancestries Reported - Scotch-Irish (%)
Ancestries Reported - Scottish (%)
Ancestries Reported - Slovak (%)
Ancestries Reported - Subsaharan African (%)
Ancestries Reported - Swedish (%)
Ancestries Reported - Swiss (%)
Ancestries Reported - Ukrainian (%)
Ancestries Reported - United States (%)
Ancestries Reported - Welsh (%)
Ancestries Reported - West Indian (%)
Ancestries Reported - Other (%)
Educational Attainment - No schooling completed (%)
Educational Attainment - Less than high school (%)
Educational Attainment - High school or equivalent (%)
Educational Attainment - Less than 1 year of college (%)
Educational Attainment - 1 or more years of college (%)
Educational Attainment - Associate degree (%)
Educational Attainment - Bachelor's degree (%)
Educational Attainment - Master's degree (%)
Educational Attainment - Professional school degree (%)
Educational Attainment - Doctorate degree (%)
School Enrollment - Nursery, preschool (%)
School Enrollment - Kindergarten (%)
School Enrollment - Grade 1 to 4 (%)
School Enrollment - Grade 5 to 8 (%)
School Enrollment - Grade 9 to 12 (%)
School Enrollment - College undergrad (%)
School Enrollment - Graduate or professional (%)
School Enrollment - Not enrolled in school (%)
School enrollment - Public schools (%)
School enrollment - Private schools (%)
School enrollment - Not enrolled (%)
Median number of rooms in houses and condos
Median number of rooms in apartments
Housing units lacking complete plumbing facilities (%)
Housing units lacking complete kitchen facilities (%)
Density of houses
Urban houses (%)
Rural houses (%)
Households with people 60 years and over (%)
Households with people 65 years and over (%)
Households with people 75 years and over (%)
Households with one or more nonrelatives (%)
Households with no nonrelatives (%)
Population in households (%)
Family households (%)
Nonfamily households (%)
Population in families (%)
Family households with own children (%)
Median number of bedrooms in owner occupied houses
Mean number of bedrooms in owner occupied houses
Median number of bedrooms in renter occupied houses
Mean number of bedrooms in renter occupied houses
Median number of vehichles in owner occupied houses
Mean number of vehichles in owner occupied houses
Median number of vehichles in renter occupied houses
Mean number of vehichles in renter occupied houses
Mortgage status - with mortgage (%)
Mortgage status - with second mortgage (%)
Mortgage status - with home equity loan (%)
Mortgage status - with both second mortgage and home equity loan (%)
Mortgage status - without a mortgage (%)
Average family size
Average family size - White
Average family size - Black or African American
Average family size - Asian
Average family size - Hispanic or Latino
Average family size - American Indian and Alaska Native
Average family size - Multirace
Average family size - Other Race
Geographical mobility - Same house 1 year ago (%)
Geographical mobility - Moved within same county (%)
Geographical mobility - Moved from different county within same state (%)
Geographical mobility - Moved from different state (%)
Geographical mobility - Moved from abroad (%)
Place of birth - Born in state of residence (%)
Place of birth - Born in other state (%)
Place of birth - Native, outside of US (%)
Place of birth - Foreign born (%)
Housing units in structures - 1, detached (%)
Housing units in structures - 1, attached (%)
Housing units in structures - 2 (%)
Housing units in structures - 3 or 4 (%)
Housing units in structures - 5 to 9 (%)
Housing units in structures - 10 to 19 (%)
Housing units in structures - 20 to 49 (%)
Housing units in structures - 50 or more (%)
Housing units in structures - Mobile home (%)
Housing units in structures - Boat, RV, van, etc. (%)
House/condo owner moved in on average (years ago)
Renter moved in on average (years ago)
Year householder moved into unit - Moved in 1999 to March 2000 (%)
Year householder moved into unit - Moved in 1995 to 1998 (%)
Year householder moved into unit - Moved in 1990 to 1994 (%)
Year householder moved into unit - Moved in 1980 to 1989 (%)
Year householder moved into unit - Moved in 1970 to 1979 (%)
Year householder moved into unit - Moved in 1969 or earlier (%)
Means of transportation to work - Drove car alone (%)
Means of transportation to work - Carpooled (%)
Means of transportation to work - Public transportation (%)
Means of transportation to work - Bus or trolley bus (%)
Means of transportation to work - Streetcar or trolley car (%)
Means of transportation to work - Subway or elevated (%)
Means of transportation to work - Railroad (%)
Means of transportation to work - Ferryboat (%)
Means of transportation to work - Taxicab (%)
Means of transportation to work - Motorcycle (%)
Means of transportation to work - Bicycle (%)
Means of transportation to work - Walked (%)
Means of transportation to work - Other means (%)
Working at home (%)
Industry diversity
Most Common Industries - Agriculture, forestry, fishing and hunting, and mining (%)
Most Common Industries - Agriculture, forestry, fishing and hunting (%)
Most Common Industries - Mining, quarrying, and oil and gas extraction (%)
Most Common Industries - Construction (%)
Most Common Industries - Manufacturing (%)
Most Common Industries - Wholesale trade (%)
Most Common Industries - Retail trade (%)
Most Common Industries - Transportation and warehousing, and utilities (%)
Most Common Industries - Transportation and warehousing (%)
Most Common Industries - Utilities (%)
Most Common Industries - Information (%)
Most Common Industries - Finance and insurance, and real estate and rental and leasing (%)
Most Common Industries - Finance and insurance (%)
Most Common Industries - Real estate and rental and leasing (%)
Most Common Industries - Professional, scientific, and management, and administrative and waste management services (%)
Most Common Industries - Professional, scientific, and technical services (%)
Most Common Industries - Management of companies and enterprises (%)
Most Common Industries - Administrative and support and waste management services (%)
Most Common Industries - Educational services, and health care and social assistance (%)
Most Common Industries - Educational services (%)
Most Common Industries - Health care and social assistance (%)
Most Common Industries - Arts, entertainment, and recreation, and accommodation and food services (%)
Most Common Industries - Arts, entertainment, and recreation (%)
Most Common Industries - Accommodation and food services (%)
Most Common Industries - Other services, except public administration (%)
Most Common Industries - Public administration (%)
Occupation diversity
Most Common Occupations - Management, business, science, and arts occupations (%)
Most Common Occupations - Management, business, and financial occupations (%)
Most Common Occupations - Management occupations (%)
Most Common Occupations - Business and financial operations occupations (%)
Most Common Occupations - Computer, engineering, and science occupations (%)
Most Common Occupations - Computer and mathematical occupations (%)
Most Common Occupations - Architecture and engineering occupations (%)
Most Common Occupations - Life, physical, and social science occupations (%)
Most Common Occupations - Education, legal, community service, arts, and media occupations (%)
Most Common Occupations - Community and social service occupations (%)
Most Common Occupations - Legal occupations (%)
Most Common Occupations - Education, training, and library occupations (%)
Most Common Occupations - Arts, design, entertainment, sports, and media occupations (%)
Most Common Occupations - Healthcare practitioners and technical occupations (%)
Most Common Occupations - Health diagnosing and treating practitioners and other technical occupations (%)
Most Common Occupations - Health technologists and technicians (%)
Most Common Occupations - Service occupations (%)
Most Common Occupations - Healthcare support occupations (%)
Most Common Occupations - Protective service occupations (%)
Most Common Occupations - Fire fighting and prevention, and other protective service workers including supervisors (%)
Most Common Occupations - Law enforcement workers including supervisors (%)
Most Common Occupations - Food preparation and serving related occupations (%)
Most Common Occupations - Building and grounds cleaning and maintenance occupations (%)
Most Common Occupations - Personal care and service occupations (%)
Most Common Occupations - Sales and office occupations (%)
Most Common Occupations - Sales and related occupations (%)
Most Common Occupations - Office and administrative support occupations (%)
Most Common Occupations - Natural resources, construction, and maintenance occupations (%)
Most Common Occupations - Farming, fishing, and forestry occupations (%)
Most Common Occupations - Construction and extraction occupations (%)
Most Common Occupations - Installation, maintenance, and repair occupations (%)
Most Common Occupations - Production, transportation, and material moving occupations (%)
Most Common Occupations - Production occupations (%)
Most Common Occupations - Transportation occupations (%)
Most Common Occupations - Material moving occupations (%)
People in Group quarters - Institutionalized population (%)
People in Group quarters - Correctional institutions (%)
People in Group quarters - Federal prisons and detention centers (%)
People in Group quarters - Halfway houses (%)
People in Group quarters - Local jails and other confinement facilities (including police lockups) (%)
People in Group quarters - Military disciplinary barracks (%)
People in Group quarters - State prisons (%)
People in Group quarters - Other types of correctional institutions (%)
People in Group quarters - Nursing homes (%)
People in Group quarters - Hospitals/wards, hospices, and schools for the handicapped (%)
People in Group quarters - Hospitals/wards and hospices for chronically ill (%)
People in Group quarters - Hospices or homes for chronically ill (%)
People in Group quarters - Military hospitals or wards for chronically ill (%)
People in Group quarters - Other hospitals or wards for chronically ill (%)
People in Group quarters - Hospitals or wards for drug/alcohol abuse (%)
People in Group quarters - Mental (Psychiatric) hospitals or wards (%)
People in Group quarters - Schools, hospitals, or wards for the mentally retarded (%)
People in Group quarters - Schools, hospitals, or wards for the physically handicapped (%)
People in Group quarters - Institutions for the deaf (%)
People in Group quarters - Institutions for the blind (%)
People in Group quarters - Orthopedic wards and institutions for the physically handicapped (%)
People in Group quarters - Wards in general hospitals for patients who have no usual home elsewhere (%)
People in Group quarters - Wards in military hospitals for patients who have no usual home elsewhere (%)
People in Group quarters - Juvenile institutions (%)
People in Group quarters - Long-term care (%)
People in Group quarters - Homes for abused, dependent, and neglected children (%)
People in Group quarters - Residential treatment centers for emotionally disturbed children (%)
People in Group quarters - Training schools for juvenile delinquents (%)
People in Group quarters - Short-term care, detention or diagnostic centers for delinquent children (%)
People in Group quarters - Type of juvenile institution unknown (%)
People in Group quarters - Noninstitutionalized population (%)
People in Group quarters - College dormitories (includes college quarters off campus) (%)
People in Group quarters - Military quarters (%)
People in Group quarters - On base (%)
People in Group quarters - Barracks, unaccompanied personnel housing (UPH), (Enlisted/Officer), ;and similar group living quarters for military personnel (%)
People in Group quarters - Transient quarters for temporary residents (%)
People in Group quarters - Military ships (%)
People in Group quarters - Group homes (%)
People in Group quarters - Homes or halfway houses for drug/alcohol abuse (%)
People in Group quarters - Homes for the mentally ill (%)
People in Group quarters - Homes for the mentally retarded (%)
People in Group quarters - Homes for the physically handicapped (%)
People in Group quarters - Other group homes (%)
People in Group quarters - Religious group quarters (%)
People in Group quarters - Dormitories (%)
People in Group quarters - Agriculture workers' dormitories on farms (%)
People in Group quarters - Job Corps and vocational training facilities (%)
People in Group quarters - Other workers' dormitories (%)
People in Group quarters - Crews of maritime vessels (%)
People in Group quarters - Other nonhousehold living situations (%)
People in Group quarters - Other noninstitutional group quarters (%)
Residents speaking English at home (%)
Residents speaking English at home - Born in the United States (%)
Residents speaking English at home - Native, born elsewhere (%)
Residents speaking English at home - Foreign born (%)
Residents speaking Spanish at home (%)
Residents speaking Spanish at home - Born in the United States (%)
Residents speaking Spanish at home - Native, born elsewhere (%)
Residents speaking Spanish at home - Foreign born (%)
Residents speaking other language at home (%)
Residents speaking other language at home - Born in the United States (%)
Residents speaking other language at home - Native, born elsewhere (%)
Residents speaking other language at home - Foreign born (%)
Class of Workers - Employee of private company (%)
Class of Workers - Self-employed in own incorporated business (%)
Class of Workers - Private not-for-profit wage and salary workers (%)
Class of Workers - Local government workers (%)
Class of Workers - State government workers (%)
Class of Workers - Federal government workers (%)
Class of Workers - Self-employed workers in own not incorporated business and Unpaid family workers (%)
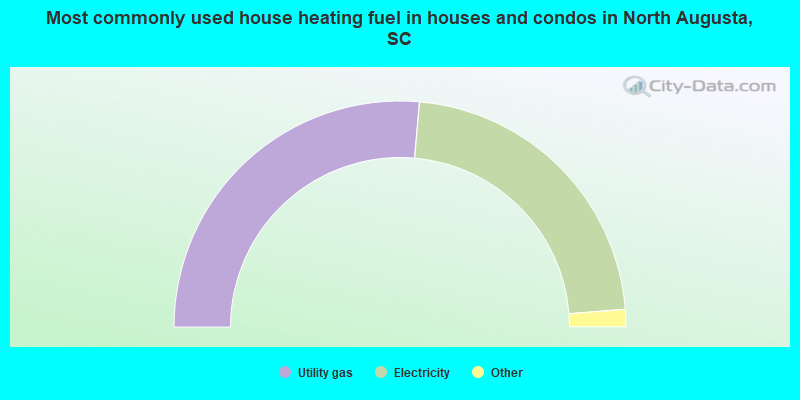
House heating fuel used in houses and condos - Utility gas (%)
House heating fuel used in houses and condos - Bottled, tank, or LP gas (%)
House heating fuel used in houses and condos - Electricity (%)
House heating fuel used in houses and condos - Fuel oil, kerosene, etc. (%)
House heating fuel used in houses and condos - Coal or coke (%)
House heating fuel used in houses and condos - Wood (%)
House heating fuel used in houses and condos - Solar energy (%)
House heating fuel used in houses and condos - Other fuel (%)
House heating fuel used in houses and condos - No fuel used (%)
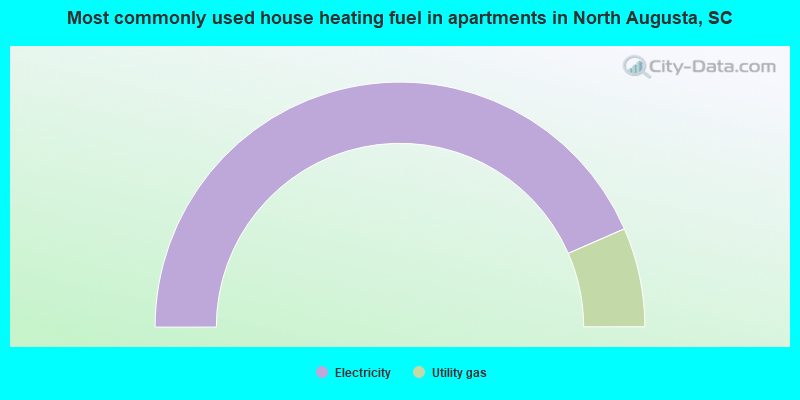
House heating fuel used in apartments - Utility gas (%)
House heating fuel used in apartments - Bottled, tank, or LP gas (%)
House heating fuel used in apartments - Electricity (%)
House heating fuel used in apartments - Fuel oil, kerosene, etc. (%)
House heating fuel used in apartments - Coal or coke (%)
House heating fuel used in apartments - Wood (%)
House heating fuel used in apartments - Solar energy (%)
House heating fuel used in apartments - Other fuel (%)
House heating fuel used in apartments - No fuel used (%)
Armed forces status - In Armed Forces (%)
Armed forces status - Civilian (%)
Armed forces status - Civilian - Veteran (%)
Armed forces status - Civilian - Nonveteran (%)
Fatal accidents locations in years 2005-2021
Fatal accidents locations in 2005
Fatal accidents locations in 2006
Fatal accidents locations in 2007
Fatal accidents locations in 2008
Fatal accidents locations in 2009
Fatal accidents locations in 2010
Fatal accidents locations in 2011
Fatal accidents locations in 2012
Fatal accidents locations in 2013
Fatal accidents locations in 2014
Fatal accidents locations in 2015
Fatal accidents locations in 2016
Fatal accidents locations in 2017
Fatal accidents locations in 2018
Fatal accidents locations in 2019
Fatal accidents locations in 2020
Fatal accidents locations in 2021
Alcohol use - People drinking some alcohol every month (%)
Alcohol use - People not drinking at all (%)
Alcohol use - Average days/month drinking alcohol
Alcohol use - Average drinks/week
Alcohol use - Average days/year people drink much
Audiometry - Average condition of hearing (%)
Audiometry - People that can hear a whisper from across a quiet room (%)
Audiometry - People that can hear normal voice from across a quiet room (%)
Audiometry - Ears ringing, roaring, buzzing (%)
Audiometry - Had a job exposure to loud noise (%)
Audiometry - Had off-work exposure to loud noise (%)
Blood Pressure & Cholesterol - Has high blood pressure (%)
Blood Pressure & Cholesterol - Checking blood pressure at home (%)
Blood Pressure & Cholesterol - Frequently checking blood cholesterol (%)
Blood Pressure & Cholesterol - Has high cholesterol level (%)
Consumer Behavior - Money monthly spent on food at supermarket/grocery store
Consumer Behavior - Money monthly spent on food at other stores
Consumer Behavior - Money monthly spent on eating out
Consumer Behavior - Money monthly spent on carryout/delivered foods
Consumer Behavior - Income spent on food at supermarket/grocery store (%)
Consumer Behavior - Income spent on food at other stores (%)
Consumer Behavior - Income spent on eating out (%)
Consumer Behavior - Income spent on carryout/delivered foods (%)
Current Health Status - General health condition (%)
Current Health Status - Blood donors (%)
Current Health Status - Has blood ever tested for HIV virus (%)
Current Health Status - Left-handed people (%)
Dermatology - People using sunscreen (%)
Diabetes - Diabetics (%)
Diabetes - Had a blood test for high blood sugar (%)
Diabetes - People taking insulin (%)
Diet Behavior & Nutrition - Diet health (%)
Diet Behavior & Nutrition - Milk product consumption (# of products/month)
Diet Behavior & Nutrition - Meals not home prepared (#/week)
Diet Behavior & Nutrition - Meals from fast food or pizza place (#/week)
Diet Behavior & Nutrition - Ready-to-eat foods (#/month)
Diet Behavior & Nutrition - Frozen meals/pizza (#/month)
Drug Use - People that ever used marijuana or hashish (%)
Drug Use - Ever used hard drugs (%)
Drug Use - Ever used any form of cocaine (%)
Drug Use - Ever used heroin (%)
Drug Use - Ever used methamphetamine (%)
Health Insurance - People covered by health insurance (%)
Kidney Conditions-Urology - Avg. # of times urinating at night
Medical Conditions - People with asthma (%)
Medical Conditions - People with anemia (%)
Medical Conditions - People with psoriasis (%)
Medical Conditions - People with overweight (%)
Medical Conditions - Elderly people having difficulties in thinking or remembering (%)
Medical Conditions - People who ever received blood transfusion (%)
Medical Conditions - People having trouble seeing even with glass/contacts (%)
Medical Conditions - People with arthritis (%)
Medical Conditions - People with gout (%)
Medical Conditions - People with congestive heart failure (%)
Medical Conditions - People with coronary heart disease (%)
Medical Conditions - People with angina pectoris (%)
Medical Conditions - People who ever had heart attack (%)
Medical Conditions - People who ever had stroke (%)
Medical Conditions - People with emphysema (%)
Medical Conditions - People with thyroid problem (%)
Medical Conditions - People with chronic bronchitis (%)
Medical Conditions - People with any liver condition (%)
Medical Conditions - People who ever had cancer or malignancy (%)
Mental Health - People who have little interest in doing things (%)
Mental Health - People feeling down, depressed, or hopeless (%)
Mental Health - People who have trouble sleeping or sleeping too much (%)
Mental Health - People feeling tired or having little energy (%)
Mental Health - People with poor appetite or overeating (%)
Mental Health - People feeling bad about themself (%)
Mental Health - People who have trouble concentrating on things (%)
Mental Health - People moving or speaking slowly or too fast (%)
Mental Health - People having thoughts they would be better off dead (%)
Oral Health - Average years since last visit a dentist
Oral Health - People embarrassed because of mouth (%)
Oral Health - People with gum disease (%)
Oral Health - General health of teeth and gums (%)
Oral Health - Average days a week using dental floss/device
Oral Health - Average days a week using mouthwash for dental problem
Oral Health - Average number of teeth
Pesticide Use - Households using pesticides to control insects (%)
Pesticide Use - Households using pesticides to kill weeds (%)
Physical Activity - People doing vigorous-intensity work activities (%)
Physical Activity - People doing moderate-intensity work activities (%)
Physical Activity - People walking or bicycling (%)
Physical Activity - People doing vigorous-intensity recreational activities (%)
Physical Activity - People doing moderate-intensity recreational activities (%)
Physical Activity - Average hours a day doing sedentary activities
Physical Activity - Average hours a day watching TV or videos
Physical Activity - Average hours a day using computer
Physical Functioning - People having limitations keeping them from working (%)
Physical Functioning - People limited in amount of work they can do (%)
Physical Functioning - People that need special equipment to walk (%)
Physical Functioning - People experiencing confusion/memory problems (%)
Physical Functioning - People requiring special healthcare equipment (%)
Prescription Medications - Average number of prescription medicines taking
Preventive Aspirin Use - Adults 40+ taking low-dose aspirin (%)
Reproductive Health - Vaginal deliveries (%)
Reproductive Health - Cesarean deliveries (%)
Reproductive Health - Deliveries resulted in a live birth (%)
Reproductive Health - Pregnancies resulted in a delivery (%)
Reproductive Health - Women breastfeeding newborns (%)
Reproductive Health - Women that had a hysterectomy (%)
Reproductive Health - Women that had both ovaries removed (%)
Reproductive Health - Women that have ever taken birth control pills (%)
Reproductive Health - Women taking birth control pills (%)
Reproductive Health - Women that have ever used Depo-Provera or injectables (%)
Reproductive Health - Women that have ever used female hormones (%)
Sexual Behavior - People 18+ that ever had sex (vaginal, anal, or oral) (%)
Sexual Behavior - Males 18+ that ever had vaginal sex with a woman (%)
Sexual Behavior - Males 18+ that ever performed oral sex on a woman (%)
Sexual Behavior - Males 18+ that ever had anal sex with a woman (%)
Sexual Behavior - Males 18+ that ever had any sex with a man (%)
Sexual Behavior - Females 18+ that ever had vaginal sex with a man (%)
Sexual Behavior - Females 18+ that ever performed oral sex on a man (%)
Sexual Behavior - Females 18+ that ever had anal sex with a man (%)
Sexual Behavior - Females 18+ that ever had any kind of sex with a woman (%)
Sexual Behavior - Average age people first had sex
Sexual Behavior - Average number of female sex partners in lifetime (males 18+)
Sexual Behavior - Average number of female vaginal sex partners in lifetime (males 18+)
Sexual Behavior - Average age people first performed oral sex on a woman (18+)
Sexual Behavior - Average number of woman performed oral sex on in lifetime (18+)
Sexual Behavior - Average number of male sex partners in lifetime (males 18+)
Sexual Behavior - Average number of male anal sex partners in lifetime (males 18+)
Sexual Behavior - Average age people first performed oral sex on a man (18+)
Sexual Behavior - Average number of male oral sex partners in lifetime (18+)
Sexual Behavior - People using protection when performing oral sex (%)
Sexual Behavior - Average number of times people have vaginal or anal sex a year
Sexual Behavior - People having sex without condom (%)
Sexual Behavior - Average number of male sex partners in lifetime (females 18+)
Sexual Behavior - Average number of male vaginal sex partners in lifetime (females 18+)
Sexual Behavior - Average number of female sex partners in lifetime (females 18+)
Sexual Behavior - Circumcised males 18+ (%)
Sleep Disorders - Average hours sleeping at night
Sleep Disorders - People that has trouble sleeping (%)
Smoking-Cigarette Use - People smoking cigarettes (%)
Taste & Smell - People 40+ having problems with smell (%)
Taste & Smell - People 40+ having problems with taste (%)
Taste & Smell - People 40+ that ever had wisdom teeth removed (%)
Taste & Smell - People 40+ that ever had tonsils teeth removed (%)
Taste & Smell - People 40+ that ever had a loss of consciousness because of a head injury (%)
Taste & Smell - People 40+ that ever had a broken nose or other serious injury to face or skull (%)
Taste & Smell - People 40+ that ever had two or more sinus infections (%)
Weight - Average height (inches)
Weight - Average weight (pounds)
Weight - Average BMI
Weight - People that are obese (%)
Weight - People that ever were obese (%)
Weight - People trying to lose weight (%)
Officers per 1,000 residents here:
2.66South Carolina average:
2.21
Latest news from North Augusta, SC collected exclusively by city-data.com from local newspapers, TV, and radio stations
Ancestries: American (22.7%), English (15.7%), German (6.0%), Irish (4.7%), European (3.8%), Italian (2.3%).
Current Local Time:
Incorporated on 03/13/1906
Land area: 17.2 square miles.
Population density: 1,468 people per square mile (low).
769 residents are foreign born (1.9% Latin America , 1.1% Asia ).
This city:
3.1%South Carolina:
5.3%
Median real estate property taxes paid for housing units with mortgages in 2022: $1,279 (0.5%)Median real estate property taxes paid for housing units with no mortgage in 2022: $972 (0.4%)
Nearest city with pop. 50,000+: Augusta, GA
Nearest city with pop. 200,000+: Charlotte, NC
Nearest city with pop. 1,000,000+: Philadelphia, PA
Nearest cities:
Latitude: 33.51 N, Longitude: 81.96 W
Daytime population change due to commuting: -3,417 (-13.6%)Workers who live and work in this city: 2,340 (18.4%)
Single-family new house construction building permits:
2022: 237 buildings , average cost: $312,7002021: 284 buildings , average cost: $311,9002020: 209 buildings , average cost: $331,1002019: 166 buildings , average cost: $308,2002018: 185 buildings , average cost: $253,5002017: 123 buildings , average cost: $266,4002016: 190 buildings , average cost: $217,4002015: 151 buildings , average cost: $262,4002014: 115 buildings , average cost: $220,9002013: 102 buildings , average cost: $236,1002012: 91 buildings , average cost: $241,6002011: 119 buildings , average cost: $171,0002010: 89 buildings , average cost: $222,5002009: 72 buildings , average cost: $210,0002008: 100 buildings , average cost: $166,1002007: 232 buildings , average cost: $152,3002006: 205 buildings , average cost: $159,0002005: 251 buildings , average cost: $113,6002004: 200 buildings , average cost: $142,7002003: 240 buildings , average cost: $134,3002002: 197 buildings , average cost: $130,0002001: 190 buildings , average cost: $116,6002000: 128 buildings , average cost: $130,1001999: 148 buildings , average cost: $123,5001998: 111 buildings , average cost: $111,9001997: 113 buildings , average cost: $91,700Unemployment in December 2023: Here:
3.1%South Carolina:
3.1%
Population change in the 1990s: +1,787 (+11.3%).
Most common occupations in North Augusta, SC (%)
Both Males Females
Preschool, kindergarten, elementary, and middle school teachers (4.7%)
Engineers (4.4%)
Other production occupations, including supervisors (4.3%)
Other office and administrative support workers, including supervisors (4.1%)
Electrical equipment mechanics and other installation, maintenance, and repair workers, including supervisors (3.8%)
Other management occupations, except farmers and farm managers (3.6%)
Registered nurses (3.5%)
Engineers (8.5%)
Electrical equipment mechanics and other installation, maintenance, and repair workers, including supervisors (7.4%)
Other production occupations, including supervisors (6.8%)
Driver/sales workers and truck drivers (3.9%)
Other sales and related occupations, including supervisors (3.9%)
Other management occupations, except farmers and farm managers (3.4%)
Computer specialists (3.0%)
Preschool, kindergarten, elementary, and middle school teachers (8.5%)
Other office and administrative support workers, including supervisors (7.5%)
Registered nurses (6.6%)
Health technologists and technicians (5.7%)
Secretaries and administrative assistants (5.6%)
Information and record clerks, except customer service representatives (4.5%)
Other management occupations, except farmers and farm managers (3.9%)
Tornado activity:
North Augusta-area historical tornado activity is near South Carolina state average. It is 5% greater than the overall U.S. average.
On 5/7/1998, a category F3 (max. wind speeds 158-206 mph) tornado 11.5 miles away from the North Augusta city center killed one person and injured 9 people and caused $1 million in damages.
On 5/7/1998, a category F3 tornado 24.7 miles away from the city center caused $300,000 in damages.
Earthquake activity:
North Augusta-area historical earthquake activity is significantly above South Carolina state average. It is 14% smaller than the overall U.S. average. On 8/2/1974 at 08:52:09, a magnitude 4.9 (4.3 MB, 4.9 LG, Class: Light, Intensity: IV - V) earthquake occurred 39.1 miles away from North Augusta center On 11/22/1974 at 05:25:55, a magnitude 4.7 (4.7 MB) earthquake occurred 113.4 miles away from North Augusta center On 8/9/2020 at 12:07:37, a magnitude 5.1 (5.1 MW, Depth: 4.7 mi, Class: Moderate, Intensity: VI - VII) earthquake occurred 210.7 miles away from the city center On 2/15/2014 at 03:23:38, a magnitude 4.1 (4.1 MW, Depth: 3.2 mi) earthquake occurred 22.3 miles away from the city center On 8/21/1992 at 16:31:55, a magnitude 4.4 (4.1 MB, 4.1 LG, 4.4 LG, Depth: 6.2 mi) earthquake occurred 111.5 miles away from North Augusta center On 8/23/2011 at 17:51:04, a magnitude 5.8 (5.8 MW, Depth: 3.7 mi) earthquake occurred 378.9 miles away from North Augusta center Magnitude types: regional Lg-wave magnitude (LG), body-wave magnitude (MB), moment magnitude (MW) Natural disasters: The number of natural disasters in Aiken County (13) is near the US average (15).Major Disasters (Presidential) Declared: 5Emergencies Declared: 5Storms: 4, Floods: 3, Hurricanes: 3, Winter Storms: 3, Drought: 1, Ice Storm: 1, Tornado: 1, Wind: 1, Other: 1 (Note: some incidents may be assigned to more than one category). Hospitals and medical centers in North Augusta: NHC HEALTHCARE - NORTH AUGUSTA (350 AUSTIN GRAYBILL)
UNIHEALTH POST-ACUTE CARE - NORTH AUGUSTA (1200 TALISMAN DRIVE)
RIVER VIEW KIDNEY CENTER (540 ATOMIC ROAD)
UNIVERSITY HOME HEALTH (106B EAST MARTINTOWN RD)
College/University in North Augusta: Kenneth Shuler School of Cosmetology-North Augusta Full-time enrollment: 108; Location: 1113 Knox Avenue; Private, for-profit; Website: www.kennethshuler.com)
Colleges/universities with over 2000 students nearest to North Augusta:
Georgia Regents University (about 4 miles; Augusta, GA ; Full-time enrollment: 6,862)
Aiken Technical College (about 8 miles; Graniteville, SC ; FT enrollment: 2,107)
Augusta Technical College (about 9 miles; Augusta, GA ; FT enrollment: 3,494)
University of South Carolina-Aiken (about 12 miles; Aiken, SC ; FT enrollment: 2,815)
Piedmont Technical College (about 49 miles; Greenwood, SC ; FT enrollment: 4,831)
Lander University (about 50 miles; Greenwood, SC ; FT enrollment: 2,870)
Denmark Technical College (about 51 miles; Denmark, SC ; FT enrollment: 2,050)
Public high schools in North Augusta:
Private high school in North Augusta: VICTORY CHRISTIAN SCHOOL Students: 117, Location: 620 W MARTINTOWN RD, Grades: PK-12)
Public elementary/middle schools in North Augusta: MERRIWETHER ELEMENTARY Students: 744, Location: 565 SPRING HAVEN DRIVE, Grades: PK-5)HAMMOND HILL ELEMENTARY Students: 740, Location: 901 WEST WOODLAWN AVENUE, Grades: PK-5)MOSSY CREEK ELEMENTARY Students: 718, Location: 421 WEST FIVE NOTCH ROAD, Grades: PK-5)NORTH AUGUSTA ELEMENTARY Students: 717, Location: 400 EAST SPRING GROVE AVENUE, Grades: PK-5)NORTH AUGUSTA MIDDLE Students: 622, Location: 725 OLD EDGEFIELD ROAD, Grades: 6-8)PAUL KNOX MIDDLE Students: 586, Location: 1804 WELLS ROAD, Grades: 6-8)MERRIWETHER MIDDLE Students: 391, Location: 430 MURRAH ROAD, Grades: 6-8)Private elementary/middle school in North Augusta: OUR LADY OF PEACE SCHOOL Students: 118, Location: 856 OLD EDGEFIELD RD, Grades: PK-8)
See full list of schools located in North Augusta User-submitted facts and corrections:
Local government website is www.northaugusta.net.
Notable locations in North Augusta: (A) , North Augusta Fire Department Headquarters (B) . Display/hide their locations on the map
Shopping Centers: (1) , Edgewood Square Shopping Center (2) , Martintown Plaza Shopping Center (3) , North Augusta Plaza Shopping Center (4) . Display/hide their locations on the map
Churches in North Augusta include: (A) , Fairview Presbyterian Church (B) , First Baptist Church of North Augusta (C) , First Providence Baptist Church (D) , Grace United Methodist Church (E) , Hammond Grove Church (F) , Holy Trinity Lutheran Church (G) , Immanuel Baptist Church (H) , North Augusta Baptist Church (I) . Display/hide their locations on the map
Cemeteries: (1) , Sunset Hill Cemetery (2) . Display/hide their locations on the map
Reservoirs: (A) , Briggs Pond (B) , Crystal Lake (C) . Display/hide their locations on the map
Streams, rivers, and creeks: (A) , Pretty Run Creek (B) . Display/hide their locations on the map
Parks in North Augusta include: (1) , Georgia Avenue-Butler Avenue Historic District (2) , Edenfield Park (3) , Mealing Park (4) . Display/hide their locations on the map
Tourist attractions: (1) , Northside Lanes (Amusement & Theme Parks; 1745 Georgia Avenue) (2) , Red Wing Bingo (617 East Martintown Road) (3) , South Carolina Welcome Center (I 20 Sc & Ga Borde West) (4) . Display/hide their approximate locations on the map
Hotels: (1) , North Augusta Motel (303 Georgia Avenue) (2) . Display/hide their approximate locations on the map
Birthplace of: David S. Lewis - Aerospace engineer, Fred Vinson (American football) - Football player, Matt Campbell (offensive lineman) - Football player.
Aiken County has a predicted average indoor radon screening level less than 2 pCi/L (pico curies per liter) - Low Potential Average household size: This city:
2.3 peopleSouth Carolina:
2.5 people
Percentage of family households: This city:
64.5%Whole state:
67.5%
Percentage of households with unmarried partners: This city:
5.5%Whole state:
6.0%
Likely homosexual households (counted as self-reported same-sex unmarried-partner households)
Lesbian couples: 0.3% of all households Gay men: 0.5% of all households
People in group quarters in North Augusta in 2010:
294 people in nursing facilities/skilled-nursing facilities
8 people in group homes intended for adults
2 people in other noninstitutional facilities
People in group quarters in North Augusta in 2000:
247 people in nursing homes
56 people in other noninstitutional group quarters
7 people in homes for the mentally retarded
3 people in local jails and other confinement facilities (including police lockups)
Banks with branches in North Augusta (2011 data):
First Citizens Bank and Trust Company, Inc.: Knox Avenue Branch at 1289 Knox Avenue, branch established on 2004/09/20; Georgia Avenue at 518 Georgia Avenue, branch established on 1997/09/24. Info updated 2011/08/24: Bank assets: $8,104.0 mil, Deposits: $6,880.8 mil, headquarters in Columbia, SC, positive income , 197 total offices , Holding Company: First Citizens Bancorporation, Inc.
Bank of America, National Association: West Martintown Road Branch at 441 West Martintown Road, branch established on 1983/01/03. Info updated 2009/11/18: Bank assets: $1,451,969.3 mil, Deposits: $1,077,176.8 mil, headquarters in Charlotte, NC, positive income , 5782 total offices , Holding Company: Bank Of America Corporation
Wells Fargo Bank, National Association: North Augusta Branch at 402 Georgia Avenue, branch established on 1964/12/30. Info updated 2011/04/05: Bank assets: $1,161,490.0 mil, Deposits: $905,653.0 mil, headquarters in Sioux Falls, SD, positive income , 6395 total offices , Holding Company: Wells Fargo & Company
Security Federal Bank: 313 Martintowne Rd Branch at 313 E. Martintown Rd., branch established on 1922/01/01. Info updated 2012/01/04: Bank assets: $916.4 mil, Deposits: $695.8 mil, headquarters in Aiken, SC, positive income , Commercial Lending Specialization, 13 total offices , Holding Company: Security Federal Corporation
Regions Bank: North Augusta Branch at 432 West Avenue, branch established on 1951/12/17. Info updated 2011/02/24: Bank assets: $123,368.2 mil, Deposits: $98,301.3 mil, headquarters in Birmingham, AL, positive income , Commercial Lending Specialization, 1778 total offices , Holding Company: Regions Financial Corporation
Georgia Bank & Trust Company of Augusta: North Augusta Branch at 336 Georgia Avenue, branch established on 2007/08/23. Info updated 2011/12/15: Bank assets: $1,610.4 mil, Deposits: $1,419.7 mil, headquarters in Augusta, GA, positive income , Commercial Lending Specialization, 12 total offices , Holding Company: Southeastern Bank Financial Corporation
For population 15 years and over in North Augusta:
Never married: 21.6%Now married: 58.5%Separated: 1.3%Widowed: 6.3%Divorced: 12.3% For population 25 years and over in North Augusta:
High school or higher: 92.9%Bachelor's degree or higher: 37.1%Graduate or professional degree: 13.2%Unemployed: 4.3%Mean travel time to work (commute): 20.6 minutes
Education Gini index (Inequality in education) Here:
10.9South Carolina average:
11.1
Religion statistics for North Augusta, SC (based on Aiken County data)
Religion Adherents Congregations Evangelical Protestant 66,138 191 Mainline Protestant 12,303 34 Catholic 8,400 4 Black Protestant 7,116 22 Other 1,949 13 Orthodox 104 3 None 64,089 -
Source: Clifford Grammich, Kirk Hadaway, Richard Houseal, Dale E.Jones, Alexei Krindatch, Richie Stanley and Richard H.Taylor. 2012. 2010 U.S.Religion Census: Religious Congregations & Membership Study. Association of Statisticians of American Religious Bodies. Jones, Dale E., et al. 2002. Congregations and Membership in the United States 2000. Nashville, TN: Glenmary Research Center. Graphs represent county-level data
Food Environment Statistics: Number of grocery stores : 27This county :
1.77 / 10,000 pop.South Carolina :
1.99 / 10,000 pop.
Number of supercenters and club stores : 2This county :
0.13 / 10,000 pop.State :
0.15 / 10,000 pop.
Number of convenience stores (no gas) : 12Here :
0.79 / 10,000 pop.South Carolina :
0.85 / 10,000 pop.
Number of convenience stores (with gas) : 75Aiken County :
4.92 / 10,000 pop.State :
5.38 / 10,000 pop.
Number of full-service restaurants : 72Here :
4.73 / 10,000 pop.South Carolina :
7.75 / 10,000 pop.
Adult diabetes rate : Aiken County :
10.7%State :
10.6%
Adult obesity rate : This county :
31.2%State :
29.4%
Low-income preschool obesity rate : This county :
19.9%State :
13.4%
Health and Nutrition: Healthy diet rate : North Augusta:
50.7%South Carolina:
49.2%
Average overall health of teeth and gums : Here:
48.7%South Carolina:
46.2%
Average BMI : North Augusta:
29.0South Carolina:
29.0
People feeling badly about themselves : North Augusta:
20.7%South Carolina:
20.4%
People not drinking alcohol at all : North Augusta:
11.1%State:
11.0%
Average hours sleeping at night : North Augusta:
6.8South Carolina:
6.8
Overweight people : This city:
35.2%South Carolina:
34.4%
General health condition : This city:
57.2%State:
55.6%
Average condition of hearing : Here:
79.6%South Carolina:
79.9%
More about Health and Nutrition of North Augusta, SC Residents
Local government employment and payroll (March 2022)
Function
Full-time employees
Monthly full-time payroll
Average yearly full-time wage
Part-time employees
Monthly part-time payroll
Police Protection - Officers
58 $336,619 $69,645 0 $0 Solid Waste Management
31 $138,070 $53,446 0 $0 Other and Unallocable
29 $117,255 $48,519 0 $0 Water Supply
20 $103,420 $62,052 0 $0 Other Government Administration
17 $71,310 $50,336 0 $0 Parks and Recreation
17 $89,686 $63,308 4 $6,842 Streets and Highways
14 $76,068 $65,201 0 $0 Sewerage
14 $65,860 $56,451 0 $0 Financial Administration
11 $63,972 $69,788 0 $0 Police - Other
10 $42,161 $50,593 1 $626 Judicial and Legal
9 $38,088 $50,784 0 $0 Firefighters
7 $13,761 $23,590 0 $0 Fire - Other
4 $26,081 $78,243 0 $0
Totals for Government
241 $1,182,351 $58,872 5 $7,468
North Augusta government finances - Expenditure in 2021 (per resident):
Construction - Regular Highways: $1,680,000 ($66.51)
Natural Resources - Other: $1,606,000 ($63.58)Police Protection: $454,000 ($17.97)Water Utilities: $350,000 ($13.86)Sewerage: $295,000 ($11.68)Parks and Recreation: $62,000 ($2.45)Current Operations - Police Protection: $8,058,000 ($319.03)
Solid Waste Management: $4,093,000 ($162.05)Parks and Recreation: $4,007,000 ($158.64)Water Utilities: $2,860,000 ($113.23)Central Staff Services: $1,811,000 ($71.70)Regular Highways: $1,520,000 ($60.18)Financial Administration: $1,118,000 ($44.26)Sewerage: $1,019,000 ($40.34)Natural Resources - Other: $617,000 ($24.43)General Public Buildings: $599,000 ($23.72)Protective Inspection and Regulation - Other: $387,000 ($15.32)Judicial and Legal Services: $239,000 ($9.46)Parking Facilities: $45,000 ($1.78)General - Interest on Debt: $3,303,000 ($130.77)
Intergovernmental to Local - Other - Sewerage: $3,924,000 ($155.36)
Intergovernmental to State - Judicial and Legal Services: $449,000 ($17.78)
Other Capital Outlay - Parks and Recreation: $1,790,000 ($70.87)
Regular Highways: $620,000 ($24.55)Police Protection: $597,000 ($23.64)Solid Waste Management: $466,000 ($18.45)Central Staff Services: $290,000 ($11.48)Water Utilities: $281,000 ($11.13)Sewerage: $230,000 ($9.11)Natural Resources - Other: $8,000 ($0.32)Total Salaries and Wages: $12,468,000 ($493.63)
Water Utilities - Interest on Debt: $313,000 ($12.39)
North Augusta government finances - Revenue in 2021 (per resident):
Charges - Sewerage: $6,985,000 ($276.55)
Solid Waste Management: $4,738,000 ($187.58)Parks and Recreation: $350,000 ($13.86)Parking Facilities: $85,000 ($3.37)Local Intergovernmental - Other: $288,000 ($11.40)
General Local Government Support: $59,000 ($2.34)Miscellaneous - General Revenue - Other: $3,335,000 ($132.04)
Fines and Forfeits: $873,000 ($34.56)Rents: $390,000 ($15.44)Interest Earnings: $296,000 ($11.72)Sale of Property: $113,000 ($4.47)Revenue - Water Utilities: $3,667,000 ($145.18)
State Intergovernmental - General Local Government Support: $620,000 ($24.55)
Other: $580,000 ($22.96)Tax - Property: $9,656,000 ($382.29)
Other License: $6,421,000 ($254.22)Other Selective Sales: $1,831,000 ($72.49)
North Augusta government finances - Debt in 2021 (per resident):
Long Term Debt - Beginning Outstanding - Unspecified Public Purpose: $88,365,000 ($3498.50)
Outstanding Unspecified Public Purpose: $86,917,000 ($3441.17)Retired Unspecified Public Purpose: $1,448,000 ($57.33)
North Augusta government finances - Cash and Securities in 2021 (per resident):
Bond Funds - Cash and Securities: $10,250,000 ($405.81)
Other Funds - Cash and Securities: $34,522,000 ($1366.77)
7.51% of this county's 2021 resident taxpayers lived in other counties in 2020 ($64,067 average adjusted gross income )
Here:
7.51%South Carolina average:
8.89%
0.03% of residents moved from foreign countries ($243 average AGI )Aiken County:
0.03%South Carolina average:
0.04%
Top counties from which taxpayers relocated into this county between 2020 and 2021:
Businesses in North Augusta, SC
Name Count Name Count
AT&T 1 Nike 2 Advance Auto Parts 3 Office Depot 1 Arby's 1 Papa John's Pizza 1 AutoZone 1 Payless 1 Burger King 2 Pizza Hut 2 CVS 1 Publix Super Markets 1 Chick-Fil-A 1 RadioShack 1 Circle K 1 Rite Aid 1 Curves 1 SONIC Drive-In 2 DHL 1 Sleep Inn 1 Dairy Queen 1 Starbucks 1 Domino's Pizza 1 Subway 3 FedEx 5 T-Mobile 2 GNC 2 Taco Bell 1 GameStop 1 Tire Kingdom 1 H&R Block 1 U-Haul 1 KFC 2 UPS 9 Kmart 1 Verizon Wireless 1 Kroger 1 Waffle House 2 Lowe's 1 Walgreens 1 McDonald's 3 Walmart 1 New Balance 1 YMCA 1
Strongest AM radio stations in North Augusta:
WTHB (1550 AM; 5 kW; AUGUSTA, GA)
WRDW (1480 AM; 10 kW; AUGUSTA, GA; Owner: WCHZ LICENSE, LLC)
WTEL (1630 AM; 10 kW; AUGUSTA, GA; Owner: WCHZ LICENSE, LLC)
WPCH (1380 AM; 4 kW; NORTH AUGUSTA, SC; Owner: CAPSTAR TX LIMITED PARTNERSHIP)
WFAM (1050 AM; 5 kW; AUGUSTA, GA; Owner: J.J. & B. BROADCASTING, INC.)
WGAC (580 AM; 5 kW; AUGUSTA, GA; Owner: WGAC LICENSE, LLC)
WKZK (1600 AM; daytime; 0 kW; NORTH AUGUSTA, SC; Owner: GOSPEL RADIO, INC.)
WINZ (1340 AM; 1 kW; AUGUSTA, GA; Owner: CAPSTAR TX LIMITED PARTNERSHIP)
WKIM (1230 AM; 1 kW; AUGUSTA, GA; Owner: FREDDIE LEE HANDY)
WBAJ (890 AM; daytime; 50 kW; BLYTHEWOOD, SC; Owner: FAMILY FIRST)
WCEO (840 AM; daytime; 50 kW; COLUMBIA, SC; Owner: EASTERN BROADCASTING GROUP, INC.)
WLFJ (660 AM; daytime; 50 kW; GREENVILLE, SC; Owner: CLEAR CHANNEL BROADCASTING LICENSES, INC.)
WBCU (1460 AM; 50 kW; UNION, SC)
Strongest FM radio stations in North Augusta:
WEKL (102.3 FM; AUGUSTA, GA; Owner: CAPSTAR TX LIMITED PARTNERSHIP)
WFXA-FM (103.1 FM; AUGUSTA, GA; Owner: RADIO ONE OF AUGUSTA, LLC)
WBBQ-FM (104.3 FM; AUGUSTA, GA; Owner: CAPSTAR TX LIMITED PARTNERSHIP)
WLPE (91.7 FM; AUGUSTA, GA; Owner: AUGUSTA RADIO FELLOWSHIP INSTITUTE, INC.)
WAFJ (88.3 FM; BELVEDERE, SC; Owner: RADIO TRAINING NETWORK, INC.)
WZNY (105.7 FM; AUGUSTA, GA; Owner: CAPSTAR TX LIMITED PARTNERSHIP)
WSLT (98.3 FM; CLEARWATER, SC; Owner: WGAC LICENSE, LLC)
WKSP (96.3 FM; AIKEN, SC; Owner: CAPSTAR TX LIMITED PARTNERSHIP)
WKXC-FM (99.5 FM; AIKEN, SC; Owner: WGAC LICENSE, LLC)
WGOR (93.9 FM; MARTINEZ, GA; Owner: WGOR LICENSE, LLC)
WAKB (96.9 FM; WRENS, GA; Owner: RADIO ONE OF AUGUSTA, LLC)
WACG-FM (90.7 FM; AUGUSTA, GA; Owner: GEORGIA PUBLIC TELECOMMUNICATIONS COMMISSION)
WKSX-FM (92.7 FM; JOHNSTON, SC; Owner: EDGEFIELD-SALUDA RADIO COMPANY, INC.)
WPRW-FM (107.7 FM; MARTINEZ, GA; Owner: CAPSTAR TX LIMITED PARTNERSHIP)
WAEG (92.3 FM; EVANS, GA; Owner: RADIO ONE OF AUGUSTA, LLC)
WBAW-FM (99.1 FM; BARNWELL, SC; Owner: BULLIE BROADCASTING CORPORATION)
WCHZ (95.1 FM; HARLEM, GA; Owner: WCHZ LICENSE,LLC)
WAJY (102.7 FM; NEW ELLENTON, SC; Owner: WGAC LICENSE, LLC)
WAAW (94.7 FM; WILLISTON, SC; Owner: FRANK NEELY)
WTHB-FM (100.9 FM; WAYNESBORO, GA; Owner: RADIO ONE OF AUGUSTA, LLC)
TV broadcast stations around North Augusta:
WBPI-LP (Channel 49; AUGUSTA, GA; Owner: WATCHMAN BROADCASTING PRODUCTIONS INTERNATIONAL, INC.)
W58CZ (Channel 58; AUGUSTA, GA; Owner: TRINITY BROADCASTING NETWORK)
WJBF (Channel 6; AUGUSTA, GA; Owner: MEDIA GENERAL BROADCASTING OF SO. CAROLINA HOLDINGS, INC.)
WRDW-TV (Channel 12; AUGUSTA, GA; Owner: WRDW LICENSEE CORP.)
WAGT (Channel 26; AUGUSTA, GA; Owner: WAGT TELEVISION, INC.)
WFXG (Channel 54; AUGUSTA, GA; Owner: FISHER BROADCASTING - GEORGIA, L.L.C.)
W56EE (Channel 56; JOHNSTON, SC; Owner: DOVE BROADCASTING, INC.)
WAAU-LP (Channel 18; AUGUSTA, GA; Owner: THOMAS J. PIPER)
WCES-TV (Channel 20; WRENS, GA; Owner: GEORGIA PUBLIC TELECOMMUNICATIONS COMMISSION)
WBEK-CA (Channel 16; AUGUSTA, GA; Owner: AVN, INC.)
National Bridge Inventory (NBI) Statistics 75 Number of bridges1,083ft / 330m Total length $4,821,000 Total costs973,000 Total average daily traffic111,153 Total average daily truck traffic
New bridges - historical statistics
2 1930-1939 3 1940-1949 5 1950-1959 21 1960-1969 2 1970-1979 1 1990-1999 40 2000-2009 1 2010-2019
See full National Bridge Inventory statistics for North Augusta, SC
Home Mortgage Disclosure Act Aggregated Statistics For Year 2009(Based on 5 partial tracts) A) FHA, FSA/RHS & VA B) Conventional C) Refinancings D) Home Improvement Loans E) Loans on Dwellings For 5+ Families F) Non-occupant Loans on G) Loans On Manufactured Number Average Value Number Average Value Number Average Value Number Average Value Number Average Value Number Average Value Number Average Value
LOANS ORIGINATED 103 $126,885 78 $138,780 331 $152,811 21 $94,600 1 $1,837,470 29 $96,277 1 $18,360 APPLICATIONS APPROVED, NOT ACCEPTED 3 $90,870 7 $122,714 18 $153,266 1 $20,520 0 $0 1 $178,030 2 $68,170 APPLICATIONS DENIED 14 $94,501 12 $108,987 91 $140,982 12 $41,797 0 $0 9 $96,264 2 $26,180 APPLICATIONS WITHDRAWN 9 $110,400 17 $144,031 76 $142,673 1 $66,670 1 $96,980 6 $130,752 0 $0 FILES CLOSED FOR INCOMPLETENESS 3 $80,883 1 $77,340 19 $134,285 1 $99,940 0 $0 0 $0 0 $0
Aggregated Statistics For Year 2008(Based on 5 partial tracts) A) FHA, FSA/RHS & VA B) Conventional C) Refinancings D) Home Improvement Loans F) Non-occupant Loans on G) Loans On Manufactured Number Average Value Number Average Value Number Average Value Number Average Value Number Average Value Number Average Value
LOANS ORIGINATED 103 $125,648 136 $152,382 223 $141,460 33 $40,494 56 $89,273 2 $69,605 APPLICATIONS APPROVED, NOT ACCEPTED 6 $95,243 15 $118,541 30 $104,637 8 $15,486 7 $57,890 2 $80,855 APPLICATIONS DENIED 13 $105,359 18 $100,610 112 $121,278 42 $52,034 16 $96,958 2 $74,505 APPLICATIONS WITHDRAWN 14 $115,620 19 $170,918 51 $552,997 3 $93,210 14 $79,673 0 $0 FILES CLOSED FOR INCOMPLETENESS 4 $126,715 5 $199,918 15 $105,105 1 $133,580 2 $64,660 0 $0
Aggregated Statistics For Year 2007(Based on 5 partial tracts) A) FHA, FSA/RHS & VA B) Conventional C) Refinancings D) Home Improvement Loans E) Loans on Dwellings For 5+ Families F) Non-occupant Loans on G) Loans On Manufactured Number Average Value Number Average Value Number Average Value Number Average Value Number Average Value Number Average Value Number Average Value
LOANS ORIGINATED 49 $113,144 276 $133,708 233 $119,845 39 $37,428 3 $3,076,773 79 $98,606 6 $53,602 APPLICATIONS APPROVED, NOT ACCEPTED 1 $86,700 37 $103,166 32 $92,781 12 $32,076 0 $0 9 $72,618 5 $63,830 APPLICATIONS DENIED 12 $101,468 49 $102,038 148 $102,575 59 $52,523 0 $0 27 $76,081 8 $49,180 APPLICATIONS WITHDRAWN 7 $109,534 27 $130,313 83 $115,715 10 $90,175 0 $0 11 $96,319 1 $21,460 FILES CLOSED FOR INCOMPLETENESS 0 $0 6 $174,880 27 $105,130 1 $139,670 0 $0 4 $71,098 0 $0
Aggregated Statistics For Year 2006(Based on 5 partial tracts) A) FHA, FSA/RHS & VA B) Conventional C) Refinancings D) Home Improvement Loans E) Loans on Dwellings For 5+ Families F) Non-occupant Loans on G) Loans On Manufactured Number Average Value Number Average Value Number Average Value Number Average Value Number Average Value Number Average Value Number Average Value
LOANS ORIGINATED 62 $106,845 313 $115,767 234 $99,770 36 $35,587 1 $434,990 86 $72,977 3 $36,800 APPLICATIONS APPROVED, NOT ACCEPTED 2 $138,070 36 $103,304 38 $69,509 14 $21,112 0 $0 9 $56,650 3 $87,473 APPLICATIONS DENIED 5 $81,348 41 $85,828 129 $100,816 47 $56,437 0 $0 15 $73,993 6 $50,807 APPLICATIONS WITHDRAWN 6 $110,532 28 $126,794 101 $90,614 11 $51,455 1 $2,340 11 $71,247 0 $0 FILES CLOSED FOR INCOMPLETENESS 1 $87,590 6 $63,055 25 $114,997 2 $31,890 0 $0 1 $114,470 1 $31,220
Aggregated Statistics For Year 2005(Based on 5 partial tracts) A) FHA, FSA/RHS & VA B) Conventional C) Refinancings D) Home Improvement Loans E) Loans on Dwellings For 5+ Families F) Non-occupant Loans on G) Loans On Manufactured Number Average Value Number Average Value Number Average Value Number Average Value Number Average Value Number Average Value Number Average Value
LOANS ORIGINATED 63 $107,419 277 $105,304 201 $97,886 35 $47,199 2 $1,201,480 75 $71,544 3 $73,167 APPLICATIONS APPROVED, NOT ACCEPTED 2 $94,155 23 $107,436 44 $95,780 8 $17,584 0 $0 7 $65,087 1 $79,840 APPLICATIONS DENIED 5 $70,456 39 $91,928 170 $92,859 49 $41,448 0 $0 17 $72,517 8 $64,695 APPLICATIONS WITHDRAWN 4 $101,028 25 $93,640 91 $99,993 13 $116,601 0 $0 11 $79,645 1 $10,910 FILES CLOSED FOR INCOMPLETENESS 1 $85,040 6 $96,327 33 $116,489 4 $50,992 0 $0 2 $61,115 0 $0
Aggregated Statistics For Year 2004(Based on 5 partial tracts) A) FHA, FSA/RHS & VA B) Conventional C) Refinancings D) Home Improvement Loans E) Loans on Dwellings For 5+ Families F) Non-occupant Loans on G) Loans On Manufactured Number Average Value Number Average Value Number Average Value Number Average Value Number Average Value Number Average Value Number Average Value
LOANS ORIGINATED 61 $100,181 246 $112,681 255 $94,003 29 $49,340 2 $316,545 76 $56,651 6 $38,093 APPLICATIONS APPROVED, NOT ACCEPTED 3 $85,243 30 $86,786 41 $75,796 7 $25,239 0 $0 9 $60,347 3 $47,073 APPLICATIONS DENIED 5 $95,902 42 $78,777 153 $97,558 37 $36,339 0 $0 19 $63,485 6 $57,795 APPLICATIONS WITHDRAWN 3 $109,123 23 $150,010 94 $96,199 7 $39,703 0 $0 9 $75,388 2 $59,260 FILES CLOSED FOR INCOMPLETENESS 1 $68,030 9 $114,559 25 $103,733 2 $30,765 0 $0 1 $130,600 1 $119,620
Aggregated Statistics For Year 2003(Based on 5 partial tracts) A) FHA, FSA/RHS & VA B) Conventional C) Refinancings D) Home Improvement Loans E) Loans on Dwellings For 5+ Families F) Non-occupant Loans on Number Average Value Number Average Value Number Average Value Number Average Value Number Average Value Number Average Value
LOANS ORIGINATED 68 $94,196 228 $102,194 562 $95,069 35 $23,835 3 $13,544,020 75 $61,840 APPLICATIONS APPROVED, NOT ACCEPTED 1 $97,910 10 $73,035 73 $91,688 7 $12,281 0 $0 11 $47,664 APPLICATIONS DENIED 3 $69,777 23 $78,152 190 $84,938 22 $25,487 0 $0 16 $63,286 APPLICATIONS WITHDRAWN 6 $131,085 26 $122,503 100 $92,701 3 $34,270 0 $0 14 $65,361 FILES CLOSED FOR INCOMPLETENESS 0 $0 7 $120,947 22 $87,305 2 $20,520 0 $0 5 $69,170
Aggregated Statistics For Year 2002(Based on 5 partial tracts) A) FHA, FSA/RHS & VA B) Conventional C) Refinancings D) Home Improvement Loans E) Loans on Dwellings For 5+ Families F) Non-occupant Loans on Number Average Value Number Average Value Number Average Value Number Average Value Number Average Value Number Average Value
LOANS ORIGINATED 72 $84,634 233 $100,190 359 $92,046 25 $18,626 1 $58,430 59 $57,375 APPLICATIONS APPROVED, NOT ACCEPTED 3 $68,517 21 $86,641 50 $71,227 6 $18,620 0 $0 6 $33,333 APPLICATIONS DENIED 2 $69,560 38 $76,078 165 $75,522 19 $15,832 0 $0 13 $68,442 APPLICATIONS WITHDRAWN 10 $71,691 20 $87,956 110 $79,187 3 $13,653 1 $60,220 6 $46,587 FILES CLOSED FOR INCOMPLETENESS 0 $0 1 $40,210 17 $76,103 0 $0 0 $0 0 $0
Aggregated Statistics For Year 2001(Based on 5 partial tracts) A) FHA, FSA/RHS & VA B) Conventional C) Refinancings D) Home Improvement Loans E) Loans on Dwellings For 5+ Families F) Non-occupant Loans on Number Average Value Number Average Value Number Average Value Number Average Value Number Average Value Number Average Value
LOANS ORIGINATED 85 $82,021 204 $97,021 328 $87,133 30 $13,237 1 $56,100 58 $67,667 APPLICATIONS APPROVED, NOT ACCEPTED 2 $62,960 23 $54,942 41 $72,660 6 $7,993 0 $0 8 $45,515 APPLICATIONS DENIED 8 $69,284 60 $52,871 157 $66,243 25 $14,589 0 $0 13 $48,716 APPLICATIONS WITHDRAWN 4 $92,212 18 $89,404 101 $74,317 7 $30,321 0 $0 10 $47,615 FILES CLOSED FOR INCOMPLETENESS 1 $73,140 2 $112,040 22 $68,209 0 $0 0 $0 2 $49,860
Aggregated Statistics For Year 2000(Based on 5 partial tracts) A) FHA, FSA/RHS & VA B) Conventional C) Refinancings D) Home Improvement Loans E) Loans on Dwellings For 5+ Families F) Non-occupant Loans on Number Average Value Number Average Value Number Average Value Number Average Value Number Average Value Number Average Value
LOANS ORIGINATED 77 $76,518 178 $88,661 119 $71,796 38 $15,092 1 $40,890 35 $49,143 APPLICATIONS APPROVED, NOT ACCEPTED 4 $61,205 23 $57,893 37 $66,019 17 $22,870 0 $0 4 $46,955 APPLICATIONS DENIED 9 $56,676 89 $50,852 158 $53,855 38 $13,400 0 $0 16 $47,598 APPLICATIONS WITHDRAWN 4 $72,705 19 $78,454 76 $58,535 5 $24,478 0 $0 5 $86,030 FILES CLOSED FOR INCOMPLETENESS 4 $83,660 6 $88,220 17 $76,198 0 $0 0 $0 0 $0
Aggregated Statistics For Year 1999(Based on 5 partial tracts) A) FHA, FSA/RHS & VA B) Conventional C) Refinancings D) Home Improvement Loans E) Loans on Dwellings For 5+ Families F) Non-occupant Loans on Number Average Value Number Average Value Number Average Value Number Average Value Number Average Value Number Average Value
LOANS ORIGINATED 78 $72,251 204 $90,133 209 $71,496 44 $18,894 4 $509,752 40 $51,292 APPLICATIONS APPROVED, NOT ACCEPTED 2 $65,510 33 $52,726 58 $62,915 17 $13,979 0 $0 6 $40,862 APPLICATIONS DENIED 10 $65,812 111 $49,731 128 $57,538 34 $12,636 0 $0 15 $53,644 APPLICATIONS WITHDRAWN 7 $79,661 34 $75,251 67 $65,767 4 $78,618 0 $0 4 $98,745 FILES CLOSED FOR INCOMPLETENESS 2 $75,195 2 $102,440 14 $66,244 0 $0 0 $0 1 $71,080
Detailed HMDA statistics for the following Tracts:
0205.00
, 0206.00 , 0207.01 , 0207.02 , 0208.00
Private Mortgage Insurance Companies Aggregated Statistics For Year 2009(Based on 4 partial tracts) A) Conventional B) Refinancings C) Non-occupant Loans on Number Average Value Number Average Value Number Average Value
LOANS ORIGINATED 19 $154,179 11 $159,907 0 $0 APPLICATIONS APPROVED, NOT ACCEPTED 3 $280,283 8 $268,172 1 $149,590 APPLICATIONS DENIED 1 $110,630 0 $0 0 $0 APPLICATIONS WITHDRAWN 3 $155,713 2 $274,235 0 $0 FILES CLOSED FOR INCOMPLETENESS 0 $0 1 $88,040 0 $0
Aggregated Statistics For Year 2008(Based on 5 partial tracts) A) Conventional B) Refinancings C) Non-occupant Loans on Number Average Value Number Average Value Number Average Value
LOANS ORIGINATED 54 $137,186 22 $155,689 8 $99,496 APPLICATIONS APPROVED, NOT ACCEPTED 18 $161,306 11 $197,513 3 $88,713 APPLICATIONS DENIED 2 $123,700 1 $281,510 0 $0 APPLICATIONS WITHDRAWN 0 $0 0 $0 0 $0 FILES CLOSED FOR INCOMPLETENESS 0 $0 0 $0 0 $0
Aggregated Statistics For Year 2007(Based on 5 partial tracts) A) Conventional B) Refinancings C) Non-occupant Loans on Number Average Value Number Average Value Number Average Value
LOANS ORIGINATED 101 $120,368 30 $137,219 13 $82,107 APPLICATIONS APPROVED, NOT ACCEPTED 17 $135,556 5 $164,716 1 $154,560 APPLICATIONS DENIED 1 $114,150 1 $117,380 0 $0 APPLICATIONS WITHDRAWN 3 $164,033 2 $144,420 1 $81,050 FILES CLOSED FOR INCOMPLETENESS 1 $97,070 0 $0 0 $0
Aggregated Statistics For Year 2006(Based on 5 partial tracts) A) Conventional B) Refinancings C) Non-occupant Loans on Number Average Value Number Average Value Number Average Value
LOANS ORIGINATED 81 $107,468 24 $120,920 14 $76,521 APPLICATIONS APPROVED, NOT ACCEPTED 9 $115,659 2 $164,890 2 $56,940 APPLICATIONS DENIED 2 $174,280 1 $622,320 0 $0 APPLICATIONS WITHDRAWN 2 $191,610 5 $217,592 3 $47,337 FILES CLOSED FOR INCOMPLETENESS 0 $0 0 $0 0 $0
Aggregated Statistics For Year 2005(Based on 5 partial tracts) A) Conventional B) Refinancings C) Non-occupant Loans on Number Average Value Number Average Value Number Average Value
LOANS ORIGINATED 79 $121,224 22 $124,460 10 $64,217 APPLICATIONS APPROVED, NOT ACCEPTED 10 $127,996 9 $135,400 3 $46,523 APPLICATIONS DENIED 0 $0 1 $96,980 0 $0 APPLICATIONS WITHDRAWN 3 $118,000 1 $83,340 1 $113,520 FILES CLOSED FOR INCOMPLETENESS 1 $141,800 1 $122,120 0 $0
Aggregated Statistics For Year 2004(Based on 5 partial tracts) A) Conventional B) Refinancings C) Non-occupant Loans on D) Loans On Manufactured Number Average Value Number Average Value Number Average Value Number Average Value
LOANS ORIGINATED 100 $111,547 46 $106,705 23 $61,230 0 $0 APPLICATIONS APPROVED, NOT ACCEPTED 13 $124,935 7 $112,603 3 $89,950 0 $0 APPLICATIONS DENIED 1 $17,100 1 $52,620 1 $43,010 0 $0 APPLICATIONS WITHDRAWN 4 $106,988 3 $107,180 2 $100,505 1 $98,950 FILES CLOSED FOR INCOMPLETENESS 1 $138,240 0 $0 0 $0 0 $0
Aggregated Statistics For Year 2003(Based on 5 partial tracts) A) Conventional B) Refinancings C) Non-occupant Loans on Number Average Value Number Average Value Number Average Value
LOANS ORIGINATED 97 $102,249 115 $98,580 21 $63,680 APPLICATIONS APPROVED, NOT ACCEPTED 10 $178,857 19 $113,214 0 $0 APPLICATIONS DENIED 0 $0 0 $0 0 $0 APPLICATIONS WITHDRAWN 2 $63,730 8 $112,174 2 $85,435 FILES CLOSED FOR INCOMPLETENESS 1 $57,900 0 $0 0 $0
Aggregated Statistics For Year 2002(Based on 5 partial tracts) A) Conventional B) Refinancings C) Non-occupant Loans on Number Average Value Number Average Value Number Average Value
LOANS ORIGINATED 103 $104,518 70 $105,231 13 $62,723 APPLICATIONS APPROVED, NOT ACCEPTED 8 $140,246 13 $138,941 2 $64,415 APPLICATIONS DENIED 1 $472,910 2 $102,160 1 $44,410 APPLICATIONS WITHDRAWN 5 $148,916 4 $109,095 1 $44,870 FILES CLOSED FOR INCOMPLETENESS 0 $0 1 $75,990 0 $0
Aggregated Statistics For Year 2001(Based on 5 partial tracts) A) Conventional B) Refinancings C) Non-occupant Loans on Number Average Value Number Average Value Number Average Value
LOANS ORIGINATED 85 $96,175 51 $94,767 5 $77,152 APPLICATIONS APPROVED, NOT ACCEPTED 7 $111,396 5 $123,494 2 $66,935 APPLICATIONS DENIED 1 $77,400 2 $64,845 0 $0 APPLICATIONS WITHDRAWN 2 $80,050 3 $87,923 0 $0 FILES CLOSED FOR INCOMPLETENESS 1 $148,030 0 $0 0 $0
Aggregated Statistics For Year 2000(Based on 5 partial tracts) A) Conventional B) Refinancings C) Non-occupant Loans on Number Average Value Number Average Value Number Average Value
LOANS ORIGINATED 66 $98,317 11 $97,427 6 $55,200 APPLICATIONS APPROVED, NOT ACCEPTED 7 $116,133 2 $250,950 0 $0 APPLICATIONS DENIED 1 $74,190 0 $0 0 $0 APPLICATIONS WITHDRAWN 1 $60,520 0 $0 0 $0 FILES CLOSED FOR INCOMPLETENESS 0 $0 0 $0 0 $0
Aggregated Statistics For Year 1999(Based on 5 partial tracts) A) Conventional B) Refinancings C) Non-occupant Loans on Number Average Value Number Average Value Number Average Value
LOANS ORIGINATED 71 $99,774 24 $95,323 3 $61,137 APPLICATIONS APPROVED, NOT ACCEPTED 4 $81,142 2 $96,705 1 $73,560 APPLICATIONS DENIED 2 $83,395 0 $0 0 $0 APPLICATIONS WITHDRAWN 2 $91,900 0 $0 0 $0 FILES CLOSED FOR INCOMPLETENESS 0 $0 0 $0 0 $0
Detailed PMIC statistics for the following Tracts:
0205.00
, 0206.00 , 0207.01 , 0207.02 , 0208.00 Fire-safe hotels and motels in North Augusta, South Carolina:
Holiday Inn Express North Augusta SC, 138 Stephens Farm Ln, North augusta, South Carolina 29860 Phone: (800) 465-4329
Crowne Plaza North Augusta, 1060 Center St, North augusta, South Carolina 29841 Phone: (803) 349-8400
All 2 fire-safe hotels and motels in North Augusta, South Carolina
Most common first names in North Augusta, SC among deceased individuals Name Count Lived (average)
John 252 72.6 years James 248 70.8 years Mary 233 78.2 years William 200 73.3 years Robert 154 69.9 years George 123 74.0 years Willie 108 74.9 years Charles 105 71.0 years Annie 92 80.5 years Thomas 84 68.5 years
Most common last names in North Augusta, SC among deceased individuals Last name Count Lived (average)
Smith 111 73.2 years Williams 107 71.0 years Johnson 102 74.5 years Carroll 90 71.3 years Sherlock 87 74.0 years Jones 75 73.4 years Riley 66 71.6 years Turner 58 75.0 years Davis 58 74.2 years Thomas 50 71.2 years
North Augusta compared to South Carolina state average:
Unemployed percentage significantly below state average. Percentage of population with a bachelor's degree or higher above state average. North Augusta on our top lists :
#53 on the list of "Top 101 cities with the most people born in other U.S. states (population 5,000+)"
#57 on the list of "Top 101 cities with largest percentage of females in occupations: health diagnosing and treating practitioners and other technical occupations (population 5,000+)"
#88 on the list of "Top 101 cities with largest percentage of males in occupations: fire fighting and prevention workers including supervisors (population 5,000+)"
#11 on the list of "Top 101 counties with the highest percentage of residents that keep firearms around their homes"
#44 on the list of "Top 101 counties with the largest decrease in the number of births per 1000 residents 2000-2006 to 2007-2013 (pop 50,000+)"
#67 on the list of "Top 101 counties with the worst general health status score of residents (1-5), 3 years of data"
#72 on the list of "Top 101 counties with the largest number of people moving in compared to moving out (pop. 50,000+)"
Top Patent Applicants
Graham Lanier Fletcher (6)
Troy Doom (5)
Thomas H. Sharpe (5)
Juncai Bai (4)
John Lewis (4)
Brian Fields (4)
Ruoping Zhang (4)
Eric Winters (4)
Lawrence J. Harpring (4)
Jody S. Brittain (3)
Total of 106 patent applications in 2008-2024.


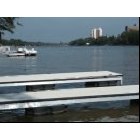


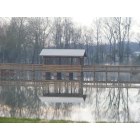
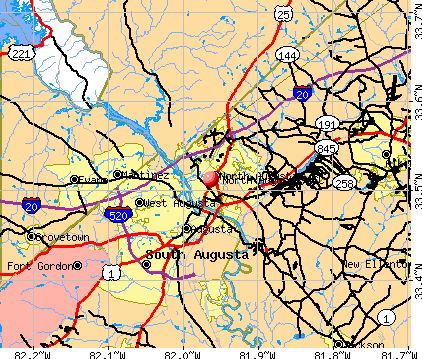


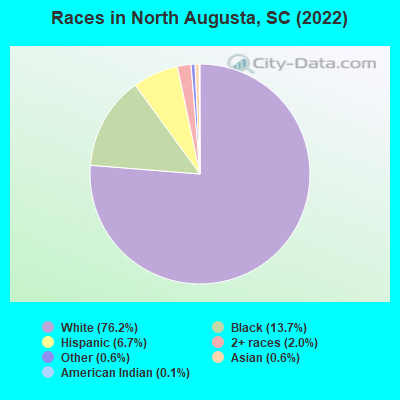
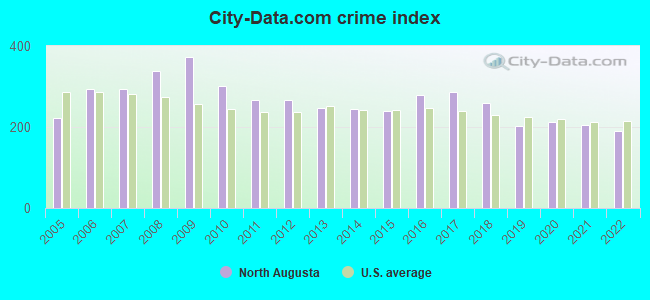
 Recent articles from our blog. Our writers, many of them Ph.D. graduates or candidates, create easy-to-read articles on a wide variety of topics.

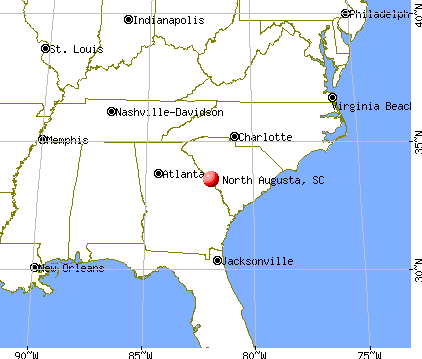
 (4.9 miles
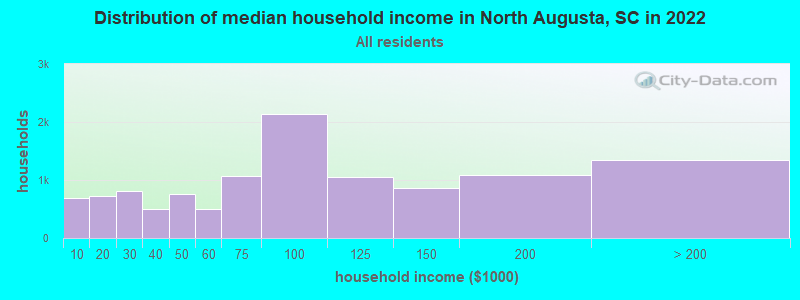
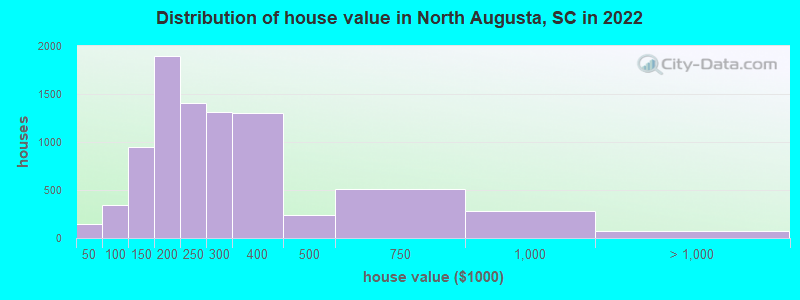

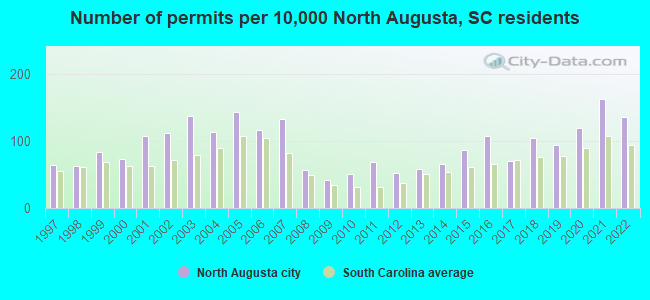
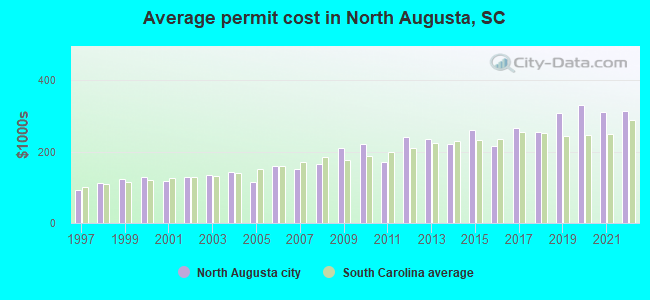
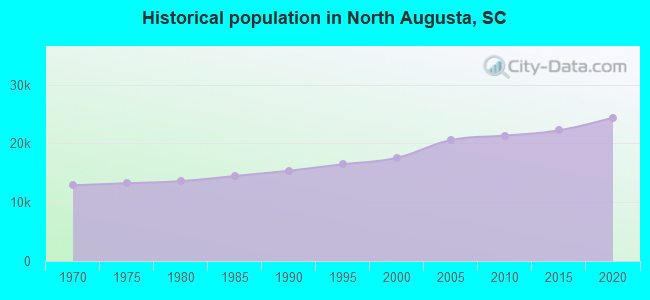
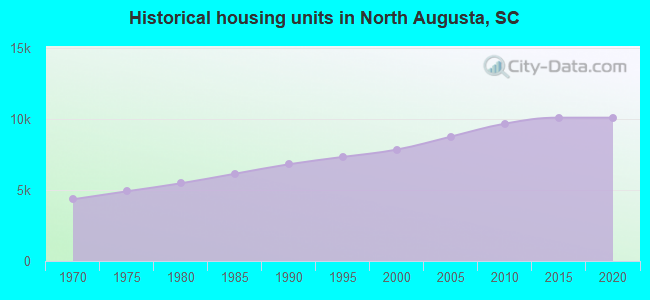
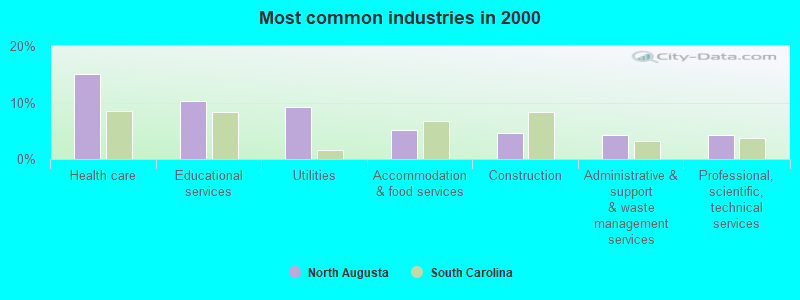
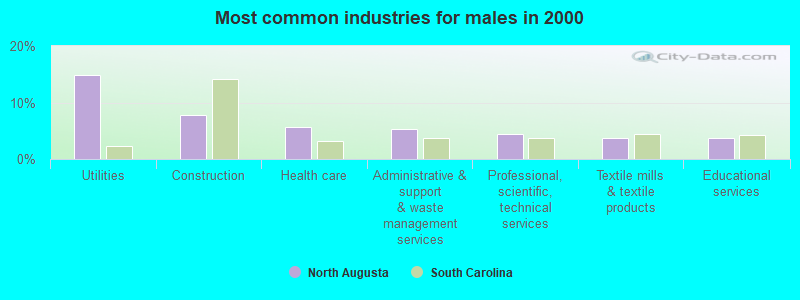
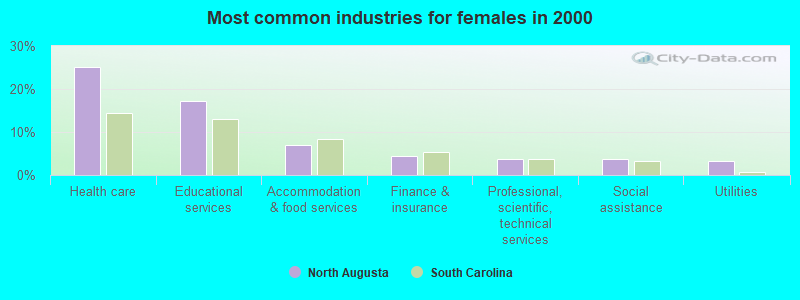
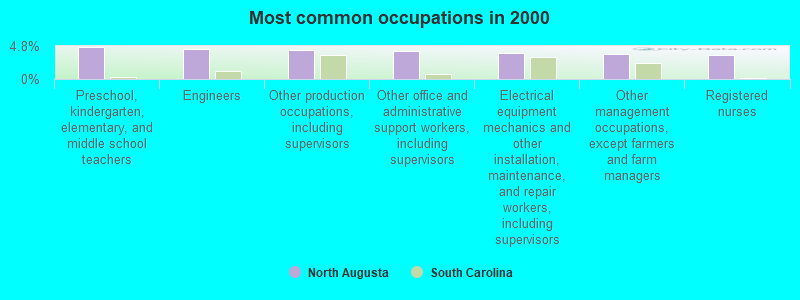
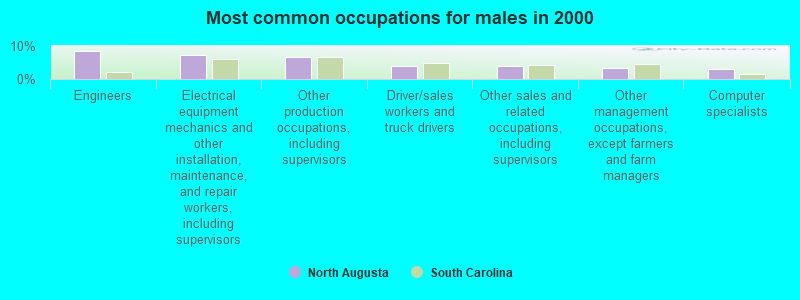
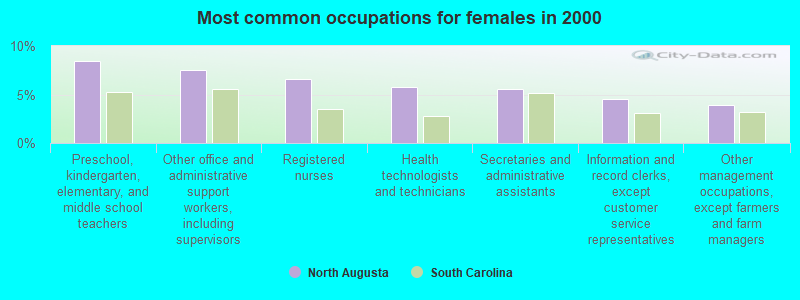

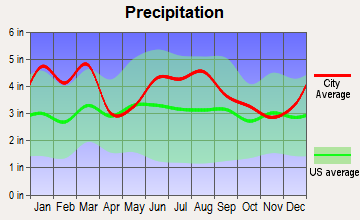
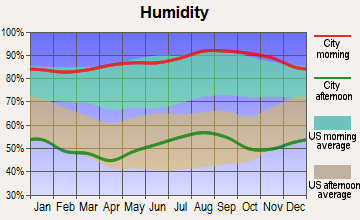
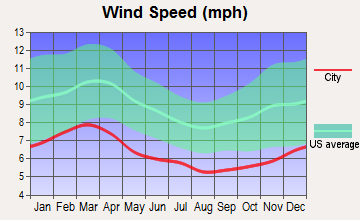
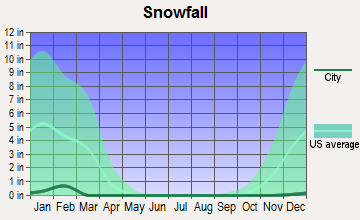
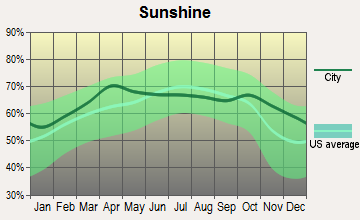
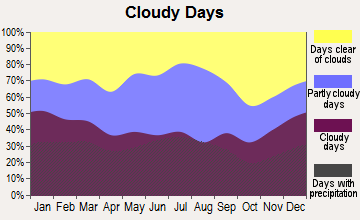
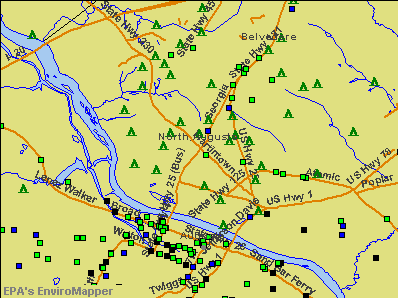

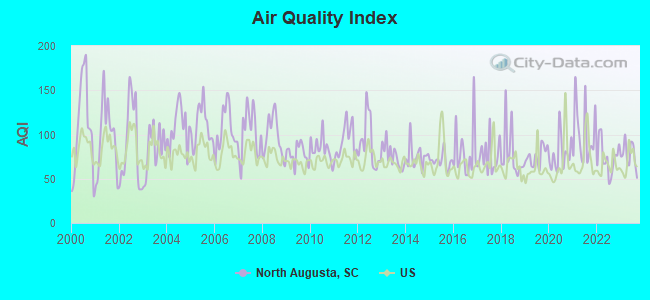
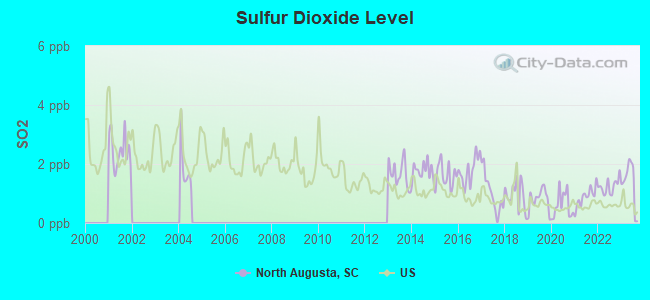
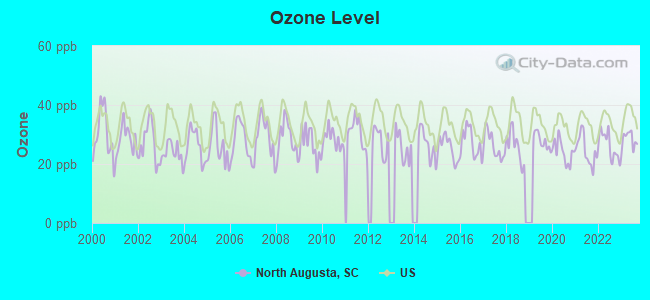
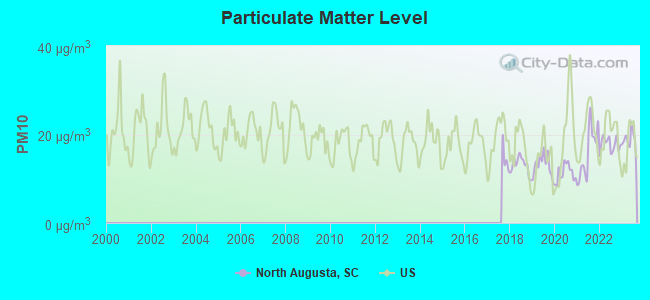
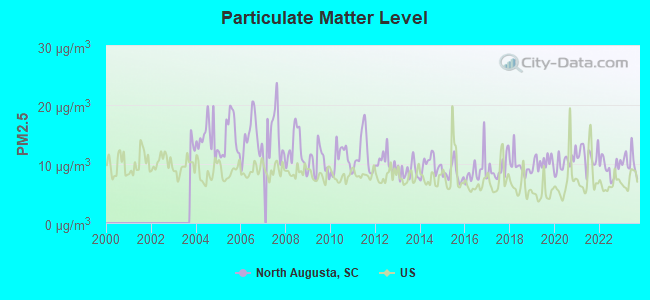
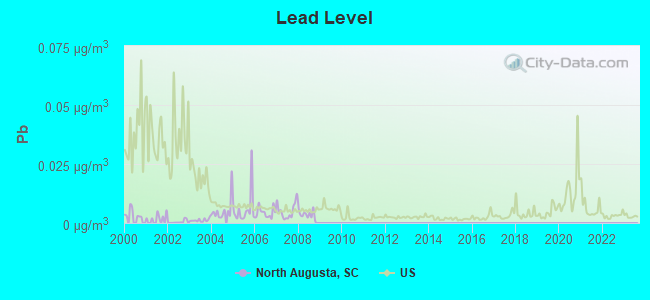
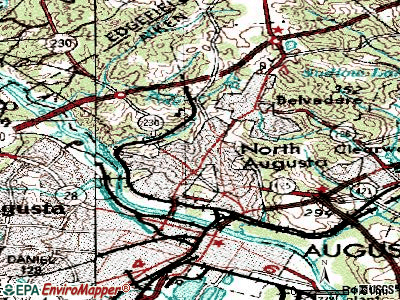
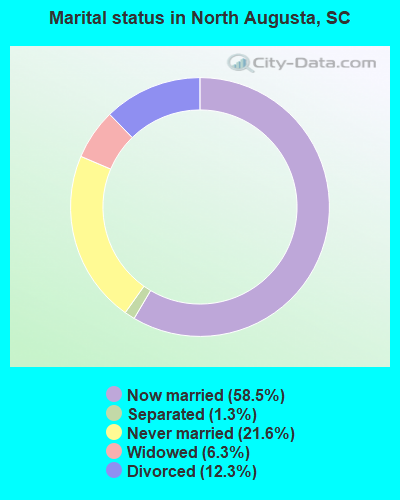
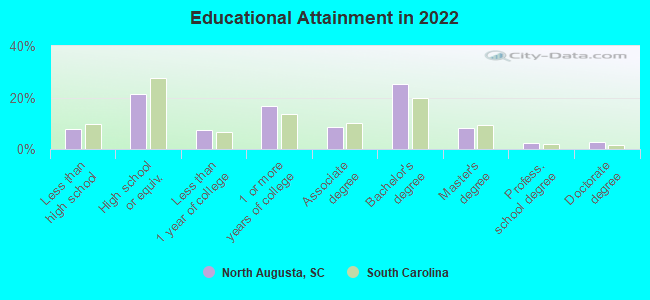
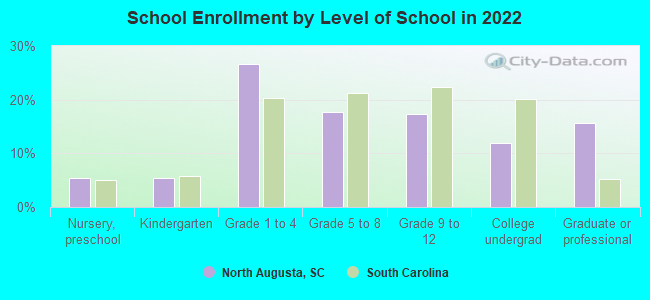
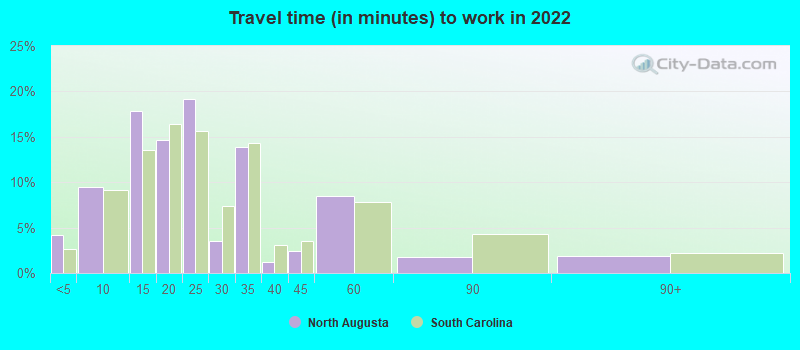
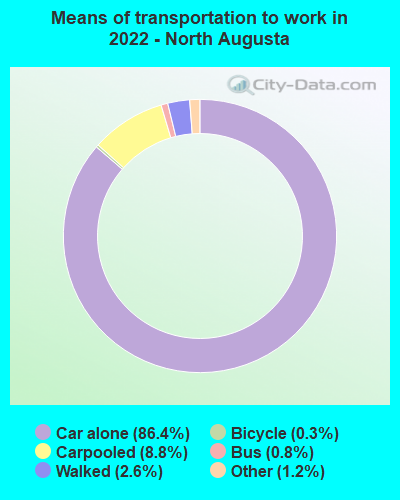
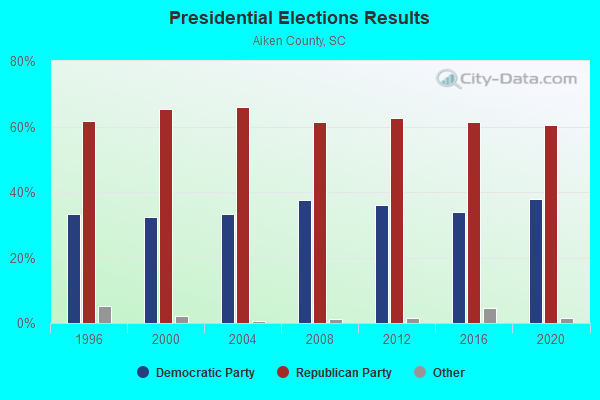
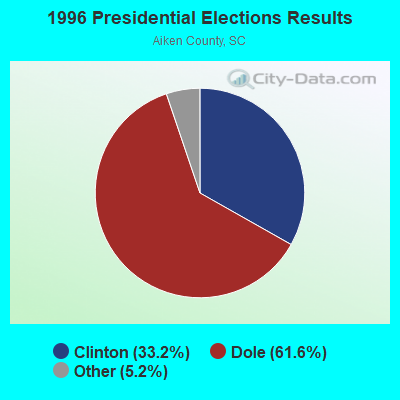
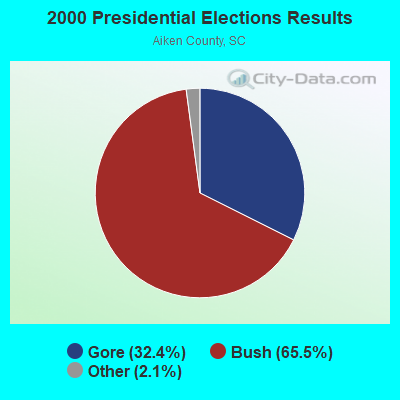
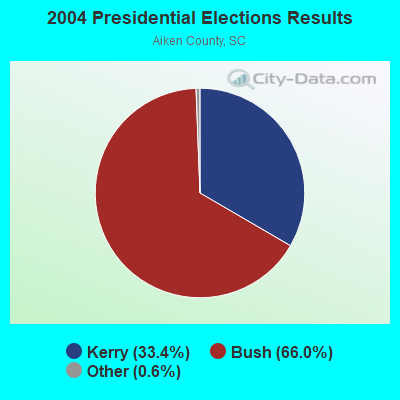
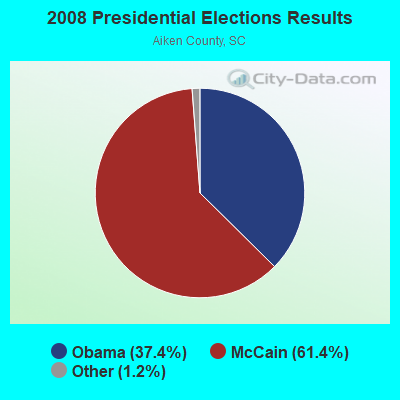
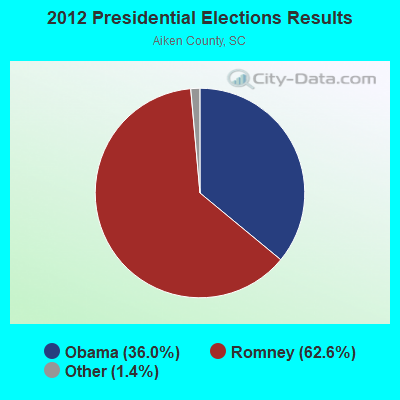


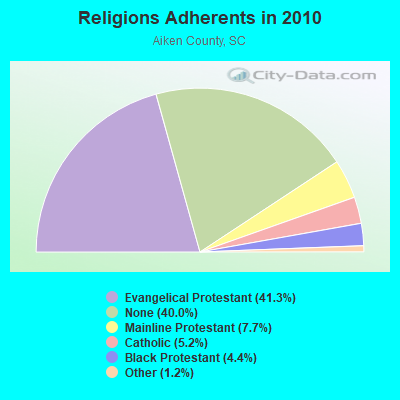
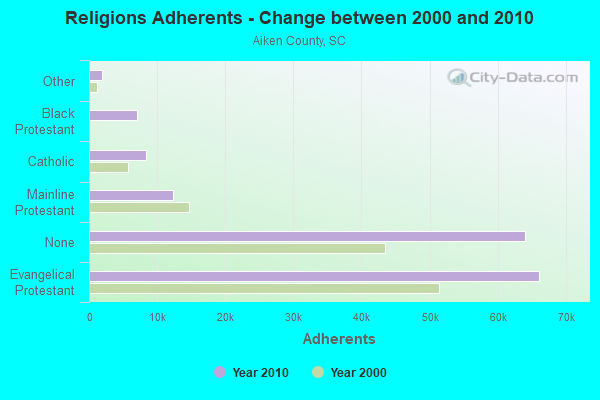
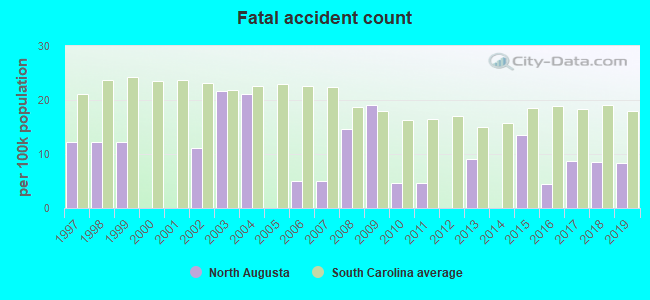
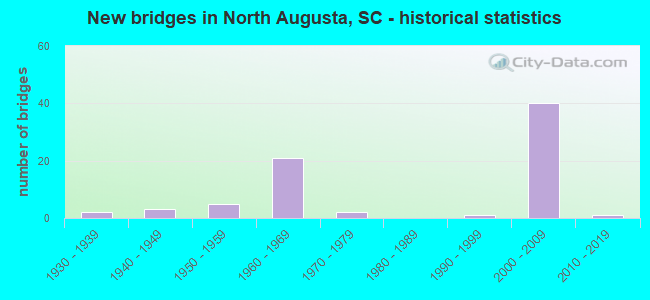
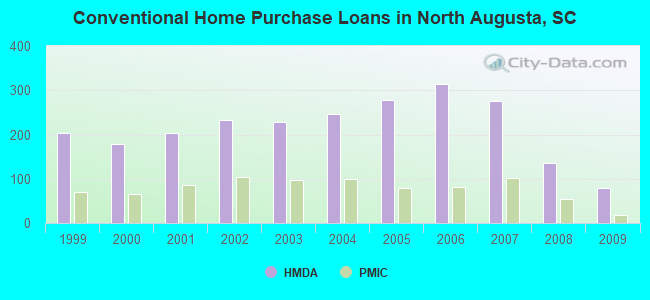
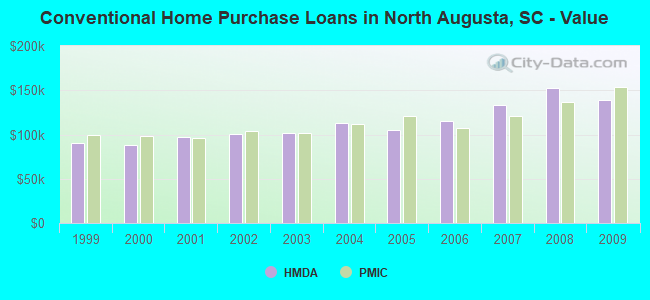
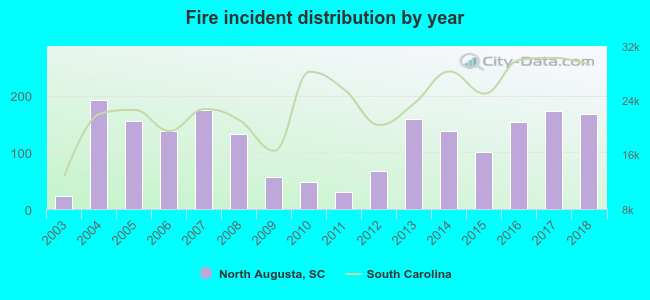 According to the data from the years 2003 - 2018 the average number of fires per year is 119. The highest number of fire incidents - 192 took place in 2004, and the least - 23 in 2003. The data has a growing trend.
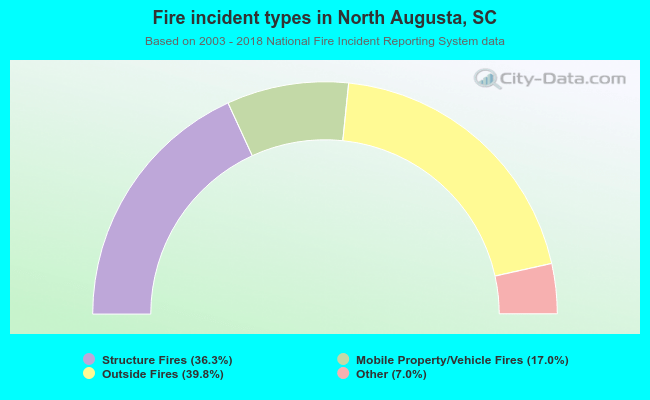 When looking into fire subcategories, the most reports belonged to: Outside Fires (39.8%), and Structure Fires (36.3%).