Oakland, Missouri
Submit your own pictures of this city and show them to the world
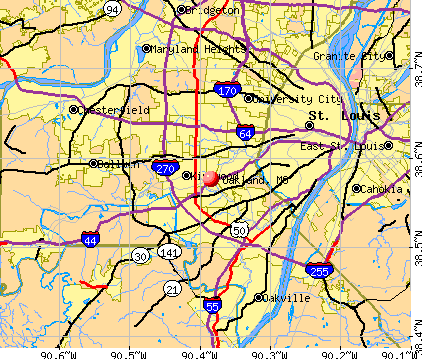
- OSM Map
- General Map
- Google Map
- MSN Map
Population change since 2000: -10.6%
 |
| Males: 632 | |
| Females: 744 |
| Median resident age: | 54.3 years |
| Missouri median age: | 39.1 years |
Zip codes: 63122.
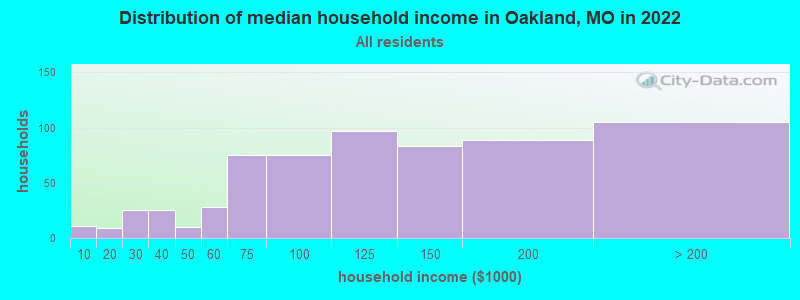
| Oakland: | $109,709 |
| MO: | $64,811 |
Estimated per capita income in 2022: $54,469 (it was $27,583 in 2000)
Oakland city income, earnings, and wages data
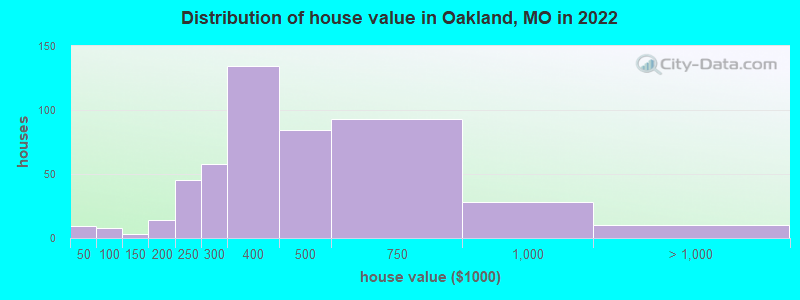
Estimated median house or condo value in 2022: $399,205 (it was $156,100 in 2000)
| Oakland: | $399,205 |
| MO: | $221,200 |
Mean prices in 2022: all housing units: $358,067; detached houses: $366,962; townhouses or other attached units: $296,938; in 2-unit structures: $604,192; in 3-to-4-unit structures: $176,513; in 5-or-more-unit structures: $232,155; mobile homes: $53,172; occupied boats, rvs, vans, etc.: $57,482
Median gross rent in 2022: $1,481.
(3.8% for White Non-Hispanic residents, 5.7% for Black residents, 20.0% for Hispanic or Latino residents, 2.9% for two or more races residents)
Detailed information about poverty and poor residents in Oakland, MO
Compare current foreclosures near Oakland, MO:
| Photo | Address | Area | Beds / Baths | Price | Details |
|---|---|---|---|---|---|

|
#1
E Milton Ave
Saint Louis, MO 63114
|
1,325 sq. feet
|
1 baths 2 beds |
$188,000
|
show details |

|
#2
Willow Wren Ct Unit 308
Florissant, MO 63033
|
955 sq. feet
|
2 baths 2 beds |
$78,000
|
show details |

|
#3
Grants Pkwy
Florissant, MO 63031
|
986 sq. feet
|
1 baths 3 beds |
$167,000
|
show details |

|
#4
Hannover Ave
Saint Louis, MO 63123
|
912 sq. feet
|
1 baths 2 beds |
$159,900
|
show details |

|
#5
Rosewood Ave
Saint Louis, MO 63120
|
1,152 sq. feet
|
1 baths 2 beds |
$129,000
|
show details |

|
#6
Miami St
Saint Louis, MO 63118
|
3,732 sq. feet
|
4 baths 4 beds |
$89,900
|
show details |

|
#7
Ridge Ave
Saint Louis, MO 63113
|
1,868 sq. feet
|
2 baths 6 beds |
$114,900
|
show details |

|
#8
Mallet Hl
Ballwin, MO 63021
|
4,530 sq. feet
|
4 baths 5 beds |
$649,900
|
show details |

|
#9
Canton Ave
Saint Louis, MO 63130
|
1,516 sq. feet
|
1 baths 3 beds |
$179,900
|
show details |

|
#10
Saint Charles St Apt 801
Saint Louis, MO 63101
|
1,688 sq. feet
|
2 baths 1 beds |
$154,900
|
show details |
| Photo | Address | Area | Beds / Baths | Price | Details |
|---|---|---|---|---|---|

|
#11
Marietta Dr
Florissant, MO 63033
|
1,863 sq. feet
|
2 baths 3 beds |
$168,000
|
show details |

|
#12
Old State Route 21
Imperial, MO 63052
|
1,763 sq. feet
|
2 baths 3 beds |
$159,900
|
show details |

|
#13
Idaho Ave
Saint Louis, MO 63111
|
979 sq. feet
|
1 baths 2 beds |
$132,900
|
show details |

|
#14
Adelaide Ave
Saint Louis, MO 63115
|
1,890 sq. feet
|
1 baths 4 beds |
$27,500
|
show details |

|
#15
Concord Pl
Saint Louis, MO 63147
|
768 sq. feet
|
1 baths 2 beds |
$62,000
|
show details |

|
#16
Bagley Dr
Saint Louis, MO 63136
|
982 sq. feet
|
1 baths 2 beds |
$125,000
|
show details |

|
#17
Connor Rd
House Springs, MO 63051
|
1,076 sq. feet
|
2 baths 3 beds |
$227,000
|
show details |

|
#18
Kingston Dr
Saint Louis, MO 63125
|
1,108 sq. feet
|
1 baths 2 beds |
$189,900
|
show details |

|
#19
3rd St
Madison, IL 62060
|
1,232 sq. feet
|
1 baths 3 beds |
$24,900
|
show details |

|
#20
Louisiana Ave
Saint Louis, MO 63118
|
2,360 sq. feet
|
2 baths 2 beds |
$187,000
|
show details |
| Photo | Address | Area | Beds / Baths | Price | Details |
|---|---|---|---|---|---|

|
#21
Deer St
Saint Louis, MO 63113
|
1,646 sq. feet
|
1 baths 3 beds |
$250,000
|
show details |

|
#22
Jerries Ln
Saint Louis, MO 63136
|
1,380 sq. feet
|
1 baths 3 beds |
$229,000
|
show details |

|
#23
Hodiamont Ave # E4
Saint Louis, MO 63112
|
1 sq. feet
|
2 baths 2 beds |
$175,000
|
show details |

|
#24
Saint Norbert Dr
East Saint Louis, IL 62206
|
1,232 sq. feet
|
1 baths 3 beds |
$1
|
show details |

|
#25
Oregon Ave
Saint Louis, MO 63118
|
1,782 sq. feet
|
2 baths - beds |
$12,000
|
show details |

|
#26
Le Pere School Rd
Millstadt, IL 62260
|
- sq. feet
|
1 baths 2 beds |
$57,750
|
show details |

|
#27
Hamilton Ave
Saint Louis, MO 63136
|
832 sq. feet
|
1 baths 2 beds |
$17,900
|
show details |

|
#28
Majella Dr
Bridgeton, MO 63044
|
- sq. feet
|
1 baths 3 beds |
$88,400
|
show details |

|
#29
Edwards St
Granite City, IL 62040
|
828 sq. feet
|
- baths 2 beds |
$39,900
|
show details |

|
#30
Summit Pl
Saint Louis, MO 63136
|
1,039 sq. feet
|
1 baths - beds |
$15,900
|
show details |
| Photo | Address | Area | Beds / Baths | Price | Details |
|---|---|---|---|---|---|

|
#31
Paris Ave
Saint Louis, MO 63115
|
1,650 sq. feet
|
1 baths - beds |
$24,900
|
show details |

|
#32
Bexley Station Dr # 8j
Saint Louis, MO 63123
|
951 sq. feet
|
2 baths 2 beds |
show details | |

|
#33
S Spring Ave
Saint Louis, MO 63116
|
1,592 sq. feet
|
1 baths 3 beds |
show details | |

|
#34
Grover St
Saint Louis, MO 63112
|
792 sq. feet
|
1 baths - beds |
$12,000
|
show details |

|
#35
Northland Pl
Saint Louis, MO 63113
|
1,736 sq. feet
|
1 baths - beds |
$23,900
|
show details |

|
#36
Sundale Ct
Eureka, MO 63025
|
2,604 sq. feet
|
3 baths 4 beds |
show details | |

|
#37
Spruce St
Granite City, IL 62040
|
1,120 sq. feet
|
1 baths 2 beds |
show details | |

|
#38
N 72nd St
East Saint Louis, IL 62203
|
720 sq. feet
|
1 baths 2 beds |
show details | |

|
#39
Hentschel Pl
Saint Louis, MO 63135
|
1,305 sq. feet
|
1 baths 2 beds |
show details | |

|
#40
Butler Dr
Eureka, MO 63025
|
966 sq. feet
|
1 baths 3 beds |
show details |
| Photo | Address | Area | Beds / Baths | Price | Details |
|---|---|---|---|---|---|

|
#41
Lisette Ave
Saint Louis, MO 63109
|
1,932 sq. feet
|
1 baths 4 beds |
show details | |

|
#42
-11 St Louis Ave
Saint Louis, MO 63120
|
3,524 sq. feet
|
4 baths 4 beds |
show details | |

|
#43
Eichelberger St
Saint Louis, MO 63116
|
1,080 sq. feet
|
2 baths 3 beds |
show details | |

|
#44
Dover Trace Dr
Fenton, MO 63026
|
4,046 sq. feet
|
4 baths 4 beds |
show details | |

|
#45
Astoria Dr
Saint Louis, MO 63137
|
982 sq. feet
|
1 baths 2 beds |
show details | |

|
#46
Sheridan Ave
Granite City, IL 62040
|
1,124 sq. feet
|
1 baths 3 beds |
show details | |

|
#47
Dammert Ave
Saint Louis, MO 63125
|
448 sq. feet
|
1 baths 1 beds |
show details | |

|
#48
Hubert Dr
Saint Louis, MO 63125
|
- sq. feet
|
2 baths 4 beds |
show details | |

|
#49
Ashland Ave
Saint Louis, MO 63115
|
1,726 sq. feet
|
1 baths 3 beds |
show details | |

|
Check over 1 million property listings on Foreclosure.com!
|
browse all offers | |||


- 1,44289.2%White alone
- 855.3%Black alone
- 412.5%Two or more races
- 150.9%Hispanic
- 110.7%Asian alone
- 80.5%Other race alone
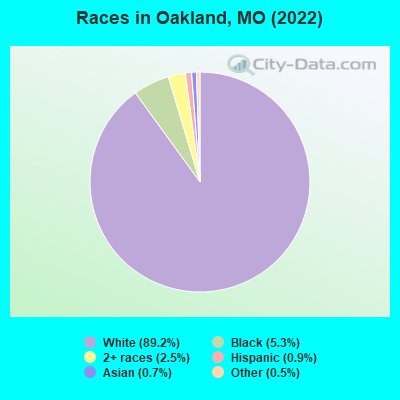
Races in Oakland detailed stats: ancestries, foreign born residents, place of birth
Type |
2009 |
2010 |
2011 |
2012 |
2013 |
2014 |
2015 |
2016 |
2017 |
2018 |
2019 |
2020 |
2021 |
2022 |
|---|---|---|---|---|---|---|---|---|---|---|---|---|---|---|
| Murders (per 100,000) | 0 (0.0) | 0 (0.0) | 0 (0.0) | 0 (0.0) | 0 (0.0) | 0 (0.0) | 0 (0.0) | 0 (0.0) | 0 (0.0) | 0 (0.0) | 0 (0.0) | 0 (0.0) | 0 (0.0) | 0 (0.0) |
| Rapes (per 100,000) | 0 (0.0) | 0 (0.0) | 0 (0.0) | 0 (0.0) | 0 (0.0) | 0 (0.0) | 0 (0.0) | 0 (0.0) | 0 (0.0) | 0 (0.0) | 0 (0.0) | 1 (73.2) | 0 (0.0) | 0 (0.0) |
| Robberies (per 100,000) | 0 (0.0) | 0 (0.0) | 0 (0.0) | 0 (0.0) | 0 (0.0) | 1 (72.4) | 1 (72.5) | 1 (72.4) | 0 (0.0) | 0 (0.0) | 0 (0.0) | 0 (0.0) | 0 (0.0) | 0 (0.0) |
| Assaults (per 100,000) | 1 (64.2) | 0 (0.0) | 0 (0.0) | 1 (72.3) | 2 (145.1) | 2 (144.8) | 0 (0.0) | 1 (72.4) | 1 (72.7) | 0 (0.0) | 1 (72.6) | 1 (73.2) | 0 (0.0) | 0 (0.0) |
| Burglaries (per 100,000) | 5 (321.1) | 4 (289.6) | 1 (72.2) | 0 (0.0) | 0 (0.0) | 1 (72.4) | 0 (0.0) | 0 (0.0) | 2 (145.5) | 0 (0.0) | 0 (0.0) | 0 (0.0) | 1 (72.7) | 0 (0.0) |
| Thefts (per 100,000) | 10 (642.3) | 16 (1,159) | 16 (1,154) | 2 (144.6) | 1 (72.6) | 2 (144.8) | 2 (145.0) | 9 (651.2) | 3 (218.2) | 11 (804.1) | 6 (435.4) | 5 (366.0) | 7 (509.1) | 7 (510.9) |
| Auto thefts (per 100,000) | 0 (0.0) | 0 (0.0) | 0 (0.0) | 0 (0.0) | 1 (72.6) | 1 (72.4) | 0 (0.0) | 0 (0.0) | 0 (0.0) | 0 (0.0) | 1 (72.6) | 1 (73.2) | 2 (145.5) | 1 (73.0) |
| Arson (per 100,000) | 0 (0.0) | 2 (144.8) | 1 (72.2) | 0 (0.0) | 0 (0.0) | 0 (0.0) | 0 (0.0) | 0 (0.0) | 0 (0.0) | 0 (0.0) | 0 (0.0) | 0 (0.0) | 0 (0.0) | 0 (0.0) |
| City-Data.com crime index | 61.0 | 66.6 | 51.2 | 20.2 | 37.7 | 67.3 | 27.6 | 62.2 | 33.5 | 32.2 | 37.7 | 93.7 | 37.1 | 26.3 |
The City-Data.com crime index weighs serious crimes and violent crimes more heavily. Higher means more crime, U.S. average is 246.1. It adjusts for the number of visitors and daily workers commuting into cities.
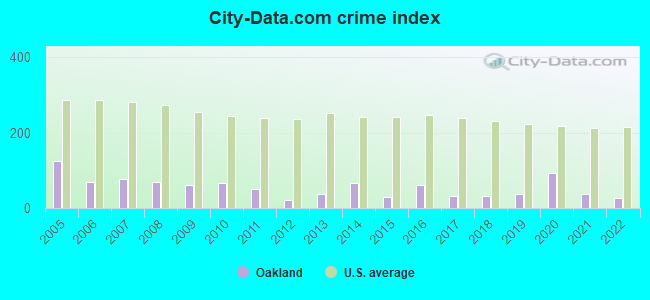
Crime rate in Oakland detailed stats: murders, rapes, robberies, assaults, burglaries, thefts, arson
Full-time law enforcement employees in 2020, including police officers: 88 (60 officers - 57 male; 3 female).
| Officers per 1,000 residents here: | 43.92 |
| Missouri average: | 2.53 |
 Recent articles from our blog. Our writers, many of them Ph.D. graduates or candidates, create easy-to-read articles on a wide variety of topics.

 | New Royals Stadium (59 replies) |
| What makes Missouri "Misery"? (109 replies) |
| St. Louis to remove Confederate monument (485 replies) |
| Best Driving Route Home? Oakland Ave (6 replies) |
| How much did the rams leaving, hurt the city? (55 replies) |
| Rams are gone. Once again, St. Louis is not an NFL (119 replies) |
Latest news from Oakland, MO collected exclusively by city-data.com from local newspapers, TV, and radio stations
Ancestries: American (22.5%), German (21.3%), Irish (13.3%), English (5.1%), Scottish (4.6%), European (3.8%).
Current Local Time: CST time zone
Incorporated in 1920
Elevation: 616 feet
Land area: 0.60 square miles.
Population density: 2,275 people per square mile (low).
34 residents are foreign born (1.4% Europe, 0.4% Latin America).
| This city: | 2.1% |
| Missouri: | 4.2% |
Median real estate property taxes paid for housing units with mortgages in 2022: $3,948 (0.9%)
Median real estate property taxes paid for housing units with no mortgage in 2022: $4,208 (1.1%)
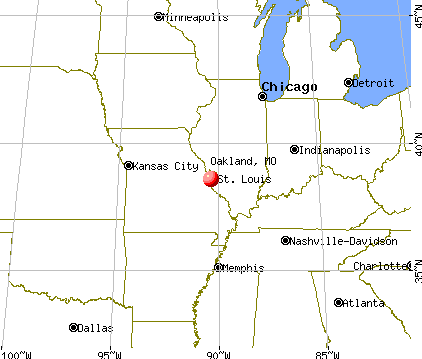
Nearest city with pop. 50,000+: St. Louis, MO  (8.5 miles , pop. 348,189).
Nearest city with pop. 1,000,000+: Chicago, IL (267.2 miles , pop. 2,896,016).
Nearest cities:
), ), ), ), )Latitude: 38.58 N, Longitude: 90.38 W
Area code commonly used in this area: 314
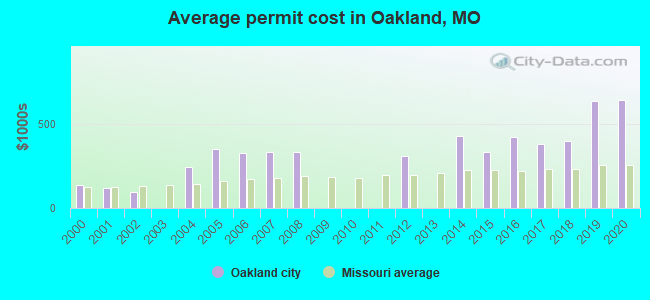
Property values in Oakland, MO
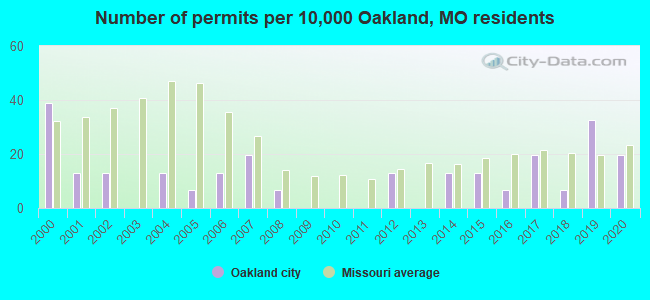
Single-family new house construction building permits:
- 2020: 3 buildings, average cost: $641,700
- 2019: 5 buildings, average cost: $634,000
- 2018: 1 building, cost: $395,000
- 2017: 3 buildings, average cost: $376,700
- 2016: 1 building, cost: $420,000
- 2015: 2 buildings, average cost: $331,000
- 2014: 2 buildings, average cost: $425,000
- 2012: 2 buildings, average cost: $307,500
- 2008: 1 building, cost: $335,000
- 2007: 3 buildings, average cost: $335,000
- 2006: 2 buildings, average cost: $327,500
- 2005: 1 building, cost: $350,000
- 2004: 2 buildings, average cost: $244,500
- 2002: 2 buildings, average cost: $92,000
- 2001: 2 buildings, average cost: $120,000
- 2000: 6 buildings, average cost: $135,000
| Here: | 2.7% |
| Missouri: | 2.8% |
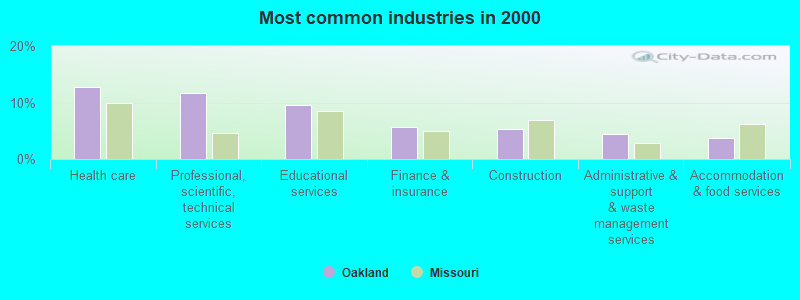
- Health care (12.8%)
- Professional, scientific, technical services (11.8%)
- Educational services (9.6%)
- Finance & insurance (5.7%)
- Construction (5.4%)
- Administrative & support & waste management services (4.4%)
- Accommodation & food services (3.7%)
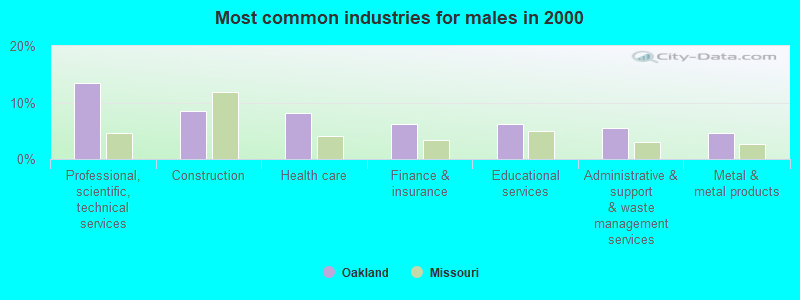
- Professional, scientific, technical services (13.4%)
- Construction (8.5%)
- Health care (8.2%)
- Finance & insurance (6.2%)
- Educational services (6.2%)
- Administrative & support & waste management services (5.6%)
- Metal & metal products (4.6%)
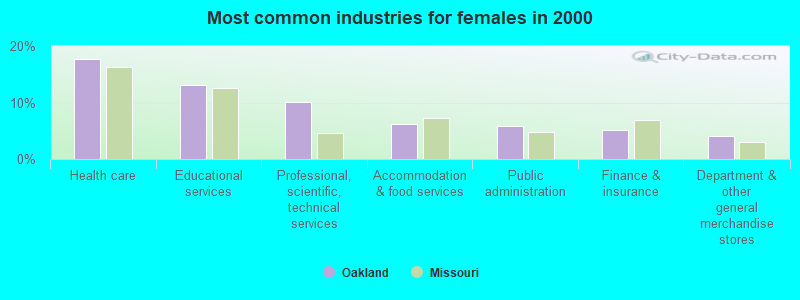
- Health care (17.6%)
- Educational services (13.1%)
- Professional, scientific, technical services (10.0%)
- Accommodation & food services (6.2%)
- Public administration (5.9%)
- Finance & insurance (5.2%)
- Department & other general merchandise stores (4.2%)
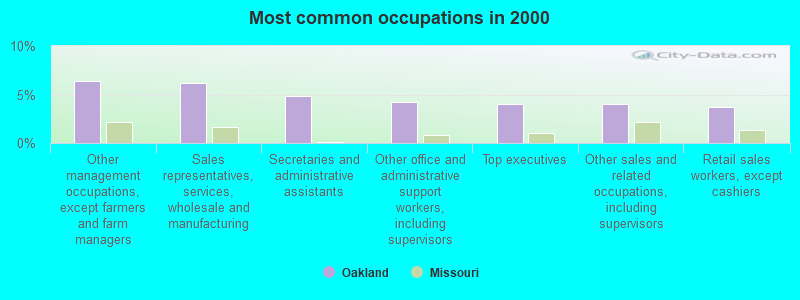
- Other management occupations, except farmers and farm managers (6.4%)
- Sales representatives, services, wholesale and manufacturing (6.2%)
- Secretaries and administrative assistants (4.9%)
- Other office and administrative support workers, including supervisors (4.2%)
- Top executives (4.0%)
- Other sales and related occupations, including supervisors (4.0%)
- Retail sales workers, except cashiers (3.7%)
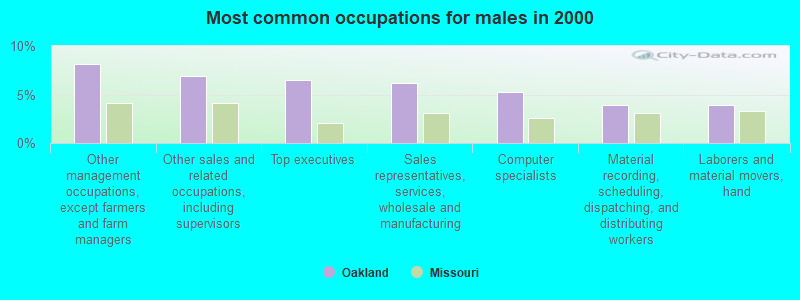
- Other management occupations, except farmers and farm managers (8.2%)
- Other sales and related occupations, including supervisors (6.9%)
- Top executives (6.5%)
- Sales representatives, services, wholesale and manufacturing (6.2%)
- Computer specialists (5.2%)
- Material recording, scheduling, dispatching, and distributing workers (3.9%)
- Laborers and material movers, hand (3.9%)
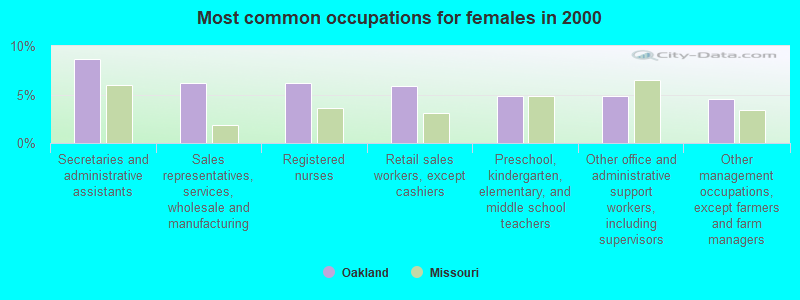
- Secretaries and administrative assistants (8.7%)
- Sales representatives, services, wholesale and manufacturing (6.2%)
- Registered nurses (6.2%)
- Retail sales workers, except cashiers (5.9%)
- Preschool, kindergarten, elementary, and middle school teachers (4.8%)
- Other office and administrative support workers, including supervisors (4.8%)
- Other management occupations, except farmers and farm managers (4.5%)
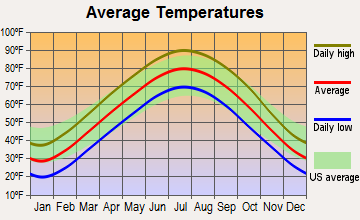
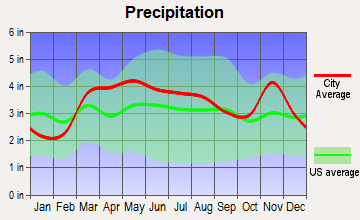
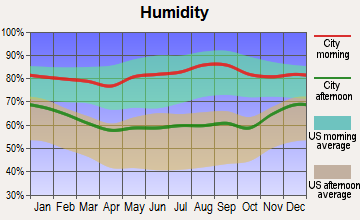
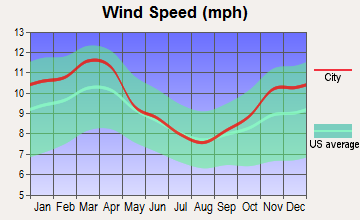
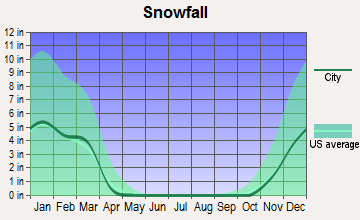
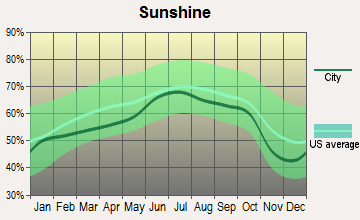
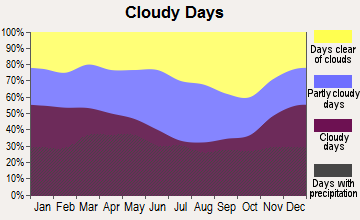
Average climate in Oakland, Missouri
Based on data reported by over 4,000 weather stations
(lower is better)
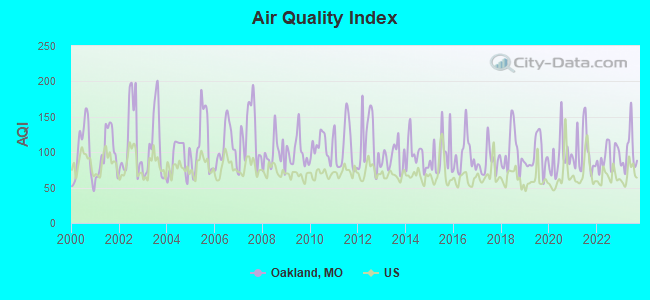
Air Quality Index (AQI) level in 2023 was 99.6. This is worse than average.
| City: | 99.6 |
| U.S.: | 72.6 |
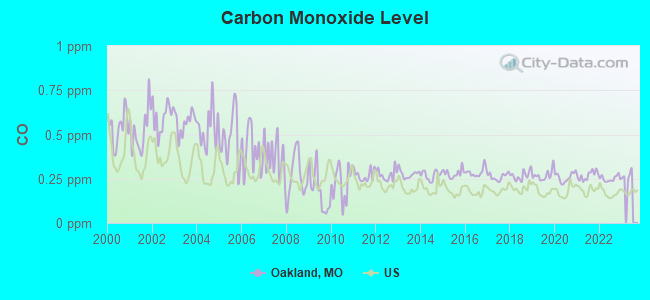
Carbon Monoxide (CO) [ppm] level in 2022 was 0.251. This is about average. Closest monitor was 1.8 miles away from the city center.
| City: | 0.251 |
| U.S.: | 0.251 |
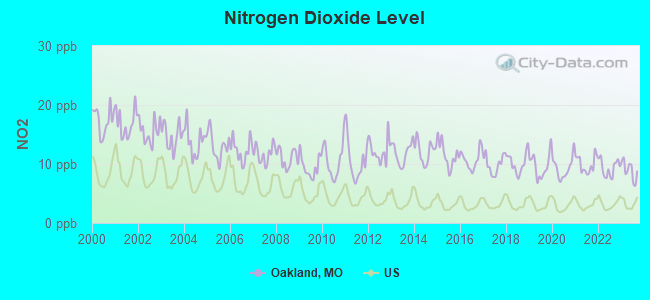
Nitrogen Dioxide (NO2) [ppb] level in 2023 was 8.92. This is significantly worse than average. Closest monitor was 1.8 miles away from the city center.
| City: | 8.92 |
| U.S.: | 5.11 |
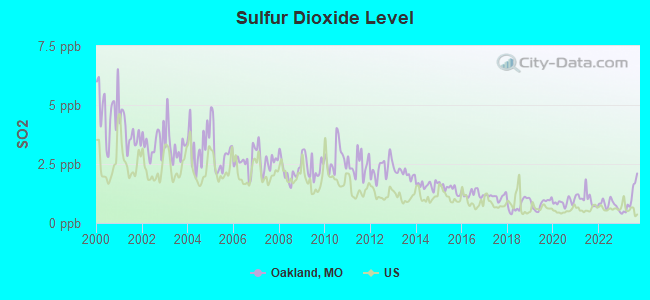
Sulfur Dioxide (SO2) [ppb] level in 2023 was 1.02. This is significantly better than average. Closest monitor was 3.0 miles away from the city center.
| City: | 1.02 |
| U.S.: | 1.51 |
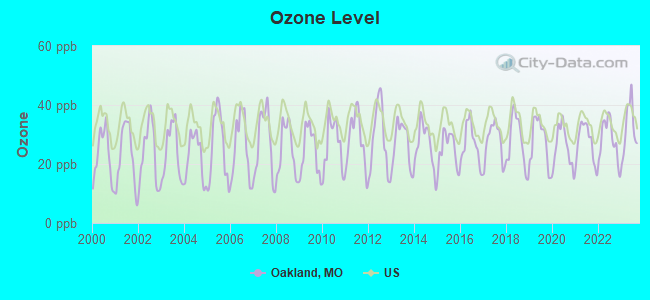
Ozone [ppb] level in 2023 was 32.1. This is about average. Closest monitor was 1.8 miles away from the city center.
| City: | 32.1 |
| U.S.: | 33.3 |
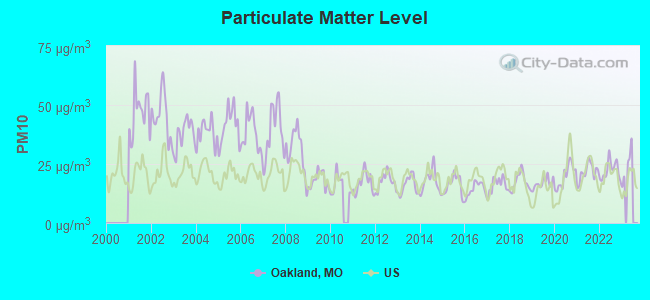
Particulate Matter (PM10) [µg/m3] level in 2022 was 22.2. This is about average. Closest monitor was 4.3 miles away from the city center.
| City: | 22.2 |
| U.S.: | 19.2 |
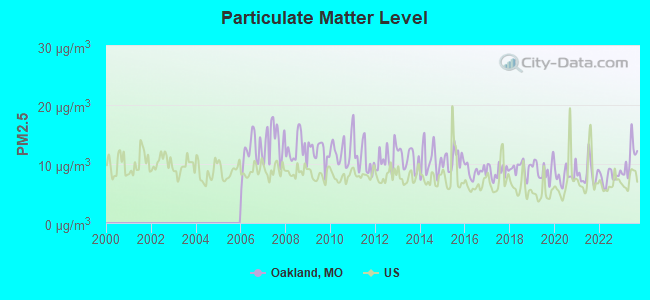
Particulate Matter (PM2.5) [µg/m3] level in 2023 was 10.9. This is worse than average. Closest monitor was 3.0 miles away from the city center.
| City: | 10.9 |
| U.S.: | 8.1 |
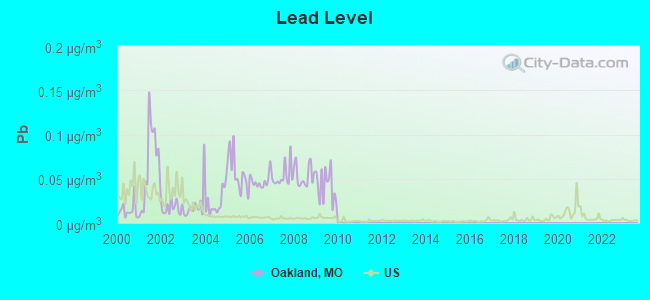
Lead (Pb) [µg/m3] level in 2009 was 0.0422. This is significantly worse than average. Closest monitor was 3.0 miles away from the city center.
| City: | 0.0422 |
| U.S.: | 0.0093 |
Tornado activity:
Oakland-area historical tornado activity is near Missouri state average. It is 77% greater than the overall U.S. average.
On 1/24/1967, a category F4 (max. wind speeds 207-260 mph) tornado 11.5 miles away from the Oakland city center killed 3 people and injured 216 people and caused between $5,000,000 and $50,000,000 in damages.
On 2/10/1959, a category F4 tornado 12.1 miles away from the city center killed 21 people and injured 345 people and caused between $5,000,000 and $50,000,000 in damages.
Earthquake activity:
Oakland-area historical earthquake activity is significantly above Missouri state average. It is 323% greater than the overall U.S. average.On 4/18/2008 at 09:36:59, a magnitude 5.4 (5.1 MB, 4.8 MS, 5.4 MW, 5.2 MW, Class: Moderate, Intensity: VI - VII) earthquake occurred 135.5 miles away from Oakland center
On 4/18/2008 at 09:36:59, a magnitude 5.2 (5.2 MW, Depth: 8.9 mi) earthquake occurred 135.5 miles away from Oakland center
On 9/26/1990 at 13:18:51, a magnitude 5.0 (4.7 MB, 4.8 LG, 5.0 LG, Depth: 7.7 mi) earthquake occurred 107.9 miles away from the city center
On 6/10/1987 at 23:48:54, a magnitude 5.1 (4.9 MB, 4.4 MS, 4.6 MS, 5.1 LG) earthquake occurred 136.0 miles away from the city center
On 5/4/1991 at 01:18:54, a magnitude 5.0 (4.4 MB, 4.6 LG, 5.0 LG, Depth: 3.1 mi) earthquake occurred 142.5 miles away from Oakland center
On 6/18/2002 at 17:37:15, a magnitude 5.0 (4.3 MB, 4.6 MW, 5.0 LG) earthquake occurred 147.2 miles away from Oakland center
Magnitude types: regional Lg-wave magnitude (LG), body-wave magnitude (MB), surface-wave magnitude (MS), moment magnitude (MW)
Natural disasters:
The number of natural disasters in St. Louis County (2) is a lot smaller than the US average (15).Causes of natural disasters: Flood: 1, Storm: 1, Tornado: 1, Wind: 1, Other: 1 (Note: some incidents may be assigned to more than one category).
Hospitals and medical centers near Oakland:
- BETHESDA DILWORTH (Nursing Home, about 1 miles away; SAINT LOUIS, MO)
- FIRST STEPS PEDIATRICS HOME HEALTH (Home Health Center, about 1 miles away; SAINT LOUIS, MO)
- ST LOUIS HOME HEALTH (Home Health Center, about 1 miles away; SAINT LOUIS, MO)
- MANOR GROVE, INCORPORATED (Nursing Home, about 2 miles away; KIRKWOOD, MO)
- CRESTWOOD DIALYSIS (Dialysis Facility, about 2 miles away; SAINT LOUIS, MO)
- ALGONQUIN NURSES HOME HEALTH CARE, INC (Home Health Center, about 2 miles away; ST. LOUIS, MO)
- ABERDEEN HEIGHTS (Nursing Home, about 3 miles away; KIRKWOOD, MO)
Amtrak stations near Oakland:
- 2 miles: KIRKWOOD (110 W. ARGONNE RD.) . Services: ticket office, partially wheelchair accessible, enclosed waiting area, public restrooms, public payphones, free short-term parking, free long-term parking, taxi stand, intercity bus service, public transit connection.
- 11 miles: ST. LOUIS (550 S. 16TH ST.) . Services: ticket office, partially wheelchair accessible, enclosed waiting area, public restrooms, public payphones, vending machines, free short-term parking, free long-term parking, call for car rental service, taxi stand.
Colleges/universities with over 2000 students nearest to Oakland:
- Webster University (about 3 miles; Saint Louis, MO; Full-time enrollment: 12,406)
- Missouri Baptist University (about 7 miles; Saint Louis, MO; FT enrollment: 2,898)
- Washington University in St Louis (about 7 miles; Saint Louis, MO; FT enrollment: 10,823)
- Maryville University of Saint Louis (about 9 miles; Saint Louis, MO; FT enrollment: 3,651)
- Ranken Technical College (about 10 miles; Saint Louis, MO; FT enrollment: 2,134)
- Saint Louis University (about 10 miles; Saint Louis, MO; FT enrollment: 11,606)
- University of Missouri-St Louis (about 11 miles; Saint Louis, MO; FT enrollment: 10,322)
Points of interest:
Notable location: Westborough Country Club (A). Display/hide its location on the map
Church in Oakland: Webster Groves Christian Church Disciples of Christ (A). Display/hide its location on the map
| This city: | 2.4 people |
| Missouri: | 2.5 people |
| This city: | 71.7% |
| Whole state: | 65.3% |
| This city: | 3.1% |
| Whole state: | 6.7% |
Likely homosexual households (counted as self-reported same-sex unmarried-partner households)
- Lesbian couples: 0.9% of all households
- Gay men: 0.0% of all households
431 people in nursing homes in 2000
For population 15 years and over in Oakland:
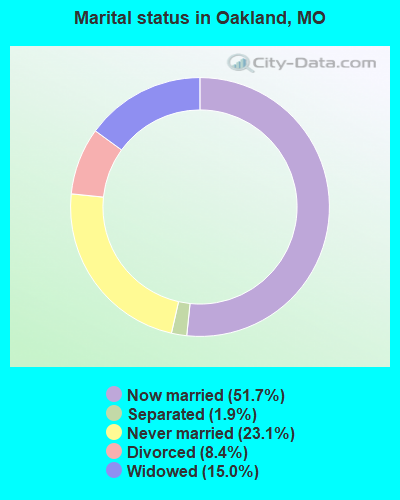
- Never married: 23.1%
- Now married: 51.7%
- Separated: 1.9%
- Widowed: 15.0%
- Divorced: 8.4%
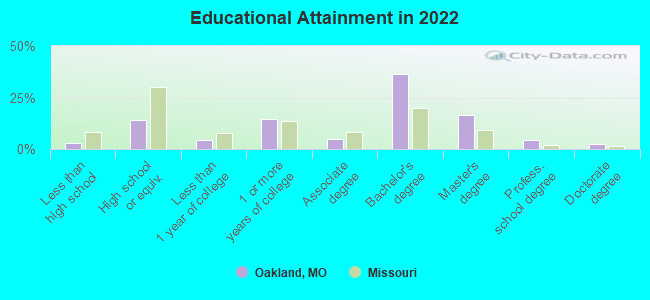
For population 25 years and over in Oakland:
- High school or higher: 96.7%
- Bachelor's degree or higher: 56.8%
- Graduate or professional degree: 22.5%
- Unemployed: 1.5%
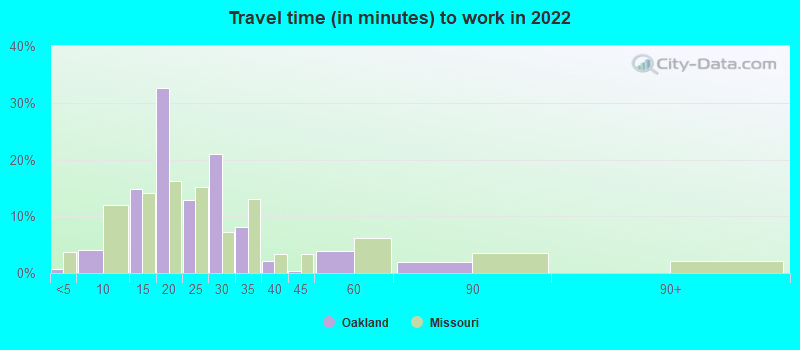
- Mean travel time to work (commute): 16.3 minutes
| Here: | 9.2 |
| Missouri average: | 11.1 |
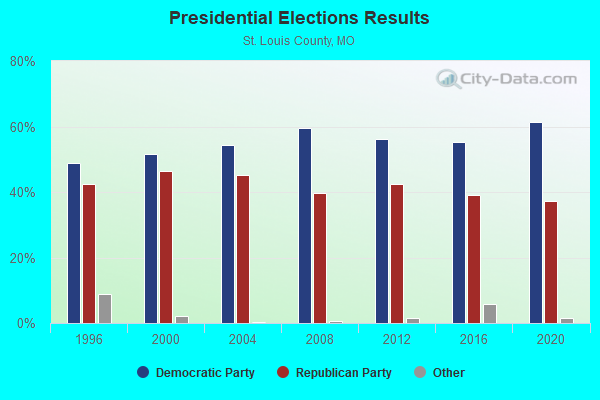
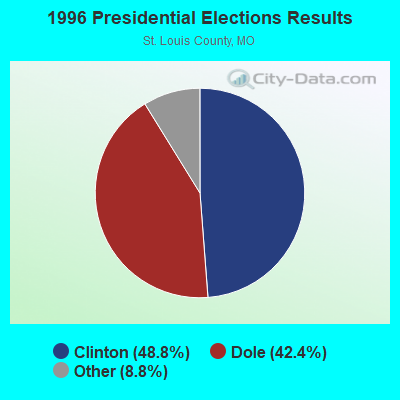
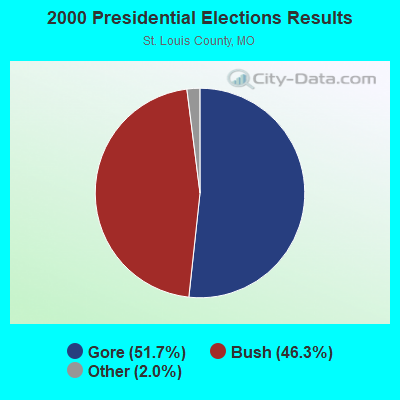
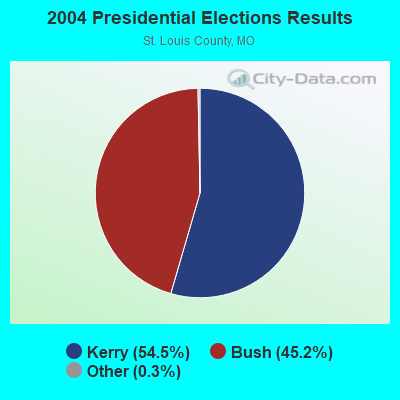
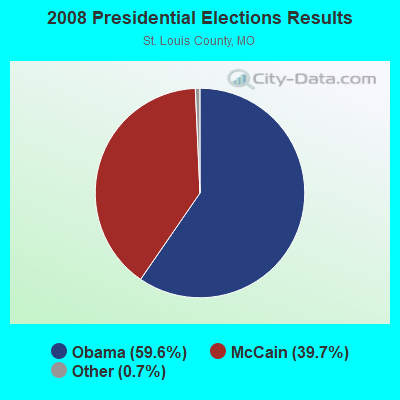
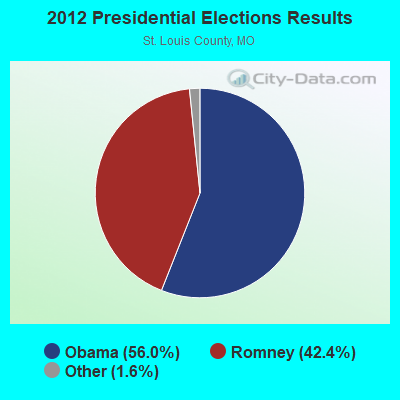
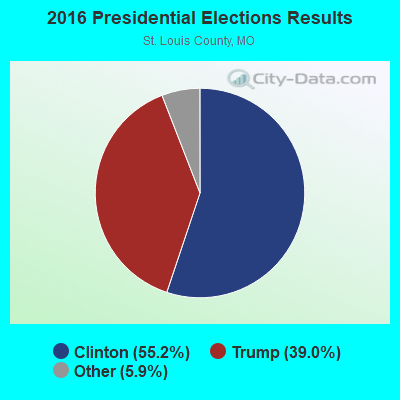
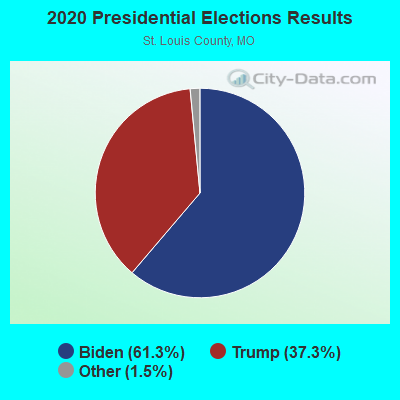
Graphs represent county-level data. Detailed 2008 Election Results
Religion statistics for Oakland, MO (based on St. Louis County data)
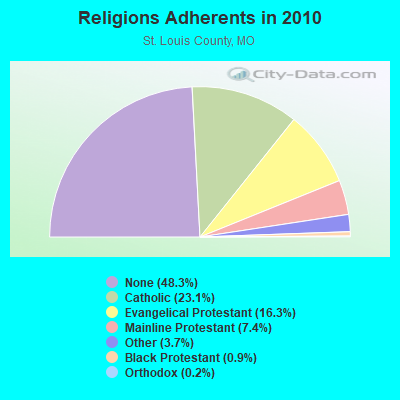
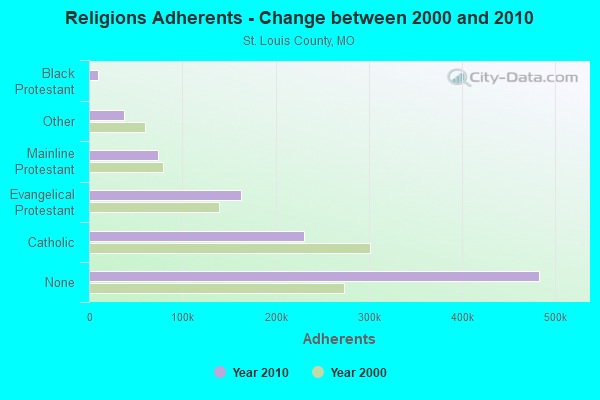
| Religion | Adherents | Congregations |
|---|---|---|
| Catholic | 230,488 | 74 |
| Evangelical Protestant | 162,614 | 384 |
| Mainline Protestant | 74,404 | 130 |
| Other | 37,156 | 87 |
| Black Protestant | 9,369 | 48 |
| Orthodox | 2,042 | 7 |
| None | 482,881 | - |
Food Environment Statistics:
| St. Louis County: | 1.77 / 10,000 pop. |
| Missouri: | 1.88 / 10,000 pop. |
| This county: | 0.09 / 10,000 pop. |
| State: | 0.18 / 10,000 pop. |
| Here: | 0.50 / 10,000 pop. |
| State: | 0.60 / 10,000 pop. |
| Here: | 2.95 / 10,000 pop. |
| Missouri: | 4.34 / 10,000 pop. |
| Here: | 6.87 / 10,000 pop. |
| Missouri: | 7.37 / 10,000 pop. |
| St. Louis County: | 8.6% |
| Missouri: | 8.8% |
| Here: | 28.0% |
| Missouri: | 29.6% |
| St. Louis County: | 11.9% |
| State: | 13.5% |
Health and Nutrition:
| Oakland: | 56.9% |
| Missouri: | 50.9% |
| Here: | 54.3% |
| Missouri: | 48.6% |
| Here: | 28.3 |
| Missouri: | 28.7 |
| This city: | 20.2% |
| Missouri: | 20.6% |
| Oakland: | 10.4% |
| Missouri: | 10.1% |
| This city: | 7.0 |
| Missouri: | 6.8 |
| Here: | 36.4% |
| State: | 34.3% |
| This city: | 60.3% |
| State: | 57.5% |
| This city: | 77.1% |
| State: | 79.3% |
More about Health and Nutrition of Oakland, MO Residents
| Local government employment and payroll (March 2022) | |||||
| Function | Full-time employees | Monthly full-time payroll | Average yearly full-time wage | Part-time employees | Monthly part-time payroll |
|---|---|---|---|---|---|
| Judicial and Legal | 0 | $0 | 1 | $1,362 | |
| Financial Administration | 0 | $0 | 1 | $526 | |
| Other Government Administration | 0 | $0 | 4 | $812 | |
| Totals for Government | 0 | $0 | 6 | $2,699 | |
Oakland government finances - Expenditure in 2017 (per resident):
- Construction - General - Other: $2,241,000 ($1628.63)
- Current Operations - General Public Buildings: $204,000 ($148.26)
Central Staff Services: $159,000 ($115.55)
Local Fire Protection: $78,000 ($56.69)
Police Protection: $78,000 ($56.69)
Regular Highways: $52,000 ($37.79)
Judicial and Legal Services: $41,000 ($29.80)
- Total Salaries and Wages: $102,000 ($74.13)
Oakland government finances - Revenue in 2017 (per resident):
- Charges - Other: $984,000 ($715.12)
- Local Intergovernmental - General Local Government Support: $135,000 ($98.11)
- Miscellaneous - Fines and Forfeits: $99,000 ($71.95)
Interest Earnings: $2,000 ($1.45)
- State Intergovernmental - General Local Government Support: $1,552,000 ($1127.91)
Highways: $39,000 ($28.34)
- Tax - General Sales and Gross Receipts: $335,000 ($243.46)
Property: $67,000 ($48.69)
Other: $64,000 ($46.51)
Other License: $52,000 ($37.79)
Public Utilities Sales: $39,000 ($28.34)
Tobacco Products Sales: $5,000 ($3.63)
Oakland government finances - Cash and Securities in 2017 (per resident):
- Other Funds - Cash and Securities: $1,765,000 ($1282.70)
5.97% of this county's 2021 resident taxpayers lived in other counties in 2020 ($70,859 average adjusted gross income)
| Here: | 5.97% |
| Missouri average: | 7.67% |
0.01% of residents moved from foreign countries ($97 average AGI)
St. Louis County: 0.01% Missouri average: 0.02%
Top counties from which taxpayers relocated into this county between 2020 and 2021:
| from St. Louis city, MO | |
| from St. Charles County, MO | |
| from Jefferson County, MO |
6.59% of this county's 2020 resident taxpayers moved to other counties in 2021 ($77,630 average adjusted gross income)
| Here: | 6.59% |
| Missouri average: | 7.51% |
0.01% of residents moved to foreign countries ($63 average AGI)
St. Louis County: 0.01% Missouri average: 0.01%
Top counties to which taxpayers relocated from this county between 2020 and 2021:
| to St. Louis city, MO | |
| to St. Charles County, MO | |
| to Jefferson County, MO |
Strongest AM radio stations in Oakland:
- KSIV (1320 AM; 5 kW; CLAYTON, MO; Owner: BOTT COMMUNICATIONS, INC.)
- KFUO (850 AM; 5 kW; CLAYTON, MO; Owner: LUTHERAN CHURCH-MISSOURI SYNOD)
- KMOX (1120 AM; 50 kW; ST. LOUIS, MO; Owner: INFINITY BROADCASTING OPERATIONS, INC.)
- KXEN (1010 AM; 50 kW; FESTUS-ST. LOUIS, MO; Owner: BDJ RADIO ENTERPRISES, LLC)
- KSLG (1380 AM; 5 kW; ST. LOUIS, MO; Owner: NEW HORIZON 7TH-DAY CHRISTIAN CHURCH, INC.)
- KTRS (550 AM; 5 kW; ST. LOUIS, MO; Owner: KTRS-AM LICENSE, L.L.C.)
- WRTH (1430 AM; 5 kW; ST. LOUIS, MO)
- KJSL (630 AM; 5 kW; ST. LOUIS, MO; Owner: WMUZ RADIO, INC.)
- WSDZ (1260 AM; 20 kW; BELLEVILLE, IL)
- KRFT (1190 AM; 10 kW; DE SOTO, MO; Owner: ALL SPORTS RADIO, LLC)
- KATZ (1600 AM; 5 kW; ST. LOUIS, MO; Owner: CITICASTERS LICENSES, L.P.)
- KIRL (1460 AM; 5 kW; ST. CHARLES, MO; Owner: BRONCO BROADCASTING CO., INC.)
- KSTL (690 AM; 1 kW; ST. LOUIS, MO; Owner: WMUZ RADIO, INC.)
Strongest FM radio stations in Oakland:
- KSD (93.7 FM; ST. LOUIS, MO; Owner: CITICASTERS LICENSES, L.P.)
- KWMU (90.7 FM; ST. LOUIS, MO; Owner: THE CURATORS OF THE UNIVERSITY OF MISSOURI)
- KSLZ (107.7 FM; ST. LOUIS, MO; Owner: CITICASTERS LICENSES, L.P.)
- KFUO-FM (99.1 FM; CLAYTON, MO; Owner: THE LUTHERAN CHURCH-MISSOURI SYNOD)
- KYKY (98.1 FM; ST. LOUIS, MO; Owner: INFINITY RADIO SUBSIDIARY OPERATIONS INC.)
- WSSM (106.5 FM; GRANITE CITY, IL; Owner: BONNEVILLE HOLDING COMPANY)
- KSHE (94.7 FM; CRESTWOOD, MO; Owner: EMMIS RADIO LICENSE CORPORATION)
- KEZK-FM (102.5 FM; ST. LOUIS, MO; Owner: INFINITY RADIO SUBSIDIARY OPERATIONS INC.)
- KIHT (96.3 FM; ST. LOUIS, MO; Owner: EMMIS RADIO LICENSE CORPORATION)
- KLOU (103.3 FM; ST. LOUIS, MO; Owner: CITICASTERS LICENSES, L.P.)
- WIL-FM (92.3 FM; ST. LOUIS, MO; Owner: BONNEVILLE HOLDING COMPANY)
- KSIV-FM (91.5 FM; ST. LOUIS, MO; Owner: COMMUNITY BROADCASTING, INC.)
- KDHX (88.1 FM; ST. LOUIS, MO; Owner: DOUBLE HELIX CORPORATION)
- KMJM-FM (104.9 FM; COLUMBIA, IL; Owner: CITICASTERS LICENSES, L.P.)
- KFTK-FM1 (97.1 FM; ST. LOUIS, MO; Owner: EMMIS RADIO LICENSE CORPORATION)
- KPNT (105.7 FM; ST. GENEVIEVE, MO; Owner: EMMIS RADIO LICENSE CORPORATION)
- KNLH (89.5 FM; CEDAR HILL, MO; Owner: NEW LIFE EVANGELISTIC CENTER, INC.)
- KWUR (90.3 FM; CLAYTON, MO; Owner: THE WASHINGTON UNIVERSITY)
- WSIE (88.7 FM; EDWARDSVILLE, IL; Owner: BOARD OF TRUSTEES, S. ILLINOIS UNIV.)
- WVRV (101.1 FM; EAST ST. LOUIS, IL; Owner: BONNEVILLE HOLDING COMPANY)
TV broadcast stations around Oakland:
- KSDK (Channel 5; ST. LOUIS, MO; Owner: MULTIMEDIA KSDK, INC.)
- KTVI (Channel 2; ST. LOUIS, MO; Owner: KTVI LICENSE, INC.)
- KPLR-TV (Channel 11; ST. LOUIS, MO; Owner: KPLR, INC.)
- KDNL-TV (Channel 30; ST. LOUIS, MO; Owner: KDNL LICENSEE, LLC)
- KPTN-LP (Channel 58; ST. LOUIS, MO; Owner: KURT J. PETERSEN)
- KMOV (Channel 4; ST. LOUIS, MO; Owner: KMOV-TV, INC.)
- K18BT (Channel 18; ST. LOUIS, MO; Owner: TRINITY BROADCASTING NETWORK)
- KETC (Channel 9; ST. LOUIS, MO; Owner: ST. LOUIS REGIONAL & EDUCATIONAL PUBLIC TV COMMISSION)
- K65FN (Channel 65; BATESVILLE, AR; Owner: MS COMMUNICATIONS, LLC)
- K40FF (Channel 40; ST. LOUIS, MO; Owner: EBC ST. LOUIS, INC.)
- WRBU (Channel 46; EAST ST. LOUIS, IL; Owner: ROBERTS BROADCASTING COMPANY)
- K49FC (Channel 49; ST. LOUIS, MO; Owner: THREE ANGELS BROADCASTING NETWORK)
- KNLC (Channel 24; ST. LOUIS, MO; Owner: NEW LIFE EVANGELISTIC CENTER, INC.)
- K64DT (Channel 64; ST. LOUIS, MO; Owner: WORD OF GOD FELLOWSHIP, INC.)
- K62EG (Channel 62; ST. LOUIS, MO; Owner: ETERNAL FAMILY NETWORK)
- K38HD (Channel 38; ST. LOUIS, MO; Owner: VENTANA TELEVISION, INC.)
- K63FW (Channel 63; JAMESTOWN, MO; Owner: ROGER E. HARDERS)
- K59GP (Channel 59; ST. CHARLES, MO; Owner: TRINITY BROADCASTING NETWORK)
- Oakland, Missouri
- Fatal accident count11
- Vehicles involved in fatal accidents15
- Fatal accidents involving drunk persons:3
- Fatalities12
- Persons involved in fatal accidents19
- Pedestrians involved in fatal accidents0
- Missouri average
- Fatal accident count10303
- Vehicles involved in fatal accidents15314
- Fatal accidents involving drunk persons3656
- Fatalities11609
- Persons involved in fatal accidents25377
- Pedestrians involved in fatal accidents795
- National Bridge Inventory (NBI) Statistics
- 7Number of bridges
- 52ft / 16.0mTotal length
- $560,000Total costs
- 224,801Total average daily traffic
- 26,544Total average daily truck traffic
FCC Registered Antenna Towers:
5- Peter Connolly, 106 Sappington Road (Lat: 38.582222 Lon: -90.386000), Type: 36.6, Overall height: 36.6 m, Registrant: Holland & Knight Law, LLP, Www.Hklaw.Com, , Washi-ngton, Phone: (202) 955-3000
- PETER M CONNOLLY, 106 Sappington Road (Lat: 38.582222 Lon: -90.386000), Type: 36.6, Overall height: 36.6 m, Registrant: Holland & Knight LLP, Pconnoll@hklaw.Com, , Washi-ngton, Phone: (202) 862-5989
- PETER CONNOLLY, 106 Sappington Road (Lat: 38.582222 Lon: -90.386000), Type: 36.6, Overall height: 36.6 m, Registrant: Holland & Knight LLP, Pconnoll@hklaw.Com, , Washi-ngton, Phone: (202) 862-5989
- STEVEN T CAMPBELL, 106 Sappington Road (Lat: 38.582222 Lon: -90.386000), Type: 36.6, Structure height: 29189 m, Overall height: 36.6 m, Registrant: Holland & Knight LLP, Peter.Connolly@hklaw.Com, , Washi-ngton, Phone: (202) 955-3000
- Cayla Gamble, 106 Sappington Road (Lat: 38.582222 Lon: -90.386000), Type: 36.6, Structure height: 29189 m, Overall height: 36.6 m, Registrant: Wilkinson Barker Knauer, LLP, Gwerner@wbklaw.Com, , Washi-ngton, Phone: (202) 383-3420
FCC Registered Amateur Radio Licenses:
1- Call Sign: N0JHT, Grant Date: 03/17/1998, Expiration Date: 03/17/2008, Cancellation Date: 03/18/2010, Registrant: Francis H Murphy, 706 Gray Oaks, Oakland, MO 63122
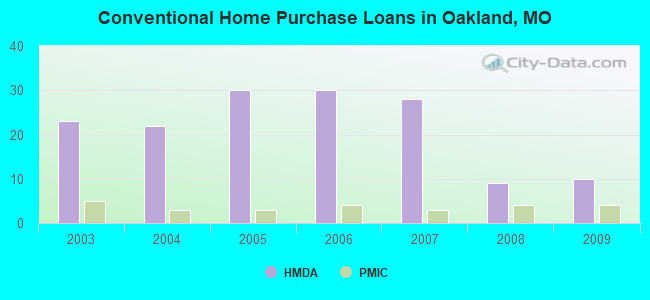
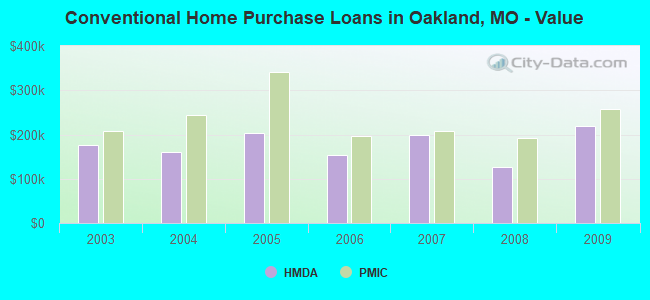
| Home Mortgage Disclosure Act Aggregated Statistics For Year 2009 (Based on 1 full tract) | ||||||||||
| A) FHA, FSA/RHS & VA Home Purchase Loans | B) Conventional Home Purchase Loans | C) Refinancings | D) Home Improvement Loans | F) Non-occupant Loans on < 5 Family Dwellings (A B C & D) | ||||||
|---|---|---|---|---|---|---|---|---|---|---|
| Number | Average Value | Number | Average Value | Number | Average Value | Number | Average Value | Number | Average Value | |
| LOANS ORIGINATED | 5 | $196,548 | 10 | $218,789 | 73 | $225,528 | 2 | $171,465 | 3 | $106,797 |
| APPLICATIONS APPROVED, NOT ACCEPTED | 0 | $0 | 0 | $0 | 10 | $246,126 | 0 | $0 | 1 | $286,100 |
| APPLICATIONS DENIED | 0 | $0 | 2 | $254,750 | 19 | $233,759 | 1 | $140,110 | 0 | $0 |
| APPLICATIONS WITHDRAWN | 0 | $0 | 3 | $192,367 | 9 | $236,350 | 0 | $0 | 0 | $0 |
| FILES CLOSED FOR INCOMPLETENESS | 0 | $0 | 0 | $0 | 3 | $224,047 | 1 | $63,690 | 0 | $0 |
Detailed HMDA statistics for the following Tracts: 2187.00
| Private Mortgage Insurance Companies Aggregated Statistics For Year 2009 (Based on 1 full tract) | ||||
| A) Conventional Home Purchase Loans | B) Refinancings | |||
|---|---|---|---|---|
| Number | Average Value | Number | Average Value | |
| LOANS ORIGINATED | 4 | $257,442 | 2 | $266,505 |
| APPLICATIONS APPROVED, NOT ACCEPTED | 0 | $0 | 1 | $253,770 |
| APPLICATIONS DENIED | 0 | $0 | 4 | $277,772 |
| APPLICATIONS WITHDRAWN | 0 | $0 | 1 | $258,670 |
| FILES CLOSED FOR INCOMPLETENESS | 0 | $0 | 0 | $0 |
Detailed PMIC statistics for the following Tracts: 2187.00
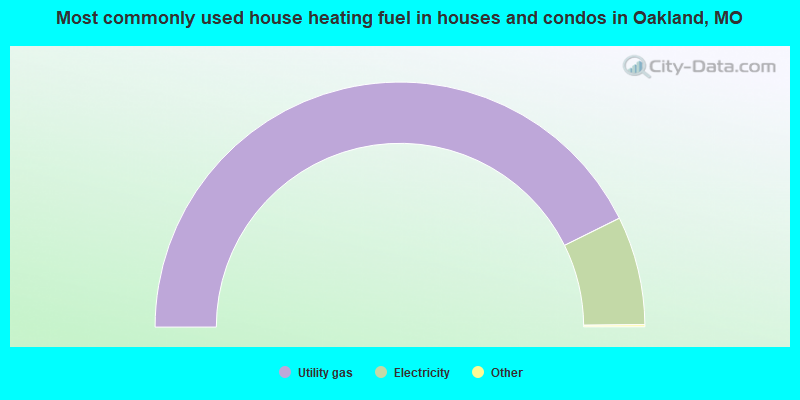
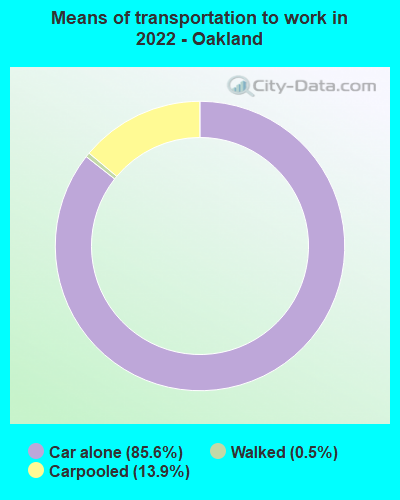
- 85.6%Utility gas
- 14.4%Electricity
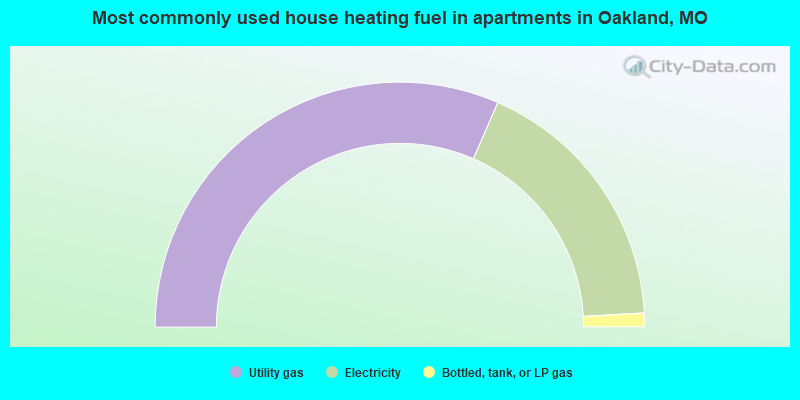
- 63.1%Utility gas
- 35.1%Electricity
- 1.8%Bottled, tank, or LP gas
Oakland compared to Missouri state average:
- Median household income above state average.
- Median house value above state average.
- Unemployed percentage significantly below state average.
- Black race population percentage below state average.
- Hispanic race population percentage significantly below state average.
- Median age significantly above state average.
- Foreign-born population percentage below state average.
- Renting percentage significantly below state average.
- Length of stay since moving in significantly above state average.
- Institutionalized population percentage significantly above state average.
- Number of college students below state average.
- Percentage of population with a bachelor's degree or higher significantly above state average.
Oakland on our top lists:
- #3 on the list of "Top 101 cities with the largest percentage of people in nursing homes (population 1,000+)"
- #60 on the list of "Top 100 cities with the largest percentage of females"
- #66 on the list of "Top 101 cities with the most residents born in Austria (population 500+)"
- #68 on the list of "Top 101 cities with the most residents born in Sweden (population 500+)"
- #27 on the list of "Top 101 counties with the highest surface withdrawal of fresh water for public supply"
- #27 on the list of "Top 101 counties with the most Catholic congregations"
- #34 on the list of "Top 101 counties with the most Mainline Protestant adherents"
- #36 on the list of "Top 101 counties with the most Evangelical Protestant adherents"
- #39 on the list of "Top 101 counties with the highest total withdrawal of fresh water for public supply (pop. 50,000+)"

|
Total of 5 patent applications in 2008-2024.