Olney, Illinois

Olney: Olney's White Squirrel

Olney: Olney's White Squirrel

Olney: Sunrise At East Fork Lake

Olney: Olney White Squirrel

Olney: Lake in Olney-A great setting for Fun!
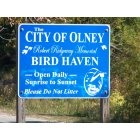
Olney: Bird Haven at Olney, IL
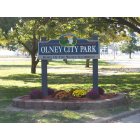
Olney: Olney City Park

Olney: Sunset at East Fork Lake

Olney: Olney White Squirrel

Olney: bald Eagle

Olney: Rainbow after the storm
- see
14
more - add
your
Submit your own pictures of this city and show them to the world
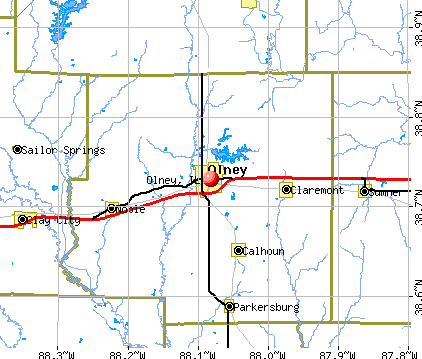
- OSM Map
- General Map
- Google Map
- MSN Map
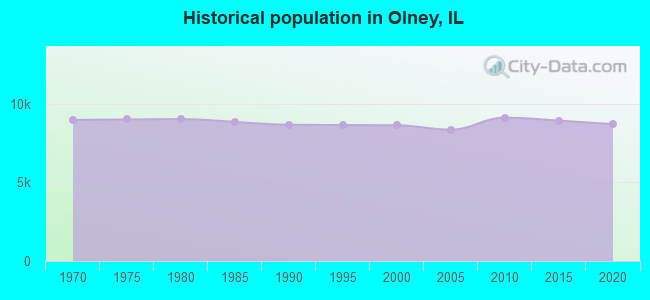
Population change since 2000: -1.7%
 |
| Males: 4,155 | |
| Females: 4,332 |
| Median resident age: | 41.0 years |
| Illinois median age: | 39.1 years |
Zip codes: 62450.
| Olney: | $56,001 |
| IL: | $76,708 |
Estimated per capita income in 2022: $28,425 (it was $16,218 in 2000)
Olney city income, earnings, and wages data
Estimated median house or condo value in 2022: $97,125 (it was $55,400 in 2000)
| Olney: | $97,125 |
| IL: | $251,600 |
Mean prices in 2022: all housing units: $109,207; detached houses: $113,317; mobile homes: $67,076
Median gross rent in 2022: $718.
(17.2% for White Non-Hispanic residents, 93.7% for Black residents, 23.0% for Hispanic or Latino residents, 40.0% for American Indian residents, 36.1% for two or more races residents)
Detailed information about poverty and poor residents in Olney, IL


Compare current foreclosures near Olney, IL:
| Photo | Address | Area | Beds / Baths | Price | Details |
|---|---|---|---|---|---|

|
#1
N Walnut St
Olney, IL 62450
|
1,372 sq. feet
|
2 baths 4 beds |
show details | |

|
#2
Lee Ave
Olney, IL 62450
|
995 sq. feet
|
1 baths 2 beds |
show details | |

|
#3
E Laurel St
Olney, IL 62450
|
1,561 sq. feet
|
1 baths 3 beds |
show details | |

|
#4
Mimosa Dr
Olney, IL 62450
|
1,988 sq. feet
|
2 baths 3 beds |
show details | |

|
#5
E Golf Ln
Olney, IL 62450
|
- sq. feet
|
- baths - beds |
show details | |

|
#6
Fritschle St
Olney, IL 62450
|
- sq. feet
|
- baths - beds |
show details | |

|
#7
N Walnut St
Olney, IL 62450
|
- sq. feet
|
- baths - beds |
show details | |

|
#8
Mimosa Dr
Olney, IL 62450
|
- sq. feet
|
- baths - beds |
show details | |

|
#9
Lee Ave
Olney, IL 62450
|
- sq. feet
|
- baths - beds |
show details | |

|
#10
E Butler St
Olney, IL 62450
|
- sq. feet
|
- baths - beds |
show details |
| Photo | Address | Area | Beds / Baths | Price | Details |
|---|---|---|---|---|---|

|
#11
S Baltimore St
Olney, IL 62450
|
- sq. feet
|
- baths - beds |
show details | |

|
#12
Lake Point Cir
Olney, IL 62450
|
- sq. feet
|
- baths - beds |
show details | |

|
#13
W North Ave
Olney, IL 62450
|
- sq. feet
|
- baths - beds |
show details | |

|
#14
S Morgan St
Olney, IL 62450
|
- sq. feet
|
- baths - beds |
show details | |

|
#15
Willow Dr
Olney, IL 62450
|
- sq. feet
|
- baths - beds |
show details | |

|
#16
E Butler St
Olney, IL 62450
|
- sq. feet
|
- baths - beds |
show details | |

|
#17
E South Ave
Olney, IL 62450
|
- sq. feet
|
- baths - beds |
show details | |

|
#18
N Fair St
Olney, IL 62450
|
- sq. feet
|
- baths - beds |
show details | |

|
#19
N Palmer St
Noble, IL 62868
|
2,016 sq. feet
|
2 baths 3 beds |
show details | |

|
#20
E 600th Ave
Newton, IL 62448
|
- sq. feet
|
- baths - beds |
show details |
| Photo | Address | Area | Beds / Baths | Price | Details |
|---|---|---|---|---|---|

|
#21
Kings Hill Rd
Sumner, IL 62466
|
- sq. feet
|
- baths - beds |
show details | |

|
#22
E South St
West Salem, IL 62476
|
- sq. feet
|
- baths - beds |
show details | |

|
#23
N 2300 Ln
West Salem, IL 62476
|
- sq. feet
|
- baths - beds |
show details | |

|
#24
E Liberty Ln
Newton, IL 62448
|
- sq. feet
|
- baths - beds |
show details | |

|
#25
E South Ave
Sumner, IL 62466
|
- sq. feet
|
- baths - beds |
show details | |

|
#26
Fillmore Ln
Sumner, IL 62466
|
- sq. feet
|
- baths - beds |
show details | |

|
#27
S 1st St SE
Clay City, IL 62824
|
- sq. feet
|
- baths - beds |
show details | |

|
#28
Seminary St
West Salem, IL 62476
|
- sq. feet
|
- baths - beds |
show details | |

|
#29
E Us Highway 50
Noble, IL 62868
|
- sq. feet
|
- baths - beds |
show details | |

|
#30
S Prairie St
West Salem, IL 62476
|
- sq. feet
|
- baths - beds |
show details |
| Photo | Address | Area | Beds / Baths | Price | Details |
|---|---|---|---|---|---|

|
#31
New St
West Salem, IL 62476
|
- sq. feet
|
- baths - beds |
show details | |

|
#32
S May St
Sumner, IL 62466
|
- sq. feet
|
- baths - beds |
show details | |

|
Check over 1 million property listings on Foreclosure.com!
|
browse all offers | |||


- 7,96889.8%White alone
- 3914.4%Two or more races
- 2673.0%Hispanic
- 891.0%Black alone
- 760.9%Other race alone
- 290.3%Asian alone
- 50.06%American Indian alone
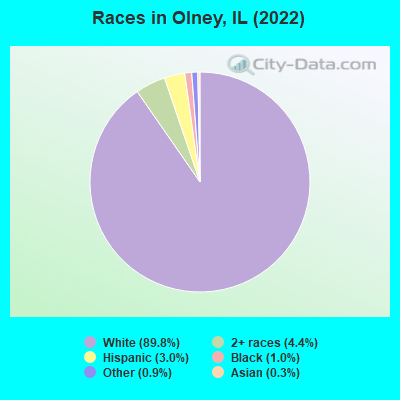
Races in Olney detailed stats: ancestries, foreign born residents, place of birth
According to our research of Illinois and other state lists, there were 21 registered sex offenders living in Olney, Illinois as of April 25, 2024.
The ratio of all residents to sex offenders in Olney is 424 to 1.
Type |
2009 |
2010 |
2011 |
2012 |
2013 |
2014 |
2015 |
2016 |
2017 |
2018 |
2019 |
2020 |
2021 |
2022 |
|---|---|---|---|---|---|---|---|---|---|---|---|---|---|---|
| Murders (per 100,000) | 0 (0.0) | 0 (0.0) | 1 (10.9) | 0 (0.0) | 0 (0.0) | 0 (0.0) | 0 (0.0) | 1 (11.1) | 0 (0.0) | 0 (0.0) | 0 (0.0) | 0 (0.0) | 0 (0.0) | 1 (11.5) |
| Rapes (per 100,000) | 0 (0.0) | 10 (109.7) | 9 (98.4) | 10 (109.6) | 11 (121.1) | 8 (87.8) | 5 (55.5) | 10 (111.3) | 6 (67.2) | 11 (123.3) | 10 (113.6) | 0 (0.0) | 2 (23.2) | 3 (34.6) |
| Robberies (per 100,000) | 2 (23.9) | 0 (0.0) | 3 (32.8) | 1 (11.0) | 1 (11.0) | 1 (11.0) | 1 (11.1) | 0 (0.0) | 1 (11.2) | 5 (56.1) | 0 (0.0) | 1 (11.6) | 1 (11.6) | 0 (0.0) |
| Assaults (per 100,000) | 18 (215.1) | 16 (175.5) | 12 (131.3) | 24 (263.0) | 18 (198.2) | 25 (274.5) | 13 (144.3) | 38 (423.0) | 27 (302.4) | 29 (325.1) | 25 (284.1) | 6 (69.5) | 7 (81.1) | 14 (161.3) |
| Burglaries (per 100,000) | 47 (561.7) | 52 (570.5) | 47 (514.1) | 51 (558.9) | 81 (891.7) | 43 (472.1) | 30 (333.1) | 32 (356.2) | 55 (616.0) | 70 (784.8) | 47 (534.1) | 8 (92.7) | 10 (115.9) | 25 (288.0) |
| Thefts (per 100,000) | 201 (2,402) | 245 (2,688) | 253 (2,767) | 238 (2,608) | 216 (2,378) | 223 (2,448) | 214 (2,376) | 241 (2,683) | 295 (3,304) | 289 (3,240) | 155 (1,761) | 17 (197.0) | 52 (602.8) | 118 (1,359) |
| Auto thefts (per 100,000) | 9 (107.6) | 14 (153.6) | 17 (186.0) | 7 (76.7) | 9 (99.1) | 13 (142.7) | 12 (133.2) | 10 (111.3) | 12 (134.4) | 12 (134.5) | 3 (34.1) | 2 (23.2) | 3 (34.8) | 3 (34.6) |
| Arson (per 100,000) | 1 (12.0) | 3 (32.9) | 1 (10.9) | 7 (76.7) | 2 (22.0) | 1 (11.0) | 4 (44.4) | 4 (44.5) | 4 (44.8) | 5 (56.1) | 1 (11.4) | 1 (11.6) | 1 (11.6) | 0 (0.0) |
| City-Data.com crime index | 194.2 | 282.6 | 298.3 | 293.2 | 305.3 | 270.9 | 205.6 | 337.0 | 303.7 | 375.8 | 258.3 | 33.6 | 73.3 | 160.2 |
The City-Data.com crime index weighs serious crimes and violent crimes more heavily. Higher means more crime, U.S. average is 246.1. It adjusts for the number of visitors and daily workers commuting into cities.
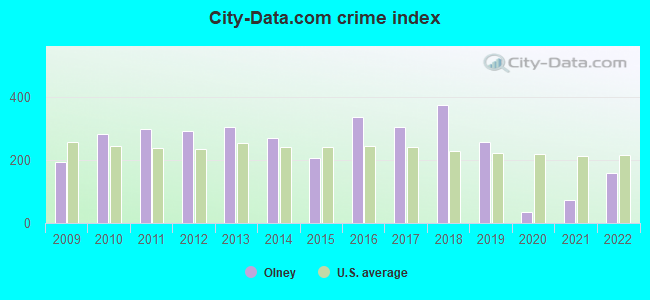
Crime rate in Olney detailed stats: murders, rapes, robberies, assaults, burglaries, thefts, arson
Full-time law enforcement employees in 2019, including police officers: 13 (12 officers - 11 male; 1 female).
| Officers per 1,000 residents here: | 1.36 |
| Illinois average: | 3.06 |
 Recent articles from our blog. Our writers, many of them Ph.D. graduates or candidates, create easy-to-read articles on a wide variety of topics.


Latest news from Olney, IL collected exclusively by city-data.com from local newspapers, TV, and radio stations
Ancestries: German (39.6%), American (17.8%), English (8.4%), European (4.9%), Irish (3.0%), Swedish (1.3%).
Current Local Time: CST time zone
Incorporated on 04/29/1911
Elevation: 490 feet
Land area: 5.76 square miles.
Population density: 1,473 people per square mile (low).
230 residents are foreign born (1.7% Latin America, 0.5% Europe, 0.3% Asia).
| This city: | 2.6% |
| Illinois: | 14.1% |
Median real estate property taxes paid for housing units with mortgages in 2022: $2,051 (2.0%)
Median real estate property taxes paid for housing units with no mortgage in 2022: $1,440 (1.5%)
Nearest city with pop. 50,000+: Evansville, IN  (59.5 miles , pop. 121,582).
Nearest city with pop. 200,000+: St. Louis, MO (116.9 miles , pop. 348,189).
Nearest city with pop. 1,000,000+: Chicago, IL (216.2 miles , pop. 2,896,016).
Nearest cities:
), ), ), ), )Latitude: 38.73 N, Longitude: 88.08 W
Daytime population change due to commuting: +1,313 (+14.8%)
Workers who live and work in this city: 2,476 (60.9%)
Area code: 618
Olney, Illinois accommodation & food services, waste management - Economy and Business Data
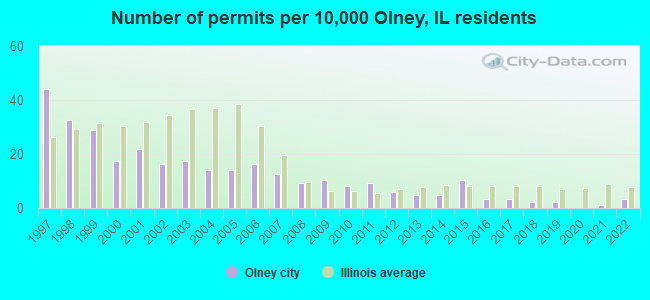
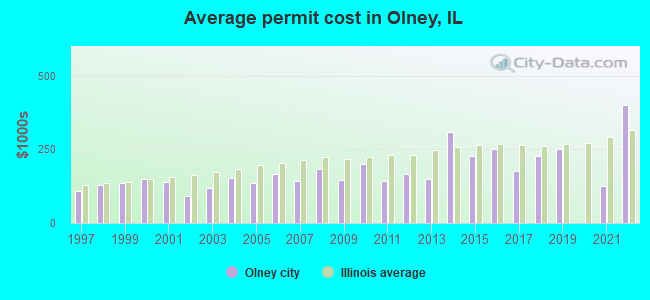
Single-family new house construction building permits:
- 2022: 3 buildings, average cost: $400,900
- 2021: 1 building, cost: $125,000
- 2019: 2 buildings, average cost: $251,000
- 2018: 2 buildings, average cost: $227,000
- 2017: 3 buildings, average cost: $175,400
- 2016: 3 buildings, average cost: $250,000
- 2015: 9 buildings, average cost: $226,300
- 2014: 4 buildings, average cost: $307,500
- 2013: 4 buildings, average cost: $148,700
- 2012: 5 buildings, average cost: $166,400
- 2011: 8 buildings, average cost: $144,400
- 2010: 7 buildings, average cost: $200,600
- 2009: 9 buildings, average cost: $144,900
- 2008: 8 buildings, average cost: $184,200
- 2007: 11 buildings, average cost: $142,800
- 2006: 14 buildings, average cost: $166,500
- 2005: 12 buildings, average cost: $136,700
- 2004: 12 buildings, average cost: $153,500
- 2003: 15 buildings, average cost: $118,000
- 2002: 14 buildings, average cost: $91,700
- 2001: 19 buildings, average cost: $138,400
- 2000: 15 buildings, average cost: $147,600
- 1999: 25 buildings, average cost: $135,100
- 1998: 28 buildings, average cost: $128,500
- 1997: 38 buildings, average cost: $106,700
| Here: | 4.1% |
| Illinois: | 4.2% |
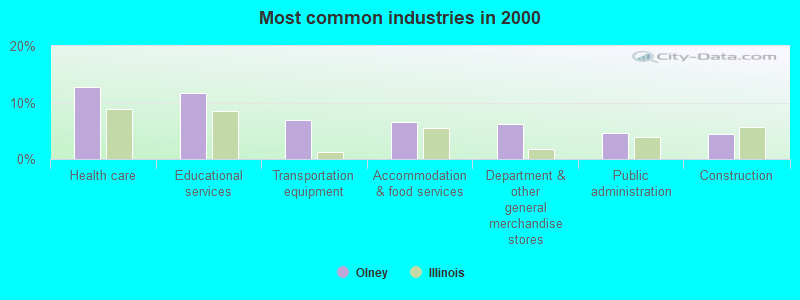
- Health care (12.7%)
- Educational services (11.6%)
- Transportation equipment (6.9%)
- Accommodation & food services (6.5%)
- Department & other general merchandise stores (6.2%)
- Public administration (4.5%)
- Construction (4.4%)
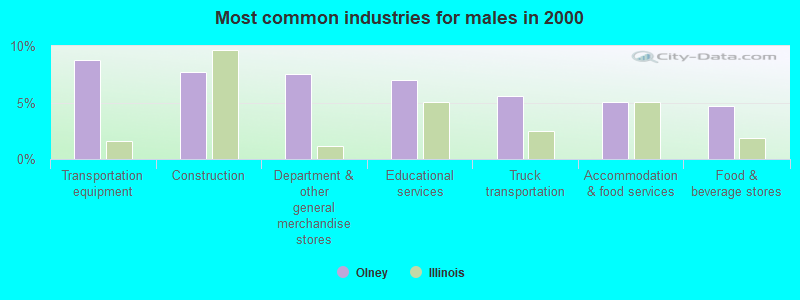
- Transportation equipment (8.8%)
- Construction (7.7%)
- Department & other general merchandise stores (7.5%)
- Educational services (7.0%)
- Truck transportation (5.6%)
- Accommodation & food services (5.0%)
- Food & beverage stores (4.7%)
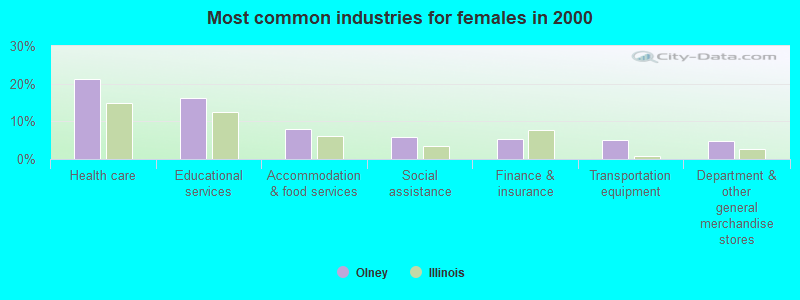
- Health care (21.4%)
- Educational services (16.3%)
- Accommodation & food services (8.0%)
- Social assistance (5.7%)
- Finance & insurance (5.4%)
- Transportation equipment (5.1%)
- Department & other general merchandise stores (4.9%)
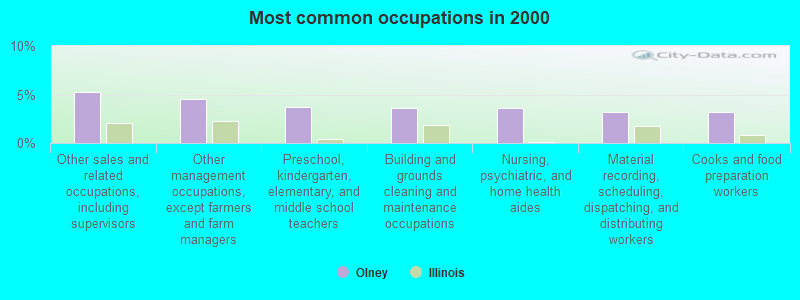
- Other sales and related occupations, including supervisors (5.2%)
- Other management occupations, except farmers and farm managers (4.5%)
- Preschool, kindergarten, elementary, and middle school teachers (3.7%)
- Building and grounds cleaning and maintenance occupations (3.6%)
- Nursing, psychiatric, and home health aides (3.6%)
- Material recording, scheduling, dispatching, and distributing workers (3.2%)
- Cooks and food preparation workers (3.1%)
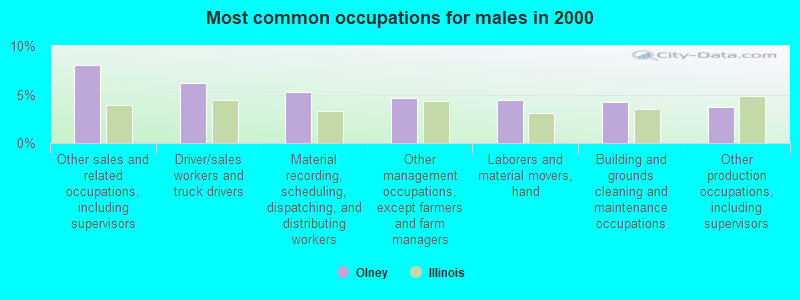
- Other sales and related occupations, including supervisors (8.1%)
- Driver/sales workers and truck drivers (6.1%)
- Material recording, scheduling, dispatching, and distributing workers (5.3%)
- Other management occupations, except farmers and farm managers (4.6%)
- Laborers and material movers, hand (4.4%)
- Building and grounds cleaning and maintenance occupations (4.2%)
- Other production occupations, including supervisors (3.7%)
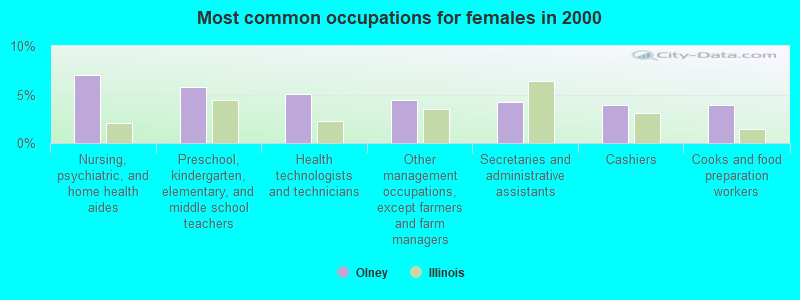
- Nursing, psychiatric, and home health aides (7.0%)
- Preschool, kindergarten, elementary, and middle school teachers (5.7%)
- Health technologists and technicians (5.1%)
- Other management occupations, except farmers and farm managers (4.4%)
- Secretaries and administrative assistants (4.2%)
- Cashiers (4.0%)
- Cooks and food preparation workers (4.0%)
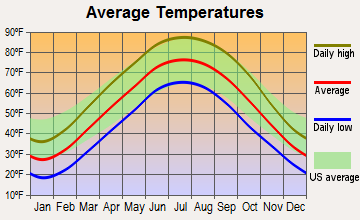
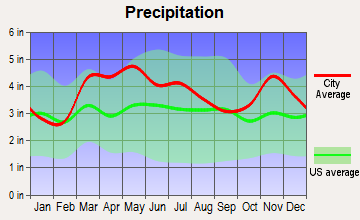
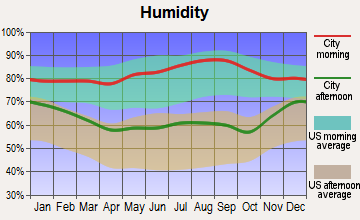
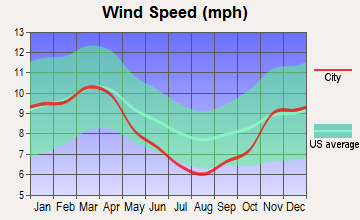
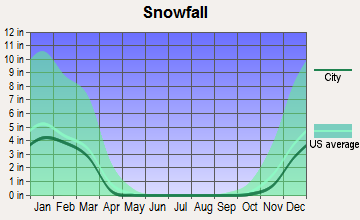
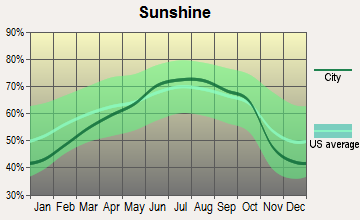
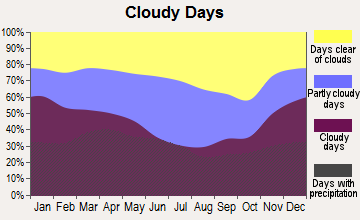
Average climate in Olney, Illinois
Based on data reported by over 4,000 weather stations
|
|


Tornado activity:
Olney-area historical tornado activity is near Illinois state average. It is 52% greater than the overall U.S. average.
On 6/2/1990, a category F4 (max. wind speeds 207-260 mph) tornado 0.7 miles away from the Olney city center injured 2 people and caused between $50,000 and $500,000 in damages.
On 6/2/1990, a category F4 tornado 18.3 miles away from the city center injured 6 people and caused between $50,000 and $500,000 in damages.
Earthquake activity:
Olney-area historical earthquake activity is significantly above Illinois state average. It is 201% greater than the overall U.S. average.On 4/18/2008 at 09:36:59, a magnitude 5.4 (5.1 MB, 4.8 MS, 5.4 MW, 5.2 MW, Class: Moderate, Intensity: VI - VII) earthquake occurred 22.0 miles away from Olney center
On 4/18/2008 at 09:36:59, a magnitude 5.2 (5.2 MW, Depth: 8.9 mi) earthquake occurred 22.0 miles away from Olney center
On 6/10/1987 at 23:48:54, a magnitude 5.1 (4.9 MB, 4.4 MS, 4.6 MS, 5.1 LG) earthquake occurred 12.3 miles away from the city center
On 6/18/2002 at 17:37:15, a magnitude 5.0 (4.3 MB, 4.6 MW, 5.0 LG) earthquake occurred 54.0 miles away from the city center
On 4/18/2008 at 15:14:16, a magnitude 4.8 (4.5 MB, 4.8 MW, 4.6 MW, Class: Light, Intensity: IV - V) earthquake occurred 21.7 miles away from the city center
On 4/3/1974 at 23:05:02, a magnitude 4.7 (4.5 MB, 4.7 LG) earthquake occurred 9.6 miles away from the city center
Magnitude types: regional Lg-wave magnitude (LG), body-wave magnitude (MB), surface-wave magnitude (MS), moment magnitude (MW)
Natural disasters:
The number of natural disasters in Richland County (7) is smaller than the US average (15).Major Disasters (Presidential) Declared: 4
Emergencies Declared: 2
Causes of natural disasters: Floods: 3, Storms: 3, Tornadoes: 2, Hurricane: 1, Snow: 1, Snowstorm: 1, Winter Storm: 1, Other: 1 (Note: some incidents may be assigned to more than one category).

Hospitals and medical centers in Olney:
- RICHLAND MANOR ("1066 WEST MAIN, P.O. BOX 10")
- RICHLAND MEMORIAL HOSPITAL (Voluntary non-profit - Private, 800 EAST LOCUST)
- BURGIN MANOR OF OLNEY, INC. (900 928 EAST SCOTT)
- BURGIN NURS MANOR 2
- BURGIN NURSING MANOR INC (928 E SCOTT ST)
- RICHLAND CARE AND REHAB (410 EAST MACK)
- OLNEY DIALYSIS CENTER (117 N BOONE ST)
- ADVANTAGE HOME HEALTH, INC. (801 SOUTH WEST STREET)
- RICHLAND MEM. HOSP. HM. HLTH. (800 E LOCUST)
Heliports located in Olney:
Colleges/Universities in Olney:
Colleges/universities with over 2000 students nearest to Olney:
- Wabash Valley College (about 27 miles; Mount Carmel, IL; Full-time enrollment: 2,142)
- Vincennes University (about 31 miles; Vincennes, IN; FT enrollment: 9,876)
- Lake Land College (about 52 miles; Mattoon, IL; FT enrollment: 7,499)
- Eastern Illinois University (about 53 miles; Charleston, IL; FT enrollment: 9,414)
- University of Southern Indiana (about 58 miles; Evansville, IN; FT enrollment: 9,532)
- University of Evansville (about 61 miles; Evansville, IN; FT enrollment: 2,688)
- Kaskaskia College (about 62 miles; Centralia, IL; FT enrollment: 3,867)
Public high school in Olney:
- EAST RICHLAND HIGH SCHOOL (Students: 683, Location: 1200 E LAUREL ST, Grades: 9-12)
Public elementary/middle schools in Olney:
- EAST RICHLAND ELEMENTARY SCHOOL (Students: 997, Location: 1001 N HOLLY RD, Grades: PK-5)
- EAST RICHLAND MIDDLE SCHOOL (Students: 438, Location: 1099 N VAN ST, Grades: 6-8)
Private elementary/middle school in Olney:
User-submitted facts and corrections:
- Ring of Fire Evangelistic Ministry/Blue Jeans For Jesus Food & Clothing Ministry 300 W. Chetnut, Olney, IL 62450 Phone:838-0328 Rev. Kimberly R. Dreiman Services:Sunday 10:00 a.m. 5:30 p.m. Fellowship Meal 7:00 p.m. Service, Wed. 7:00 p.m. Adult Bible Study, 1st Thurs.Noah's Ark Youth Group 6:30 p.m.,Friday Prayer 7:00p.m.
- The Olney Central College Website has been changed to: www.iecc.edu/occ
- Ring of Fire Evangelistic Ministry 300 W. Chestnut Olney, IL 62450 Phone:618-393-1336
Points of interest:
Notable locations in Olney: Olney Public Library (A), Richland County Jail (B), Olney Fire Department (C), Richland County Courthouse (D). Display/hide their locations on the map
Churches in Olney include: Calvary Baptist Church (A), Church of Christ (B), Church of the Nazarene (C), Congregational Christian Church (D), Elm Street Christian Church (E), First Baptist Church (F), First Christian Church (G), First Presbyterian Church (H), First United Brethren Church (I). Display/hide their locations on the map
Cemeteries: Maple Dale Cemetery (1), Saint Joseph Cemetery (2), Haven Hill Cemetery (3). Display/hide their locations on the map
Parks in Olney include: Bower Park (1), City Park (2), Elliott Street Historic District (3). Display/hide their locations on the map
Tourist attraction: Carnegie Building (Museums; 401 East Main Street).
Hotel: Holiday Motel (1300 South West Street).
Court: Illinois State - Richland County Office- Department of Human Services- Public Aid Depart (1406 Martin Street).
Birthplace of: Alfred M. Wilson - Marine Corps Medal of Honor recipient, Clarence Tade - Politician, Edmund Sebree - General, Elaine Shepard - Journalist, Reginald C. Harmon - Lawyer, Dummy Murphy - Baseball player, Glenn Brummer - Major League Baseball catcher, Ollie Pickering - Baseball player, Paul LePaul - Magician, Stan Royer - Baseball player.
| This city: | 2.3 people |
| Illinois: | 2.6 people |
| This city: | 60.3% |
| Whole state: | 65.8% |
| This city: | 6.9% |
| Whole state: | 6.3% |
Likely homosexual households (counted as self-reported same-sex unmarried-partner households)
- Lesbian couples: 0.2% of all households
- Gay men: 0.1% of all households
People in group quarters in Olney in 2010:
- 273 people in nursing facilities/skilled-nursing facilities
- 35 people in other noninstitutional facilities
- 29 people in local jails and other municipal confinement facilities
- 21 people in group homes intended for adults
- 6 people in residential treatment centers for adults
People in group quarters in Olney in 2000:
- 92 people in nursing homes
- 15 people in mental (psychiatric) hospitals or wards
- 12 people in other noninstitutional group quarters
- 10 people in local jails and other confinement facilities (including police lockups)
- 10 people in other group homes
Banks with branches in Olney (2011 data):
- First National Bank in Olney: Drive-In, Route 130 North Facility, First National Bank In Olney, Olney Drive-In Facility. Info updated 2006/11/03: Bank assets: $306.4 mil, Deposits: $269.1 mil, local headquarters, positive income, Agricultural Specialization, 7 total offices, Holding Company: Summit Bancshares, Ltd.
- First Financial Bank, National Association: Olney Main Branch at 240 East Chestnut St, branch established on 1883/01/01; Olney 130 Branch at 1110 South West, branch established on 1998/10/05. Info updated 2012/01/04: Bank assets: $2,852.7 mil, Deposits: $2,227.7 mil, headquarters in Terre Haute, IN, positive income, Commercial Lending Specialization, 66 total offices, Holding Company: First Financial Corporation
- TrustBank: Richland County Mall Facility at North West Street, branch established on 1981/05/04; Trustbank at 600 East Main Street, branch established on 1912/09/13. Info updated 2006/11/03: Bank assets: $168.4 mil, Deposits: $144.7 mil, local headquarters, positive income, Agricultural Specialization, 5 total offices, Holding Company: Rich Land Bancorp, Inc.
- Citizens National Bank of Albion: Olney Branch at 202 South Whittle Avenue, branch established on 2002/01/22. Info updated 2006/11/03: Bank assets: $265.4 mil, Deposits: $222.5 mil, headquarters in Albion, IL, positive income, Agricultural Specialization, 4 total offices, Holding Company: Citizens Bancshares, Inc.
For population 15 years and over in Olney:
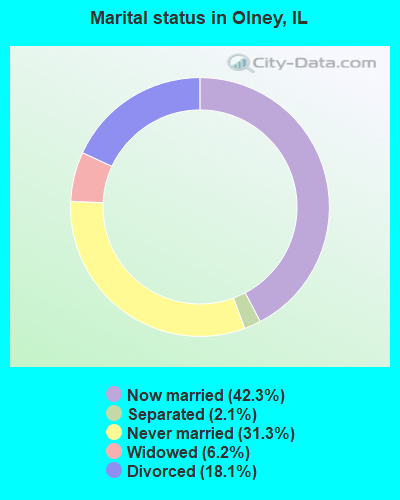
- Never married: 31.3%
- Now married: 42.3%
- Separated: 2.1%
- Widowed: 6.2%
- Divorced: 18.1%
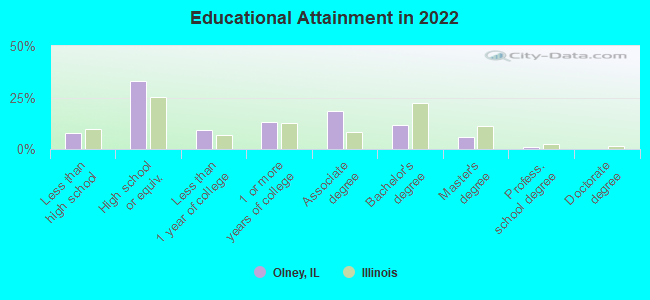
For population 25 years and over in Olney:
- High school or higher: 91.8%
- Bachelor's degree or higher: 18.0%
- Graduate or professional degree: 6.5%
- Unemployed: 8.1%
- Mean travel time to work (commute): 16.9 minutes
| Here: | 9.5 |
| Illinois average: | 12.5 |
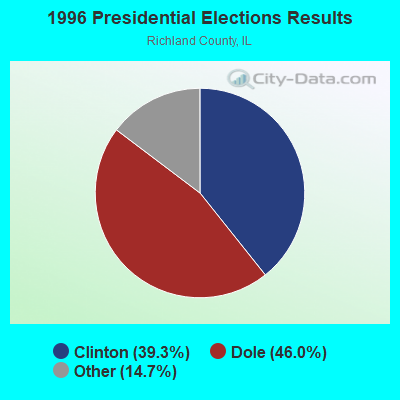

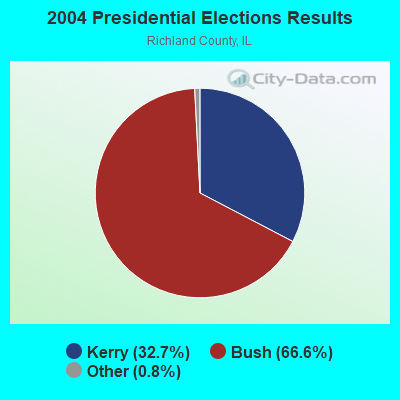
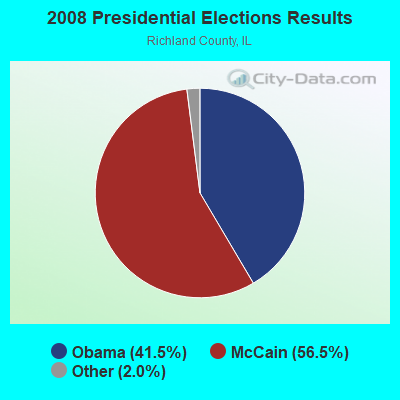
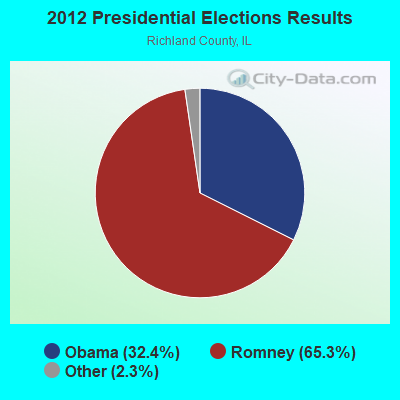
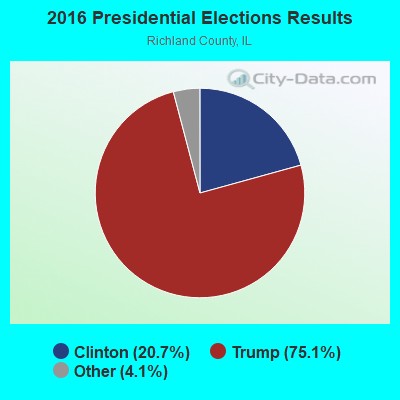
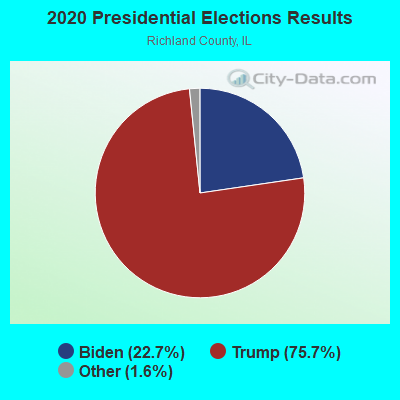
Graphs represent county-level data. Detailed 2008 Election Results
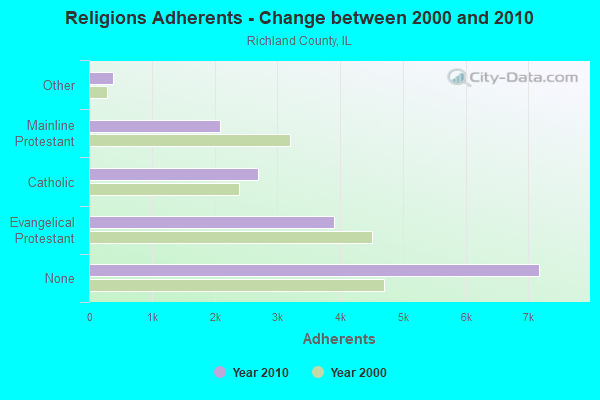
Religion statistics for Olney, IL (based on Richland County data)
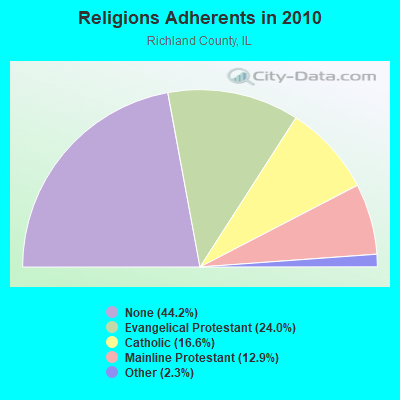
| Religion | Adherents | Congregations |
|---|---|---|
| Evangelical Protestant | 3,899 | 30 |
| Catholic | 2,692 | 2 |
| Mainline Protestant | 2,091 | 15 |
| Other | 375 | 2 |
| None | 7,176 | - |
Food Environment Statistics:
| This county: | 1.92 / 10,000 pop. |
| Illinois: | 2.24 / 10,000 pop. |
| Here: | 0.64 / 10,000 pop. |
| State: | 0.08 / 10,000 pop. |
| This county: | 0.64 / 10,000 pop. |
| Illinois: | 0.75 / 10,000 pop. |
| Here: | 3.20 / 10,000 pop. |
| Illinois: | 2.61 / 10,000 pop. |
| This county: | 5.12 / 10,000 pop. |
| Illinois: | 6.86 / 10,000 pop. |
| Richland County: | 9.8% |
| Illinois: | 8.3% |
| Richland County: | 27.7% |
| State: | 25.2% |
| This county: | 10.4% |
| Illinois: | 14.5% |
Health and Nutrition:
| Olney: | 56.0% |
| Illinois: | 49.5% |
| Olney: | 55.3% |
| Illinois: | 47.2% |
| Olney: | 28.4 |
| Illinois: | 28.6 |
| This city: | 18.3% |
| Illinois: | 20.5% |
| Olney: | 10.5% |
| Illinois: | 10.8% |
| Olney: | 7.0 |
| Illinois: | 6.8 |
| This city: | 35.0% |
| Illinois: | 33.4% |
| Here: | 61.5% |
| Illinois: | 56.4% |
| This city: | 79.0% |
| Illinois: | 79.9% |
More about Health and Nutrition of Olney, IL Residents
| Local government employment and payroll (March 2022) | |||||
| Function | Full-time employees | Monthly full-time payroll | Average yearly full-time wage | Part-time employees | Monthly part-time payroll |
|---|---|---|---|---|---|
| Police Protection - Officers | 13 | $81,151 | $74,909 | 0 | $0 |
| Water Supply | 10 | $47,171 | $56,605 | 0 | $0 |
| Streets and Highways | 7 | $28,230 | $48,394 | 2 | $1,302 |
| Sewerage | 5 | $21,330 | $51,192 | 0 | $0 |
| Other Government Administration | 4 | $23,786 | $71,358 | 5 | $2,555 |
| Other and Unallocable | 3 | $14,659 | $58,636 | 1 | $841 |
| Parks and Recreation | 3 | $17,035 | $68,140 | 3 | $3,049 |
| Firefighters | 3 | $24,052 | $96,208 | 2 | $2,170 |
| Local Libraries | 3 | $7,481 | $29,924 | 2 | $1,807 |
| Financial Administration | 2 | $9,050 | $54,300 | 0 | $0 |
| Police - Other | 1 | $5,669 | $68,028 | 0 | $0 |
| Totals for Government | 54 | $279,612 | $62,136 | 15 | $11,725 |
Olney government finances - Expenditure in 2017 (per resident):
- Construction - Central Staff Services: $581,000 ($68.46)
Regular Highways: $316,000 ($37.23)
Parks and Recreation: $84,000 ($9.90)
- Current Operations - Police Protection: $1,388,000 ($163.54)
Water Utilities: $1,195,000 ($140.80)
Regular Highways: $888,000 ($104.63)
Parks and Recreation: $743,000 ($87.55)
Central Staff Services: $716,000 ($84.36)
Sewerage: $631,000 ($74.35)
Local Fire Protection: $431,000 ($50.78)
Solid Waste Management: $298,000 ($35.11)
Libraries: $222,000 ($26.16)
Financial Administration: $173,000 ($20.38)
Protective Inspection and Regulation - Other: $126,000 ($14.85)
General - Other: $52,000 ($6.13)
General Public Buildings: $7,000 ($0.82)
- General - Interest on Debt: $47,000 ($5.54)
- Other Capital Outlay - Local Fire Protection: $649,000 ($76.47)
Parks and Recreation: $356,000 ($41.95)
Regular Highways: $57,000 ($6.72)
Police Protection: $42,000 ($4.95)
Central Staff Services: $28,000 ($3.30)
- Total Salaries and Wages: $3,127,000 ($368.45)
Olney government finances - Revenue in 2017 (per resident):
- Charges - Sewerage: $1,044,000 ($123.01)
Solid Waste Management: $314,000 ($37.00)
Other: $75,000 ($8.84)
Parks and Recreation: $58,000 ($6.83)
- Federal Intergovernmental - Water Utilities: $211,000 ($24.86)
- Local Intergovernmental - Other: $84,000 ($9.90)
- Miscellaneous - General Revenue - Other: $332,000 ($39.12)
Fines and Forfeits: $91,000 ($10.72)
Interest Earnings: $56,000 ($6.60)
- Revenue - Water Utilities: $1,737,000 ($204.67)
- State Intergovernmental - General Local Government Support: $2,949,000 ($347.47)
Highways: $232,000 ($27.34)
Other: $7,000 ($0.82)
- Tax - Property: $1,534,000 ($180.75)
Public Utilities Sales: $200,000 ($23.57)
Other Selective Sales: $151,000 ($17.79)
Other License: $126,000 ($14.85)
Olney government finances - Debt in 2017 (per resident):
- Long Term Debt - Outstanding Unspecified Public Purpose: $1,838,000 ($216.57)
Beginning Outstanding - Unspecified Public Purpose: $1,184,000 ($139.51)
Issue, Unspecified Public Purpose: $992,000 ($116.88)
Retired Unspecified Public Purpose: $339,000 ($39.94)
Olney government finances - Cash and Securities in 2017 (per resident):
- Other Funds - Cash and Securities: $10,964,000 ($1291.86)
| Businesses in Olney, IL | ||||
| Name | Count | Name | Count | |
|---|---|---|---|---|
| AutoZone | 1 | MasterBrand Cabinets | 2 | |
| Burger King | 1 | McDonald's | 1 | |
| CVS | 1 | Nike | 1 | |
| Chevrolet | 1 | Pizza Hut | 1 | |
| Curves | 1 | RadioShack | 1 | |
| Dairy Queen | 1 | Sears | 1 | |
| Decora Cabinetry | 2 | Super 8 | 1 | |
| Domino's Pizza | 1 | Taco Bell | 1 | |
| Fashion Bug | 1 | True Value | 1 | |
| FedEx | 1 | U-Haul | 1 | |
| H&R Block | 1 | UPS | 3 | |
| KFC | 1 | Walmart | 1 | |
| La-Z-Boy | 1 | |||
Strongest AM radio stations in Olney:
- WVLN (740 AM; 0 kW; OLNEY, IL; Owner: V.L.N. BROADCASTING, INC.)
- KXEN (1010 AM; 50 kW; FESTUS-ST. LOUIS, MO; Owner: BDJ RADIO ENTERPRISES, LLC)
- KMOX (1120 AM; 50 kW; ST. LOUIS, MO; Owner: INFINITY BROADCASTING OPERATIONS, INC.)
- WIBC (1070 AM; 50 kW; INDIANAPOLIS, IN; Owner: EMMIS RADIO LICENSE CORPORATION)
- WHAS (840 AM; 50 kW; LOUISVILLE, KY; Owner: CLEAR CHANNEL BROADCASTING LICENSES, INC.)
- WILY (1210 AM; daytime; 10 kW; CENTRALIA, IL; Owner: W. RUSSELL WITHERS, JR.)
- WDDD (810 AM; 10 kW; JOHNSTON CITY, IL; Owner: CLEAR CHANNEL BROADCASTING LICENSES, INC.)
- WSM (650 AM; 50 kW; NASHVILLE, TN; Owner: GAYLORD ENTERTAINMENT COMPANY)
- WMIX (940 AM; 5 kW; MOUNT VERNON, IL; Owner: WITHERS BROADCASTING CO OF ILLINOIS)
- WLW (700 AM; 50 kW; CINCINNATI, OH; Owner: JACOR BROADCASTING CORPORATION)
- WSDZ (1260 AM; 20 kW; BELLEVILLE, IL)
- WSCR (670 AM; 50 kW; CHICAGO, IL; Owner: INFINITY BROADCASTING OPERATIONS, INC.)
- WLS (890 AM; 50 kW; CHICAGO, IL; Owner: WLS, INC.)
Strongest FM radio stations in Olney:
- WSEI (92.9 FM; OLNEY, IL; Owner: V.L.N. BROADCASTING, INC.)
- WPTH (88.1 FM; OLNEY, IL; Owner: OLNEY VOICE OF CHRISTIAN FAITH, INC.)
- WUSI (90.3 FM; OLNEY, IL; Owner: BOARD OF TRUSTEES OF S. ILL. UNIVER.)
- WTYE (101.7 FM; ROBINSON, IL; Owner: ANN BROADCASTING CORPORATION)
- WBJW (91.7 FM; ALBION, IL; Owner: MUSIC MINISTRIES INC)
- WAKO-FM (103.1 FM; LAWRENCEVILLE, IL; Owner: LAWRENCEVILLE BROADCASTING CO., INC.)
- WYNG (94.9 FM; MOUNT CARMEL, IL; Owner: CLEAR CHANNEL BROADCASTING LICENSES, INC.)
- WNOI (103.9 FM; FLORA, IL; Owner: H & R COMMUNICATIONS, INC.)
- WVJC (89.1 FM; MOUNT CARMEL, IL; Owner: ILLINOIS EASTERN COMMUNITY COLLEGES)
TV broadcast stations around Olney:
- WUSI-TV (Channel 16; OLNEY, IL; Owner: BD. OF TRUSTEES SOUTHERN ILLINOIS UNIVERSITY)
- WNOI-LP (Channel 24; FLORA, IL; Owner: H & R COMMUNICATIONS, INC.)
Medal of Honor Recipients
Medal of Honor Recipient born in Olney: Alfred M. Wilson.
- National Bridge Inventory (NBI) Statistics
- 54Number of bridges
- 400ft / 122mTotal length
- $2,079,000Total costs
- 77,150Total average daily traffic
- 11,553Total average daily truck traffic
- New bridges - historical statistics
- 51900-1909
- 11920-1929
- 11930-1939
- 21950-1959
- 71960-1969
- 91970-1979
- 151980-1989
- 71990-1999
- 22000-2009
- 42010-2019
- 12020-2022
FCC Registered Antenna Towers: 124 (See the full list of FCC Registered Antenna Towers)
FCC Registered Commercial Land Mobile Towers: 3 (See the full list of FCC Registered Commercial Land Mobile Towers in Olney, IL)
FCC Registered Private Land Mobile Towers: 1 (See the full list of FCC Registered Private Land Mobile Towers)
FCC Registered Broadcast Land Mobile Towers: 28 (See the full list of FCC Registered Broadcast Land Mobile Towers)
FCC Registered Microwave Towers: 29 (See the full list of FCC Registered Microwave Towers in this town)
FCC Registered Paging Towers: 5 (See the full list of FCC Registered Paging Towers)
FCC Registered Maritime Coast & Aviation Ground Towers: 4 (See the full list of FCC Registered Maritime Coast & Aviation Ground Towers)
FCC Registered Amateur Radio Licenses: 64 (See the full list of FCC Registered Amateur Radio Licenses in Olney)
FAA Registered Aircraft Manufacturers and Dealers: 1 (See the full list of FAA Registered Manufacturers and Dealers in Olney)
FAA Registered Aircraft: 7 (See the full list of FAA Registered Aircraft)
2002 - 2018 National Fire Incident Reporting System (NFIRS) incidents
- Fire incident types reported to NFIRS in Olney, IL
- 46543.8%Structure Fires
- 39136.8%Outside Fires
- 17516.5%Mobile Property/Vehicle Fires
- 312.9%Other
 According to the data from the years 2002 - 2018 the average number of fire incidents per year is 62. The highest number of fires - 103 took place in 2012, and the least - 0 in 2003. The data has a dropping trend.
 When looking into fire subcategories, the most reports belonged to: Structure Fires (43.8%), and Outside Fires (36.8%).
Fire-safe hotels and motels in Olney, Illinois:
- Travelers Inn Motel, 1801 E Main St, Olney, Illinois 62450 , Phone: (618) 393-2186
- Super 8 Motel Olney, 425 SW Rt 30, Olney, Illinois 62450 , Phone: (618) 392-7888, Fax: (618) 392-7888
- Holiday Motel, US 50 & I-130, Olney, Illinois 62450 , Phone: (618) 395-2121, Fax: (618) 395-3200
| Most common first names in Olney, IL among deceased individuals | ||
| Name | Count | Lived (average) |
|---|---|---|
| Mary | 141 | 80.1 years |
| William | 118 | 74.8 years |
| Charles | 93 | 73.8 years |
| Robert | 93 | 69.6 years |
| John | 91 | 74.7 years |
| James | 89 | 73.7 years |
| George | 51 | 76.8 years |
| Helen | 50 | 78.5 years |
| Ruth | 47 | 80.6 years |
| Frank | 42 | 78.1 years |
| Most common last names in Olney, IL among deceased individuals | ||
| Last name | Count | Lived (average) |
|---|---|---|
| Miller | 48 | 73.3 years |
| Smith | 43 | 78.2 years |
| Jones | 41 | 80.9 years |
| Brown | 36 | 77.5 years |
| Martin | 35 | 73.8 years |
| Harmon | 34 | 70.0 years |
| Burgener | 33 | 81.5 years |
| Williams | 32 | 75.8 years |
| Wilson | 28 | 81.0 years |
| Anderson | 28 | 77.4 years |
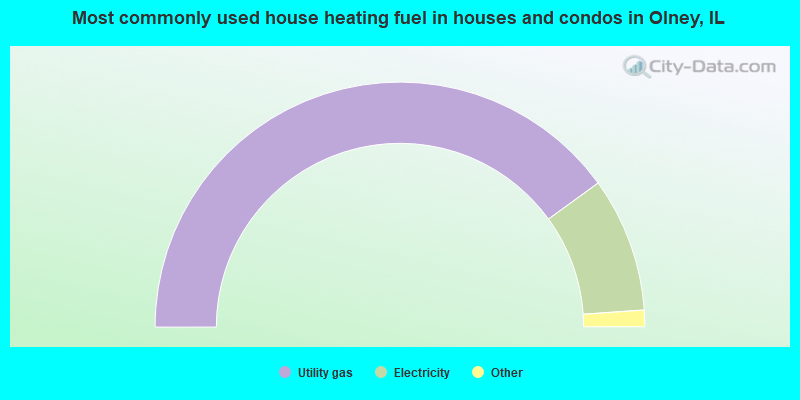
- 80.0%Utility gas
- 17.8%Electricity
- 1.2%Wood
- 0.6%Bottled, tank, or LP gas
- 0.4%Other fuel
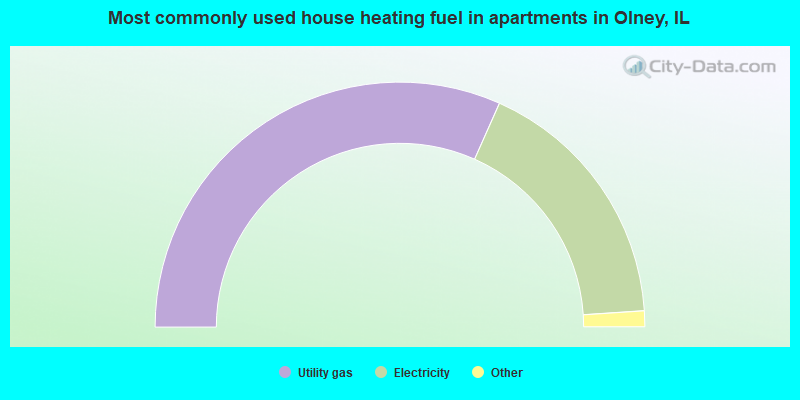
- 63.4%Utility gas
- 34.6%Electricity
- 1.0%Bottled, tank, or LP gas
- 0.9%Other fuel
Olney compared to Illinois state average:
- Median house value significantly below state average.
- Unemployed percentage below state average.
- Black race population percentage significantly below state average.
- Hispanic race population percentage significantly below state average.
- Foreign-born population percentage significantly below state average.
- Length of stay since moving in above state average.
- Institutionalized population percentage above state average.
Olney on our top lists:
- #95 on the list of "Top 101 cities with largest percentage of males in occupations: community and social service occupations (population 5,000+)"
- #90 on the list of "Top 101 counties with the lowest ground withdrawal of fresh water for public supply"

|
|
Total of 7 patent applications in 2008-2024.