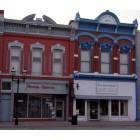
Ottawa, Kansas Submit your own pictures of this city and show them to the world
OSM Map
General Map
Google Map
MSN Map
OSM Map
General Map
Google Map
MSN Map
OSM Map
General Map
Google Map
MSN Map
OSM Map
General Map
Google Map
MSN Map
Please wait while loading the map...
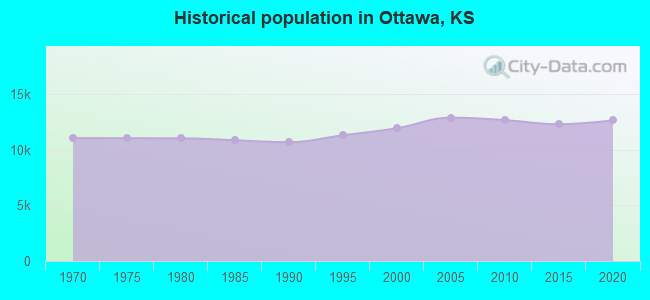
Population in 2022: 12,613 (98% urban, 2% rural). Population change since 2000: +5.8%Males: 6,139 Females: 6,474
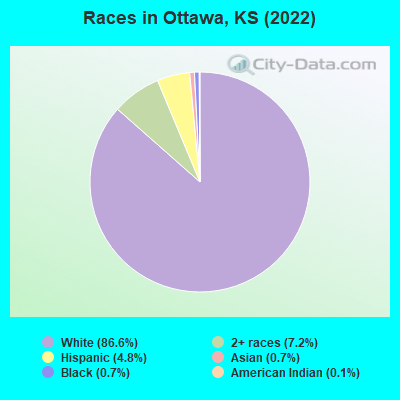
March 2022 cost of living index in Ottawa: 80.9 (low, U.S. average is 100) Percentage of residents living in poverty in 2022: 9.7%for White Non-Hispanic residents , 17.6% for Black residents , 25.4% for Hispanic or Latino residents , 32.9% for other race residents , 9.0% for two or more races residents )
Profiles of local businesses
Business Search - 14 Million verified businesses
Data:
Median household income ($)
Median household income (% change since 2000)
Household income diversity
Ratio of average income to average house value (%)
Ratio of average income to average rent
Median household income ($) - White
Median household income ($) - Black or African American
Median household income ($) - Asian
Median household income ($) - Hispanic or Latino
Median household income ($) - American Indian and Alaska Native
Median household income ($) - Multirace
Median household income ($) - Other Race
Median household income for houses/condos with a mortgage ($)
Median household income for apartments without a mortgage ($)
Races - White alone (%)
Races - White alone (% change since 2000)
Races - Black alone (%)
Races - Black alone (% change since 2000)
Races - American Indian alone (%)
Races - American Indian alone (% change since 2000)
Races - Asian alone (%)
Races - Asian alone (% change since 2000)
Races - Hispanic (%)
Races - Hispanic (% change since 2000)
Races - Native Hawaiian and Other Pacific Islander alone (%)
Races - Native Hawaiian and Other Pacific Islander alone (% change since 2000)
Races - Two or more races (%)
Races - Two or more races (% change since 2000)
Races - Other race alone (%)
Races - Other race alone (% change since 2000)
Racial diversity
Unemployment (%)
Unemployment (% change since 2000)
Unemployment (%) - White
Unemployment (%) - Black or African American
Unemployment (%) - Asian
Unemployment (%) - Hispanic or Latino
Unemployment (%) - American Indian and Alaska Native
Unemployment (%) - Multirace
Unemployment (%) - Other Race
Population density (people per square mile)
Population - Males (%)
Population - Females (%)
Population - Males (%) - White
Population - Males (%) - Black or African American
Population - Males (%) - Asian
Population - Males (%) - Hispanic or Latino
Population - Males (%) - American Indian and Alaska Native
Population - Males (%) - Multirace
Population - Males (%) - Other Race
Population - Females (%) - White
Population - Females (%) - Black or African American
Population - Females (%) - Asian
Population - Females (%) - Hispanic or Latino
Population - Females (%) - American Indian and Alaska Native
Population - Females (%) - Multirace
Population - Females (%) - Other Race
Coronavirus confirmed cases (Apr 27, 2024)
Deaths caused by coronavirus (Apr 27, 2024)
Coronavirus confirmed cases (per 100k population) (Apr 27, 2024)
Deaths caused by coronavirus (per 100k population) (Apr 27, 2024)
Daily increase in number of cases (Apr 27, 2024)
Weekly increase in number of cases (Apr 27, 2024)
Cases doubled (in days) (Apr 27, 2024)
Hospitalized patients (Apr 18, 2022)
Negative test results (Apr 18, 2022)
Total test results (Apr 18, 2022)
COVID Vaccine doses distributed (per 100k population) (Sep 19, 2023)
COVID Vaccine doses administered (per 100k population) (Sep 19, 2023)
COVID Vaccine doses distributed (Sep 19, 2023)
COVID Vaccine doses administered (Sep 19, 2023)
Likely homosexual households (%)
Likely homosexual households (% change since 2000)
Likely homosexual households - Lesbian couples (%)
Likely homosexual households - Lesbian couples (% change since 2000)
Likely homosexual households - Gay men (%)
Likely homosexual households - Gay men (% change since 2000)
Cost of living index
Median gross rent ($)
Median contract rent ($)
Median monthly housing costs ($)
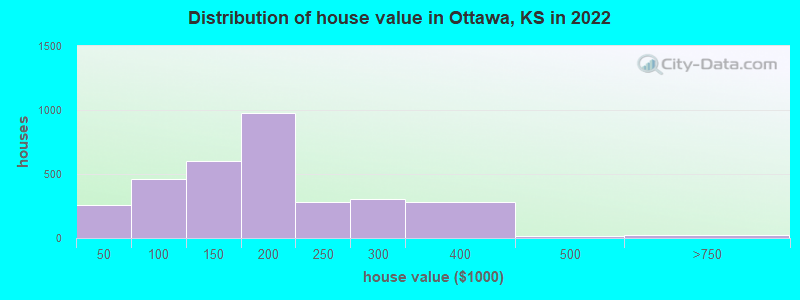
Median house or condo value ($)
Median house or condo value ($ change since 2000)
Mean house or condo value by units in structure - 1, detached ($)
Mean house or condo value by units in structure - 1, attached ($)
Mean house or condo value by units in structure - 2 ($)
Mean house or condo value by units in structure by units in structure - 3 or 4 ($)
Mean house or condo value by units in structure - 5 or more ($)
Mean house or condo value by units in structure - Boat, RV, van, etc. ($)
Mean house or condo value by units in structure - Mobile home ($)
Median house or condo value ($) - White
Median house or condo value ($) - Black or African American
Median house or condo value ($) - Asian
Median house or condo value ($) - Hispanic or Latino
Median house or condo value ($) - American Indian and Alaska Native
Median house or condo value ($) - Multirace
Median house or condo value ($) - Other Race
Median resident age
Resident age diversity
Median resident age - Males
Median resident age - Females
Median resident age - White
Median resident age - Black or African American
Median resident age - Asian
Median resident age - Hispanic or Latino
Median resident age - American Indian and Alaska Native
Median resident age - Multirace
Median resident age - Other Race
Median resident age - Males - White
Median resident age - Males - Black or African American
Median resident age - Males - Asian
Median resident age - Males - Hispanic or Latino
Median resident age - Males - American Indian and Alaska Native
Median resident age - Males - Multirace
Median resident age - Males - Other Race
Median resident age - Females - White
Median resident age - Females - Black or African American
Median resident age - Females - Asian
Median resident age - Females - Hispanic or Latino
Median resident age - Females - American Indian and Alaska Native
Median resident age - Females - Multirace
Median resident age - Females - Other Race
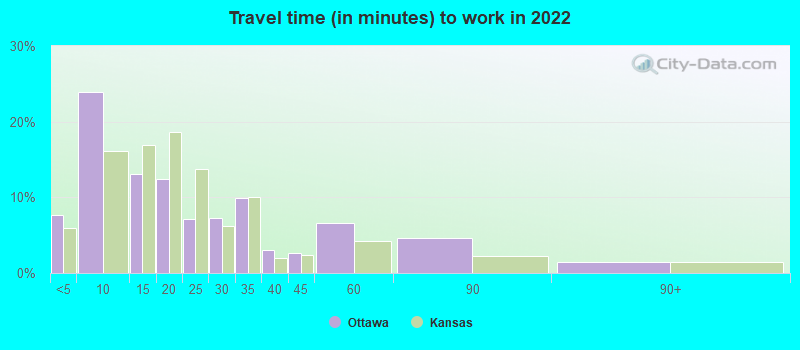
Commute - mean travel time to work (minutes)
Travel time to work - Less than 5 minutes (%)
Travel time to work - Less than 5 minutes (% change since 2000)
Travel time to work - 5 to 9 minutes (%)
Travel time to work - 5 to 9 minutes (% change since 2000)
Travel time to work - 10 to 19 minutes (%)
Travel time to work - 10 to 19 minutes (% change since 2000)
Travel time to work - 20 to 29 minutes (%)
Travel time to work - 20 to 29 minutes (% change since 2000)
Travel time to work - 30 to 39 minutes (%)
Travel time to work - 30 to 39 minutes (% change since 2000)
Travel time to work - 40 to 59 minutes (%)
Travel time to work - 40 to 59 minutes (% change since 2000)
Travel time to work - 60 to 89 minutes (%)
Travel time to work - 60 to 89 minutes (% change since 2000)
Travel time to work - 90 or more minutes (%)
Travel time to work - 90 or more minutes (% change since 2000)
Marital status - Never married (%)
Marital status - Now married (%)
Marital status - Separated (%)
Marital status - Widowed (%)
Marital status - Divorced (%)
Median family income ($)
Median family income (% change since 2000)
Median non-family income ($)
Median non-family income (% change since 2000)
Median per capita income ($)
Median per capita income (% change since 2000)
Median family income ($) - White
Median family income ($) - Black or African American
Median family income ($) - Asian
Median family income ($) - Hispanic or Latino
Median family income ($) - American Indian and Alaska Native
Median family income ($) - Multirace
Median family income ($) - Other Race
Median year house/condo built
Median year apartment built
Year house built - Built 2005 or later (%)
Year house built - Built 2000 to 2004 (%)
Year house built - Built 1990 to 1999 (%)
Year house built - Built 1980 to 1989 (%)
Year house built - Built 1970 to 1979 (%)
Year house built - Built 1960 to 1969 (%)
Year house built - Built 1950 to 1959 (%)
Year house built - Built 1940 to 1949 (%)
Year house built - Built 1939 or earlier (%)
Average household size
Household density (households per square mile)
Average household size - White
Average household size - Black or African American
Average household size - Asian
Average household size - Hispanic or Latino
Average household size - American Indian and Alaska Native
Average household size - Multirace
Average household size - Other Race
Occupied housing units (%)
Vacant housing units (%)
Owner occupied housing units (%)
Renter occupied housing units (%)
Vacancy status - For rent (%)
Vacancy status - For sale only (%)
Vacancy status - Rented or sold, not occupied (%)
Vacancy status - For seasonal, recreational, or occasional use (%)
Vacancy status - For migrant workers (%)
Vacancy status - Other vacant (%)
Residents with income below the poverty level (%)
Residents with income below 50% of the poverty level (%)
Children below poverty level (%)
Poor families by family type - Married-couple family (%)
Poor families by family type - Male, no wife present (%)
Poor families by family type - Female, no husband present (%)
Poverty status for native-born residents (%)
Poverty status for foreign-born residents (%)
Poverty among high school graduates not in families (%)
Poverty among people who did not graduate high school not in families (%)
Residents with income below the poverty level (%) - White
Residents with income below the poverty level (%) - Black or African American
Residents with income below the poverty level (%) - Asian
Residents with income below the poverty level (%) - Hispanic or Latino
Residents with income below the poverty level (%) - American Indian and Alaska Native
Residents with income below the poverty level (%) - Multirace
Residents with income below the poverty level (%) - Other Race
Air pollution - Air Quality Index (AQI)
Air pollution - CO
Air pollution - NO2
Air pollution - SO2
Air pollution - Ozone
Air pollution - PM10
Air pollution - PM25
Air pollution - Pb
Crime - Murders per 100,000 population
Crime - Rapes per 100,000 population
Crime - Robberies per 100,000 population
Crime - Assaults per 100,000 population
Crime - Burglaries per 100,000 population
Crime - Thefts per 100,000 population
Crime - Auto thefts per 100,000 population
Crime - Arson per 100,000 population
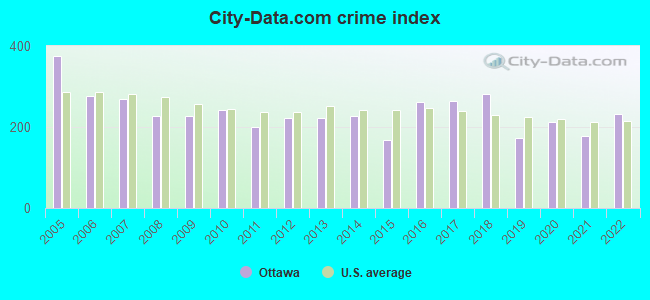
Crime - City-data.com crime index
Crime - Violent crime index
Crime - Property crime index
Crime - Murders per 100,000 population (5 year average)
Crime - Rapes per 100,000 population (5 year average)
Crime - Robberies per 100,000 population (5 year average)
Crime - Assaults per 100,000 population (5 year average)
Crime - Burglaries per 100,000 population (5 year average)
Crime - Thefts per 100,000 population (5 year average)
Crime - Auto thefts per 100,000 population (5 year average)
Crime - Arson per 100,000 population (5 year average)
Crime - City-data.com crime index (5 year average)
Crime - Violent crime index (5 year average)
Crime - Property crime index (5 year average)
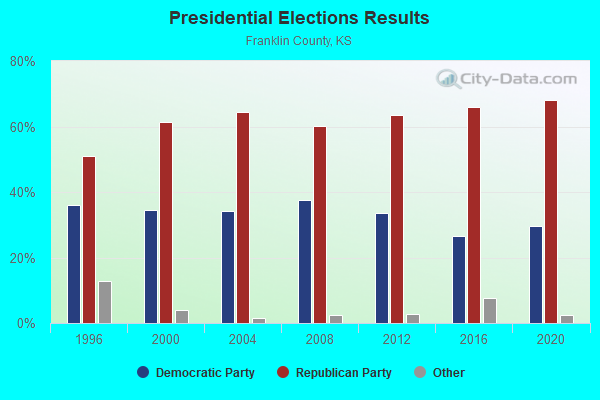
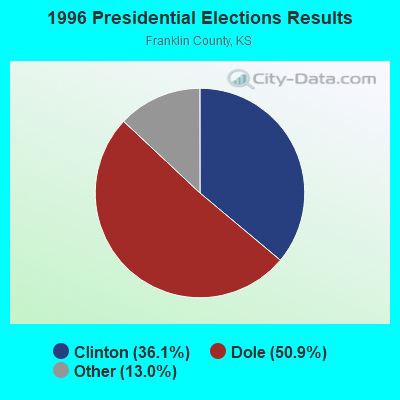
1996 Presidential Elections Results (%) - Democratic Party (Clinton)
1996 Presidential Elections Results (%) - Republican Party (Dole)
1996 Presidential Elections Results (%) - Other
2000 Presidential Elections Results (%) - Democratic Party (Gore)
2000 Presidential Elections Results (%) - Republican Party (Bush)
2000 Presidential Elections Results (%) - Other
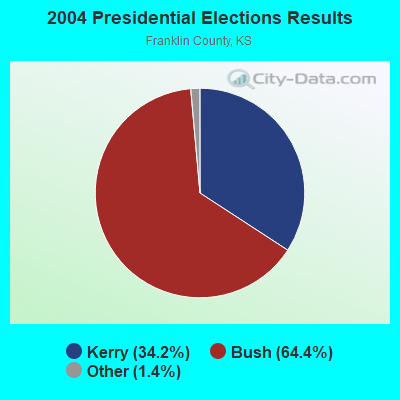
2004 Presidential Elections Results (%) - Democratic Party (Kerry)
2004 Presidential Elections Results (%) - Republican Party (Bush)
2004 Presidential Elections Results (%) - Other
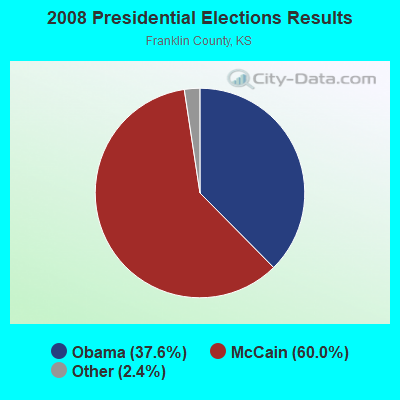
2008 Presidential Elections Results (%) - Democratic Party (Obama)
2008 Presidential Elections Results (%) - Republican Party (McCain)
2008 Presidential Elections Results (%) - Other
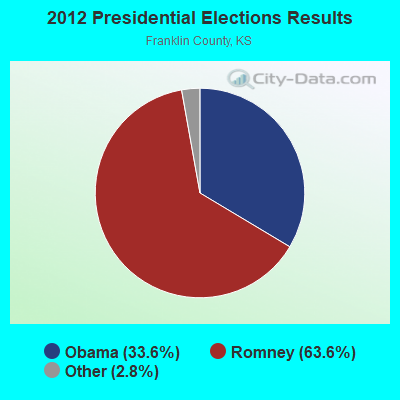
2012 Presidential Elections Results (%) - Democratic Party (Obama)
2012 Presidential Elections Results (%) - Republican Party (Romney)
2012 Presidential Elections Results (%) - Other
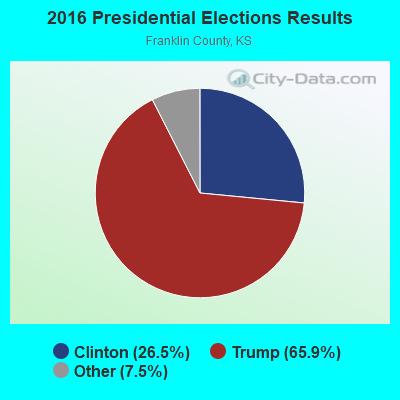
2016 Presidential Elections Results (%) - Democratic Party (Clinton)
2016 Presidential Elections Results (%) - Republican Party (Trump)
2016 Presidential Elections Results (%) - Other
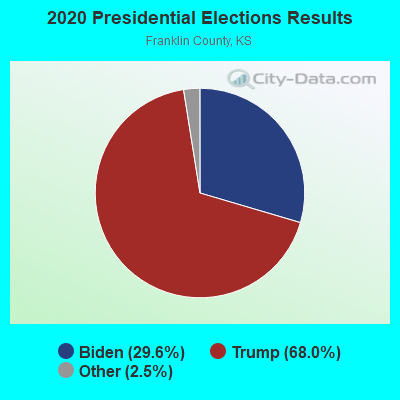
2020 Presidential Elections Results (%) - Democratic Party (Biden)
2020 Presidential Elections Results (%) - Republican Party (Trump)
2020 Presidential Elections Results (%) - Other
Ancestries Reported - Arab (%)
Ancestries Reported - Czech (%)
Ancestries Reported - Danish (%)
Ancestries Reported - Dutch (%)
Ancestries Reported - English (%)
Ancestries Reported - French (%)
Ancestries Reported - French Canadian (%)
Ancestries Reported - German (%)
Ancestries Reported - Greek (%)
Ancestries Reported - Hungarian (%)
Ancestries Reported - Irish (%)
Ancestries Reported - Italian (%)
Ancestries Reported - Lithuanian (%)
Ancestries Reported - Norwegian (%)
Ancestries Reported - Polish (%)
Ancestries Reported - Portuguese (%)
Ancestries Reported - Russian (%)
Ancestries Reported - Scotch-Irish (%)
Ancestries Reported - Scottish (%)
Ancestries Reported - Slovak (%)
Ancestries Reported - Subsaharan African (%)
Ancestries Reported - Swedish (%)
Ancestries Reported - Swiss (%)
Ancestries Reported - Ukrainian (%)
Ancestries Reported - United States (%)
Ancestries Reported - Welsh (%)
Ancestries Reported - West Indian (%)
Ancestries Reported - Other (%)
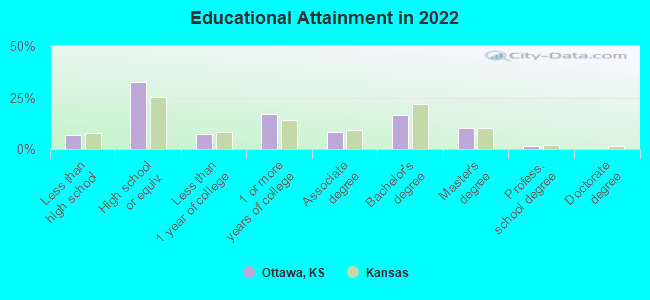
Educational Attainment - No schooling completed (%)
Educational Attainment - Less than high school (%)
Educational Attainment - High school or equivalent (%)
Educational Attainment - Less than 1 year of college (%)
Educational Attainment - 1 or more years of college (%)
Educational Attainment - Associate degree (%)
Educational Attainment - Bachelor's degree (%)
Educational Attainment - Master's degree (%)
Educational Attainment - Professional school degree (%)
Educational Attainment - Doctorate degree (%)
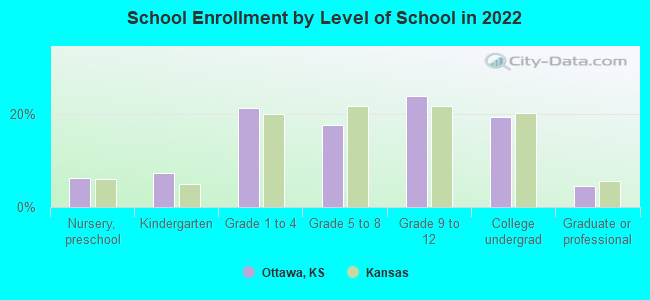
School Enrollment - Nursery, preschool (%)
School Enrollment - Kindergarten (%)
School Enrollment - Grade 1 to 4 (%)
School Enrollment - Grade 5 to 8 (%)
School Enrollment - Grade 9 to 12 (%)
School Enrollment - College undergrad (%)
School Enrollment - Graduate or professional (%)
School Enrollment - Not enrolled in school (%)
School enrollment - Public schools (%)
School enrollment - Private schools (%)
School enrollment - Not enrolled (%)
Median number of rooms in houses and condos
Median number of rooms in apartments
Housing units lacking complete plumbing facilities (%)
Housing units lacking complete kitchen facilities (%)
Density of houses
Urban houses (%)
Rural houses (%)
Households with people 60 years and over (%)
Households with people 65 years and over (%)
Households with people 75 years and over (%)
Households with one or more nonrelatives (%)
Households with no nonrelatives (%)
Population in households (%)
Family households (%)
Nonfamily households (%)
Population in families (%)
Family households with own children (%)
Median number of bedrooms in owner occupied houses
Mean number of bedrooms in owner occupied houses
Median number of bedrooms in renter occupied houses
Mean number of bedrooms in renter occupied houses
Median number of vehichles in owner occupied houses
Mean number of vehichles in owner occupied houses
Median number of vehichles in renter occupied houses
Mean number of vehichles in renter occupied houses
Mortgage status - with mortgage (%)
Mortgage status - with second mortgage (%)
Mortgage status - with home equity loan (%)
Mortgage status - with both second mortgage and home equity loan (%)
Mortgage status - without a mortgage (%)
Average family size
Average family size - White
Average family size - Black or African American
Average family size - Asian
Average family size - Hispanic or Latino
Average family size - American Indian and Alaska Native
Average family size - Multirace
Average family size - Other Race
Geographical mobility - Same house 1 year ago (%)
Geographical mobility - Moved within same county (%)
Geographical mobility - Moved from different county within same state (%)
Geographical mobility - Moved from different state (%)
Geographical mobility - Moved from abroad (%)
Place of birth - Born in state of residence (%)
Place of birth - Born in other state (%)
Place of birth - Native, outside of US (%)
Place of birth - Foreign born (%)
Housing units in structures - 1, detached (%)
Housing units in structures - 1, attached (%)
Housing units in structures - 2 (%)
Housing units in structures - 3 or 4 (%)
Housing units in structures - 5 to 9 (%)
Housing units in structures - 10 to 19 (%)
Housing units in structures - 20 to 49 (%)
Housing units in structures - 50 or more (%)
Housing units in structures - Mobile home (%)
Housing units in structures - Boat, RV, van, etc. (%)
House/condo owner moved in on average (years ago)
Renter moved in on average (years ago)
Year householder moved into unit - Moved in 1999 to March 2000 (%)
Year householder moved into unit - Moved in 1995 to 1998 (%)
Year householder moved into unit - Moved in 1990 to 1994 (%)
Year householder moved into unit - Moved in 1980 to 1989 (%)
Year householder moved into unit - Moved in 1970 to 1979 (%)
Year householder moved into unit - Moved in 1969 or earlier (%)
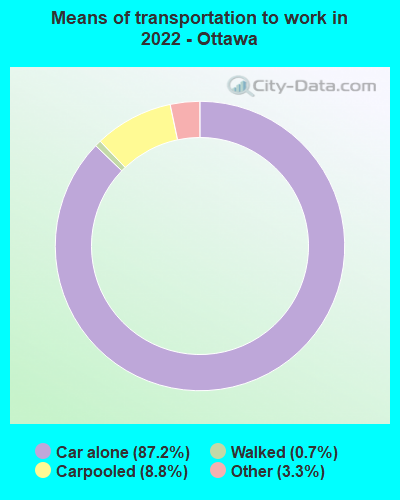
Means of transportation to work - Drove car alone (%)
Means of transportation to work - Carpooled (%)
Means of transportation to work - Public transportation (%)
Means of transportation to work - Bus or trolley bus (%)
Means of transportation to work - Streetcar or trolley car (%)
Means of transportation to work - Subway or elevated (%)
Means of transportation to work - Railroad (%)
Means of transportation to work - Ferryboat (%)
Means of transportation to work - Taxicab (%)
Means of transportation to work - Motorcycle (%)
Means of transportation to work - Bicycle (%)
Means of transportation to work - Walked (%)
Means of transportation to work - Other means (%)
Working at home (%)
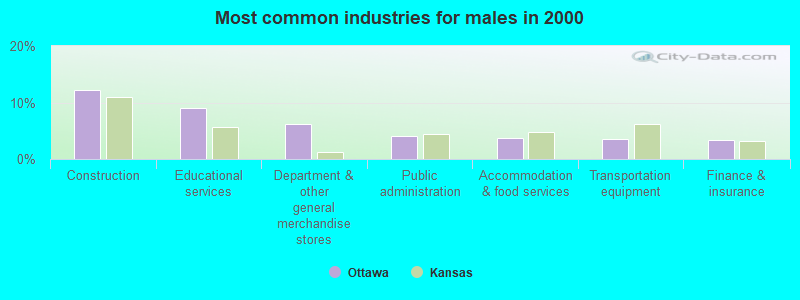
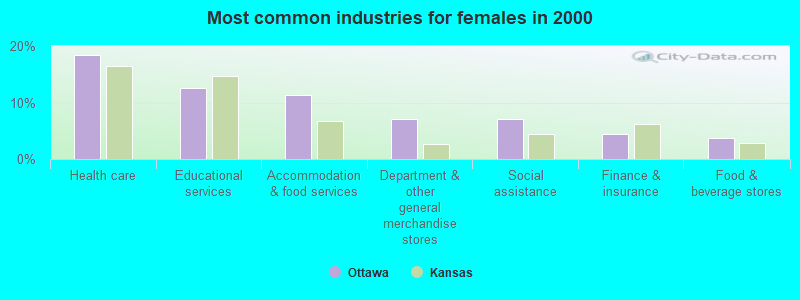
Industry diversity
Most Common Industries - Agriculture, forestry, fishing and hunting, and mining (%)
Most Common Industries - Agriculture, forestry, fishing and hunting (%)
Most Common Industries - Mining, quarrying, and oil and gas extraction (%)
Most Common Industries - Construction (%)
Most Common Industries - Manufacturing (%)
Most Common Industries - Wholesale trade (%)
Most Common Industries - Retail trade (%)
Most Common Industries - Transportation and warehousing, and utilities (%)
Most Common Industries - Transportation and warehousing (%)
Most Common Industries - Utilities (%)
Most Common Industries - Information (%)
Most Common Industries - Finance and insurance, and real estate and rental and leasing (%)
Most Common Industries - Finance and insurance (%)
Most Common Industries - Real estate and rental and leasing (%)
Most Common Industries - Professional, scientific, and management, and administrative and waste management services (%)
Most Common Industries - Professional, scientific, and technical services (%)
Most Common Industries - Management of companies and enterprises (%)
Most Common Industries - Administrative and support and waste management services (%)
Most Common Industries - Educational services, and health care and social assistance (%)
Most Common Industries - Educational services (%)
Most Common Industries - Health care and social assistance (%)
Most Common Industries - Arts, entertainment, and recreation, and accommodation and food services (%)
Most Common Industries - Arts, entertainment, and recreation (%)
Most Common Industries - Accommodation and food services (%)
Most Common Industries - Other services, except public administration (%)
Most Common Industries - Public administration (%)
Occupation diversity
Most Common Occupations - Management, business, science, and arts occupations (%)
Most Common Occupations - Management, business, and financial occupations (%)
Most Common Occupations - Management occupations (%)
Most Common Occupations - Business and financial operations occupations (%)
Most Common Occupations - Computer, engineering, and science occupations (%)
Most Common Occupations - Computer and mathematical occupations (%)
Most Common Occupations - Architecture and engineering occupations (%)
Most Common Occupations - Life, physical, and social science occupations (%)
Most Common Occupations - Education, legal, community service, arts, and media occupations (%)
Most Common Occupations - Community and social service occupations (%)
Most Common Occupations - Legal occupations (%)
Most Common Occupations - Education, training, and library occupations (%)
Most Common Occupations - Arts, design, entertainment, sports, and media occupations (%)
Most Common Occupations - Healthcare practitioners and technical occupations (%)
Most Common Occupations - Health diagnosing and treating practitioners and other technical occupations (%)
Most Common Occupations - Health technologists and technicians (%)
Most Common Occupations - Service occupations (%)
Most Common Occupations - Healthcare support occupations (%)
Most Common Occupations - Protective service occupations (%)
Most Common Occupations - Fire fighting and prevention, and other protective service workers including supervisors (%)
Most Common Occupations - Law enforcement workers including supervisors (%)
Most Common Occupations - Food preparation and serving related occupations (%)
Most Common Occupations - Building and grounds cleaning and maintenance occupations (%)
Most Common Occupations - Personal care and service occupations (%)
Most Common Occupations - Sales and office occupations (%)
Most Common Occupations - Sales and related occupations (%)
Most Common Occupations - Office and administrative support occupations (%)
Most Common Occupations - Natural resources, construction, and maintenance occupations (%)
Most Common Occupations - Farming, fishing, and forestry occupations (%)
Most Common Occupations - Construction and extraction occupations (%)
Most Common Occupations - Installation, maintenance, and repair occupations (%)
Most Common Occupations - Production, transportation, and material moving occupations (%)
Most Common Occupations - Production occupations (%)
Most Common Occupations - Transportation occupations (%)
Most Common Occupations - Material moving occupations (%)
People in Group quarters - Institutionalized population (%)
People in Group quarters - Correctional institutions (%)
People in Group quarters - Federal prisons and detention centers (%)
People in Group quarters - Halfway houses (%)
People in Group quarters - Local jails and other confinement facilities (including police lockups) (%)
People in Group quarters - Military disciplinary barracks (%)
People in Group quarters - State prisons (%)
People in Group quarters - Other types of correctional institutions (%)
People in Group quarters - Nursing homes (%)
People in Group quarters - Hospitals/wards, hospices, and schools for the handicapped (%)
People in Group quarters - Hospitals/wards and hospices for chronically ill (%)
People in Group quarters - Hospices or homes for chronically ill (%)
People in Group quarters - Military hospitals or wards for chronically ill (%)
People in Group quarters - Other hospitals or wards for chronically ill (%)
People in Group quarters - Hospitals or wards for drug/alcohol abuse (%)
People in Group quarters - Mental (Psychiatric) hospitals or wards (%)
People in Group quarters - Schools, hospitals, or wards for the mentally retarded (%)
People in Group quarters - Schools, hospitals, or wards for the physically handicapped (%)
People in Group quarters - Institutions for the deaf (%)
People in Group quarters - Institutions for the blind (%)
People in Group quarters - Orthopedic wards and institutions for the physically handicapped (%)
People in Group quarters - Wards in general hospitals for patients who have no usual home elsewhere (%)
People in Group quarters - Wards in military hospitals for patients who have no usual home elsewhere (%)
People in Group quarters - Juvenile institutions (%)
People in Group quarters - Long-term care (%)
People in Group quarters - Homes for abused, dependent, and neglected children (%)
People in Group quarters - Residential treatment centers for emotionally disturbed children (%)
People in Group quarters - Training schools for juvenile delinquents (%)
People in Group quarters - Short-term care, detention or diagnostic centers for delinquent children (%)
People in Group quarters - Type of juvenile institution unknown (%)
People in Group quarters - Noninstitutionalized population (%)
People in Group quarters - College dormitories (includes college quarters off campus) (%)
People in Group quarters - Military quarters (%)
People in Group quarters - On base (%)
People in Group quarters - Barracks, unaccompanied personnel housing (UPH), (Enlisted/Officer), ;and similar group living quarters for military personnel (%)
People in Group quarters - Transient quarters for temporary residents (%)
People in Group quarters - Military ships (%)
People in Group quarters - Group homes (%)
People in Group quarters - Homes or halfway houses for drug/alcohol abuse (%)
People in Group quarters - Homes for the mentally ill (%)
People in Group quarters - Homes for the mentally retarded (%)
People in Group quarters - Homes for the physically handicapped (%)
People in Group quarters - Other group homes (%)
People in Group quarters - Religious group quarters (%)
People in Group quarters - Dormitories (%)
People in Group quarters - Agriculture workers' dormitories on farms (%)
People in Group quarters - Job Corps and vocational training facilities (%)
People in Group quarters - Other workers' dormitories (%)
People in Group quarters - Crews of maritime vessels (%)
People in Group quarters - Other nonhousehold living situations (%)
People in Group quarters - Other noninstitutional group quarters (%)
Residents speaking English at home (%)
Residents speaking English at home - Born in the United States (%)
Residents speaking English at home - Native, born elsewhere (%)
Residents speaking English at home - Foreign born (%)
Residents speaking Spanish at home (%)
Residents speaking Spanish at home - Born in the United States (%)
Residents speaking Spanish at home - Native, born elsewhere (%)
Residents speaking Spanish at home - Foreign born (%)
Residents speaking other language at home (%)
Residents speaking other language at home - Born in the United States (%)
Residents speaking other language at home - Native, born elsewhere (%)
Residents speaking other language at home - Foreign born (%)
Class of Workers - Employee of private company (%)
Class of Workers - Self-employed in own incorporated business (%)
Class of Workers - Private not-for-profit wage and salary workers (%)
Class of Workers - Local government workers (%)
Class of Workers - State government workers (%)
Class of Workers - Federal government workers (%)
Class of Workers - Self-employed workers in own not incorporated business and Unpaid family workers (%)
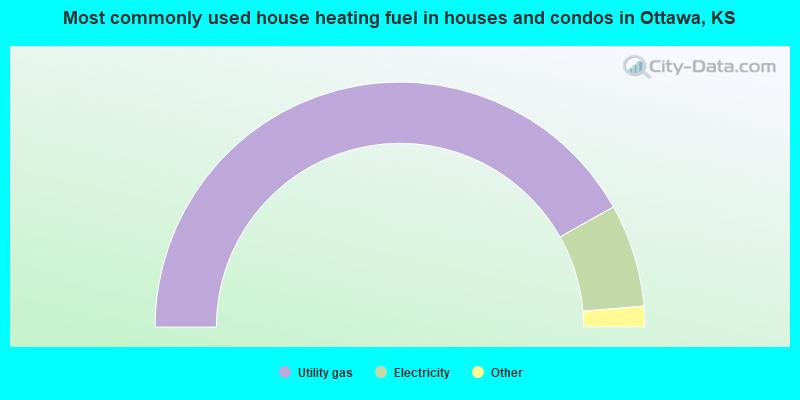
House heating fuel used in houses and condos - Utility gas (%)
House heating fuel used in houses and condos - Bottled, tank, or LP gas (%)
House heating fuel used in houses and condos - Electricity (%)
House heating fuel used in houses and condos - Fuel oil, kerosene, etc. (%)
House heating fuel used in houses and condos - Coal or coke (%)
House heating fuel used in houses and condos - Wood (%)
House heating fuel used in houses and condos - Solar energy (%)
House heating fuel used in houses and condos - Other fuel (%)
House heating fuel used in houses and condos - No fuel used (%)
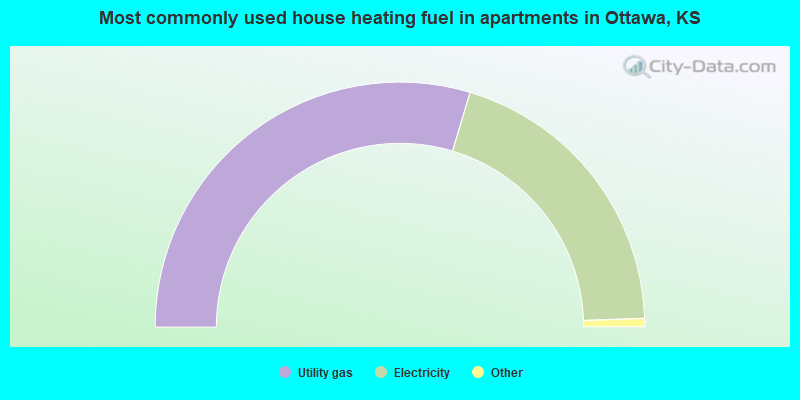
House heating fuel used in apartments - Utility gas (%)
House heating fuel used in apartments - Bottled, tank, or LP gas (%)
House heating fuel used in apartments - Electricity (%)
House heating fuel used in apartments - Fuel oil, kerosene, etc. (%)
House heating fuel used in apartments - Coal or coke (%)
House heating fuel used in apartments - Wood (%)
House heating fuel used in apartments - Solar energy (%)
House heating fuel used in apartments - Other fuel (%)
House heating fuel used in apartments - No fuel used (%)
Armed forces status - In Armed Forces (%)
Armed forces status - Civilian (%)
Armed forces status - Civilian - Veteran (%)
Armed forces status - Civilian - Nonveteran (%)
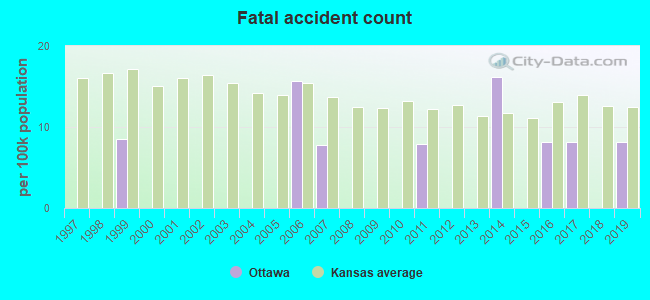
Fatal accidents locations in years 2005-2021
Fatal accidents locations in 2005
Fatal accidents locations in 2006
Fatal accidents locations in 2007
Fatal accidents locations in 2008
Fatal accidents locations in 2009
Fatal accidents locations in 2010
Fatal accidents locations in 2011
Fatal accidents locations in 2012
Fatal accidents locations in 2013
Fatal accidents locations in 2014
Fatal accidents locations in 2015
Fatal accidents locations in 2016
Fatal accidents locations in 2017
Fatal accidents locations in 2018
Fatal accidents locations in 2019
Fatal accidents locations in 2020
Fatal accidents locations in 2021
Alcohol use - People drinking some alcohol every month (%)
Alcohol use - People not drinking at all (%)
Alcohol use - Average days/month drinking alcohol
Alcohol use - Average drinks/week
Alcohol use - Average days/year people drink much
Audiometry - Average condition of hearing (%)
Audiometry - People that can hear a whisper from across a quiet room (%)
Audiometry - People that can hear normal voice from across a quiet room (%)
Audiometry - Ears ringing, roaring, buzzing (%)
Audiometry - Had a job exposure to loud noise (%)
Audiometry - Had off-work exposure to loud noise (%)
Blood Pressure & Cholesterol - Has high blood pressure (%)
Blood Pressure & Cholesterol - Checking blood pressure at home (%)
Blood Pressure & Cholesterol - Frequently checking blood cholesterol (%)
Blood Pressure & Cholesterol - Has high cholesterol level (%)
Consumer Behavior - Money monthly spent on food at supermarket/grocery store
Consumer Behavior - Money monthly spent on food at other stores
Consumer Behavior - Money monthly spent on eating out
Consumer Behavior - Money monthly spent on carryout/delivered foods
Consumer Behavior - Income spent on food at supermarket/grocery store (%)
Consumer Behavior - Income spent on food at other stores (%)
Consumer Behavior - Income spent on eating out (%)
Consumer Behavior - Income spent on carryout/delivered foods (%)
Current Health Status - General health condition (%)
Current Health Status - Blood donors (%)
Current Health Status - Has blood ever tested for HIV virus (%)
Current Health Status - Left-handed people (%)
Dermatology - People using sunscreen (%)
Diabetes - Diabetics (%)
Diabetes - Had a blood test for high blood sugar (%)
Diabetes - People taking insulin (%)
Diet Behavior & Nutrition - Diet health (%)
Diet Behavior & Nutrition - Milk product consumption (# of products/month)
Diet Behavior & Nutrition - Meals not home prepared (#/week)
Diet Behavior & Nutrition - Meals from fast food or pizza place (#/week)
Diet Behavior & Nutrition - Ready-to-eat foods (#/month)
Diet Behavior & Nutrition - Frozen meals/pizza (#/month)
Drug Use - People that ever used marijuana or hashish (%)
Drug Use - Ever used hard drugs (%)
Drug Use - Ever used any form of cocaine (%)
Drug Use - Ever used heroin (%)
Drug Use - Ever used methamphetamine (%)
Health Insurance - People covered by health insurance (%)
Kidney Conditions-Urology - Avg. # of times urinating at night
Medical Conditions - People with asthma (%)
Medical Conditions - People with anemia (%)
Medical Conditions - People with psoriasis (%)
Medical Conditions - People with overweight (%)
Medical Conditions - Elderly people having difficulties in thinking or remembering (%)
Medical Conditions - People who ever received blood transfusion (%)
Medical Conditions - People having trouble seeing even with glass/contacts (%)
Medical Conditions - People with arthritis (%)
Medical Conditions - People with gout (%)
Medical Conditions - People with congestive heart failure (%)
Medical Conditions - People with coronary heart disease (%)
Medical Conditions - People with angina pectoris (%)
Medical Conditions - People who ever had heart attack (%)
Medical Conditions - People who ever had stroke (%)
Medical Conditions - People with emphysema (%)
Medical Conditions - People with thyroid problem (%)
Medical Conditions - People with chronic bronchitis (%)
Medical Conditions - People with any liver condition (%)
Medical Conditions - People who ever had cancer or malignancy (%)
Mental Health - People who have little interest in doing things (%)
Mental Health - People feeling down, depressed, or hopeless (%)
Mental Health - People who have trouble sleeping or sleeping too much (%)
Mental Health - People feeling tired or having little energy (%)
Mental Health - People with poor appetite or overeating (%)
Mental Health - People feeling bad about themself (%)
Mental Health - People who have trouble concentrating on things (%)
Mental Health - People moving or speaking slowly or too fast (%)
Mental Health - People having thoughts they would be better off dead (%)
Oral Health - Average years since last visit a dentist
Oral Health - People embarrassed because of mouth (%)
Oral Health - People with gum disease (%)
Oral Health - General health of teeth and gums (%)
Oral Health - Average days a week using dental floss/device
Oral Health - Average days a week using mouthwash for dental problem
Oral Health - Average number of teeth
Pesticide Use - Households using pesticides to control insects (%)
Pesticide Use - Households using pesticides to kill weeds (%)
Physical Activity - People doing vigorous-intensity work activities (%)
Physical Activity - People doing moderate-intensity work activities (%)
Physical Activity - People walking or bicycling (%)
Physical Activity - People doing vigorous-intensity recreational activities (%)
Physical Activity - People doing moderate-intensity recreational activities (%)
Physical Activity - Average hours a day doing sedentary activities
Physical Activity - Average hours a day watching TV or videos
Physical Activity - Average hours a day using computer
Physical Functioning - People having limitations keeping them from working (%)
Physical Functioning - People limited in amount of work they can do (%)
Physical Functioning - People that need special equipment to walk (%)
Physical Functioning - People experiencing confusion/memory problems (%)
Physical Functioning - People requiring special healthcare equipment (%)
Prescription Medications - Average number of prescription medicines taking
Preventive Aspirin Use - Adults 40+ taking low-dose aspirin (%)
Reproductive Health - Vaginal deliveries (%)
Reproductive Health - Cesarean deliveries (%)
Reproductive Health - Deliveries resulted in a live birth (%)
Reproductive Health - Pregnancies resulted in a delivery (%)
Reproductive Health - Women breastfeeding newborns (%)
Reproductive Health - Women that had a hysterectomy (%)
Reproductive Health - Women that had both ovaries removed (%)
Reproductive Health - Women that have ever taken birth control pills (%)
Reproductive Health - Women taking birth control pills (%)
Reproductive Health - Women that have ever used Depo-Provera or injectables (%)
Reproductive Health - Women that have ever used female hormones (%)
Sexual Behavior - People 18+ that ever had sex (vaginal, anal, or oral) (%)
Sexual Behavior - Males 18+ that ever had vaginal sex with a woman (%)
Sexual Behavior - Males 18+ that ever performed oral sex on a woman (%)
Sexual Behavior - Males 18+ that ever had anal sex with a woman (%)
Sexual Behavior - Males 18+ that ever had any sex with a man (%)
Sexual Behavior - Females 18+ that ever had vaginal sex with a man (%)
Sexual Behavior - Females 18+ that ever performed oral sex on a man (%)
Sexual Behavior - Females 18+ that ever had anal sex with a man (%)
Sexual Behavior - Females 18+ that ever had any kind of sex with a woman (%)
Sexual Behavior - Average age people first had sex
Sexual Behavior - Average number of female sex partners in lifetime (males 18+)
Sexual Behavior - Average number of female vaginal sex partners in lifetime (males 18+)
Sexual Behavior - Average age people first performed oral sex on a woman (18+)
Sexual Behavior - Average number of woman performed oral sex on in lifetime (18+)
Sexual Behavior - Average number of male sex partners in lifetime (males 18+)
Sexual Behavior - Average number of male anal sex partners in lifetime (males 18+)
Sexual Behavior - Average age people first performed oral sex on a man (18+)
Sexual Behavior - Average number of male oral sex partners in lifetime (18+)
Sexual Behavior - People using protection when performing oral sex (%)
Sexual Behavior - Average number of times people have vaginal or anal sex a year
Sexual Behavior - People having sex without condom (%)
Sexual Behavior - Average number of male sex partners in lifetime (females 18+)
Sexual Behavior - Average number of male vaginal sex partners in lifetime (females 18+)
Sexual Behavior - Average number of female sex partners in lifetime (females 18+)
Sexual Behavior - Circumcised males 18+ (%)
Sleep Disorders - Average hours sleeping at night
Sleep Disorders - People that has trouble sleeping (%)
Smoking-Cigarette Use - People smoking cigarettes (%)
Taste & Smell - People 40+ having problems with smell (%)
Taste & Smell - People 40+ having problems with taste (%)
Taste & Smell - People 40+ that ever had wisdom teeth removed (%)
Taste & Smell - People 40+ that ever had tonsils teeth removed (%)
Taste & Smell - People 40+ that ever had a loss of consciousness because of a head injury (%)
Taste & Smell - People 40+ that ever had a broken nose or other serious injury to face or skull (%)
Taste & Smell - People 40+ that ever had two or more sinus infections (%)
Weight - Average height (inches)
Weight - Average weight (pounds)
Weight - Average BMI
Weight - People that are obese (%)
Weight - People that ever were obese (%)
Weight - People trying to lose weight (%)
According to our research of Kansas and other state lists, there were 56 registered sex offenders living in Ottawa, Kansas as of April 27, 2024 . The ratio of all residents to sex offenders in Ottawa is 223 to 1.The ratio of registered sex offenders to all residents in this city is near the state average.
Officers per 1,000 residents here:
2.52Kansas average:
2.70
Latest news from Ottawa, KS collected exclusively by city-data.com from local newspapers, TV, and radio stations
Ancestries: German (20.6%), American (19.2%), Irish (7.2%), English (6.5%), European (5.0%), Scottish (1.6%).
Current Local Time:
Incorporated on 11/23/1867
Land area: 6.69 square miles.
Population density: 1,884 people per square mile (low).
186 residents are foreign born
This city:
1.5%Kansas:
7.1%
Median real estate property taxes paid for housing units with mortgages in 2022: $2,941 (1.6%)Median real estate property taxes paid for housing units with no mortgage in 2022: $2,060 (1.6%)
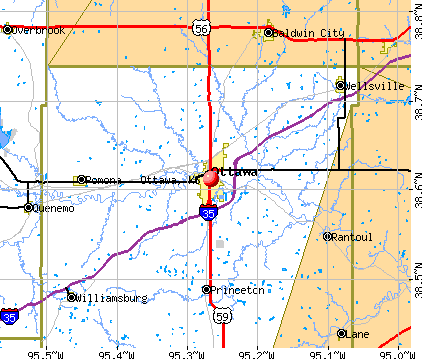
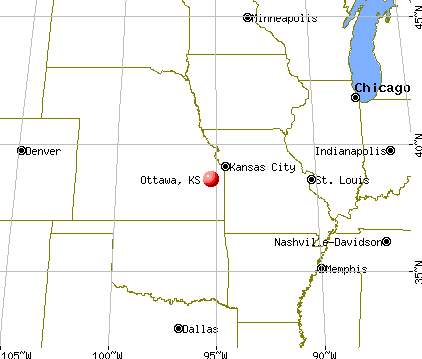
Nearest city with pop. 50,000+: Lawrence, KS
Nearest city with pop. 200,000+: Kansas City, MO
Nearest city with pop. 1,000,000+: Dallas, TX
Nearest cities:
Latitude: 38.61 N, Longitude: 95.27 W
Daytime population change due to commuting: +368 (+2.9%)Workers who live and work in this city: 3,385 (55.1%)
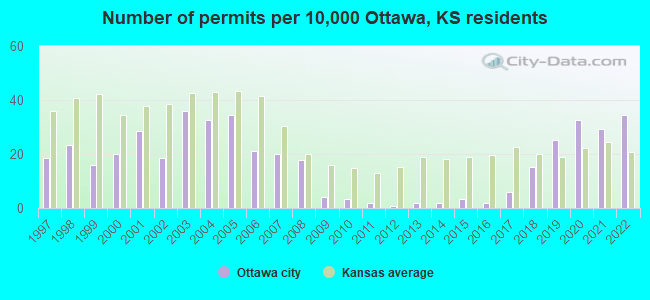
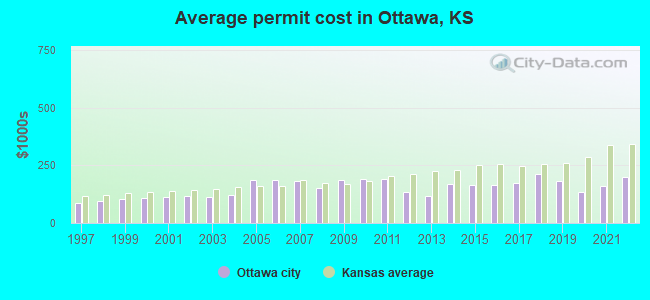
Single-family new house construction building permits:
2022: 41 buildings , average cost: $200,0002021: 35 buildings , average cost: $159,4002020: 39 buildings , average cost: $135,6002019: 30 buildings , average cost: $184,3002018: 18 buildings , average cost: $210,6002017: 7 buildings , average cost: $174,4002016: 2 buildings , average cost: $162,7002015: 4 buildings , average cost: $166,4002014: 2 buildings , average cost: $168,3002013: 2 buildings , average cost: $116,0002012: 1 building , cost: $136,4002011: 2 buildings , average cost: $192,4002010: 4 buildings , average cost: $188,5002009: 5 buildings , average cost: $187,4002008: 21 buildings , average cost: $149,7002007: 24 buildings , average cost: $180,0002006: 25 buildings , average cost: $185,1002005: 41 buildings , average cost: $186,2002004: 39 buildings , average cost: $122,9002003: 43 buildings , average cost: $111,1002002: 22 buildings , average cost: $116,9002001: 34 buildings , average cost: $114,0002000: 24 buildings , average cost: $108,6001999: 19 buildings , average cost: $101,9001998: 28 buildings , average cost: $94,2001997: 22 buildings , average cost: $85,700Unemployment in December 2023:
Population change in the 1990s: +849 (+7.7%).
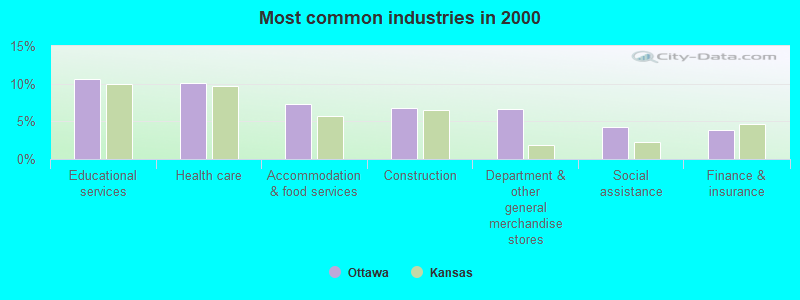
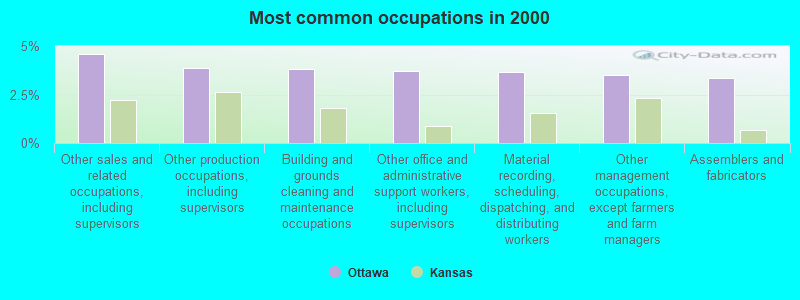
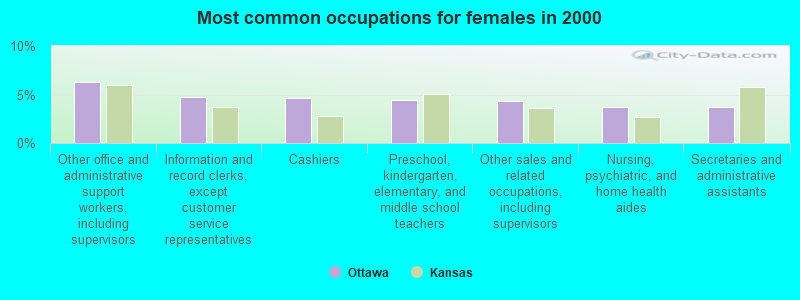
Most common occupations in Ottawa, KS (%)
Both Males Females
Other sales and related occupations, including supervisors (4.6%)
Other production occupations, including supervisors (3.9%)
Building and grounds cleaning and maintenance occupations (3.8%)
Other office and administrative support workers, including supervisors (3.7%)
Material recording, scheduling, dispatching, and distributing workers (3.7%)
Other management occupations, except farmers and farm managers (3.5%)
Assemblers and fabricators (3.4%)
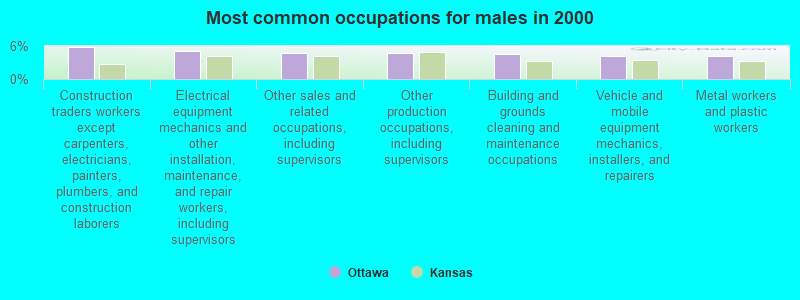
Construction traders workers except carpenters, electricians, painters, plumbers, and construction laborers (5.9%)
Electrical equipment mechanics and other installation, maintenance, and repair workers, including supervisors (5.2%)
Other sales and related occupations, including supervisors (4.8%)
Other production occupations, including supervisors (4.7%)
Building and grounds cleaning and maintenance occupations (4.5%)
Vehicle and mobile equipment mechanics, installers, and repairers (4.2%)
Metal workers and plastic workers (4.2%)
Other office and administrative support workers, including supervisors (6.3%)
Information and record clerks, except customer service representatives (4.7%)
Cashiers (4.7%)
Preschool, kindergarten, elementary, and middle school teachers (4.4%)
Other sales and related occupations, including supervisors (4.4%)
Nursing, psychiatric, and home health aides (3.7%)
Secretaries and administrative assistants (3.7%)
Tornado activity:
Ottawa-area historical tornado activity is near Kansas state average. It is 95% greater than the overall U.S. average.
On 5/20/1957, a category F5 (max. wind speeds 261-318 mph) tornado 16.9 miles away from the Ottawa city center killed 44 people and injured 207 people and caused between $500,000 and $5,000,000 in damages.
On 4/12/1964, a category F4 (max. wind speeds 207-260 mph) tornado 18.3 miles away from the city center killed 3 people and injured 9 people and caused between $50,000 and $500,000 in damages.
Earthquake activity:
Ottawa-area historical earthquake activity is significantly above Kansas state average. It is 586% greater than the overall U.S. average. On 9/3/2016 at 12:02:44, a magnitude 5.8 (5.8 MW, Depth: 3.5 mi, Class: Moderate, Intensity: VI - VII) earthquake occurred 176.6 miles away from the city center On 11/6/2011 at 03:53:10, a magnitude 5.7 (5.7 MW, Depth: 3.2 mi) earthquake occurred 228.5 miles away from Ottawa center On 11/12/2014 at 21:40:00, a magnitude 4.9 (4.9 MW, Depth: 2.5 mi, Class: Light, Intensity: IV - V) earthquake occurred 158.4 miles away from the city center On 11/7/2016 at 01:44:24, a magnitude 5.0 (5.0 MW, Depth: 2.8 mi) earthquake occurred 200.0 miles away from the city center On 2/13/2016 at 17:07:06, a magnitude 5.1 (5.1 MW, Depth: 5.2 mi) earthquake occurred 239.1 miles away from the city center On 1/19/2020 at 19:08:42, a magnitude 4.5 (4.5 MW, Depth: 3.1 mi) earthquake occurred 152.4 miles away from Ottawa center Magnitude types: moment magnitude (MW) Natural disasters: The number of natural disasters in Franklin County (18) is near the US average (15).Major Disasters (Presidential) Declared: 14Emergencies Declared: 2Floods: 12, Storms: 11, Tornadoes: 7, Winter Storms: 3, Snowstorms: 2, Winds: 2, Heavy Rain: 1, Hurricane: 1, Ice Storm: 1, Landslide: 1, Mudslide: 1, Other: 1 (Note: some incidents may be assigned to more than one category). Hospitals and medical centers in Ottawa: RANSOM MEMORIAL HOSPITAL (Government - Local, 1301 S MAIN STREET) CRESTVIEW NURSING HOME (1140 W SEVENTH ST TERR)
OTTAWA RETIREMENT VILLAGE (1100 W 15TH ST)
KANSAS DIALYSIS SERVICES - OTTAWA (1320 S. ASH #206)
Colleges/Universities in Ottawa: Ottawa University-Ottawa Full-time enrollment: 546; Location: 1001 South Cedar; Private, not-for-profit; Website: www.ottawa.edu; Offers Master's degree )
Ottawa University-Online Full-time enrollment: 434; Location: 1001 South Cedar; Private, not-for-profit; Website: www.ottawa.edu/; Offers Master's degree )
Colleges/universities with over 2000 students nearest to Ottawa:
Baker University (about 13 miles; Baldwin City, KS ; Full-time enrollment: 2,752)
University of Kansas (about 24 miles; Lawrence, KS ; FT enrollment: 22,788)
MidAmerica Nazarene University (about 32 miles; Olathe, KS ; FT enrollment: 2,158)
Johnson County Community College (about 37 miles; Overland Park, KS ; FT enrollment: 11,976)
Washburn University (about 38 miles; Topeka, KS ; FT enrollment: 5,092)
Wright Career College (about 40 miles; Overland Park, KS ; FT enrollment: 3,107)
Kansas City Kansas Community College (about 45 miles; Kansas City, KS ; FT enrollment: 4,718)
Public high school in Ottawa: OTTAWA SR HIGH Students: 806, Location: 1120 SOUTH ASH, Grades: 6-12)Private high school in Ottawa: BETHEL CHRISTIAN ACADEMY Students: 28, Location: 3755 NEVADA RD, Grades: KG-12)
Public elementary/middle schools in Ottawa: OTTAWA MIDDLE SCHOOL Students: 515, Location: 1230 SOUTH ASH, Grades: 6-8)GARFIELD ELEM Students: 357, Location: 1213 COLLEGE, Grades: PK-5)EUGENE FIELD ELEM Students: 245, Location: 720 TREMONT, Grades: PK-5)LINCOLN ELEM Location: 1102 MILNER, Grades: PK-5)
Private elementary/middle school in Ottawa: SACRED HEART CATHOLIC SCHOOL Students: 75, Location: 426 S CEDAR ST, Grades: PK-5)
See full list of schools located in Ottawa Library in Ottawa: OTTAWA LIBRARY Operating income: $791,283; Location: 105 S HICKORY ST; 52,182 books ; 1,559 audio materials ; 3,141 video materials ; 30 state licensed databases ; 123 print serial subscriptions )
Notable locations in Ottawa: (A) , Ottawa Wastewater Plant (B) , Ottawa Municipal Power Plant (C) , Ottawa Fairgrounds (D) , Old Franklin County Courthouse (E) , Franklin County Sheriff's Office (F) , Ottawa Police Department (G) , Franklin County Office Annex (H) , Franklin County Courthouse (I) , Franklin County Health Department (J) , Ottawa Fire Department Station 2 (K) , Ottawa Fire Department Station 1 (L) , Franklin County Juvenile Detention Center (M) , Franklin County Ambulance Service Station 1 (N) , Ottawa Library (O) , Dietrich Cabin (P) , Old Depot Museum (Q) , Ottawa City Hall (R) , Carnegie Cultural Center (S) , Ottawa Municipal Auditorium (T) . Display/hide their locations on the map
Churches in Ottawa include: (A) , Cherry Street Wesleyan Church (B) , Church of Christ (C) , Cornerstone Church (D) , First Southern Baptist Church (E) , Living Way Apostolic Church (F) , Pilgrim Bible Church (G) , Temple Victory (H) , Town and Country Church of Christ (I) . Display/hide their locations on the map
Cemeteries: (1) , Mount Calvary Cemetery (2) , Highland Cemetery (3) . Display/hide their locations on the map
Creeks: (A) , Nugent Creek (B) . Display/hide their locations on the map
Park in Ottawa: (1) . Display/hide its location on the map
Tourist attractions:
Hotels:
Courts:
Birthplace of: Gary Hart, Jerry Voorhis - Congressman, Paul Helms - Baking industry executive, John G. Thompson - Mathematician, Merritt C. Mechem - Politician, Steven Hawley - Astronaut, Stanley Sheldon - Bass guitarist.
Franklin County has a predicted average indoor radon screening level between 2 and 4 pCi/L (pico curies per liter) - Moderate Potential Drinking water stations with addresses in Ottawa and their reported violations in the past:
FRANKLIN CO RWD 2 (Population served: 400, Purch surface water):
Past health violations:
MCL, Monthly (TCR) - In DEC-2005, Contaminant: Coliform. Follow-up actions: St Public Notif requested (DEC-29-2005), St Violation/Reminder Notice (DEC-29-2005), St Compliance achieved (JAN-31-2006), St Public Notif received (FEB-06-2006)
Drinking water stations with addresses in Ottawa that have no violations reported:
FRANKLIN CO RWD 5 (Population served: 855, Primary Water Source Type: Groundwater)
FRANKLIN CO RWD 1 (Population served: 665, Primary Water Source Type: Purch surface water)
Average household size: This city:
2.5 peopleKansas:
2.5 people
Percentage of family households: This city:
62.6%Whole state:
66.0%
Percentage of households with unmarried partners: This city:
7.5%Whole state:
5.8%
Likely homosexual households (counted as self-reported same-sex unmarried-partner households)
Lesbian couples: 0.4% of all households Gay men: 0.2% of all households
People in group quarters in Ottawa in 2010:
308 people in college/university student housing
40 people in local jails and other municipal confinement facilities
39 people in workers' group living quarters and job corps centers
6 people in nursing facilities/skilled-nursing facilities
3 people in correctional facilities intended for juveniles
3 people in group homes intended for adults
People in group quarters in Ottawa in 2000:
223 people in college dormitories (includes college quarters off campus)
186 people in nursing homes
45 people in local jails and other confinement facilities (including police lockups)
36 people in job corps and vocational training facilities
10 people in other noninstitutional group quarters
8 people in other nonhousehold living situations
Banks with branches in Ottawa (2011 data):
Peoples Bank: South Store Branch at 1506 South Main, branch established on 2002/06/01; Ottawa Branch at 434 South Main Street, branch established on 2002/12/14. Info updated 2006/11/03: Bank assets: $514.1 mil, Deposits: $368.7 mil, headquarters in Lawrence, KS, positive income , Commercial Lending Specialization, 15 total offices , Holding Company: Winter Trust Of 12/3/74
The Kansas State Bank: at 236 North Main Street, branch established on 1917/11/20; Detached Facility at 1314 South Main Street, branch established on 1978/02/22. Info updated 2006/11/03: Bank assets: $116.0 mil, Deposits: $102.7 mil, local headquarters , positive income , 3 total offices , Holding Company: Ottawa Bancshares, Inc.
Great Southern Bank: Ottawa Branch at 2040 S. Princeton, branch established on 1924/01/01. Info updated 2012/02/03: Bank assets: $3,788.7 mil, Deposits: $2,986.3 mil, headquarters in Reeds Spring, MO, positive income , Commercial Lending Specialization, 109 total offices , Holding Company: Great Southern Bancorp, Inc.
Arvest Bank: Ottawa Branch at 119 East Third Street, branch established on 1870/09/24. Info updated 2010/11/29: Bank assets: $12,520.8 mil, Deposits: $10,446.2 mil, headquarters in Fayetteville, AR, positive income , Commercial Lending Specialization, 241 total offices , Holding Company: Arvest Bank Group, Inc.
Garnett State Savings Bank: North Ottawa Branch at 1230 East Logan Street, branch established on 2005/01/18. Info updated 2009/07/17: Bank assets: $114.0 mil, Deposits: $102.0 mil, headquarters in Garnett, KS, positive income , Agricultural Specialization, 5 total offices , Holding Company: Goppert Financial Corp.
Bank of the West: Ottawa at 700 South Main, branch established on 1992/07/17. Info updated 2009/11/16: Bank assets: $62,408.3 mil, Deposits: $43,995.2 mil, headquarters in San Francisco, CA, positive income , 647 total offices , Holding Company: Bnp Paribas
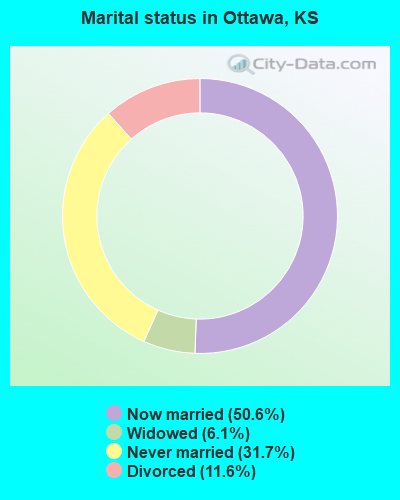
For population 15 years and over in Ottawa:
Never married: 31.7%Now married: 50.6%Separated: 0.1%Widowed: 6.1%Divorced: 11.6% For population 25 years and over in Ottawa:
High school or higher: 93.1%Bachelor's degree or higher: 27.6%Graduate or professional degree: 11.3%Unemployed: 3.9%Mean travel time to work (commute): 19.2 minutes
Education Gini index (Inequality in education) Here:
9.8Kansas average:
11.5
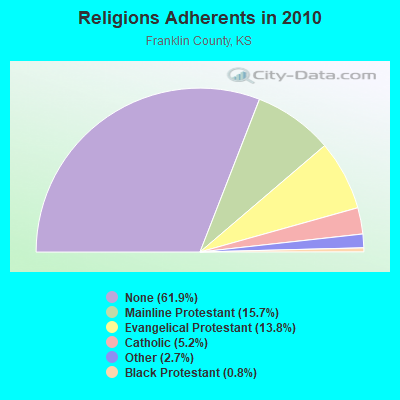
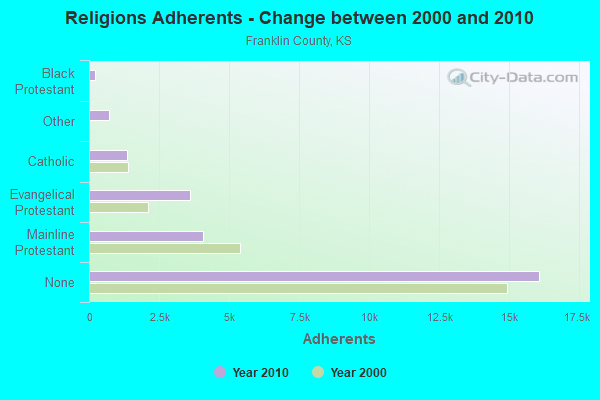
Religion statistics for Ottawa, KS (based on Franklin County data)
Religion Adherents Congregations Mainline Protestant 4,069 22 Evangelical Protestant 3,590 28 Catholic 1,350 2 Other 703 4 Black Protestant 198 2 None 16,082 -
Source: Clifford Grammich, Kirk Hadaway, Richard Houseal, Dale E.Jones, Alexei Krindatch, Richie Stanley and Richard H.Taylor. 2012. 2010 U.S.Religion Census: Religious Congregations & Membership Study. Association of Statisticians of American Religious Bodies. Jones, Dale E., et al. 2002. Congregations and Membership in the United States 2000. Nashville, TN: Glenmary Research Center. Graphs represent county-level data
Food Environment Statistics: Number of grocery stores : 2Franklin County :
0.76 / 10,000 pop.Kansas :
1.96 / 10,000 pop.
Number of supercenters and club stores : 1This county :
0.38 / 10,000 pop.Kansas :
0.20 / 10,000 pop.
Number of convenience stores (no gas) : 1Here :
0.38 / 10,000 pop.Kansas :
0.51 / 10,000 pop.
Number of convenience stores (with gas) : 12Franklin County :
4.54 / 10,000 pop.Kansas :
3.84 / 10,000 pop.
Number of full-service restaurants : 14Franklin County :
5.30 / 10,000 pop.State :
7.33 / 10,000 pop.
Adult obesity rate : Franklin County :
30.3%Kansas :
27.9%
Low-income preschool obesity rate : This county :
10.5%State :
13.4%
Health and Nutrition:
Average overall health of teeth and gums : This city:
45.1%Kansas:
46.3%
People feeling badly about themselves : People not drinking alcohol at all : Average hours sleeping at night : General health condition : Average condition of hearing : This city:
77.7%Kansas:
78.6%
More about Health and Nutrition of Ottawa, KS Residents
Local government employment and payroll (March 2022)
Function
Full-time employees
Monthly full-time payroll
Average yearly full-time wage
Part-time employees
Monthly part-time payroll
Police Protection - Officers
37 $172,554 $55,963 1 $1,591 Water Supply
21 $105,194 $60,111 0 $0 Firefighters
20 $108,128 $64,877 0 $0 Electric Power
18 $99,015 $66,010 0 $0 Streets and Highways
12 $45,236 $45,236 0 $0 Financial Administration
11 $53,402 $58,257 0 $0 Other Government Administration
11 $78,264 $85,379 0 $0 Other and Unallocable
8 $32,718 $49,077 0 $0 Parks and Recreation
7 $29,996 $51,422 2 $1,209 Police - Other
5 $19,299 $46,318 0 $0 Sewerage
4 $20,473 $61,419 0 $0 Judicial and Legal
3 $7,292 $29,168 1 $1,765 Solid Waste Management
1 $5,290 $63,480 0 $0 Housing and Community Development (Local)
1 $3,316 $39,792 0 $0
Totals for Government
159 $780,177 $58,881 4 $4,565
Ottawa government finances - Expenditure in 2021 (per resident):
Construction - Water Utilities: $296,000 ($23.47)
Regular Highways: $274,000 ($21.72)Sewerage: $223,000 ($17.68)Current Operations - Electric Utilities: $11,080,000 ($878.46)
General - Other: $2,918,000 ($231.35)Police Protection: $2,636,000 ($208.99)Water Utilities: $1,837,000 ($145.64)Sewerage: $1,724,000 ($136.68)Local Fire Protection: $1,405,000 ($111.39)Libraries: $941,000 ($74.61)Housing and Community Development: $527,000 ($41.78)Parks and Recreation: $352,000 ($27.91)Financial Administration: $293,000 ($23.23)Central Staff Services: $278,000 ($22.04)Natural Resources - Other: $197,000 ($15.62)Corrections - Other: $182,000 ($14.43)Judicial and Legal Services: $167,000 ($13.24)Air Transportation: $107,000 ($8.48)Regular Highways: $67,000 ($5.31)Electric Utilities - Interest on Debt: $421,000 ($33.38)
General - Interest on Debt: $189,000 ($14.98)
Other Capital Outlay - Electric Utilities: $638,000 ($50.58)
Police Protection: $31,000 ($2.46)Local Fire Protection: $30,000 ($2.38)Corrections - Other: $14,000 ($1.11)Financial Administration: $9,000 ($0.71)Housing and Community Development: $5,000 ($0.40)Central Staff Services: $2,000 ($0.16)Judicial and Legal Services: $1,000 ($0.08)Total Salaries and Wages: $9,620,000 ($762.71)
Water Utilities - Interest on Debt: $80,000 ($6.34)
Ottawa government finances - Revenue in 2021 (per resident):
Charges - Sewerage: $2,751,000 ($218.11)
Air Transportation: $59,000 ($4.68)Federal Intergovernmental - Air Transportation: $174,000 ($13.80)
Miscellaneous - Fines and Forfeits: $260,000 ($20.61)
Interest Earnings: $124,000 ($9.83)Sale of Property: $92,000 ($7.29)Special Assessments: $32,000 ($2.54)Revenue - Electric Utilities: $13,368,000 ($1059.86)
Water Utilities: $2,875,000 ($227.94)State Intergovernmental - Highways: $362,000 ($28.70)
General Local Government Support: $58,000 ($4.60)Public Welfare: $21,000 ($1.66)Tax - General Sales and Gross Receipts: $6,221,000 ($493.22)
Property: $4,424,000 ($350.75)Public Utilities Sales: $328,000 ($26.00)Other License: $37,000 ($2.93)
Ottawa government finances - Debt in 2021 (per resident):
Long Term Debt - Beginning Outstanding - Unspecified Public Purpose: $27,724,000 ($2198.05)
Outstanding Unspecified Public Purpose: $27,724,000 ($2198.05)Beginning Outstanding - Public Debt for Private Purpose: $5,000,000 ($396.42)Outstanding Nonguaranteed - Industrial Revenue: $5,000,000 ($396.42)
Ottawa government finances - Cash and Securities in 2021 (per resident):
Other Funds - Cash and Securities: $13,042,000 ($1034.01)
Sinking Funds - Cash and Securities: $5,412,000 ($429.08)
Businesses in Ottawa, KS
Name Count Name Count
Advance Auto Parts 1 McDonald's 1 Applebee's 1 New Balance 6 AutoZone 1 Nike 1 Best Western 1 Pizza Hut 1 Burger King 1 RadioShack 1 Comfort Inn 1 SAS Shoes 1 Dairy Queen 2 SONIC Drive-In 1 Econo Lodge 1 Sears 1 FedEx 3 Subway 2 Ford 1 Super 8 1 Goodwill 2 T-Mobile 1 H&R Block 1 Taco Bell 1 KFC 1 UPS 5 La-Z-Boy 1 Walgreens 1 Lane Furniture 1 Walmart 1 Maurices 1 Wendy's 1
Strongest AM radio stations in Ottawa:
KOFO (1220 AM; 0 kW; OTTAWA, KS; Owner: BRANDY COMMUNICATIONS, INC.)
WHB (810 AM; 50 kW; KANSAS CITY, MO; Owner: UNION BROADCASTING, INC.)
KKHK (1250 AM; 25 kW; KANSAS CITY, KS)
WIBW (580 AM; 5 kW; TOPEKA, KS; Owner: MCC RADIO, LLC)
KCSP (610 AM; 5 kW; KANSAS CITY, MO; Owner: ENTERCOM KANSAS CITY LICENSE, LLC)
KMAJ (1440 AM; 5 kW; TOPEKA, KS; Owner: CUMULUS LICENSING CORP.)
KCMO (710 AM; 10 kW; KANSAS CITY, MO; Owner: SUSQUEHANNA KANSAS CITY PARTNERSHIP)
KCCV (760 AM; daytime; 6 kW; OVERLAND PARK, KS; Owner: BOTT BROADCASTING COMPANY)
KXTR (1660 AM; 10 kW; KANSAS CITY, KS; Owner: ENTERCOM KANSAS CITY LICENSE, LLC)
KMBZ (980 AM; 5 kW; KANSAS CITY, MO; Owner: ENTERCOM KANSAS CITY LICENSE, LLC)
KCTE (1510 AM; daytime; 10 kW; INDEPENDENCE, MO; Owner: UNION BROADCASTING, INC.)
KRMG (740 AM; 50 kW; TULSA, OK; Owner: CXR HOLDINGS, INC.)
KOIL (1020 AM; 50 kW; PLATTSMOUTH, NE; Owner: WAITT RADIO, INC.)
Strongest FM radio stations in Ottawa:
KTJO-FM (88.9 FM; OTTAWA, KS; Owner: OTTAWA UNIVERSITY)
KRBW (90.5 FM; OTTAWA, KS; Owner: AMERICAN FAMILY ASSOCIATION, INC.)
KCHZ (95.7 FM; OTTAWA, KS; Owner: SYNCOM RADIO CORPORATION)
KANU (91.5 FM; LAWRENCE, KS; Owner: UNIVERSITY OF KANSAS)
KLZR (105.9 FM; LAWRENCE, KS; Owner: ZIMMER RADIO OF MID-MISSOURI, INC)
WIBW-FM (94.5 FM; TOPEKA, KS; Owner: MCC RADIO, LLC)
KMAJ-FM (107.7 FM; TOPEKA, KS; Owner: CUMULUS LICENSING CORP.)
KTPK (106.9 FM; TOPEKA, KS; Owner: KANSAS CAPITAL BROADCASTING, INC.)
KDVV (100.3 FM; TOPEKA, KS; Owner: CUMULUS LICENSING CORP.)
KZPL (97.3 FM; LEE'S SUMMIT, MO; Owner: UNION FIRST BROADCASTING, LLC)
KCFX (101.1 FM; HARRISONVILLE, MO; Owner: SUSQUEHANNA KANSAS CITY PARTNERSHIP)
KCCV-FM (92.3 FM; OLATHE, KS; Owner: BOTT BROADCASTING COMPANY)
KNBU (89.7 FM; BALDWIN CITY, KS; Owner: BAKER UNIVERSITY)
TV broadcast stations around Ottawa:
KTKA-TV (Channel 49; TOPEKA, KS; Owner: NORTHEAST KANSAS BROADCAST SERVICE, INC.)
KTWU (Channel 11; TOPEKA, KS; Owner: WASHBURN UNIVERSITY OF TOPEKA)
KSNT (Channel 27; TOPEKA, KS; Owner: EMMIS TELEVISION LICENSE CORPORATION OF TOPEKA)
KMCI (Channel 38; LAWRENCE, KS; Owner: SCRIPPS HOWARD BROADCASTING COMPANY)
KUJH-LP (Channel 14; LAWRENCE, KS; Owner: UNIVERSITY OF KANSAS)
K58CX (Channel 58; LAWRENCE, KS; Owner: NORTHEAST KANSAS BROADCAST SERVICE, INC.)
National Bridge Inventory (NBI) Statistics 107 Number of bridges1,768ft / 539m Total length $3,680,000 Total costs378,748 Total average daily traffic65,830 Total average daily truck traffic
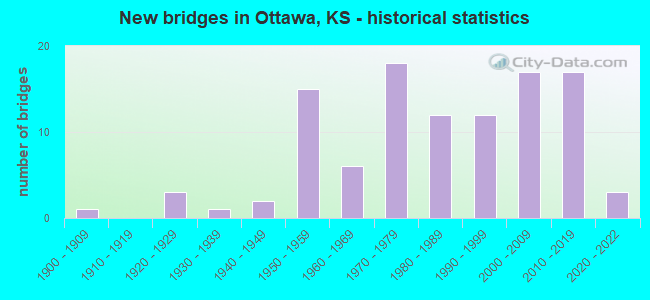
New bridges - historical statistics
1 1900-1909 3 1920-1929 1 1930-1939 2 1940-1949 15 1950-1959 6 1960-1969 18 1970-1979 12 1980-1989 12 1990-1999 17 2000-2009 17 2010-2019 3 2020-2022
See full National Bridge Inventory statistics for Ottawa, KS
Fire-safe hotels and motels in Ottawa, Kansas:
Econo Lodge, 2331 S Cedar Rd, Ottawa, Kansas 66067 Phone: (785) 242-3400
SureStay Hotel Ottawa, 606 E 23RD St, Ottawa, Kansas 66067 Phone: (785) 242-2224, Fax: (785) 242-2221
Comfort Inn, 2335 S Oak St, Ottawa, Kansas 66067 Phone: (785) 242-9898, Fax: (785) 242-7146
All 3 fire-safe hotels and motels in Ottawa, Kansas
Most common first names in Ottawa, KS among deceased individuals Name Count Lived (average)
Mary 138 82.2 years John 113 78.2 years William 109 77.4 years Charles 80 75.7 years Robert 79 73.9 years James 79 73.5 years George 72 78.9 years Harry 58 79.4 years Dorothy 55 77.2 years Frank 54 78.0 years
Most common last names in Ottawa, KS among deceased individuals Last name Count Lived (average)
Johnson 59 80.8 years Smith 49 78.3 years Jones 44 81.1 years Miller 43 78.7 years Brown 43 76.5 years Anderson 39 82.0 years Davis 27 76.7 years Martin 25 82.6 years White 24 80.5 years Clark 23 78.0 years
Ottawa compared to Kansas state average:
Unemployed percentage significantly below state average. Black race population percentage significantly below state average. Hispanic race population percentage below state average. Foreign-born population percentage significantly below state average. Length of stay since moving in above state average.
#60 on the list of "Top 101 cities with the largest percentage of people in job corps and vocational training facilities (population 1,000+)"
Top Patent Applicants
Bobby F. Harshaw (1)
Merle W. Winsky (1)
Michael E. Jensen, Ii (1)
Jeff Wittman (1)
Bradley A. Butler (1)
Roy Channel (1)
Robert B. Combs, Ii (1)
Daniel William Dandreo (1)
James Winsky (1)
Tully W. Fowler (1)
Total of 9 patent applications in 2008-2024.


 Recent articles from our blog. Our writers, many of them Ph.D. graduates or candidates, create easy-to-read articles on a wide variety of topics.

 (24.1 miles
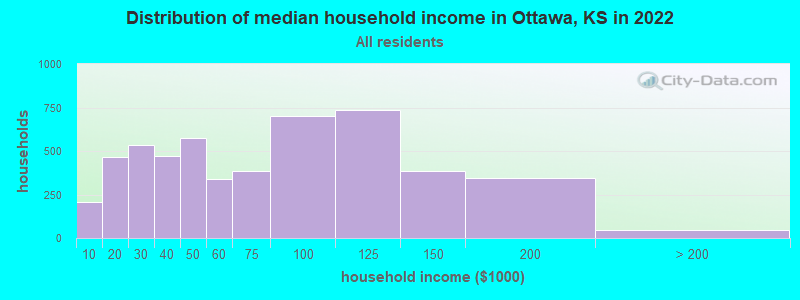


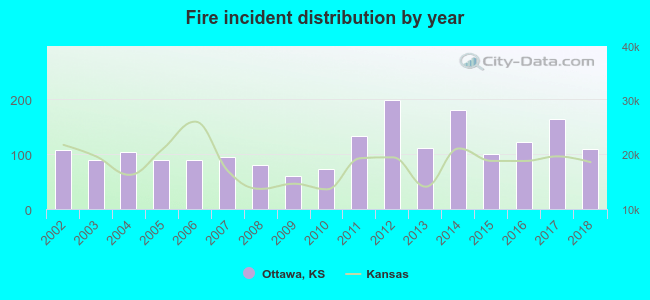 According to the data from the years 2002 - 2018 the average number of fire incidents per year is 112. The highest number of reported fire incidents - 198 took place in 2012, and the least - 61 in 2009. The data has a growing trend.
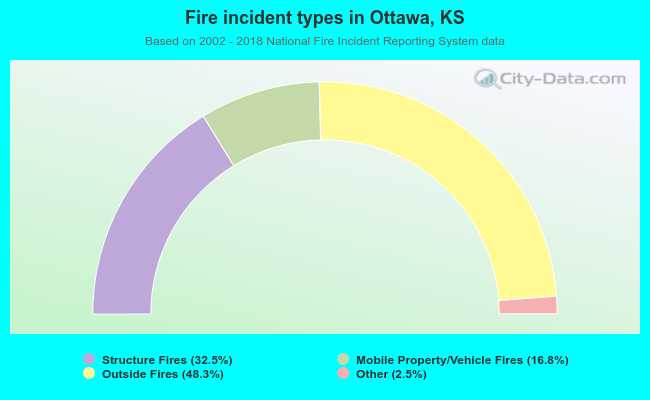 When looking into fire subcategories, the most reports belonged to: Outside Fires (48.3%), and Structure Fires (32.5%).