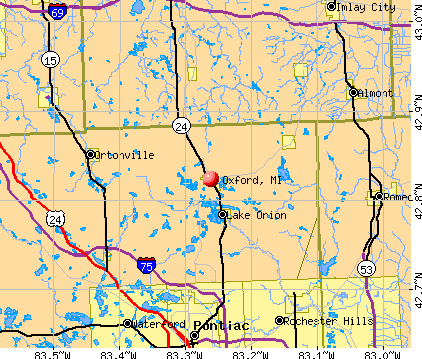
Oxford, Michigan
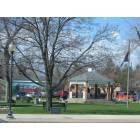
Oxford: Centennial Park
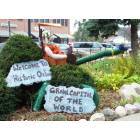
Oxford: Oxford's village park Scarecrow Festival
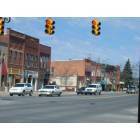
Oxford: Downtown Oxford
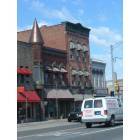
Oxford: Downtown Oxford
- add
your
Submit your own pictures of this village and show them to the world
- OSM Map
- General Map
- Google Map
- MSN Map
Population change since 2000: -2.3%
 |
| Males: 1,804 | |
| Females: 1,656 |
| Median resident age: | 44.1 years |
| Michigan median age: | 40.3 years |
Zip codes: 48371.
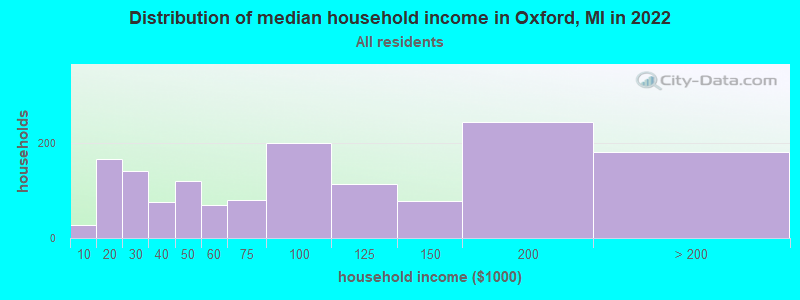
| Oxford: | $77,571 |
| MI: | $66,986 |
Estimated per capita income in 2022: $43,895 (it was $24,811 in 2000)
Oxford village income, earnings, and wages data
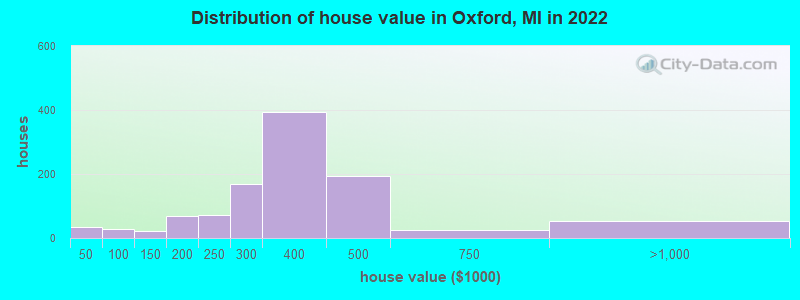
Estimated median house or condo value in 2022: $352,212 (it was $158,200 in 2000)
| Oxford: | $352,212 |
| MI: | $224,400 |
Mean prices in 2022: all housing units: $385,845; detached houses: $411,064; townhouses or other attached units: $279,603; in 2-unit structures: $305,018; in 3-to-4-unit structures: $206,955; in 5-or-more-unit structures: $228,603; mobile homes: $52,080; occupied boats, rvs, vans, etc.: $331,049
Median gross rent in 2022: $882.
(5.6% for White Non-Hispanic residents, 0.7% for Black residents, 17.7% for two or more races residents)
Detailed information about poverty and poor residents in Oxford, MI

Compare current foreclosures near Oxford, MI:
| Photo | Address | Area | Beds / Baths | Price | Details |
|---|---|---|---|---|---|

|
#1
Kniard Dr
Oxford, MI 48370
|
1,409 sq. feet
|
1 baths 1 beds |
show details | |

|
#2
Gibson St
Oxford, MI 48371
|
1,509 sq. feet
|
1 baths 3 beds |
show details | |

|
#3
Pocahontas Trl
Oxford, MI 48371
|
950 sq. feet
|
1 baths 3 beds |
show details | |

|
#4
Laurel Leah
Oxford, MI 48371
|
- sq. feet
|
- baths - beds |
show details | |

|
#5
Hunters Rill
Oxford, MI 48371
|
- sq. feet
|
- baths - beds |
show details | |

|
#6
Lakeshore Cir
Oxford, MI 48371
|
- sq. feet
|
- baths - beds |
show details | |

|
#7
Brookhollow Dr
Oxford, MI 48371
|
- sq. feet
|
- baths - beds |
show details | |

|
#8
E Market St, Apt 106
Oxford, MI 48371
|
- sq. feet
|
- baths - beds |
show details | |

|
#9
Oak Hill Dr # 59
Waterford, MI 48329
|
1,024 sq. feet
|
1 baths 1 beds |
$164,500
|
show details |

|
#10
Scotch Settlement Rd
Almont, MI 48003
|
2,700 sq. feet
|
2 baths 4 beds |
$505,500
|
show details |
| Photo | Address | Area | Beds / Baths | Price | Details |
|---|---|---|---|---|---|

|
#11
2nd Ave
Pontiac, MI 48340
|
959 sq. feet
|
1 baths 3 beds |
$52,500
|
show details |

|
#12
Court St
Pontiac, MI 48342
|
900 sq. feet
|
1 baths 3 beds |
show details | |

|
#13
Voorheis St
Pontiac, MI 48341
|
1,205 sq. feet
|
1 baths 2 beds |
show details | |

|
#14
East Rd
Leonard, MI 48367
|
1,517 sq. feet
|
1 baths 5 beds |
show details | |

|
#15
Hamilton Dr
Bloomfield Hills, MI 48302
|
3,702 sq. feet
|
3 baths 3 beds |
show details | |

|
#16
Cornith St
Lake Orion, MI 48359
|
1,540 sq. feet
|
1 baths 3 beds |
show details | |

|
#17
Selby Dr
Troy, MI 48098
|
2,547 sq. feet
|
2 baths 4 beds |
show details | |

|
#18
Goodison Place Dr
Rochester, MI 48306
|
3,305 sq. feet
|
4 baths 5 beds |
show details | |

|
#19
Saline Dr
Waterford, MI 48329
|
1,010 sq. feet
|
1 baths 3 beds |
show details | |

|
#20
Oaklawn Dr
Pontiac, MI 48341
|
1,553 sq. feet
|
2 baths 3 beds |
show details |
| Photo | Address | Area | Beds / Baths | Price | Details |
|---|---|---|---|---|---|

|
#21
Mann Rd
Waterford, MI 48329
|
1,040 sq. feet
|
1 baths 3 beds |
show details | |

|
#22
Crooks Rd
Rochester, MI 48309
|
1,104 sq. feet
|
1 baths 3 beds |
show details | |

|
#23
Genes Dr
Auburn Hills, MI 48326
|
1,218 sq. feet
|
1 baths 3 beds |
show details | |

|
#24
Pingree Ave
Pontiac, MI 48342
|
1,079 sq. feet
|
1 baths 3 beds |
show details | |

|
#25
Genes Dr
Auburn Hills, MI 48326
|
1,079 sq. feet
|
1 baths 3 beds |
show details | |

|
#26
Walnut Rd
Auburn Hills, MI 48326
|
877 sq. feet
|
1 baths 3 beds |
show details | |

|
#27
Henry Clay Ave
Pontiac, MI 48341
|
3,300 sq. feet
|
4 baths 6 beds |
show details | |

|
#28
Quail Rdg
Washington, MI 48095
|
5,705 sq. feet
|
4 baths 5 beds |
show details | |

|
#29
W Oxhill Dr
White Lake, MI 48386
|
1,988 sq. feet
|
1 baths 3 beds |
show details | |

|
#30
Fortune Dr
Waterford, MI 48329
|
1,200 sq. feet
|
1 baths 2 beds |
show details |
| Photo | Address | Area | Beds / Baths | Price | Details |
|---|---|---|---|---|---|

|
#31
Martin Luther King J
Pontiac, MI 48342
|
2,317 sq. feet
|
2 baths 3 beds |
show details | |

|
#32
Flagstone Cir
Rochester, MI 48307
|
1,623 sq. feet
|
2 baths 2 beds |
show details | |

|
#33
Genella St
Waterford, MI 48328
|
1,013 sq. feet
|
1 baths 3 beds |
show details | |

|
#34
Huling St
Utica, MI 48317
|
1,050 sq. feet
|
1 baths 3 beds |
show details | |

|
#35
Spartan Dr
Rochester, MI 48309
|
2,150 sq. feet
|
2 baths 4 beds |
show details | |

|
#36
Lonesome Lake Ct
Lake Orion, MI 48362
|
2,313 sq. feet
|
3 baths 4 beds |
show details | |

|
#37
Seabury Dr
Lake Orion, MI 48362
|
1,248 sq. feet
|
1 baths 3 beds |
show details | |

|
#38
Waterview Dr
Lake Orion, MI 48362
|
2,621 sq. feet
|
1 baths 3 beds |
show details | |

|
#39
Adams St
Lapeer, MI 48446
|
1,100 sq. feet
|
1 baths 3 beds |
show details | |

|
#40
El Dorado Dr
White Lake, MI 48386
|
1,880 sq. feet
|
2 baths 3 beds |
show details |
| Photo | Address | Area | Beds / Baths | Price | Details |
|---|---|---|---|---|---|

|
#41
N Main St
Lapeer, MI 48446
|
1,700 sq. feet
|
1 baths 3 beds |
show details | |

|
#42
Roland St
Utica, MI 48317
|
1,053 sq. feet
|
1 baths 3 beds |
show details | |

|
#43
Andersonville Rd
Clarkston, MI 48346
|
1,092 sq. feet
|
1 baths 2 beds |
show details | |

|
#44
Nathan Oscar Dr
White Lake, MI 48386
|
2,200 sq. feet
|
3 baths 3 beds |
show details | |

|
#45
Carter St
Pontiac, MI 48342
|
1,372 sq. feet
|
1 baths 3 beds |
show details | |

|
#46
Lydia Ln
Pontiac, MI 48341
|
1,167 sq. feet
|
2 baths 2 beds |
show details | |

|
#47
Prairie Lawn
Waterford, MI 48329
|
804 sq. feet
|
1 baths 2 beds |
show details | |

|
#48
Mechanic St
Pontiac, MI 48342
|
1,220 sq. feet
|
1 baths 3 beds |
show details | |

|
#49
Mesa Dr
Utica, MI 48316
|
1,520 sq. feet
|
2 baths 3 beds |
show details | |

|
Check over 1 million property listings on Foreclosure.com!
|
browse all offers | |||


- 2,99786.1%White alone
- 1504.3%Hispanic
- 1363.9%Black alone
- 1373.9%Two or more races
- 381.1%Asian alone
- 20.06%Other race alone
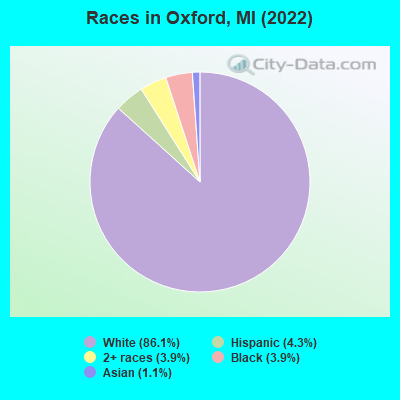
Races in Oxford detailed stats: ancestries, foreign born residents, place of birth
According to our research of Michigan and other state lists, there were 22 registered sex offenders living in Oxford, Michigan as of April 27, 2024.
The ratio of all residents to sex offenders in Oxford is 161 to 1.
Type |
2009 |
2010 |
2011 |
2012 |
2013 |
2014 |
2015 |
2016 |
2017 |
2018 |
2019 |
2020 |
2021 |
2022 |
|---|---|---|---|---|---|---|---|---|---|---|---|---|---|---|
| Murders (per 100,000) | 0 (0.0) | 0 (0.0) | 0 (0.0) | 0 (0.0) | 0 (0.0) | 0 (0.0) | 0 (0.0) | 0 (0.0) | 0 (0.0) | 0 (0.0) | 0 (0.0) | 0 (0.0) | 4 (20.5) | 1 (5.3) |
| Rapes (per 100,000) | 2 (56.8) | 1 (29.1) | 2 (58.3) | 0 (0.0) | 1 (28.8) | 0 (0.0) | 1 (5.6) | 1 (5.5) | 6 (32.7) | 3 (15.7) | 6 (30.8) | 2 (10.2) | 3 (15.4) | 0 (0.0) |
| Robberies (per 100,000) | 1 (28.4) | 0 (0.0) | 3 (87.4) | 0 (0.0) | 1 (28.8) | 0 (0.0) | 0 (0.0) | 0 (0.0) | 0 (0.0) | 0 (0.0) | 0 (0.0) | 1 (5.1) | 0 (0.0) | 0 (0.0) |
| Assaults (per 100,000) | 3 (85.1) | 1 (29.1) | 5 (145.6) | 0 (0.0) | 4 (115.1) | 0 (0.0) | 7 (38.9) | 15 (82.6) | 10 (54.5) | 10 (52.2) | 8 (41.1) | 16 (81.7) | 16 (81.9) | 8 (42.4) |
| Burglaries (per 100,000) | 7 (198.6) | 10 (291.0) | 3 (87.4) | 8 (231.1) | 6 (172.6) | 2 (56.7) | 18 (100.1) | 18 (99.1) | 18 (98.0) | 11 (57.5) | 13 (66.8) | 10 (51.0) | 6 (30.7) | 5 (26.5) |
| Thefts (per 100,000) | 29 (822.9) | 44 (1,281) | 36 (1,049) | 31 (895.4) | 25 (719.2) | 17 (482.1) | 86 (478.1) | 86 (473.5) | 53 (288.6) | 67 (350.1) | 65 (333.9) | 52 (265.4) | 24 (122.9) | 52 (275.6) |
| Auto thefts (per 100,000) | 1 (28.4) | 1 (29.1) | 2 (58.3) | 3 (86.7) | 2 (57.5) | 1 (28.4) | 3 (16.7) | 3 (16.5) | 3 (16.3) | 4 (20.9) | 4 (20.5) | 4 (20.4) | 7 (35.8) | 5 (26.5) |
| Arson (per 100,000) | 0 (0.0) | 0 (0.0) | 0 (0.0) | 0 (0.0) | 0 (0.0) | 0 (0.0) | 1 (5.6) | 0 (0.0) | 0 (0.0) | 1 (5.2) | 0 (0.0) | 0 (0.0) | 0 (0.0) | 0 (0.0) |
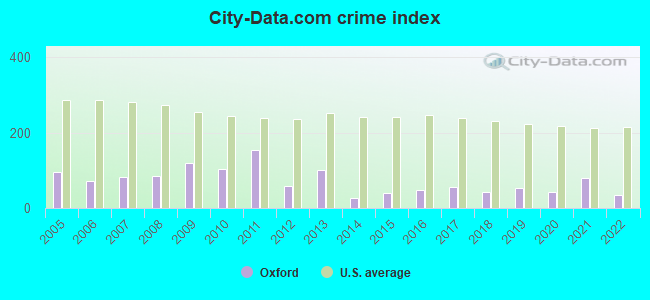
| City-Data.com crime index | 120.0 | 103.0 | 154.7 | 58.9 | 100.1 | 25.5 | 39.7 | 48.1 | 56.7 | 42.7 | 52.6 | 41.9 | 79.6 | 34.1 |
The City-Data.com crime index weighs serious crimes and violent crimes more heavily. Higher means more crime, U.S. average is 246.1. It adjusts for the number of visitors and daily workers commuting into cities.
Crime rate in Oxford detailed stats: murders, rapes, robberies, assaults, burglaries, thefts, arson
Full-time law enforcement employees in 2021, including police officers: 23 (9 officers - 8 male; 1 female).
| Officers per 1,000 residents here: | 2.53 |
| Michigan average: | 1.86 |
 Recent articles from our blog. Our writers, many of them Ph.D. graduates or candidates, create easy-to-read articles on a wide variety of topics.


Latest news from Oxford, MI collected exclusively by city-data.com from local newspapers, TV, and radio stations
Ancestries: German (13.4%), Irish (12.9%), English (10.9%), Polish (10.6%), European (4.8%), Italian (4.0%).
Current Local Time: EST time zone
Elevation: 1057 feet
Land area: 1.23 square miles.
Population density: 2,809 people per square mile (average).
221 residents are foreign born (3.7% Latin America, 1.0% Asia, 0.7% Africa).
| This village: | 6.4% |
| Michigan: | 6.9% |
Median real estate property taxes paid for housing units with mortgages in 2022: $4,254 (1.2%)
Median real estate property taxes paid for housing units with no mortgage in 2022: $4,321 (1.2%)
Nearest city with pop. 50,000+: Rochester Hills, MI  (12.1 miles , pop. 68,825).
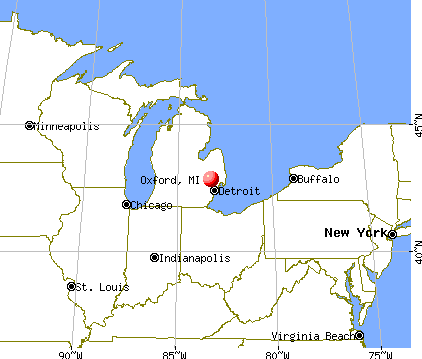
Nearest city with pop. 200,000+: Detroit, MI (31.2 miles , pop. 951,270).
Nearest city with pop. 1,000,000+: Chicago, IL (235.9 miles , pop. 2,896,016).
Nearest cities:
), ), ), ), Latitude: 42.82 N, Longitude: 83.26 W
Area code: 248
Oxford, Michigan accommodation & food services, waste management - Economy and Business Data
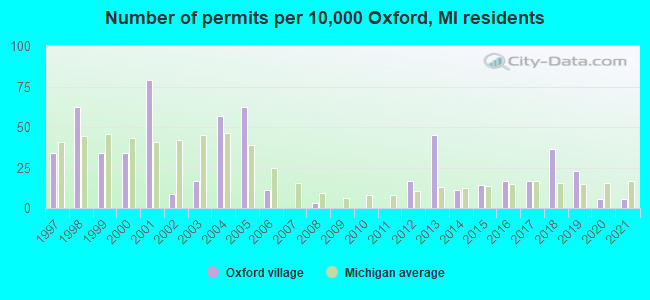
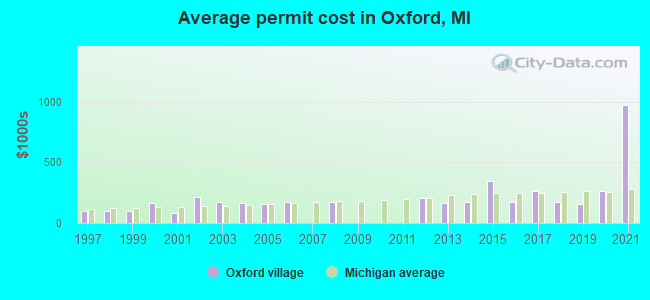
Single-family new house construction building permits:
- 2021: 2 buildings, average cost: $975,000
- 2020: 2 buildings, average cost: $267,500
- 2019: 8 buildings, average cost: $156,900
- 2018: 13 buildings, average cost: $170,400
- 2017: 6 buildings, average cost: $266,700
- 2016: 6 buildings, average cost: $175,000
- 2015: 5 buildings, average cost: $350,000
- 2014: 4 buildings, average cost: $175,000
- 2013: 16 buildings, average cost: $163,100
- 2012: 6 buildings, average cost: $207,500
- 2008: 1 building, cost: $175,000
- 2006: 4 buildings, average cost: $176,400
- 2005: 22 buildings, average cost: $155,500
- 2004: 20 buildings, average cost: $165,900
- 2003: 6 buildings, average cost: $176,300
- 2002: 3 buildings, average cost: $218,300
- 2001: 28 buildings, average cost: $79,400
- 2000: 12 buildings, average cost: $162,900
- 1999: 12 buildings, average cost: $100,000
- 1998: 22 buildings, average cost: $100,000
- 1997: 12 buildings, average cost: $99,600
| Here: | 2.6% |
| Michigan: | 3.5% |
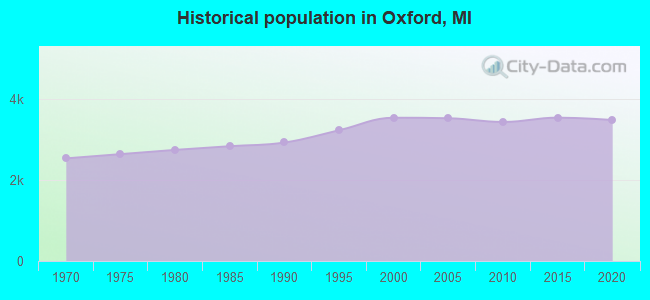
Population change in the 1990s: +603 (+20.5%).
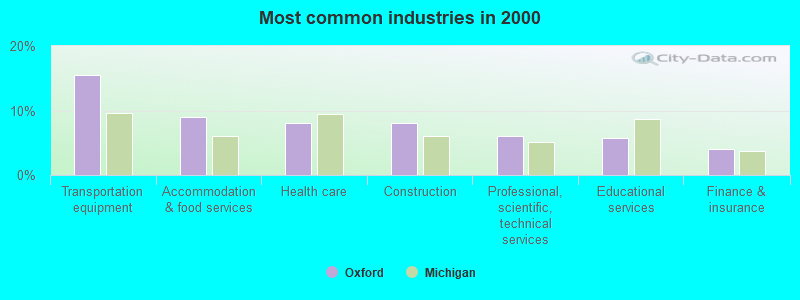
- Transportation equipment (15.5%)
- Accommodation & food services (9.0%)
- Health care (8.1%)
- Construction (8.0%)
- Professional, scientific, technical services (6.1%)
- Educational services (5.7%)
- Finance & insurance (4.0%)
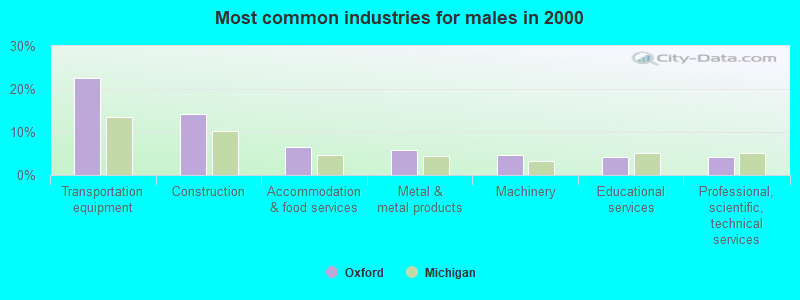
- Transportation equipment (22.7%)
- Construction (14.2%)
- Accommodation & food services (6.4%)
- Metal & metal products (5.7%)
- Machinery (4.6%)
- Educational services (4.2%)
- Professional, scientific, technical services (4.1%)
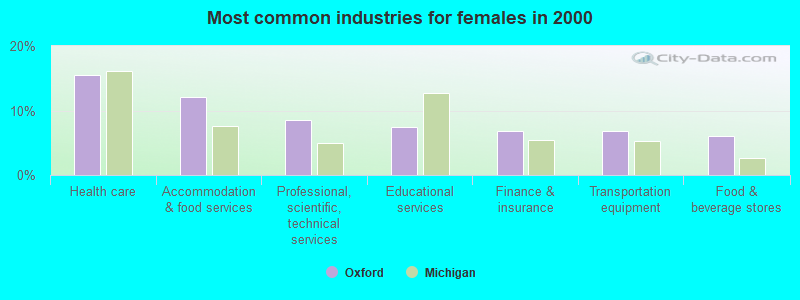
- Health care (15.5%)
- Accommodation & food services (12.1%)
- Professional, scientific, technical services (8.5%)
- Educational services (7.4%)
- Finance & insurance (6.8%)
- Transportation equipment (6.8%)
- Food & beverage stores (6.1%)
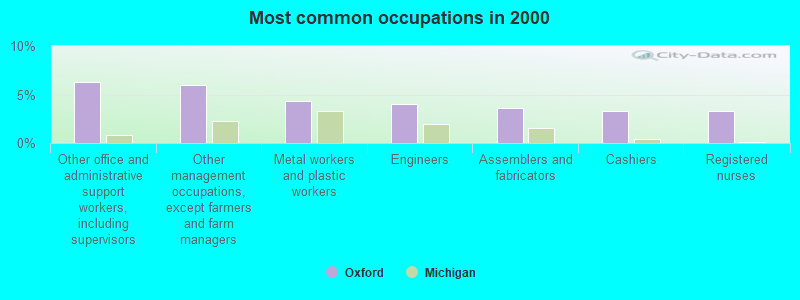
- Other office and administrative support workers, including supervisors (6.3%)
- Other management occupations, except farmers and farm managers (6.0%)
- Metal workers and plastic workers (4.3%)
- Engineers (4.0%)
- Assemblers and fabricators (3.6%)
- Cashiers (3.3%)
- Registered nurses (3.3%)
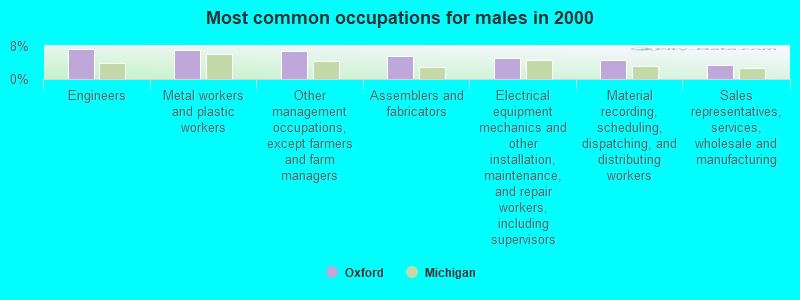
- Engineers (7.3%)
- Metal workers and plastic workers (7.0%)
- Other management occupations, except farmers and farm managers (6.9%)
- Assemblers and fabricators (5.6%)
- Electrical equipment mechanics and other installation, maintenance, and repair workers, including supervisors (5.0%)
- Material recording, scheduling, dispatching, and distributing workers (4.6%)
- Sales representatives, services, wholesale and manufacturing (3.5%)
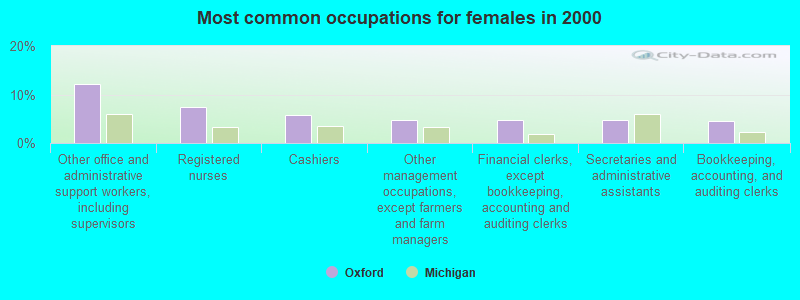
- Other office and administrative support workers, including supervisors (12.1%)
- Registered nurses (7.4%)
- Cashiers (5.8%)
- Other management occupations, except farmers and farm managers (4.8%)
- Financial clerks, except bookkeeping, accounting and auditing clerks (4.7%)
- Secretaries and administrative assistants (4.7%)
- Bookkeeping, accounting, and auditing clerks (4.6%)
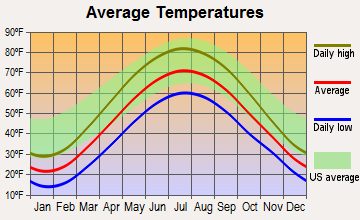
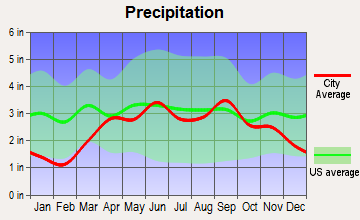
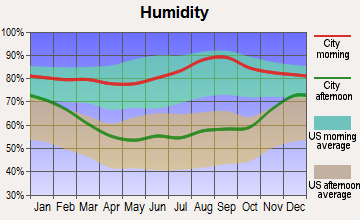
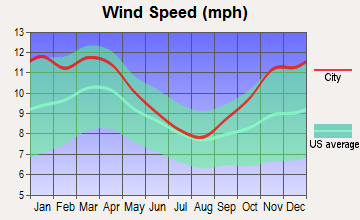
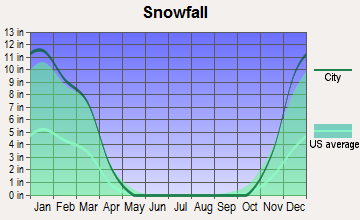
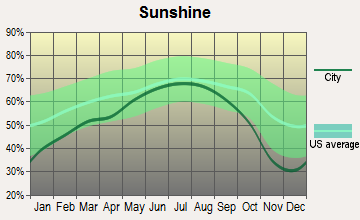
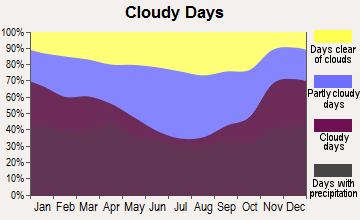
Average climate in Oxford, Michigan
Based on data reported by over 4,000 weather stations
|
|


(lower is better)
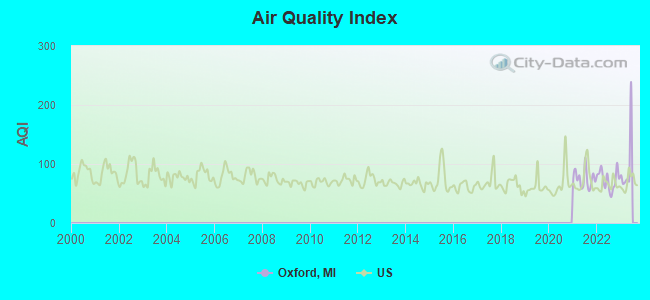
Air Quality Index (AQI) level in 2022 was 73.6. This is about average.
| City: | 73.6 |
| U.S.: | 72.6 |
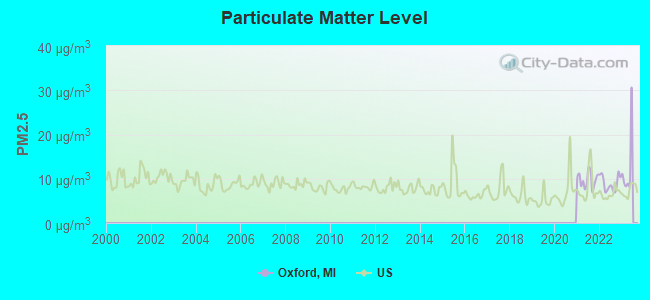
Particulate Matter (PM2.5) [µg/m3] level in 2022 was 8.94. This is about average. Closest monitor was 24.6 miles away from the city center.
| City: | 8.94 |
| U.S.: | 8.11 |
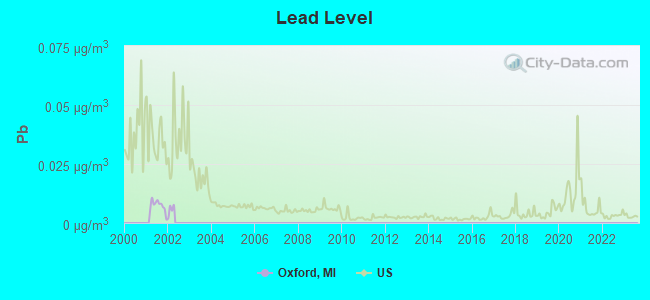
Lead (Pb) [µg/m3] level in 2001 was 0.00731. This is better than average. Closest monitor was 12.1 miles away from the city center.
| City: | 0.00731 |
| U.S.: | 0.00931 |
Tornado activity:
Oxford-area historical tornado activity is slightly above Michigan state average. It is 33% greater than the overall U.S. average.
On 6/8/1953, a category F5 (max. wind speeds 261-318 mph) tornado 25.3 miles away from the Oxford village center killed 116 people and injured 844 people and caused between $5,000,000 and $50,000,000 in damages.
On 5/12/1956, a category F4 (max. wind speeds 207-260 mph) tornado 17.8 miles away from the village center killed 3 people and injured 116 people and caused between $500,000 and $5,000,000 in damages.
Earthquake activity:
Oxford-area historical earthquake activity is significantly above Michigan state average. It is 51% smaller than the overall U.S. average.On 9/25/1998 at 19:52:52, a magnitude 5.2 (4.8 MB, 4.3 MS, 5.2 LG, 4.5 MW, Depth: 3.1 mi, Class: Moderate, Intensity: VI - VII) earthquake occurred 173.4 miles away from the city center
On 1/31/1986 at 16:46:43, a magnitude 5.0 (5.0 MB) earthquake occurred 136.8 miles away from the city center
On 7/12/1986 at 08:19:37, a magnitude 4.5 (4.5 MB, Class: Light, Intensity: IV - V) earthquake occurred 168.2 miles away from Oxford center
On 5/2/2015 at 16:23:07, a magnitude 4.2 (4.2 MW, Depth: 2.8 mi) earthquake occurred 117.7 miles away from Oxford center
On 7/27/1980 at 18:52:21, a magnitude 5.2 (5.1 MB, 4.7 MS, 5.0 UK, 5.2 UK) earthquake occurred 321.4 miles away from the city center
On 8/23/2011 at 17:51:04, a magnitude 5.8 (5.8 MW, Depth: 3.7 mi) earthquake occurred 440.6 miles away from the city center
Magnitude types: regional Lg-wave magnitude (LG), body-wave magnitude (MB), surface-wave magnitude (MS), moment magnitude (MW)
Natural disasters:
The number of natural disasters in Oakland County (12) is smaller than the US average (15).Major Disasters (Presidential) Declared: 6
Emergencies Declared: 5
Causes of natural disasters: Storms: 6, Floods: 5, Tornadoes: 3, Winter Storms: 2, Blizzard: 1, Hurricane: 1, Power Outage: 1, Snowstorm: 1, Wind: 1, Other: 1 (Note: some incidents may be assigned to more than one category).
Hospitals and medical centers near Oxford:
- LAKE ORION NURSING CENTER (Nursing Home, about 4 miles away; LAKE ORION, MI)
- BALD MOUNTAIN SURGICAL CENTER (Hospital, about 5 miles away; LAKE ORION, MI)
- BORTZ HEALTH CARE OF OAKLAND (Nursing Home, about 7 miles away; ORION, MI)
- CLARKSTON SPECIALTY HEALTHCARE CENTER (Nursing Home, about 9 miles away; CLARKSTON, MI)
- ORTONVILLE N H (Nursing Home, about 10 miles away; ORTONVILLE, MI)
- NORTH OAKLAND HOME HEALTH CARE (Home Health Center, about 10 miles away; CLARKSTON, MI)
- HOME HEALTH OUTREACH (Home Health Center, about 11 miles away; AUBURN HILLS, MI)
Airports located in Oxford:
- Handleman Sky Ranch Airport (37MI) (Runways: 2)
Amtrak stations near Oxford:
- 14 miles: PONTIAC (1600 WIDE TRACK DR.) . Services: partially wheelchair accessible, enclosed waiting area, public payphones, vending machines, free short-term parking, free long-term parking, call for taxi service, intercity bus service, public transit connection.
- 16 miles: LAPEER (73 HOWARD ST.) . Services: fully wheelchair accessible, enclosed waiting area, public restrooms, public payphones, free short-term parking, free long-term parking, call for taxi service.
- 20 miles: BIRMINGHAM (449 S. ETON ST.) . Services: public payphones, free short-term parking, free long-term parking, call for taxi service, public transit connection.
Colleges/universities with over 2000 students nearest to Oxford:
- Oakland University (about 11 miles; Rochester Hills, MI; Full-time enrollment: 16,449)
- Baker College of Auburn Hills (about 12 miles; Auburn Hills, MI; FT enrollment: 2,284)
- Oakland Community College (about 17 miles; Bloomfield Hills, MI; FT enrollment: 18,956)
- Lawrence Technological University (about 25 miles; Southfield, MI; FT enrollment: 2,430)
- Baker College Center for Graduate Studies (about 25 miles; Flint, MI; FT enrollment: 3,405)
- Baker College of Flint (about 25 miles; Flint, MI; FT enrollment: 3,877)
- Mott Community College (about 25 miles; Flint, MI; FT enrollment: 7,394)
Public high schools in Oxford:
- OXFORD HIGH SCHOOL (Students: 1,287, Location: 745 NORTH OXFORD RD, Grades: 9-12)
- OXFORD BRIDGES HIGH SCHOOL (Students: 1,007, Location: 1420 E LAKEVILLE RD, Grades: 9-12)
- OXFORD VIRTUAL ACADEMY (Location: 10 N WASHINGTON ST, Grades: KG-12)
- OXFORD SCHOOLS EARLY COLLEGE (Location: 10 N WASHINGTON ST, Grades: 9-12)
- OXFORD CROSSROADS ALTERNATIVE SECONDARY SCHOOL (Location: 810 JAMES HUNT DR, Grades: 6-12)
Private high school in Oxford:
Public elementary/middle schools in Oxford:
- CLEAR LAKE ELEMENTARY SCHOOL (Students: 497, Location: 2085 WEST DRAHNER RD, Grades: KG-5)
- DANIEL AXFORD ELEMENTARY SCHOOL (Students: 440, Location: 74 MECHANIC ST, Grades: KG-2)
- LAKEVILLE ELEMENTARY SCHOOL (Students: 390, Location: 1400 EAST LAKEVILLE RD, Grades: KG-5)
- OXFORD ELEMENTARY SCHOOL (Students: 356, Location: 109 PONTIAC ST, Grades: 3-5)
- KINGSBURY COUNTRY DAY SCHOOL (Location: 5000 HOSNER RD, Grades: KG-8, Charter school)
- OXFORD MIDDLE SCHOOL (Location: 1420 EAST LAKEVILLE RD, Grades: 6-8)
Private elementary/middle school in Oxford:
Points of interest:
Notable locations in Oxford: Northeast Oakland Historical Museum (A), Oxford Fire Department Station 1 (B). Display/hide their locations on the map
Shopping Center: Oxford Market Place Shopping Center (1). Display/hide its location on the map
Cemeteries: Ridgelawn Memorial Cemetery (1), Oxford Township Cemetery (2). Display/hide their locations on the map
Lakes: Ploss Lake (A), Oxford Lake (B). Display/hide their locations on the map
Parks in Oxford include: Oxford Savings Bank Historical Marker (1), Scripter Village Park (2). Display/hide their locations on the map
Tourist attraction: Hire-A-Home Inc (Tours & Charters; Po Box 666).
Birthplace of: Andrew Bird Glaspie - Politician, Dave Rayner - 2005 NFL player (Indianapolis Colts, born: Oct 26, 1982), Eric Ghiaciuc - 2005 NFL player (Cincinnati Bengals, born: May 28, 1981), Nathan Gerbe - Ice hockey player, Jason DeSantis - Ice hockey player.
Drinking water stations with addresses in Oxford and their reported violations in the past:
UPLAND HILLS FARM INC (Population served: 300, Groundwater):Past health violations:CROSSROADS FOR YOUTH (Address: 930 East Drahner , Population served: 120, Groundwater):Past monitoring violations:
- MCL, Monthly (TCR) - In SEP-2006, Contaminant: Coliform. Follow-up actions: St Violation/Reminder Notice (SEP-06-2006), St Public Notif requested (SEP-06-2006), St Site Visit (enforcement) (SEP-07-2006), St Public Notif received (SEP-07-2006), St Compliance achieved (SEP-15-2006)
- One routine major monitoring violation
Past health violations:STONY LAKE PARK (Population served: 100, Groundwater):Past monitoring violations:
- MCL, Average - Between OCT-2013 and DEC-2013, Contaminant: Arsenic. Follow-up actions: St Public Notif requested (NOV-20-2013), St Violation/Reminder Notice (NOV-20-2013), St Public Notif received (NOV-21-2013), St Compliance achieved (FEB-17-2014)
- MCL, Monthly (TCR) - In SEP-2013, Contaminant: Coliform. Follow-up actions: St Compliance achieved (SEP-26-2013), St Public Notif requested (OCT-16-2013), St Violation/Reminder Notice (OCT-16-2013), St Public Notif received (OCT-24-2013)
- MCL, Monthly (TCR) - In JUL-2013, Contaminant: Coliform. Follow-up actions: St Compliance achieved (JUL-31-2013), St Public Notif received (AUG-28-2013)
- MCL, Monthly (TCR) - In JUL-2012, Contaminant: Coliform. Follow-up actions: St Compliance achieved (JUL-21-2012), St Public Notif requested (JUL-25-2012), St Violation/Reminder Notice (JUL-25-2012)
- MCL, Monthly (TCR) - In JUL-2011, Contaminant: Coliform. Follow-up actions: St Boil Water Order (JUL-08-2011), St Compliance achieved (JUL-18-2011), St Public Notif requested (JUL-25-2011), St Violation/Reminder Notice (JUL-25-2011), St Public Notif received (AUG-06-2011)
- MCL, Monthly (TCR) - In AUG-2008, Contaminant: Coliform. Follow-up actions: St Public Notif requested (AUG-26-2008), St Violation/Reminder Notice (AUG-26-2008), St Public Notif received (AUG-26-2008), St Compliance achieved (SEP-01-2008)
- 6 other older health violations
- Monitoring, Source Water (GWR) - In JUL-12-2013, Contaminant: E. COLI. Follow-up actions: St Compliance achieved (JUL-15-2013), St Public Notif received (AUG-19-2013)
- One regular monitoring violation
Past health violations:OAKWOOD MARKET (Population served: 50, Groundwater):
- MCL, Monthly (TCR) - In JUN-2010, Contaminant: Coliform. Follow-up actions: St Public Notif received (JUN-30-2010), St Violation/Reminder Notice (JUN-30-2010), St Site Visit (enforcement) (JUN-30-2010), St Public Notif requested (JUN-30-2010), St Compliance achieved (JUL-08-2010)
Past health violations:OXFORD BANK (Population served: 50, Groundwater):Past monitoring violations:
- MCL, Monthly (TCR) - In JAN-2012, Contaminant: Coliform. Follow-up actions: St Public Notif received (JAN-06-2012), St Violation/Reminder Notice (JAN-06-2012), St Site Visit (enforcement) (JAN-06-2012), St Public Notif requested (JAN-06-2012), St Compliance achieved (JAN-12-2012)
- 2 routine major monitoring violations
- One regular monitoring violation
Past monitoring violations:ITW DEVCON FUTURA COATINGS (Population served: 40, Groundwater):
- One routine major monitoring violation
- One regular monitoring violation
Past health violations:SEYMOUR LAKE PARK CONCESSION (Population served: 30, Groundwater):
- MCL, Monthly (TCR) - In NOV-2013, Contaminant: Coliform
- MCL, Monthly (TCR) - In SEP-2013, Contaminant: Coliform. Follow-up actions: St Public Notif received (OCT-01-2013), St Violation/Reminder Notice (OCT-01-2013), St Tech Assistance Visit (OCT-01-2013), St Public Notif requested (OCT-01-2013), St Compliance achieved (OCT-23-2013)
Past health violations:OXFORD PROFESSIONAL BUILDING (Population served: 25, Groundwater):
- MCL, Monthly (TCR) - In JUL-2005, Contaminant: Coliform. Follow-up actions: St Public Notif requested (JUL-20-2005), St Violation/Reminder Notice (JUL-20-2005), St Public Notif received (JUL-25-2005), St Compliance achieved (JUL-29-2005)
Past health violations:
- MCL, Monthly (TCR) - In NOV-2012, Contaminant: Coliform. Follow-up actions: St Public Notif received (NOV-30-2012), St Violation/Reminder Notice (NOV-30-2012), St Tech Assistance Visit (NOV-30-2012), St Public Notif requested (NOV-30-2012), St Compliance achieved (DEC-11-2012)
- MCL, Monthly (TCR) - In SEP-2012, Contaminant: Coliform. Follow-up actions: St Public Notif requested (SEP-21-2012), St Violation/Reminder Notice (SEP-21-2012), St Tech Assistance Visit (SEP-24-2012), St Public Notif received (SEP-24-2012), St Compliance achieved (OCT-12-2012)
Drinking water stations with addresses in Oxford that have no violations reported:
- WHISPERING OAKS CAMPGROUND (Population served: 200, Primary Water Source Type: Groundwater)
- KINGSBURY-JUSTIN SCHWARTZ CTR (Population served: 160, Primary Water Source Type: Groundwater)
- OXFORD HILL GOLF & COUNTRY CLB (Population served: 150, Primary Water Source Type: Groundwater)
- MULBERRY HILLS COUNTRY CLUB (Population served: 100, Primary Water Source Type: Groundwater)
- STTARZ (Population served: 100, Primary Water Source Type: Groundwater)
- SEYMOUR LAKE UNITED METHODIST (Population served: 100, Primary Water Source Type: Groundwater)
- KINGSBURY LOWER ELEM SCHOOL (Population served: 72, Primary Water Source Type: Groundwater)
- NORTH OAKLAND DENTAL GROUP (Population served: 50, Primary Water Source Type: Groundwater)
- N. OAKLAND PROFESSIONAL (834) (Population served: 50, Primary Water Source Type: Groundwater)
- ROLLING HILLS CLUB, INC. (Population served: 30, Primary Water Source Type: Groundwater)
| This village: | 2.5 people |
| Michigan: | 2.5 people |
| This village: | 66.6% |
| Whole state: | 66.0% |
| This village: | 5.6% |
| Whole state: | 6.4% |
Likely homosexual households (counted as self-reported same-sex unmarried-partner households)
- Lesbian couples: 0.1% of all households
- Gay men: 0.1% of all households
7 people in group homes intended for adults in 2010
18 people in homes for the mentally ill in 2000
8 people in other noninstitutional group quarters in 2000
Banks with branches in Oxford (2011 data):
- Oxford Bank: at 60 South Washington Street, South Washington Street Branch, Independence Village Retirement Comm. Info updated 2009/10/07: Bank assets: $264.3 mil, Deposits: $250.5 mil, local headquarters, positive income, Commercial Lending Specialization, 11 total offices, Holding Company: Oxford Bank Corporation
- JPMorgan Chase Bank, National Association: Oxford-Orion Branch at 990 South Lapeer Road, branch established on 1974/08/12; Lapeer Road & Ray Road Banking Cente at 860 North Lapeer Road, branch established on 2010/01/28. Info updated 2011/11/10: Bank assets: $1,811,678.0 mil, Deposits: $1,190,738.0 mil, headquarters in Columbus, OH, positive income, International Specialization, 5577 total offices, Holding Company: Jpmorgan Chase & Co.
- Flagstar Bank, FSB: Oxford Branch at 425 N. Lapeer Rd, branch established on 2004/05/05. Info updated 2011/07/21: Bank assets: $13,623.5 mil, Deposits: $7,802.8 mil, headquarters in Troy, MI, negative income in the last year, Mortgage Lending Specialization, 135 total offices
For population 15 years and over in Oxford:
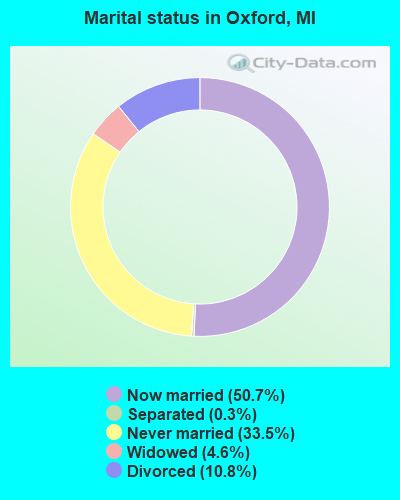
- Never married: 33.5%
- Now married: 50.7%
- Separated: 0.3%
- Widowed: 4.6%
- Divorced: 10.8%
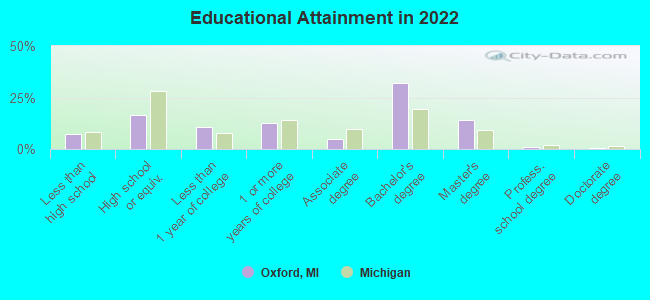
For population 25 years and over in Oxford:
- High school or higher: 92.5%
- Bachelor's degree or higher: 46.5%
- Graduate or professional degree: 15.2%
- Unemployed: 2.0%
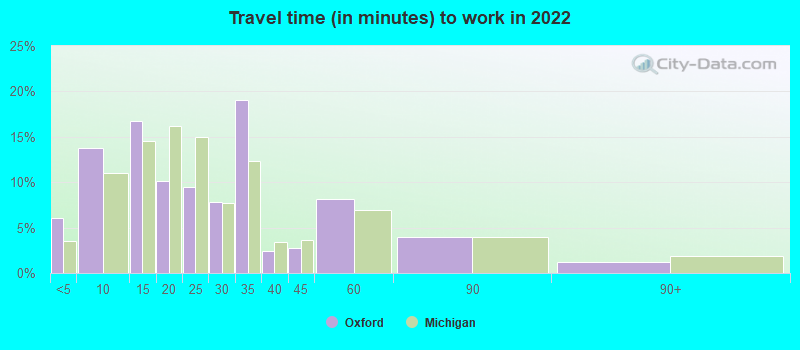
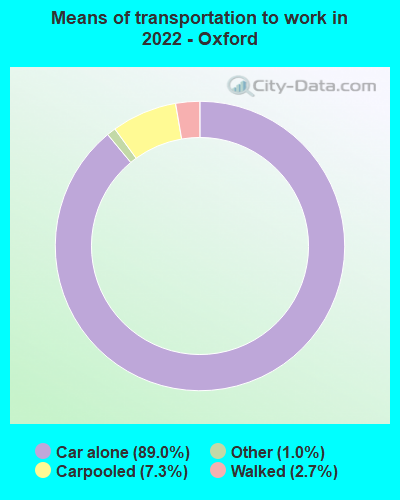
- Mean travel time to work (commute): 24.8 minutes
| Here: | 9.4 |
| Michigan average: | 11.0 |
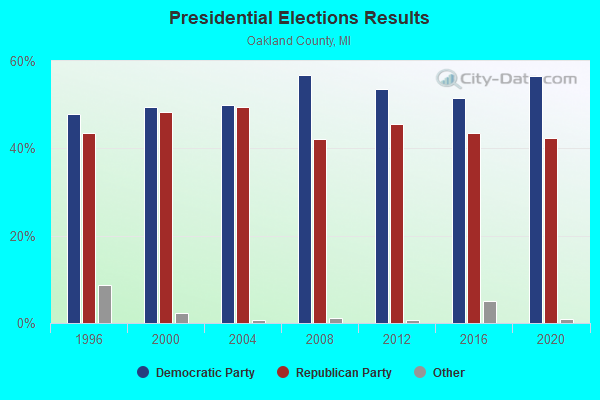
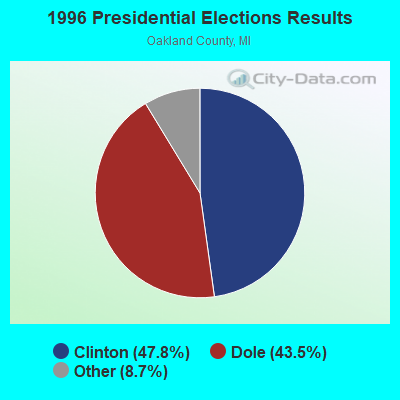
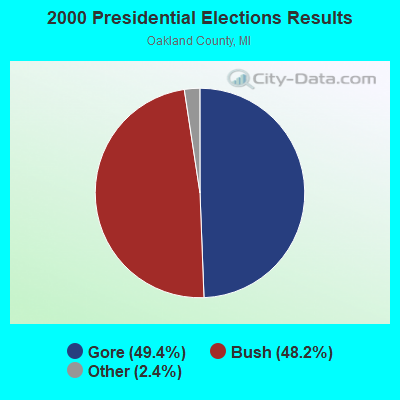
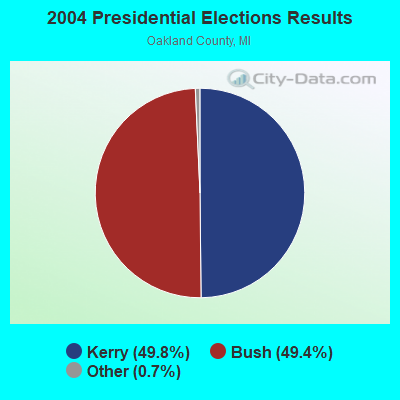
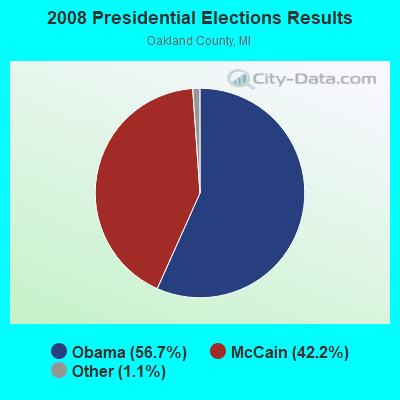
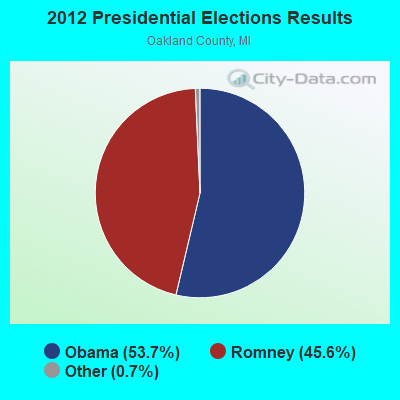
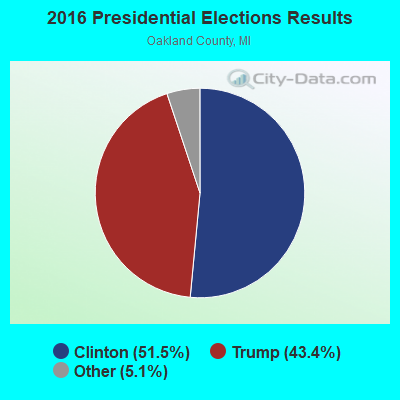
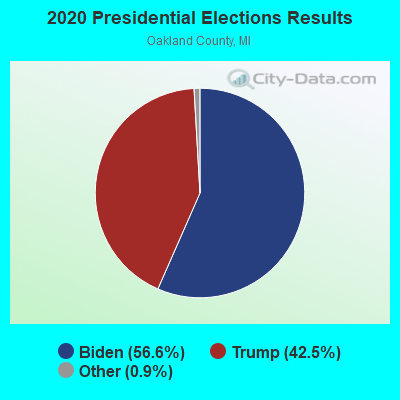
Graphs represent county-level data. Detailed 2008 Election Results
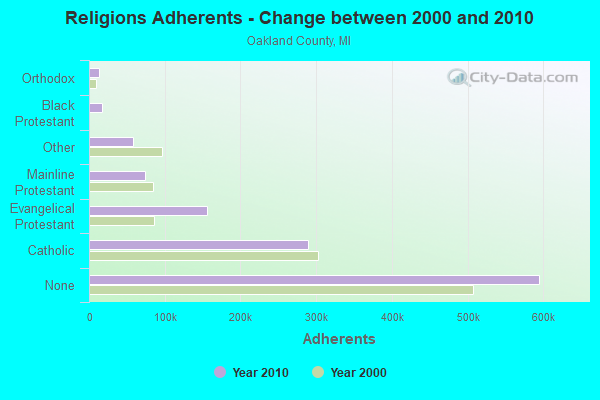
Religion statistics for Oxford, MI (based on Oakland County data)
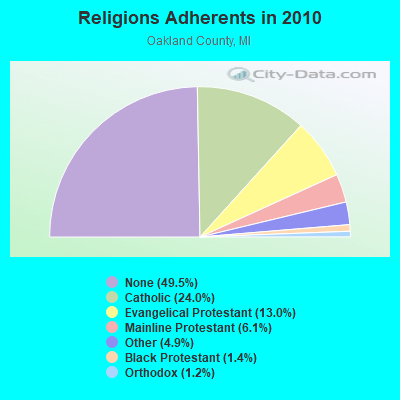
| Religion | Adherents | Congregations |
|---|---|---|
| Catholic | 289,116 | 64 |
| Evangelical Protestant | 155,826 | 319 |
| Mainline Protestant | 73,373 | 159 |
| Other | 58,590 | 117 |
| Black Protestant | 16,826 | 35 |
| Orthodox | 13,844 | 23 |
| None | 594,787 | - |
Food Environment Statistics:
| Oakland County: | 2.44 / 10,000 pop. |
| Michigan: | 2.34 / 10,000 pop. |
| Here: | 0.18 / 10,000 pop. |
| Michigan: | 0.18 / 10,000 pop. |
| Oakland County: | 1.35 / 10,000 pop. |
| Michigan: | 1.52 / 10,000 pop. |
| This county: | 2.43 / 10,000 pop. |
| State: | 2.99 / 10,000 pop. |
| This county: | 8.18 / 10,000 pop. |
| Michigan: | 6.80 / 10,000 pop. |
| Here: | 8.8% |
| Michigan: | 9.7% |
| Here: | 25.6% |
| Michigan: | 29.7% |
| This county: | 13.0% |
| Michigan: | 13.4% |
Health and Nutrition:
| Oxford: | 50.3% |
| Michigan: | 50.3% |
| Oxford: | 48.0% |
| Michigan: | 47.9% |
| Oxford: | 28.9 |
| State: | 28.7 |
| Oxford: | 22.2% |
| Michigan: | 20.6% |
| Oxford: | 11.0% |
| State: | 10.4% |
| Here: | 6.8 |
| Michigan: | 6.8 |
| Oxford: | 33.4% |
| Michigan: | 34.1% |
| Oxford: | 58.7% |
| Michigan: | 57.0% |
| Oxford: | 79.7% |
| Michigan: | 79.6% |
More about Health and Nutrition of Oxford, MI Residents
| Local government employment and payroll (March 2022) | |||||
| Function | Full-time employees | Monthly full-time payroll | Average yearly full-time wage | Part-time employees | Monthly part-time payroll |
|---|---|---|---|---|---|
| Other Government Administration | 10 | $24,881 | $29,857 | 1 | $1,734 |
| Police Protection - Officers | 6 | $30,787 | $61,574 | 3 | $6,196 |
| Other and Unallocable | 5 | $23,731 | $56,954 | 1 | $1,027 |
| Police - Other | 0 | $0 | 1 | $1,440 | |
| Totals for Government | 21 | $79,399 | $45,371 | 6 | $10,397 |
Oxford government finances - Expenditure in 2017 (per resident):
- Current Operations - Sewerage: $915,000 ($264.45)
Regular Highways: $709,000 ($204.91)
Police Protection: $604,000 ($174.57)
General - Other: $461,000 ($133.24)
Central Staff Services: $317,000 ($91.62)
Solid Waste Management: $171,000 ($49.42)
General Public Buildings: $72,000 ($20.81)
Judicial and Legal Services: $64,000 ($18.50)
Protective Inspection and Regulation - Other: $61,000 ($17.63)
Parks and Recreation: $51,000 ($14.74)
Financial Administration: $4,000 ($1.16)
- General - Interest on Debt: $133,000 ($38.44)
- Other Capital Outlay - General - Other: $5,000 ($1.45)
- Total Salaries and Wages: $964,000 ($278.61)
- Water Utilities - Interest on Debt: $110,000 ($31.79)
Oxford government finances - Revenue in 2017 (per resident):
- Charges - Sewerage: $676,000 ($195.38)
Other: $196,000 ($56.65)
- Local Intergovernmental - Other: $125,000 ($36.13)
- Miscellaneous - General Revenue - Other: $359,000 ($103.76)
Fines and Forfeits: $82,000 ($23.70)
Rents: $20,000 ($5.78)
Interest Earnings: $9,000 ($2.60)
- Revenue - Water Utilities: $906,000 ($261.85)
- State Intergovernmental - Highways: $290,000 ($83.82)
General Local Government Support: $277,000 ($80.06)
Other: $1,000 ($0.29)
- Tax - Property: $1,466,000 ($423.70)
Occupation and Business License - Other: $56,000 ($16.18)
Other License: $5,000 ($1.45)
Oxford government finances - Debt in 2017 (per resident):
- Long Term Debt - Beginning Outstanding - Unspecified Public Purpose: $6,873,000 ($1986.42)
Outstanding Unspecified Public Purpose: $6,341,000 ($1832.66)
Retired Unspecified Public Purpose: $2,933,000 ($847.69)
Issue, Unspecified Public Purpose: $2,401,000 ($693.93)
Oxford government finances - Cash and Securities in 2017 (per resident):
- Other Funds - Cash and Securities: $2,617,000 ($756.36)
5.91% of this county's 2021 resident taxpayers lived in other counties in 2020 ($79,655 average adjusted gross income)
| Here: | 5.91% |
| Michigan average: | 5.83% |
0.01% of residents moved from foreign countries ($78 average AGI)
Oakland County: 0.01% Michigan average: 0.00%
Top counties from which taxpayers relocated into this county between 2020 and 2021:
| from Wayne County, MI | |
| from Macomb County, MI | |
| from Genesee County, MI |
6.21% of this county's 2020 resident taxpayers moved to other counties in 2021 ($89,748 average adjusted gross income)
| Here: | 6.21% |
| Michigan average: | 5.95% |
0.01% of residents moved to foreign countries ($55 average AGI)
Oakland County: 0.01% Michigan average: 0.00%
Top counties to which taxpayers relocated from this county between 2020 and 2021:
| to Wayne County, MI | |
| to Macomb County, MI | |
| to Genesee County, MI |
| Businesses in Oxford, MI | ||||
| Name | Count | Name | Count | |
|---|---|---|---|---|
| AT&T | 1 | Jimmy John's | 1 | |
| Burger King | 1 | Little Caesars Pizza | 1 | |
| Cold Stone Creamery | 1 | McDonald's | 1 | |
| Curves | 1 | Meijer | 1 | |
| Dairy Queen | 1 | Rite Aid | 1 | |
| Domino's Pizza | 1 | Tim Hortons | 1 | |
| H&R Block | 1 | UPS | 2 | |
Strongest AM radio stations in Oxford:
- WWJ (950 AM; 50 kW; DETROIT, MI; Owner: INFINITY BROADCASTING OPERATIONS, INC.)
- WXYT (1270 AM; 50 kW; DETROIT, MI; Owner: INFINITY BROADCASTING CORP. OF DETROIT)
- WJR (760 AM; 50 kW; DETROIT, MI; Owner: ABC, INC.)
- WOAP (1080 AM; 50 kW; OWOSSO, MI)
- WCHB (1200 AM; 50 kW; TAYLOR, MI; Owner: RADIO ONE OF DETROIT, LLC)
- WFDF (910 AM; 50 kW; FLINT, MI; Owner: ABC, INC.)
- WDFN (1130 AM; 50 kW; DETROIT, MI; Owner: AMFM RADIO LICENSES, L.L.C.)
- WLSP (1530 AM; daytime; 5 kW; LAPEER, MI; Owner: REGENT BROADCASTING OF FLINT INC.)
- WUFL (1030 AM; daytime; 5 kW; STERLING HEIGHTS, MI; Owner: FAMILY LIFE BROADCASTING SYSTEM)
- WTRX (1330 AM; 5 kW; FLINT, MI; Owner: CITADEL BROADCASTING COMPANY)
- WFNT (1470 AM; 5 kW; FLINT, MI)
- WDEO (990 AM; 9 kW; YPSILANTI, MI; Owner: WORD BROADCASTERS, INC.)
- WSNL (600 AM; 1 kW; FLINT, MI)
Strongest FM radio stations in Oxford:
- WFUM-FM (91.1 FM; FLINT, MI; Owner: THE REGENTS OF THE UNIV. OF MICHIGAN)
- WXOU (88.3 FM; AUBURN HILLS, MI; Owner: OAKLAND UNIVERSITY)
- WRIF (101.1 FM; DETROIT, MI; Owner: GREATER BOSTON RADIO, INC.)
- WKRK-FM (97.1 FM; DETROIT, MI; Owner: INFINITY BROADCASTING OPERATIONS, INC.)
- WMGC-FM (105.1 FM; DETROIT, MI; Owner: GREATER BOSTON RADIO, INC.)
- WCSX (94.7 FM; BIRMINGHAM, MI; Owner: GREATER BOSTON RADIO, INC.)
- WYCD (99.5 FM; DETROIT, MI; Owner: INFINITY BROADCASTING CORPORATION OF MICHIGAN)
- WDVD (96.3 FM; DETROIT, MI; Owner: ABC, INC.)
- WDTJ (105.9 FM; DETROIT, MI; Owner: RADIO ONE OF DETROIT, LLC)
- WDRQ (93.1 FM; DETROIT, MI; Owner: ABC, INC.)
- WHYT (89.1 FM; IMLAY CITY, MI; Owner: MICHIGAN COMMUNITY RADIO)
- WFBE (95.1 FM; FLINT, MI; Owner: CITADEL BROADCASTING COMPANY)
- WAKL (88.9 FM; FLINT, MI; Owner: EDUCATIONAL MEDIA FOUNDATION)
- WMXD (92.3 FM; DETROIT, MI; Owner: AMFM RADIO LICENSES, L.L.C.)
- WCRZ (107.9 FM; FLINT, MI; Owner: REGENT BROADCASTING OF FLINT, INC.)
- WDMK (102.7 FM; MOUNT CLEMENS, MI; Owner: RADIO ONE OF DETROIT, LLC)
- WNIC (100.3 FM; DEARBORN, MI; Owner: AMFM RADIO LICENSES, L.L.C.)
- WQUS (103.1 FM; LAPEER, MI; Owner: REGENT BROADCASTING OF FLINT INC.)
- WDTW (106.7 FM; DETROIT, MI; Owner: AMFM RADIO LICENSES, L.L.C.)
- WKQI (95.5 FM; DETROIT, MI; Owner: AMFM RADIO LICENSES, L.L.C.)
TV broadcast stations around Oxford:
- WFUM (Channel 28; FLINT, MI; Owner: UNIVERSITY OF MICHIGAN)
- WXYZ-TV (Channel 7; DETROIT, MI; Owner: CHANNEL 7 OF DETROIT, INC.)
- WJBK (Channel 2; DETROIT, MI; Owner: FOX TELEVISION STATIONS, INC.)
- WKBD (Channel 50; DETROIT, MI; Owner: VIACOM STATIONS GROUP OF DETROIT INC.)
- WDIV-TV (Channel 4; DETROIT, MI; Owner: POST-NEWSWEEK STATIONS, MICHIGAN, INC.)
- WWJ-TV (Channel 62; DETROIT, MI; Owner: CBS BROADCASTING INC.)
- WDWB (Channel 20; DETROIT, MI; Owner: WXON LICENSE, INC.)
- WTVS (Channel 56; DETROIT, MI; Owner: DETROIT EDUC. TV FOUNDATION)
- WBXD-CA (Channel 5; DETROIT, MI; Owner: THE BOX WORLDWIDE LLC)
- WEYI-TV (Channel 25; SAGINAW, MI; Owner: WEYI BROADCASTING, LLC)
- WADL (Channel 38; MOUNT CLEMENS, MI; Owner: ADELL BROADCASTING CORPORATION)
- W09CK (Channel 9; FLINT, MI; Owner: P & P CABLE HOLDINGS, L.L.C.)
- W52CU (Channel 52; PINCONNING, MI; Owner: NTN/SAGINAW, INC.)
- WXON-LP (Channel 54; FLINT, MI; Owner: P & P CABLE HOLDINGS, L.L.C.)
- National Bridge Inventory (NBI) Statistics
- 6Number of bridges
- 23ft / 6.7mTotal length
- 50,625Total average daily traffic
- 1,741Total average daily truck traffic
FCC Registered Cell Phone Towers:
1 (See the full list of FCC Registered Cell Phone Towers in Oxford)FCC Registered Antenna Towers:
46 (See the full list of FCC Registered Antenna Towers)FCC Registered Private Land Mobile Towers:
1 (See the full list of FCC Registered Private Land Mobile Towers in Oxford, MI)FCC Registered Broadcast Land Mobile Towers:
16 (See the full list of FCC Registered Broadcast Land Mobile Towers)FCC Registered Microwave Towers:
3- STATION, 1200 Granger Rd Stratford Sta (Lat: 42.841139 Lon: -83.300583), Type: Pole, Structure height: 22.1 m, Overall height: 25 m, Call Sign: WNTT397,
Assigned Frequencies: 952.506 MHz, 928.506 MHz, Grant Date: 09/06/2018, Expiration Date: 10/26/2028, Registrant: Dte Energy Company, 1 Energy Plz, Detroit, MI 48226, Phone: (313) 235-9713, Fax: (313) 235-0362, Email:
- METAMORA - 1341 BRAU, 1341 Brauer Rd (Metamora #90124) (Lat: 42.894556 Lon: -83.324667), Type: Tower, Structure height: 61 m, Overall height: 62.5 m, Call Sign: WQIT990,
Assigned Frequencies: 11565.0 MHz, Grant Date: 05/13/2008, Expiration Date: 05/13/2018, Cancellation Date: 11/13/2009, Certifier: William Chastain, Registrant: Radio Dynamics Corporation, Silver Spring, MD 20914, Phone: (301) 493-5171, Fax: (301) 576-4553, Email:
- OXFORD, Lat: 42.823917 Lon: -83.266528, Call Sign: WQKX278,
Assigned Frequencies: 952.456 MHz, Grant Date: 11/25/2019, Expiration Date: 10/14/2029, Certifier: K. Joseph Young, Registrant: Sensus, 450 N Gallatin Avenue, Uniontown, PA 15401, Phone: (800) 638-3748, Fax: (800) 888-2403, Email:
FCC Registered Paging Towers:
1- 2255 Metamora Rd (Lat: 42.857528 Lon: -83.290472), Overall height: 89.3 m, Call Sign: KNKO294,
Assigned Frequencies: 931.337 MHz, Grant Date: 08/05/2014, Expiration Date: 06/22/2024, Certifier: J. Roy Pottle, Registrant: Wilkinson Barker Knauer, LLP, 1800 M Street, N.W., Suite 800n, Washington, DC 20036, Phone: (202) 783-4141, Fax: (202) 783-5851, Email:
FCC Registered Amateur Radio Licenses:
111 (See the full list of FCC Registered Amateur Radio Licenses in Oxford)FAA Registered Aircraft Manufacturers and Dealers:
1 (See the full list of FAA Registered Manufacturers and Dealers in Oxford)FAA Registered Aircraft:
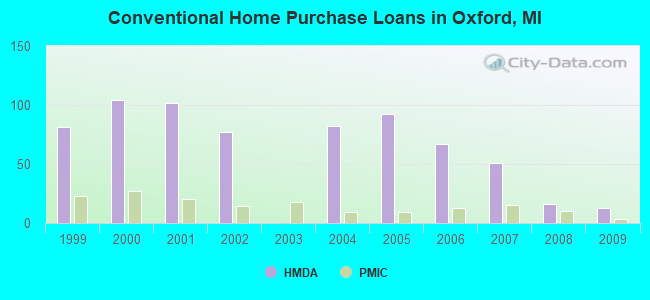
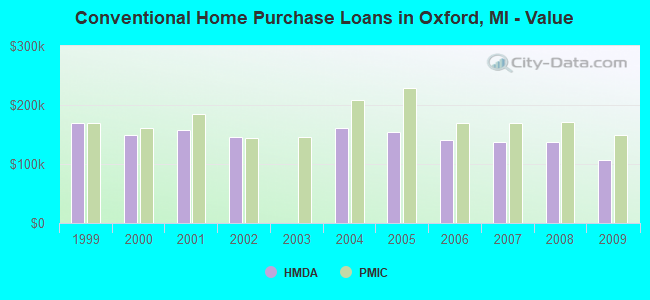
36 (See the full list of FAA Registered Aircraft)| Home Mortgage Disclosure Act Aggregated Statistics For Year 2009 (Based on 1 full tract) | ||||||||||||
| A) FHA, FSA/RHS & VA Home Purchase Loans | B) Conventional Home Purchase Loans | C) Refinancings | D) Home Improvement Loans | F) Non-occupant Loans on < 5 Family Dwellings (A B C & D) | G) Loans On Manufactured Home Dwelling (A B C & D) | |||||||
|---|---|---|---|---|---|---|---|---|---|---|---|---|
| Number | Average Value | Number | Average Value | Number | Average Value | Number | Average Value | Number | Average Value | Number | Average Value | |
| LOANS ORIGINATED | 14 | $123,143 | 13 | $107,231 | 47 | $138,872 | 2 | $3,500 | 8 | $79,125 | 1 | $8,000 |
| APPLICATIONS APPROVED, NOT ACCEPTED | 0 | $0 | 1 | $167,000 | 6 | $191,667 | 0 | $0 | 0 | $0 | 0 | $0 |
| APPLICATIONS DENIED | 5 | $136,600 | 2 | $184,500 | 28 | $155,964 | 2 | $11,000 | 1 | $135,000 | 0 | $0 |
| APPLICATIONS WITHDRAWN | 1 | $152,000 | 0 | $0 | 9 | $132,111 | 0 | $0 | 2 | $150,500 | 0 | $0 |
| FILES CLOSED FOR INCOMPLETENESS | 0 | $0 | 0 | $0 | 0 | $0 | 0 | $0 | 0 | $0 | 0 | $0 |
Detailed HMDA statistics for the following Tracts: 1215.00
| Private Mortgage Insurance Companies Aggregated Statistics For Year 2009 (Based on 1 full tract) | ||||
| A) Conventional Home Purchase Loans | B) Refinancings | |||
|---|---|---|---|---|
| Number | Average Value | Number | Average Value | |
| LOANS ORIGINATED | 3 | $150,000 | 1 | $310,000 |
| APPLICATIONS APPROVED, NOT ACCEPTED | 1 | $167,000 | 0 | $0 |
| APPLICATIONS DENIED | 1 | $189,000 | 0 | $0 |
| APPLICATIONS WITHDRAWN | 0 | $0 | 0 | $0 |
| FILES CLOSED FOR INCOMPLETENESS | 0 | $0 | 0 | $0 |
Detailed PMIC statistics for the following Tracts: 1215.00
2002 - 2018 National Fire Incident Reporting System (NFIRS) incidents
- Fire incident types reported to NFIRS in Oxford, MI
- 30548.4%Structure Fires
- 19230.5%Outside Fires
- 10516.7%Mobile Property/Vehicle Fires
- 284.4%Other
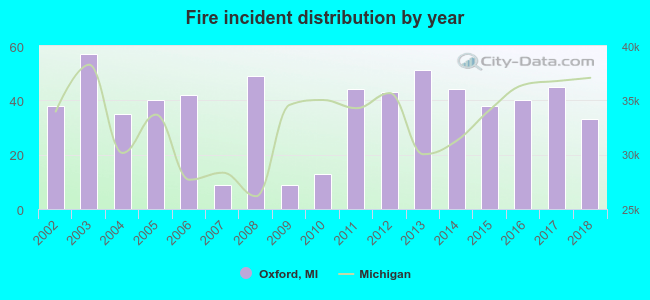 According to the data from the years 2002 - 2018 the average number of fire incidents per year is 37. The highest number of fires - 57 took place in 2003, and the least - 9 in 2007. The data has a declining trend.
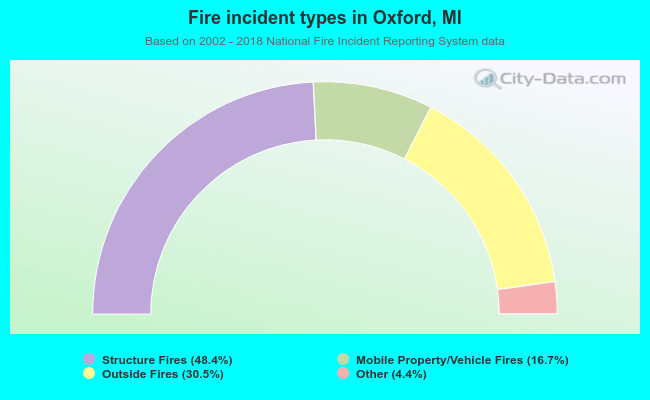 When looking into fire subcategories, the most reports belonged to: Structure Fires (48.4%), and Outside Fires (30.5%).
| Most common first names in Oxford, MI among deceased individuals | ||
| Name | Count | Lived (average) |
|---|---|---|
| William | 41 | 74.1 years |
| Robert | 41 | 72.5 years |
| Mary | 40 | 83.3 years |
| John | 37 | 72.8 years |
| James | 29 | 74.1 years |
| Dorothy | 28 | 80.2 years |
| George | 24 | 79.6 years |
| Helen | 21 | 82.6 years |
| Margaret | 20 | 78.7 years |
| Charles | 19 | 75.4 years |
| Most common last names in Oxford, MI among deceased individuals | ||
| Last name | Count | Lived (average) |
|---|---|---|
| Smith | 14 | 75.0 years |
| Miller | 11 | 83.1 years |
| Jones | 8 | 73.9 years |
| Brown | 8 | 76.4 years |
| Martin | 8 | 82.9 years |
| Moore | 8 | 82.2 years |
| Wilson | 7 | 74.1 years |
| Curtis | 7 | 80.8 years |
| Johnson | 7 | 79.6 years |
| Baldwin | 7 | 77.3 years |
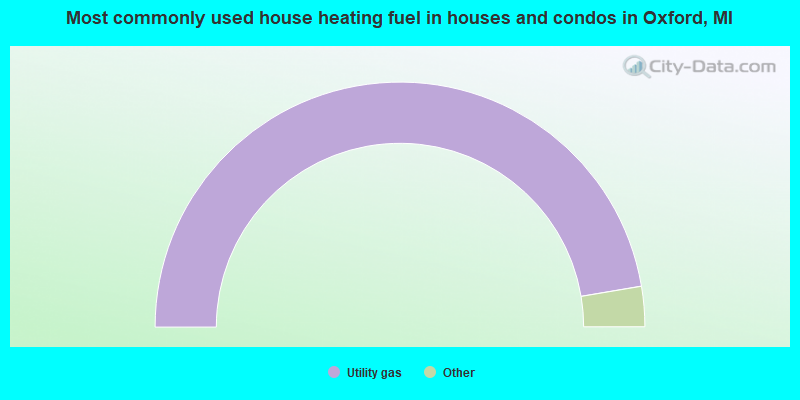
- 94.7%Utility gas
- 1.9%Fuel oil, kerosene, etc.
- 1.3%Wood
- 1.1%Bottled, tank, or LP gas
- 1.0%Electricity
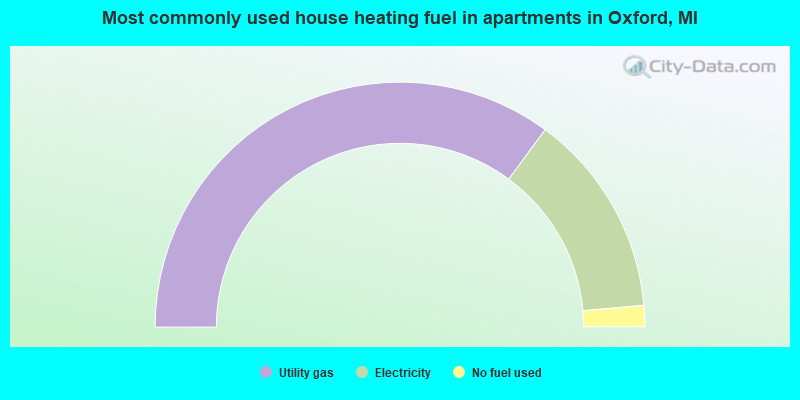
- 70.2%Utility gas
- 27.0%Electricity
- 2.8%No fuel used
Oxford compared to Michigan state average:
- Median house value above state average.
- Unemployed percentage significantly below state average.
- Black race population percentage significantly below state average.
- Length of stay since moving in below state average.
- Percentage of population with a bachelor's degree or higher above state average.

|
|
Total of 762 patent applications in 2008-2024.