Palatine, Illinois
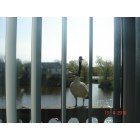
Palatine: Duck on the patio

Palatine: A Chain of ducks
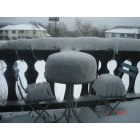
Palatine: Cake of Snow
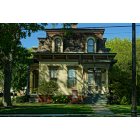
Palatine: Palatine Historical Society
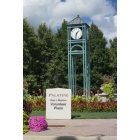
Palatine: Welcome to Palatine
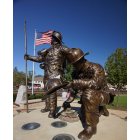
Palatine: We will never forget!
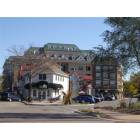
Palatine: The old and the new seamlessly woven together!

Palatine: The Three Great Welcoming Flags Of Palatine IL
- add
your
Submit your own pictures of this village and show them to the world
- OSM Map
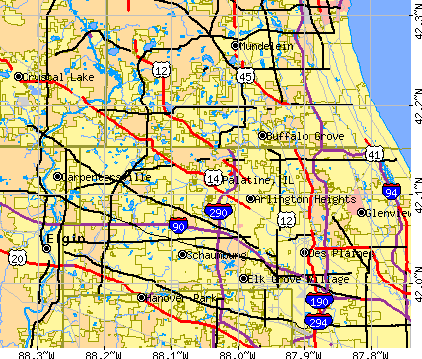
- General Map
- Google Map
- MSN Map
Population change since 2000: +0.0%
 |
| Males: 30,584 | |
| Females: 34,901 |
| Median resident age: | 40.2 years |
| Illinois median age: | 39.1 years |
Zip codes: 60067.
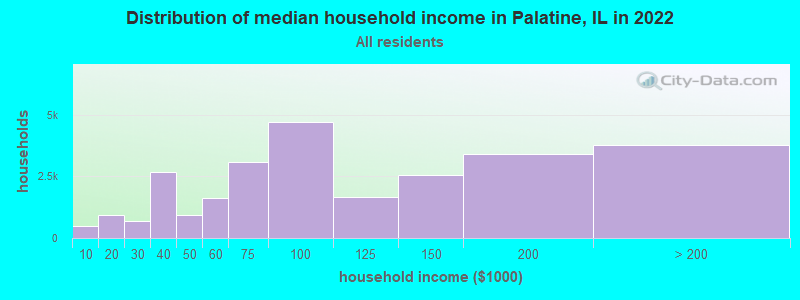
| Palatine: | $92,621 |
| IL: | $76,708 |
Estimated per capita income in 2022: $48,789 (it was $30,661 in 2000)
Palatine village income, earnings, and wages data
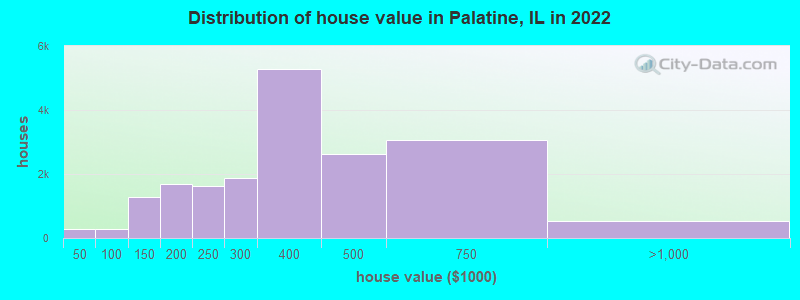
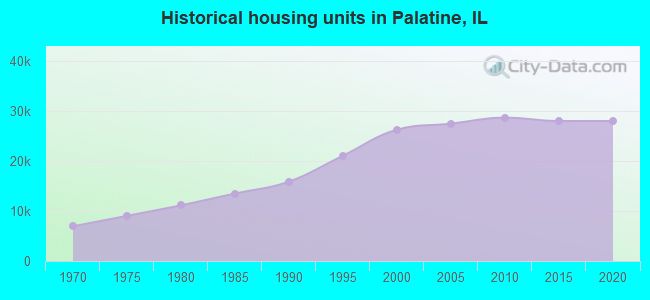
Estimated median house or condo value in 2022: $333,000 (it was $183,400 in 2000)
| Palatine: | $333,000 |
| IL: | $251,600 |
Mean prices in 2022: all housing units: $348,245; detached houses: $430,382; townhouses or other attached units: $278,482; in 2-unit structures: $157,877; in 3-to-4-unit structures: $194,179; in 5-or-more-unit structures: $175,269; mobile homes: over $1,000,000
Median gross rent in 2022: $1,435.
(5.3% for White Non-Hispanic residents, 27.1% for Black residents, 25.0% for Hispanic or Latino residents, 3.2% for American Indian residents, 79.0% for Native Hawaiian and other Pacific Islander residents, 28.7% for other race residents, 6.8% for two or more races residents)
Detailed information about poverty and poor residents in Palatine, IL


Compare current foreclosures in Palatine, IL:
| Photo | Address | Area | Beds / Baths | Price | Details |
|---|---|---|---|---|---|

|
#1
N Wren Ave
Palatine, IL 60067
|
1,303 sq. feet
|
1 baths 3 beds |
$409,000
|
show details |

|
#2
W Wood St Unit 308
Palatine, IL 60067
|
952 sq. feet
|
1 baths 2 beds |
show details | |

|
#3
E Shady Dr
Palatine, IL 60067
|
2,236 sq. feet
|
2 baths 3 beds |
show details | |

|
#4
W Washington St
Palatine, IL 60067
|
1,040 sq. feet
|
1 baths 3 beds |
show details | |

|
#5
W Washington St
Palatine, IL 60067
|
1,040 sq. feet
|
1 baths - beds |
show details | |

|
#6
W King George Ct
Palatine, IL 60067
|
2,400 sq. feet
|
2 baths - beds |
show details | |

|
#7
S Hale St
Palatine, IL 60067
|
1,008 sq. feet
|
1 baths - beds |
show details | |

|
#8
E Forest Knoll Dr
Palatine, IL 60074
|
1,632 sq. feet
|
1 baths - beds |
show details | |

|
#9
W Sutton Ct
Palatine, IL 60067
|
2,012 sq. feet
|
1 baths - beds |
show details | |

|
#10
N Middleton Ave
Palatine, IL 60067
|
2,530 sq. feet
|
2 baths - beds |
show details |
| Photo | Address | Area | Beds / Baths | Price | Details |
|---|---|---|---|---|---|

|
#11
N Norman Dr
Palatine, IL 60074
|
1,254 sq. feet
|
2 baths - beds |
show details | |

|
#12
S Insignia Ct
Palatine, IL 60067
|
1,976 sq. feet
|
1 baths - beds |
show details | |

|
#13
E Gilbert Rd
Palatine, IL 60067
|
1,189 sq. feet
|
1 baths - beds |
show details | |

|
#14
W Johnson St
Palatine, IL 60067
|
1,505 sq. feet
|
1 baths - beds |
show details | |

|
#15
E Meadow Lake Dr
Palatine, IL 60074
|
1,050 sq. feet
|
2 baths - beds |
show details | |

|
#16
N Benton St
Palatine, IL 60067
|
1,584 sq. feet
|
1 baths - beds |
show details | |

|
#17
Inverway
Palatine, IL 60067
|
2,524 sq. feet
|
2 baths - beds |
show details | |

|
#18
N Whitcomb Dr
Palatine, IL 60074
|
1,248 sq. feet
|
1 baths - beds |
show details | |

|
#19
N Goldengate Ln
Palatine, IL 60067
|
1,200 sq. feet
|
2 baths - beds |
show details | |

|
#20
E Aster Ave
Palatine, IL 60074
|
1,129 sq. feet
|
1 baths - beds |
show details |
| Photo | Address | Area | Beds / Baths | Price | Details |
|---|---|---|---|---|---|

|
#21
N Knollwood Dr
Palatine, IL 60067
|
1,155 sq. feet
|
1 baths - beds |
show details | |

|
#22
E Meadow Ln
Palatine, IL 60074
|
1,223 sq. feet
|
1 baths - beds |
show details | |

|
#23
W Pleasant Hill Blvd
Palatine, IL 60067
|
1,158 sq. feet
|
2 baths - beds |
show details | |

|
#24
E Zinnia Ln
Palatine, IL 60074
|
1,402 sq. feet
|
2 baths - beds |
show details | |

|
#25
E Home Ave
Palatine, IL 60074
|
3,056 sq. feet
|
2 baths - beds |
show details | |

|
#26
W Kenilworth Ave
Palatine, IL 60067
|
2,200 sq. feet
|
2 baths - beds |
show details | |

|
#27
E Forest Knoll Dr
Palatine, IL 60074
|
1,452 sq. feet
|
2 baths - beds |
show details | |

|
#28
E Lincoln St
Palatine, IL 60074
|
1,049 sq. feet
|
1 baths - beds |
show details | |

|
#29
E Baldwin Rd
Palatine, IL 60074
|
1,690 sq. feet
|
2 baths - beds |
show details | |

|
#30
N Morris Dr
Palatine, IL 60074
|
1,248 sq. feet
|
1 baths - beds |
show details |
| Photo | Address | Area | Beds / Baths | Price | Details |
|---|---|---|---|---|---|

|
#31
N Rohlwing Rd
Palatine, IL 60074
|
1,248 sq. feet
|
1 baths - beds |
show details | |

|
#32
E Old Virginia Rd
Palatine, IL 60074
|
1,773 sq. feet
|
2 baths - beds |
show details | |

|
#33
E Home Ave
Palatine, IL 60074
|
3,056 sq. feet
|
2 baths - beds |
show details | |

|
#34
W Panorama Dr Apt 206
Palatine, IL 60067
|
- sq. feet
|
- baths - beds |
show details | |

|
#35
E Northwest Hwy
Palatine, IL 60067
|
- sq. feet
|
- baths - beds |
show details | |

|
#36
N Hidden Crk Ci 3
Palatine, IL 60074
|
- sq. feet
|
- baths - beds |
show details | |

|
#37
W Johnson St Apt 1
Palatine, IL 60067
|
- sq. feet
|
- baths - beds |
show details | |

|
#38
N Enlund Dr Unit 7
Palatine, IL 60074
|
- sq. feet
|
- baths - beds |
show details | |

|
#39
Cambridge Ct Apt 1b
Palatine, IL 60074
|
- sq. feet
|
- baths - beds |
show details | |

|
#40
W Palatine Rd Apt 11
Palatine, IL 60067
|
- sq. feet
|
- baths - beds |
show details |
| Photo | Address | Area | Beds / Baths | Price | Details |
|---|---|---|---|---|---|

|
#41
N Rand Rd Apt 110
Palatine, IL 60074
|
- sq. feet
|
- baths - beds |
show details | |

|
#42
W Wilson St Apt 101
Palatine, IL 60067
|
- sq. feet
|
- baths - beds |
show details | |

|
#43
W Northwest Hwy Apt 3303
Palatine, IL 60067
|
- sq. feet
|
- baths - beds |
show details | |

|
#44
N Sterling Ave Apt 203
Palatine, IL 60067
|
- sq. feet
|
- baths - beds |
show details | |

|
#45
N Sterling Ave Apt 204
Palatine, IL 60067
|
- sq. feet
|
- baths - beds |
show details | |

|
#46
N Cedar St Apt 301
Palatine, IL 60067
|
- sq. feet
|
- baths - beds |
show details | |

|
#47
E Palatine Rd
Palatine, IL 60074
|
- sq. feet
|
- baths - beds |
show details | |

|
#48
E Evergreen Dr Apt 101
Palatine, IL 60074
|
- sq. feet
|
- baths - beds |
show details | |

|
#49
N Walden Dr
Palatine, IL 60067
|
- sq. feet
|
- baths - beds |
show details | |

|
Check over 1 million property listings on Foreclosure.com!
|
browse all offers | |||


- 38,97659.3%White alone
- 13,18420.1%Hispanic
- 8,92513.6%Asian alone
- 2,7814.2%Black alone
- 1,7722.7%Two or more races
- 1790.3%Other race alone
- 420.06%Native Hawaiian and Other
Pacific Islander alone - 170.03%American Indian alone
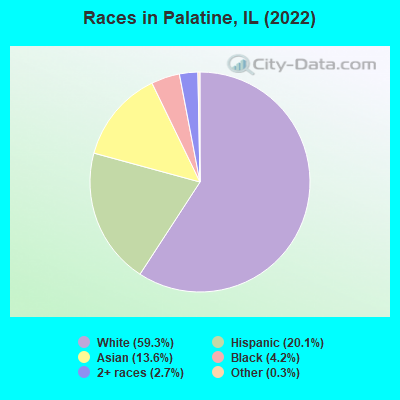
Races in Palatine detailed stats: ancestries, foreign born residents, place of birth
According to our research of Illinois and other state lists, there were 36 registered sex offenders living in Palatine, Illinois as of April 27, 2024.
The ratio of all residents to sex offenders in Palatine is 1,911 to 1.
The ratio of registered sex offenders to all residents in this city is much lower than the state average.
The City-Data.com crime index weighs serious crimes and violent crimes more heavily. Higher means more crime, U.S. average is 246.1. It adjusts for the number of visitors and daily workers commuting into cities.
- means the value is smaller than the state average.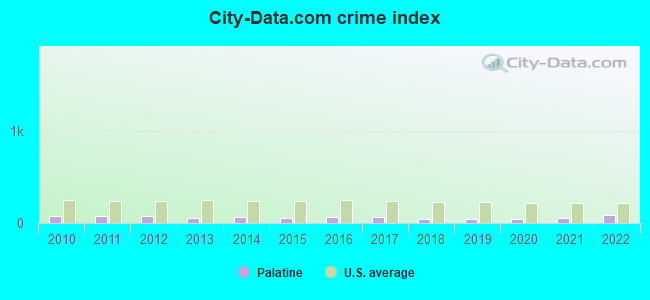
Crime rate in Palatine detailed stats: murders, rapes, robberies, assaults, burglaries, thefts, arson
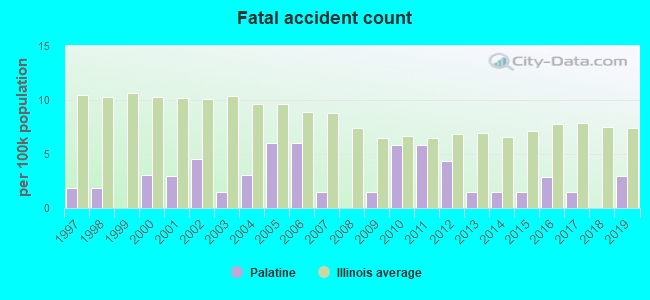
Full-time law enforcement employees in 2020, including police officers: 139 (106 officers - 98 male; 8 female).
| Officers per 1,000 residents here: | 1.57 |
| Illinois average: | 3.04 |
 Recent articles from our blog. Our writers, many of them Ph.D. graduates or candidates, create easy-to-read articles on a wide variety of topics.

 | Palatine High bad?? (3 replies) |
| Elk Grove Village or Palatine?? (7 replies) |
| School District/Housing in Schaumberg, Hoffman Estate, Palatine (6 replies) |
| Jewish families in Palatine? (25 replies) |
| Barrington or Inverness/Palatine - Differences? (8 replies) |
| Palatine high school (0 replies) |
Latest news from Palatine, IL collected exclusively by city-data.com from local newspapers, TV, and radio stations
Ancestries: Polish (8.7%), German (6.8%), Italian (4.8%), Irish (4.2%), American (3.0%), English (2.0%).
Current Local Time: CST time zone
Incorporated on 01/13/1948
Elevation: 741 feet
Land area: 13.0 square miles.
Population density: 5,048 people per square mile (average).
16,317 residents are foreign born (9.1% Asia, 7.7% Latin America, 6.7% Europe).
| This village: | 24.8% |
| Illinois: | 14.1% |
Median real estate property taxes paid for housing units with mortgages in 2022: $7,624 (2.1%)
Median real estate property taxes paid for housing units with no mortgage in 2022: $6,033 (2.2%)
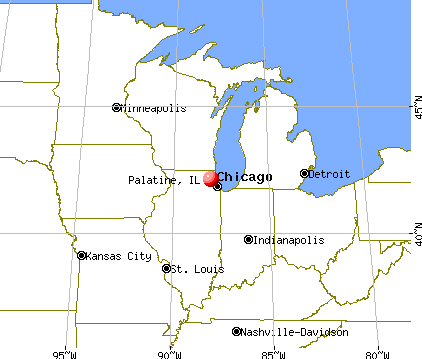
Nearest city with pop. 200,000+: Chicago, IL  (26.6 miles , pop. 2,896,016).
Nearest cities:
), ), Latitude: 42.12 N, Longitude: 88.04 W
Daytime population change due to commuting: -9,684 (-14.8%)
Workers who live and work in this village: 11,616 (31.6%)
Area codes: 847, 224

Palatine, Illinois accommodation & food services, waste management - Economy and Business Data
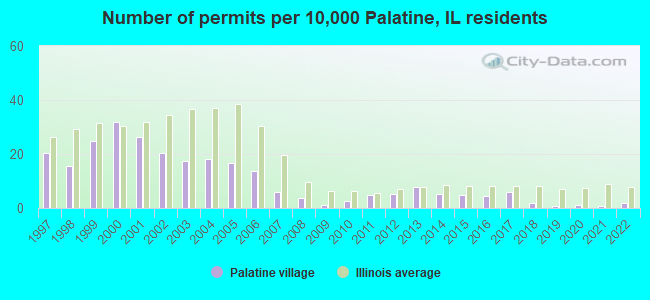
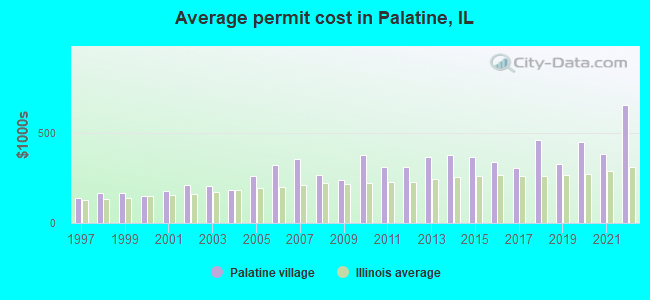
Single-family new house construction building permits:
- 2022: 11 buildings, average cost: $659,100
- 2021: 6 buildings, average cost: $382,500
- 2020: 7 buildings, average cost: $452,000
- 2019: 6 buildings, average cost: $327,500
- 2018: 11 buildings, average cost: $466,000
- 2017: 39 buildings, average cost: $305,000
- 2016: 30 buildings, average cost: $340,400
- 2015: 31 buildings, average cost: $371,400
- 2014: 34 buildings, average cost: $382,000
- 2013: 51 buildings, average cost: $366,900
- 2012: 33 buildings, average cost: $315,200
- 2011: 31 buildings, average cost: $311,400
- 2010: 16 buildings, average cost: $378,400
- 2009: 8 buildings, average cost: $238,100
- 2008: 25 buildings, average cost: $269,400
- 2007: 40 buildings, average cost: $354,600
- 2006: 90 buildings, average cost: $322,800
- 2005: 110 buildings, average cost: $261,000
- 2004: 118 buildings, average cost: $181,700
- 2003: 114 buildings, average cost: $207,000
- 2002: 133 buildings, average cost: $213,900
- 2001: 172 buildings, average cost: $175,700
- 2000: 209 buildings, average cost: $152,600
- 1999: 163 buildings, average cost: $169,500
- 1998: 101 buildings, average cost: $168,800
- 1997: 134 buildings, average cost: $142,000
| Here: | 3.3% |
| Illinois: | 4.2% |
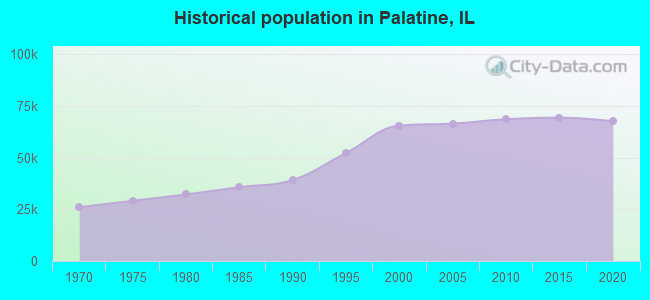
Population change in the 1990s: +15,747 (+31.7%).
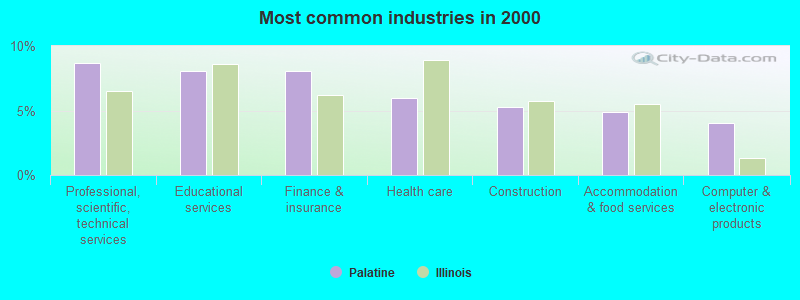
- Professional, scientific, technical services (8.7%)
- Educational services (8.0%)
- Finance & insurance (8.0%)
- Health care (6.0%)
- Construction (5.2%)
- Accommodation & food services (4.9%)
- Computer & electronic products (4.0%)
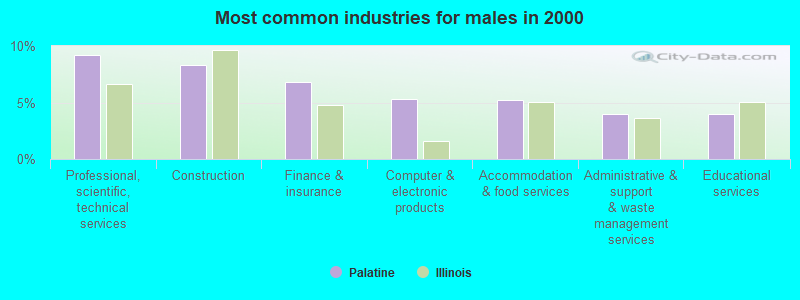
- Professional, scientific, technical services (9.2%)
- Construction (8.3%)
- Finance & insurance (6.8%)
- Computer & electronic products (5.3%)
- Accommodation & food services (5.2%)
- Administrative & support & waste management services (4.0%)
- Educational services (4.0%)
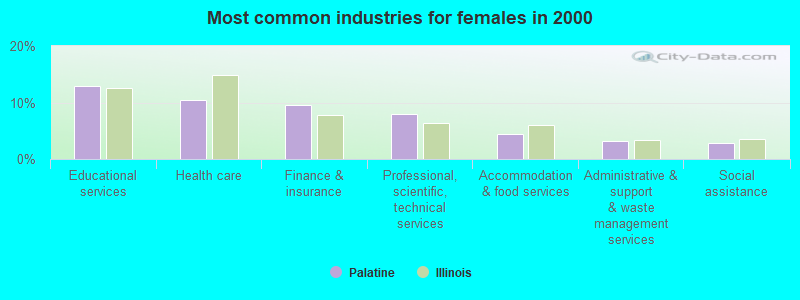
- Educational services (13.0%)
- Health care (10.4%)
- Finance & insurance (9.5%)
- Professional, scientific, technical services (8.0%)
- Accommodation & food services (4.5%)
- Administrative & support & waste management services (3.2%)
- Social assistance (2.8%)
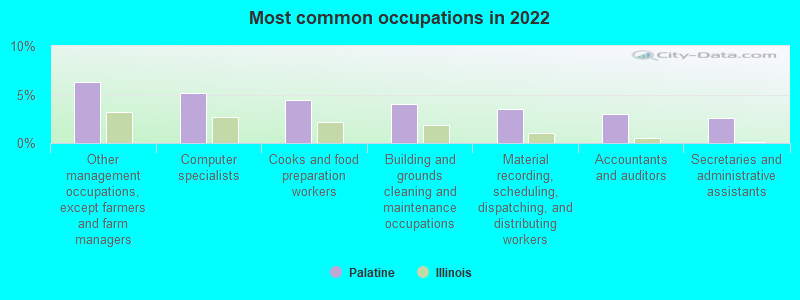
- Other management occupations, except farmers and farm managers (6.3%)
- Computer specialists (5.1%)
- Cooks and food preparation workers (4.4%)
- Building and grounds cleaning and maintenance occupations (4.0%)
- Material recording, scheduling, dispatching, and distributing workers (3.5%)
- Accountants and auditors (3.0%)
- Secretaries and administrative assistants (2.6%)
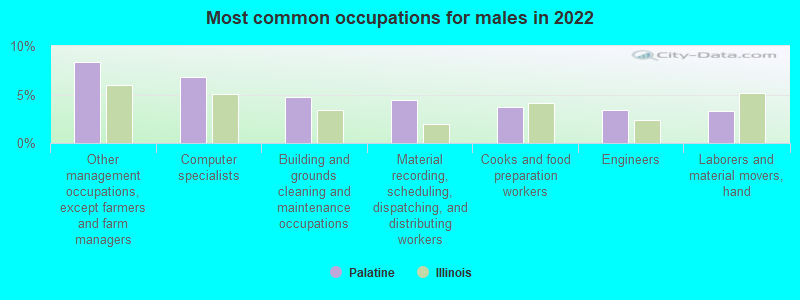
- Other management occupations, except farmers and farm managers (8.3%)
- Computer specialists (6.8%)
- Building and grounds cleaning and maintenance occupations (4.8%)
- Material recording, scheduling, dispatching, and distributing workers (4.4%)
- Cooks and food preparation workers (3.7%)
- Engineers (3.4%)
- Laborers and material movers, hand (3.3%)
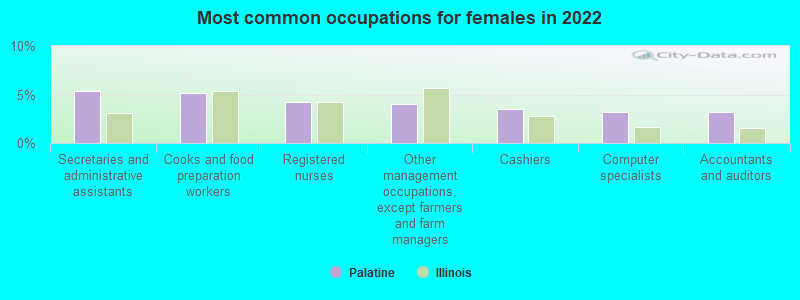
- Secretaries and administrative assistants (5.4%)
- Cooks and food preparation workers (5.2%)
- Registered nurses (4.2%)
- Other management occupations, except farmers and farm managers (4.1%)
- Cashiers (3.5%)
- Computer specialists (3.2%)
- Accountants and auditors (3.2%)
Average climate in Palatine, Illinois
Based on data reported by over 4,000 weather stations


|
|


(lower is better)
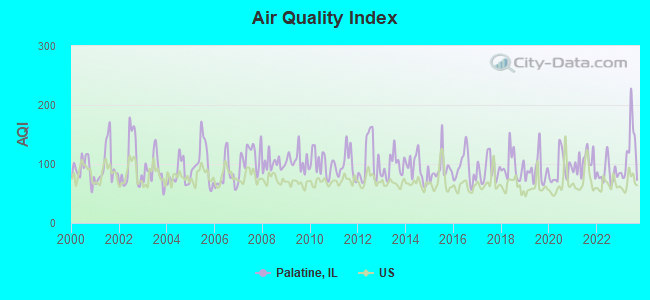
Air Quality Index (AQI) level in 2023 was 121. This is significantly worse than average.
| City: | 121 |
| U.S.: | 73 |
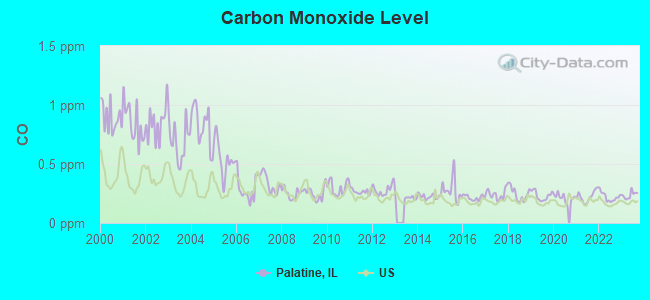
Carbon Monoxide (CO) [ppm] level in 2023 was 0.237. This is about average. Closest monitor was 11.7 miles away from the city center.
| City: | 0.237 |
| U.S.: | 0.251 |
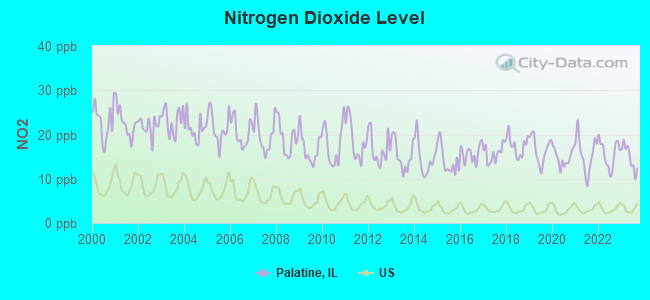
Nitrogen Dioxide (NO2) [ppb] level in 2023 was 14.8. This is significantly worse than average. Closest monitor was 9.1 miles away from the city center.
| City: | 14.8 |
| U.S.: | 5.1 |
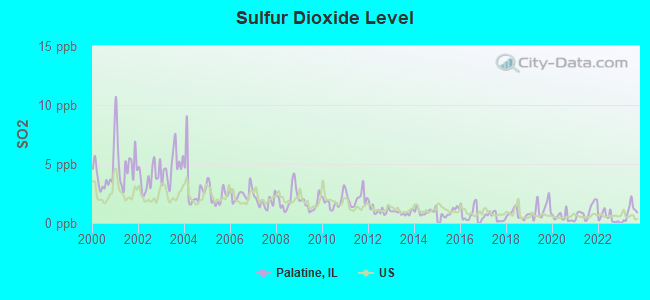
Sulfur Dioxide (SO2) [ppb] level in 2023 was 0.912. This is significantly better than average. Closest monitor was 9.1 miles away from the city center.
| City: | 0.912 |
| U.S.: | 1.515 |
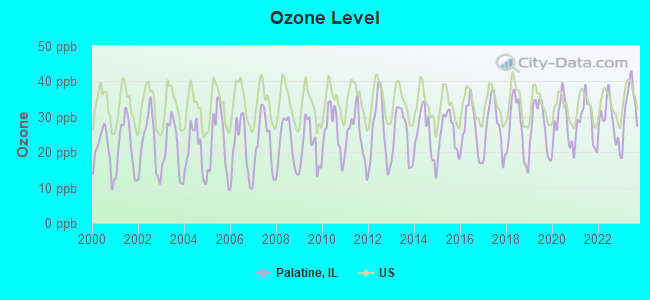
Ozone [ppb] level in 2023 was 33.0. This is about average. Closest monitor was 3.9 miles away from the city center.
| City: | 33.0 |
| U.S.: | 33.3 |
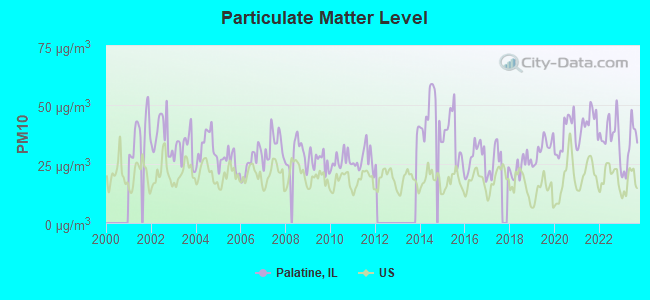
Particulate Matter (PM10) [µg/m3] level in 2023 was 31.4. This is significantly worse than average. Closest monitor was 5.6 miles away from the city center.
| City: | 31.4 |
| U.S.: | 19.2 |
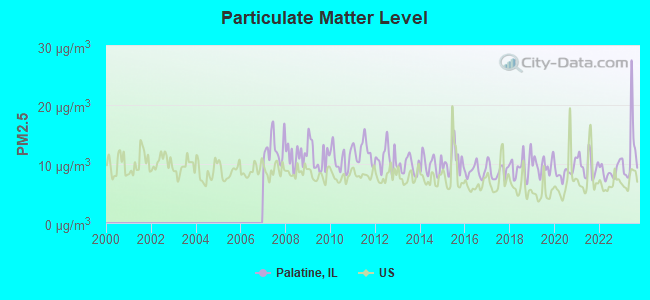
Particulate Matter (PM2.5) [µg/m3] level in 2023 was 11.9. This is significantly worse than average. Closest monitor was 9.3 miles away from the city center.
| City: | 11.9 |
| U.S.: | 8.1 |
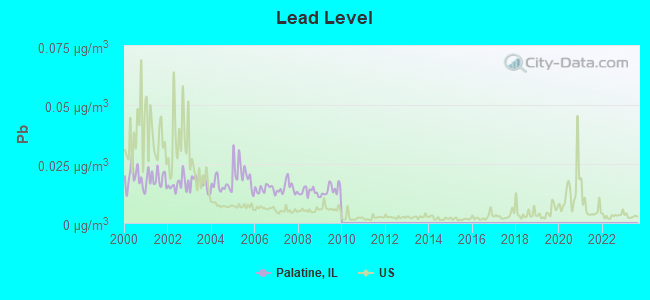
Lead (Pb) [µg/m3] level in 2009 was 0.0139. This is significantly worse than average. Closest monitor was 3.7 miles away from the city center.
| City: | 0.0139 |
| U.S.: | 0.0093 |
Tornado activity:
Palatine-area historical tornado activity is slightly below Illinois state average. It is 38% greater than the overall U.S. average.
On 4/21/1967, a category F4 (max. wind speeds 207-260 mph) tornado 7.8 miles away from the Palatine village center killed one person and injured 100 people and caused between $500,000 and $5,000,000 in damages.
On 4/11/1965, a category F4 tornado 13.4 miles away from the village center killed 6 people and injured 75 people.
Earthquake activity:
Palatine-area historical earthquake activity is significantly above Illinois state average. It is 37% greater than the overall U.S. average.On 4/18/2008 at 09:36:59, a magnitude 5.4 (5.1 MB, 4.8 MS, 5.4 MW, 5.2 MW, Class: Moderate, Intensity: VI - VII) earthquake occurred 253.6 miles away from Palatine center
On 6/10/1987 at 23:48:54, a magnitude 5.1 (4.9 MB, 4.4 MS, 4.6 MS, 5.1 LG) earthquake occurred 228.1 miles away from Palatine center
On 4/18/2008 at 09:36:59, a magnitude 5.2 (5.2 MW, Depth: 8.9 mi) earthquake occurred 253.7 miles away from the city center
On 6/28/2004 at 06:10:52, a magnitude 4.2 (4.2 MW, Depth: 6.2 mi, Class: Light, Intensity: IV - V) earthquake occurred 63.5 miles away from the city center
On 2/10/2010 at 09:59:35, a magnitude 3.8 (3.8 MW, Depth: 6.2 mi, Class: Light, Intensity: II - III) earthquake occurred 25.6 miles away from Palatine center
On 5/2/2015 at 16:23:07, a magnitude 4.2 (4.2 MW, Depth: 2.8 mi) earthquake occurred 134.1 miles away from Palatine center
Magnitude types: regional Lg-wave magnitude (LG), body-wave magnitude (MB), surface-wave magnitude (MS), moment magnitude (MW)
Natural disasters:
The number of natural disasters in Cook County (20) is greater than the US average (15).Major Disasters (Presidential) Declared: 15
Emergencies Declared: 4
Causes of natural disasters: Floods: 13, Storms: 12, Tornadoes: 3, Snowstorms: 2, Winter Storms: 2, Blizzard: 1, Hurricane: 1, Snow: 1, Wind: 1, Other: 1 (Note: some incidents may be assigned to more than one category).

Main business address for: ACURA PHARMACEUTICALS, INC (PHARMACEUTICAL PREPARATIONS).
Hospitals and medical centers in Palatine:
- PLUM GROVE NURSING AND REHAB CENTER (24 SOUTH PLUM GROVE ROAD)
- ST JOSEPH'S HOME F/T ELDERLY (80 WEST NORTHWEST HIGHWAY)
- FMC - PALATINE DIALYSIS CENTER (691 EAST DUNDEE ROAD)
- CALL HOME HEALTH CARE, INC (800 EAST NORTHWEST HIGHWAY, SUITE 625)
- HEALTHCARE PLUS CORPORATION (1246 WEST NORTHWEST HIGHWAY)
- HEARTLAND HOME HEALTH CARE AND HOSPICE (220 NORTH SMITH STREET, STE 420)
Heliports located in Palatine:
College/University in Palatine:
Other colleges/universities with over 2000 students near Palatine:
- American InterContinental University-Online (about 6 miles; Schaumburg, IL; Full-time enrollment: 16,158)
- Oakton Community College (about 10 miles; Des Plaines, IL; FT enrollment: 7,271)
- Chamberlain College of Nursing-Illinois (about 12 miles; Addison, IL; FT enrollment: 8,977)
- Universal Technical Institute of Illinois Inc (about 13 miles; Glendale Heights, IL; FT enrollment: 2,281)
- Computer Systems Institute (about 16 miles; Skokie, IL; FT enrollment: 2,311)
- Elmhurst College (about 16 miles; Elmhurst, IL; FT enrollment: 3,364)
- Elgin Community College (about 16 miles; Elgin, IL; FT enrollment: 8,173)
Public high schools in Palatine:
- WM FREMD HIGH SCHOOL (Students: 2,872, Location: 1000 S QUENTIN RD, Grades: 9-12)
- PALATINE HIGH SCHOOL (Students: 2,643, Location: 1111 N ROHLWING RD, Grades: 9-12)
- DISTRICT 211 ACADEMY - NORTH (Students: 41, Location: 335 E ILLINOIS AVE, Grades: 9-12)
- N COOK YOUNG ADULT ACDMY PALATINE (Location: 335 E ILLINOIS AVE # 200, Grades: 9-12)
Private high schools in Palatine:
Biggest public elementary/middle schools in Palatine:
- LAKE LOUISE ELEM SCHOOL (Students: 757, Location: 500 N JONATHAN DR, Grades: KG-6)
- VIRGINIA LAKE ELEM SCHOOL (Students: 757, Location: 925 N GLENN DR, Grades: PK-6)
- WALTER R SUNDLING JR HIGH SCH (Students: 746, Location: 1100 N SMITH ST, Grades: 7-8)
- STUART R PADDOCK SCHOOL (Students: 742, Location: 225 W WASHINGTON ST, Grades: KG-6)
- HUNTING RIDGE ELEM SCHOOL (Students: 737, Location: 1105 W ILLINOIS AVE, Grades: KG-6)
- WINSTON CAMPUS JR HIGH (Students: 720, Location: 120 N BABCOCK DR, Grades: 7-8)
- JANE ADDAMS ELEM SCHOOL (Students: 622, Location: 1020 E SAYLES DR, Grades: PK-6)
- PLEASANT HILL ELEM SCHOOL (Students: 580, Location: 434 W ILLINOIS AVE, Grades: KG-6)
- MARION JORDAN ELEM SCHOOL (Students: 573, Location: 100 N HARRISON AVE, Grades: KG-6)
- GRAY M SANBORN ELEM SCHOOL (Students: 551, Location: 101 N OAK ST, Grades: KG-6)
Private elementary/middle schools in Palatine:
- ST THERESA ELEMENTARY SCHOOL (Students: 440, Location: 445 N BENTON ST, Grades: PK-8)
- IMMANUEL LUTHERAN SCHOOL (Students: 415, Location: 200 N PLUM GROVE RD, Grades: PK-8)
- QUEST ACADEMY (Students: 282, Location: 500 N BENTON ST, Grades: PK-8)
- ST THOMAS OF VILLANOVA SCHOOL (Students: 182, Location: 1141 E ANDERSON DR, Grades: PK-8)
- KINDERCARE LEARNING CTR (Students: 111, Location: 929 E PALATINE RD, Grades: PK-5)
Library in Palatine:
- PALATINE PUBLIC LIBRARY DISTRICT (Operating income: $5,544,411; Location: 700 NORTH NORTH COURT; 334,957 books; 3,046 e-books; 21,960 audio materials; 29,664 video materials; 50 local licensed databases; 20 state licensed databases; 1 other licensed databases; 658 print serial subscriptions; 24 electronic serial subscriptions)
User-submitted facts and corrections:
- Add to churchs: Countryside Church Unitarian Universlaist, 1025 N. Smith Rd. Palatine Il 60067
- You could add Roosevelt University, located in Schaumburg, IL, to the list of nearby colleges serving over 2,000 students. 1400 N. Roosevelt Blvd. Across from Ikea store.
Points of interest:
Notable locations in Palatine: Palatine Hills Golf Course (A), Twin Lakes Golf Course (B), Palatine Public Library (C), Saint Joseph Home for the Elderly (D), Palatine Fire Department Station 85 (E), Palatine Fire Department Station 82 (F), Palatine Fire Department Station 83 (G), Palatine Fire Department Station 81 (H), Palatine Fire Department Station 84 (I). Display/hide their locations on the map
Shopping Centers: Palatine Mall Shopping Center (1), Palatine Plaza Shopping Center (2), Park Place Shopping Center (3), Village Oasis Shopping Center (4), Eurofresh Plaza Shopping Center (5), Deer Grove Crossing Shopping Center (6), Regency Plaza Shopping Center (7), Northwest Shopping Center (8), Countryside Plaza Shopping Center (9). Display/hide their locations on the map
Main business address in Palatine: ACURA PHARMACEUTICALS, INC (A). Display/hide its location on the map
Churches in Palatine include: Church of Christ (A), Gurudawara Sikh Religious Society (B), All Saints Lutheran Church (C), Christ the King Lutheran Church (D), Immanuel Lutheran Church (E), Saint Thomas of Villanova Church (F), Christ Lutheran Church (G), Evangelical Community Church (H), First Church of Christ (I). Display/hide their locations on the map
Cemeteries: German Cemetery (1), Immanuel Lutheran Cemetery (2), Hillside Cemetery (3), Sutherland Cemetery (4). Display/hide their locations on the map
Lakes and reservoirs: Lake Irene (A), Doughnut Lake (B), Peregrine Lake (C), Virginia Lake (D). Display/hide their locations on the map
Parks in Palatine include: Eagle Park (1), Birchwood Park (2), Ashwood Park (3), Cherrywood Park (4), Hawthorne Park (5), Heron Park (6), Lindberg Park (7), Locust Park (8), Mallard Park (9). Display/hide their locations on the map
Tourist attractions: Brunswick (Amusement & Theme Parks; 1296 East Dundee Road), Cue-N-Cushion Billiard Sales (Amusement & Theme Parks; 1296 East Dundee Road), Dynorex (Amusement & Theme Parks; 1227 North Rand Road).
Hotels: Comfort Inn (1200 North Frontage Road), Doubletree Club Hotel (920 East Northwest Highway), Comfort Inn Palatine (1200 North Frontage Road), Haven Motel (600 East Northwest Highway), Belaire Motel (536 East Northwest Highway), Furlongs (920 East Northwest Highway), Four Seasons Cleaning Services Inc (909 East Coach Road).
Courts: Circuit Court of Cook County (200 East Wood Street), Metropolitan At Wellington Court (55 North Smith Street).
Birthplace of: Christina Moore - Comedian, Doug Warren - Major League Soccer player (New England, born: Mar 18, 1981), Grant Surprenant - College basketball player (St. Francis (PA) Red Flash), Len Rohde - Football player, Stanley M. Hough - Horse trainer.
Drinking water stations with addresses in Palatine and their reported violations in the past:
ST MARY COPTIC CHURCH (Population served: 200, Groundwater):Past monitoring violations:THE PALATINE WHITEHOUSE (Population served: 100, Groundwater):
- One routine major monitoring violation
Past monitoring violations:SHALOM MEMORIAL PARK (Population served: 50, Groundwater):
- One routine major monitoring violation
Past monitoring violations:
- One routine major monitoring violation
Drinking water stations with addresses in Palatine that have no violations reported:
- JOHNS PUB (Population served: 36, Primary Water Source Type: Groundwater)
| This village: | 2.5 people |
| Illinois: | 2.6 people |
| This village: | 65.7% |
| Whole state: | 65.8% |
| This village: | 5.7% |
| Whole state: | 6.3% |
Likely homosexual households (counted as self-reported same-sex unmarried-partner households)
- Lesbian couples: 0.3% of all households
- Gay men: 0.2% of all households
People in group quarters in Palatine in 2010:
- 134 people in nursing facilities/skilled-nursing facilities
- 20 people in group homes intended for adults
- 8 people in emergency and transitional shelters (with sleeping facilities) for people experiencing homelessness
- 6 people in other noninstitutional facilities
People in group quarters in Palatine in 2000:
- 144 people in nursing homes
- 47 people in other noninstitutional group quarters
- 18 people in homes for the mentally retarded
- 8 people in other nonhousehold living situations
Banks with most branches in Palatine (2011 data):
- JPMorgan Chase Bank, National Association: Palatine Dominicks, Northwest Hwy And Smith St Branch, Palatine South-Quentin & Euclid Bkg., Northwest Shopping Ctr Branch, Palatine Branch. Info updated 2011/11/10: Bank assets: $1,811,678.0 mil, Deposits: $1,190,738.0 mil, headquarters in Columbus, OH, positive income, International Specialization, 5577 total offices, Holding Company: Jpmorgan Chase & Co.
- BMO Harris Bank National Association: Harris Bk Palatine Na Branch, Rand And Winslowe Branch, West Northwest Highway Branch, Northwest Highway Facility. Info updated 2011/07/14: Bank assets: $97,264.0 mil, Deposits: $75,624.6 mil, headquarters in Chicago, IL, positive income, 717 total offices, Holding Company: Bank Of Montreal
- TCF National Bank: Palatine Branch #7500 at 1589 North Rand Road, branch established on 1993/11/08; East Dundee/Palatine Jewel Br #2267 at 423 East Dundee, branch established on 1998/01/30. Info updated 2009/11/23: Bank assets: $19,007.0 mil, Deposits: $12,377.0 mil, headquarters in Sioux Falls, SD, positive income, Commercial Lending Specialization, 441 total offices, Holding Company: Tcf Financial Corporation
- Fifth Third Bank: Palatine Banking Center at 1582 N. Rand Road, branch established on 2004/04/05. Info updated 2009/10/05: Bank assets: $114,540.4 mil, Deposits: $89,689.1 mil, headquarters in Cincinnati, OH, positive income, Commercial Lending Specialization, 1378 total offices, Holding Company: Fifth Third Bancorp
- Citibank, National Association: Palatine Branch at 333 East Northwest Highway, branch established on 1953/03/09. Info updated 2012/01/10: Bank assets: $1,288,658.0 mil, Deposits: $882,541.0 mil, headquarters in Sioux Falls, SD, positive income, International Specialization, 1048 total offices, Holding Company: Citigroup Inc.
- American Chartered Bank: Palatine Branch at 700 West Euclid Avenue, branch established on 1992/01/31. Info updated 2006/11/03: Bank assets: $2,326.5 mil, Deposits: $2,068.1 mil, headquarters in Schaumburg, IL, negative income in the last year, Commercial Lending Specialization, 15 total offices, Holding Company: American Chartered Bancorp, Inc.
- Barrington Bank & Trust Company, National Association: Palatine Branch at 110 W Palatine Rd, branch established on 2005/03/03. Info updated 2012/02/13: Bank assets: $1,283.1 mil, Deposits: $924.2 mil, headquarters in Barrington, IL, positive income, Commercial Lending Specialization, 8 total offices, Holding Company: Wintrust Financial Corporation
- First Bank and Trust Company of Illinois: First Bank And Trust Company Of Illi at 300 East Northwest Highway, branch established on 1962/12/20. Info updated 2006/11/03: Bank assets: $337.8 mil, Deposits: $304.5 mil, local headquarters, negative income in the last year, Commercial Lending Specialization, 1 total offices, Holding Company: Northwest Bancorporation Of Illinois, Inc.
- RBS Citizens, National Association: Palatine/ Walmart Branch at 1555 N Rand St, branch established on 2004/08/25. Info updated 2007/09/19: Bank assets: $106,940.6 mil, Deposits: $75,690.2 mil, headquarters in Providence, RI, positive income, 1135 total offices, Holding Company: Uk Financial Investments Limited
- 6 other banks with 6 local branches
For population 15 years and over in Palatine:
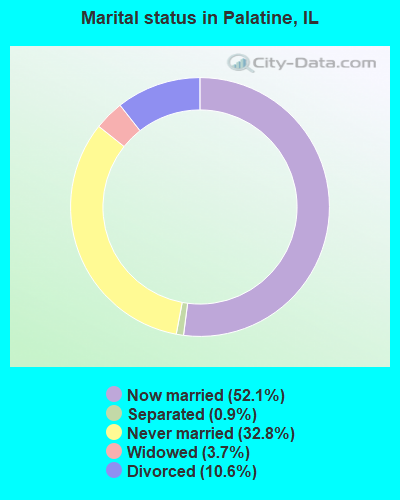
- Never married: 32.8%
- Now married: 52.1%
- Separated: 0.9%
- Widowed: 3.7%
- Divorced: 10.6%
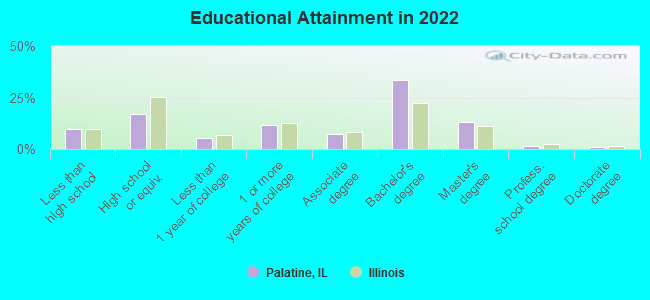
For population 25 years and over in Palatine:
- High school or higher: 90.1%
- Bachelor's degree or higher: 48.9%
- Graduate or professional degree: 15.3%
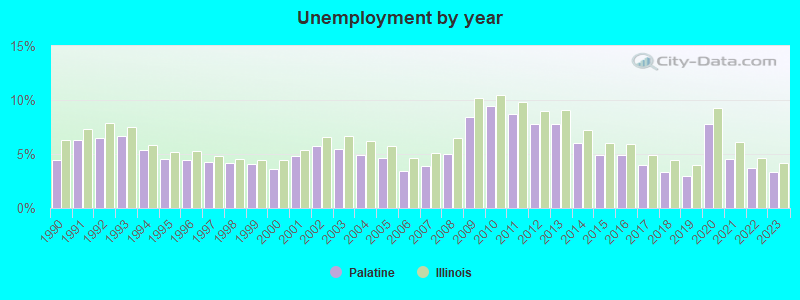
- Unemployed: 3.6%
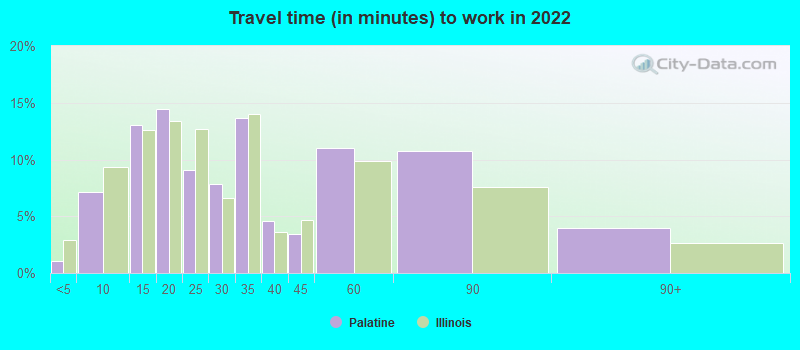
- Mean travel time to work (commute): 22.7 minutes
| Here: | 13.1 |
| Illinois average: | 12.5 |


Graphs represent county-level data. Detailed 2008 Election Results
Neighborhoods in Palatine:
(Palatine, Illinois Neighborhood Map)Religion statistics for Palatine, IL (based on Cook County data)


| Religion | Adherents | Congregations |
|---|---|---|
| Catholic | 1,947,223 | 376 |
| Evangelical Protestant | 432,975 | 1,484 |
| Other | 312,636 | 403 |
| Mainline Protestant | 202,114 | 630 |
| Black Protestant | 148,895 | 395 |
| Orthodox | 53,276 | 66 |
| None | 2,097,556 | - |
Food Environment Statistics:
| This county: | 2.77 / 10,000 pop. |
| Illinois: | 2.24 / 10,000 pop. |
| Cook County: | 0.04 / 10,000 pop. |
| Illinois: | 0.08 / 10,000 pop. |
| Cook County: | 0.93 / 10,000 pop. |
| Illinois: | 0.75 / 10,000 pop. |
| Cook County: | 1.53 / 10,000 pop. |
| Illinois: | 2.61 / 10,000 pop. |
| Cook County: | 6.67 / 10,000 pop. |
| State: | 6.86 / 10,000 pop. |
| This county: | 8.4% |
| Illinois: | 8.3% |
| Here: | 23.5% |
| State: | 25.2% |
| Here: | 16.3% |
| State: | 14.5% |
Health and Nutrition:
| Palatine: | 48.9% |
| Illinois: | 49.5% |
| Palatine: | 46.5% |
| Illinois: | 47.2% |
| Here: | 28.2 |
| Illinois: | 28.6 |
| Palatine: | 20.6% |
| Illinois: | 20.5% |
| Palatine: | 10.2% |
| Illinois: | 10.8% |
| This city: | 6.8 |
| State: | 6.8 |
| Palatine: | 32.2% |
| Illinois: | 33.4% |
| This city: | 56.8% |
| Illinois: | 56.4% |
| Palatine: | 80.1% |
| Illinois: | 79.9% |
More about Health and Nutrition of Palatine, IL Residents
| Local government employment and payroll (March 2022) | |||||
| Function | Full-time employees | Monthly full-time payroll | Average yearly full-time wage | Part-time employees | Monthly part-time payroll |
|---|---|---|---|---|---|
| Police Protection - Officers | 106 | $1,008,202 | $114,136 | 1 | $2,137 |
| Firefighters | 89 | $915,118 | $123,387 | 3 | $3,339 |
| Other and Unallocable | 32 | $273,092 | $102,410 | 0 | $0 |
| Police - Other | 21 | $167,854 | $95,917 | 10 | $16,286 |
| Other Government Administration | 18 | $106,210 | $70,807 | 4 | $11,381 |
| Financial Administration | 15 | $118,976 | $95,181 | 3 | $2,840 |
| Streets and Highways | 12 | $90,480 | $90,480 | 0 | $0 |
| Natural Resources | 8 | $55,532 | $83,298 | 0 | $0 |
| Water Supply | 8 | $60,807 | $91,211 | 0 | $0 |
| Fire - Other | 5 | $64,885 | $155,724 | 0 | $0 |
| Health | 4 | $26,516 | $79,548 | 0 | $0 |
| Sewerage | 4 | $27,944 | $83,832 | 0 | $0 |
| Judicial and Legal | 1 | $4,077 | $48,924 | 0 | $0 |
| Totals for Government | 323 | $2,919,693 | $108,472 | 21 | $35,983 |
Palatine government finances - Expenditure in 2021 (per resident):
- Current Operations - Police Protection: $23,805,000 ($363.52)
Local Fire Protection: $20,639,000 ($315.17)
Water Utilities: $7,654,000 ($116.88)
Regular Highways: $6,220,000 ($94.98)
Solid Waste Management: $4,269,000 ($65.19)
Housing and Community Development: $4,183,000 ($63.88)
Financial Administration: $2,695,000 ($41.15)
Protective Inspection and Regulation - Other: $2,457,000 ($37.52)
Central Staff Services: $2,220,000 ($33.90)
Sewerage: $2,042,000 ($31.18)
Parking Facilities: $572,000 ($8.73)
General - Other: $259,000 ($3.96)
- General - Interest on Debt: $7,823,000 ($119.46)
- Other Capital Outlay - Regular Highways: $6,559,000 ($100.16)
Sewerage: $1,988,000 ($30.36)
Central Staff Services: $1,620,000 ($24.74)
Local Fire Protection: $754,000 ($11.51)
Police Protection: $411,000 ($6.28)
Water Utilities: $226,000 ($3.45)
- Total Salaries and Wages: $34,351,000 ($524.56)
Palatine government finances - Revenue in 2021 (per resident):
- Charges - Sewerage: $4,574,000 ($69.85)
Solid Waste Management: $4,379,000 ($66.87)
Other: $4,127,000 ($63.02)
Parking Facilities: $273,000 ($4.17)
- Federal Intergovernmental - Other: $529,000 ($8.08)
Housing and Community Development: $446,000 ($6.81)
Highways: $52,000 ($0.79)
- Local Intergovernmental - Other: $5,014,000 ($76.57)
- Miscellaneous - General Revenue - Other: $1,815,000 ($27.72)
Fines and Forfeits: $1,202,000 ($18.36)
Interest Earnings: $679,000 ($10.37)
- Revenue - Water Utilities: $11,395,000 ($174.01)
- State Intergovernmental - General Local Government Support: $18,906,000 ($288.71)
Highways: $2,793,000 ($42.65)
Other: $104,000 ($1.59)
- Tax - Property: $35,483,000 ($541.85)
General Sales and Gross Receipts: $4,105,000 ($62.69)
Public Utilities Sales: $3,154,000 ($48.16)
Other License: $3,149,000 ($48.09)
Other Selective Sales: $1,235,000 ($18.86)
Palatine government finances - Debt in 2021 (per resident):
- Long Term Debt - Beginning Outstanding - Unspecified Public Purpose: $195,578,000 ($2986.61)
Outstanding Unspecified Public Purpose: $169,363,000 ($2586.29)
Retired Unspecified Public Purpose: $83,522,000 ($1275.44)
Issue, Unspecified Public Purpose: $57,307,000 ($875.12)
Palatine government finances - Cash and Securities in 2021 (per resident):
- Other Funds - Cash and Securities: $76,896,000 ($1174.25)
3.53% of this county's 2021 resident taxpayers lived in other counties in 2020 ($82,405 average adjusted gross income)
| Here: | 3.53% |
| Illinois average: | 5.09% |
0.01% of residents moved from foreign countries ($114 average AGI)
Cook County: 0.01% Illinois average: 0.01%
Top counties from which taxpayers relocated into this county between 2020 and 2021:
| from DuPage County, IL | |
| from Lake County, IL | |
| from Will County, IL |
5.44% of this county's 2020 resident taxpayers moved to other counties in 2021 ($120,340 average adjusted gross income)
| Here: | 5.44% |
| Illinois average: | 6.10% |
0.01% of residents moved to foreign countries ($140 average AGI)
Cook County: 0.01% Illinois average: 0.01%
Top counties to which taxpayers relocated from this county between 2020 and 2021:
| to DuPage County, IL | |
| to Will County, IL | |
| to Lake County, IL |
| Businesses in Palatine, IL | ||||
| Name | Count | Name | Count | |
|---|---|---|---|---|
| 7-Eleven | 3 | Little Caesars Pizza | 1 | |
| Ace Hardware | 1 | MasterBrand Cabinets | 7 | |
| Advance Auto Parts | 1 | McDonald's | 3 | |
| Applebee's | 1 | Motel 6 | 1 | |
| Arby's | 1 | New Balance | 1 | |
| AutoZone | 1 | Nike | 6 | |
| Bakers Square | 1 | OfficeMax | 1 | |
| Baskin-Robbins | 1 | Panda Express | 1 | |
| Ben & Jerry's | 1 | Papa John's Pizza | 1 | |
| Blockbuster | 1 | Payless | 1 | |
| Burger King | 2 | Penske | 1 | |
| CVS | 1 | Popeyes | 1 | |
| Caribou Coffee | 1 | RadioShack | 1 | |
| Chevrolet | 1 | SONIC Drive-In | 1 | |
| Comfort Inn | 1 | Safeway | 2 | |
| Cricket Wireless | 1 | Sprint Nextel | 1 | |
| Dairy Queen | 1 | Staples | 1 | |
| Dennys | 1 | Starbucks | 2 | |
| Discount Tire | 1 | T-Mobile | 4 | |
| Domino's Pizza | 1 | T.J.Maxx | 1 | |
| DressBarn | 1 | Taco Bell | 2 | |
| Dressbarn | 1 | Target | 1 | |
| Dunkin Donuts | 1 | Toyota | 1 | |
| Famous Footwear | 1 | Toys"R"Us | 1 | |
| FedEx | 12 | True Value | 1 | |
| GNC | 1 | U-Haul | 2 | |
| GameStop | 1 | U.S. Cellular | 1 | |
| H&R Block | 2 | UPS | 17 | |
| Hobby Lobby | 1 | Verizon Wireless | 1 | |
| Holiday Inn | 2 | Vons | 2 | |
| Home Depot | 1 | Walmart | 1 | |
| Hyundai | 1 | Wendy's | 3 | |
| Jewel-Osco | 2 | White Castle | 1 | |
| Jimmy John's | 2 | Whole Foods Market | 1 | |
| Justice | 1 | World Gym | 1 | |
| KFC | 1 | YMCA | 1 | |
Strongest AM radio stations in Palatine:
- WGN (720 AM; 50 kW; CHICAGO, IL; Owner: WGN CONTINENTAL BROADCASTING CO.)
- WBBM (780 AM; 50 kW; CHICAGO, IL; Owner: INFINITY BROADCASTING OPERATIONS, INC.)
- WSCR (670 AM; 50 kW; CHICAGO, IL; Owner: INFINITY BROADCASTING OPERATIONS, INC.)
- WMVP (1000 AM; 50 kW; CHICAGO, IL; Owner: ABC, INC.)
- WKTA (1330 AM; 5 kW; EVANSTON, IL; Owner: POLNET COMMUNICATIONS, LTD.)
- WTMJ (620 AM; 50 kW; MILWAUKEE, WI; Owner: JOURNAL BROADCAST CORPORATION)
- WLS (890 AM; 50 kW; CHICAGO, IL; Owner: WLS, INC.)
- WYLL (1160 AM; 50 kW; CHICAGO, IL; Owner: SCA LICENSE CORPORATION)
- WMBI (1110 AM; daytime; 5 kW; CHICAGO, IL; Owner: THE MOODY BIBLE INSTITUTE OF CHICAGO)
- WISN (1130 AM; 50 kW; MILWAUKEE, WI; Owner: CAPSTAR TX LIMITED PARTNERSHIP)
- WEEF (1430 AM; 1 kW; HIGHLAND PARK, IL; Owner: POLNET COMMUNICATIONS, LTD)
- WCSN (820 AM; 5 kW; CHICAGO, IL; Owner: WYPA, INC.)
- WNVR (1030 AM; 5 kW; VERNON HILLS, IL; Owner: POLNET COMMUNICATIONS, LTD.)
Strongest FM radio stations in Palatine:
- WVIV-FM (103.1 FM; HIGHLAND PARK, IL; Owner: HBC LICENSE CORPORATION)
- WZFS (106.7 FM; DES PLAINES, IL; Owner: SALEM MEDIA OF ILLINOIS, LLC)
- WKIE (92.7 FM; ARLINGTON HEIGHTS, IL; Owner: SPANISH BROADCASTING SYSTEM OF ILLINOIS, INC.)
- WCKG (105.9 FM; ELMWOOD PARK, IL; Owner: INFINITY HOLDINGS CORPORATION OF ORLANDO)
- WLIT-FM (93.9 FM; CHICAGO, IL; Owner: AMFM RADIO LICENSES, L.L.C.)
- WJMK (104.3 FM; CHICAGO, IL; Owner: INFINITY BROADCASTING CORP. OF ILLINOIS)
- WNUA (95.5 FM; CHICAGO, IL; Owner: AMFM RADIO LICENSES, L.L.C.)
- WGCI-FM (107.5 FM; CHICAGO, IL; Owner: AMFM RADIO LICENSES, L.L.C.)
- WTMX (101.9 FM; SKOKIE, IL; Owner: BONNEVILLE HOLDING COMPANY)
- WBBM-FM (96.3 FM; CHICAGO, IL; Owner: INFINITY BROADCASTING OPERATIONS, INC.)
- WKSC-FM (103.5 FM; CHICAGO, IL; Owner: AMFM RADIO LICENSES, L.L.C.)
- WFMT (98.7 FM; CHICAGO, IL; Owner: WINDOW TO THE WORLD COMMUNICATIONS)
- WZZN (94.7 FM; CHICAGO, IL; Owner: ABC CHICAGO FM RADIO,INC.)
- WHCM (88.3 FM; PALATINE, IL; Owner: WILLIAM RAINEY HARPER COLLEGE)
- WBEZ (91.5 FM; CHICAGO, IL; Owner: THE WBEZ ALLIANCE, INC.)
- WKQX (101.1 FM; CHICAGO, IL; Owner: EMMIS RADIO LICENSE CORPORATION)
- WLUP-FM (97.9 FM; CHICAGO, IL; Owner: BONNEVILLE HOLDING COMPANY)
- WNND (100.3 FM; CHICAGO, IL; Owner: BONNEVILLE HOLDING COMPANY)
- WOJO (105.1 FM; EVANSTON, IL; Owner: TICHENOR LICENSE CORPORATION ("TLC"))
- WUSN (99.5 FM; CHICAGO, IL; Owner: INFINITY BROADCASTING CORPORATION OF CHICAGO)
TV broadcast stations around Palatine:
- W34CK (Channel 34; ARLINGTON HEIGHTS, IL; Owner: FIRST UNITED, INC.)
- WLS-TV (Channel 7; CHICAGO, IL; Owner: WLS TELEVISION, INC.)
- WMAQ-TV (Channel 5; CHICAGO, IL; Owner: NBC SUBSIDIARY (WMAQ-TV), INC.)
- W64CQ (Channel 64; ARLINGTON HEIGHTS, IL; Owner: TRINITY BROADCASTING NETWORK)
- WTTW (Channel 11; CHICAGO, IL; Owner: WINDOW TO THE WORLD COMMUNICATIONS, INC.)
- WGBO-TV (Channel 66; JOLIET, IL; Owner: WGBO LICENSE PARTNERSHIP, G.P.)
- WGN-TV (Channel 9; CHICAGO, IL; Owner: WGN CONTINENTAL BROADCASTING COMPANY)
- WBBM-TV (Channel 2; CHICAGO, IL; Owner: CBS BROADCASTING INC.)
- WPWR-TV (Channel 50; GARY, IN; Owner: FOX TELEVISION STATIONS, INC.)
- WXFT (Channel 60; AURORA, IL; Owner: TELEFUTURA CHICAGO LLC)
- WCIU-TV (Channel 26; CHICAGO, IL; Owner: WCIU-TV LIMITED PARTNERSHIP)
- WCPX (Channel 38; CHICAGO, IL; Owner: PAXSON CHICAGO LICENSE, INC.)
- WSNS-TV (Channel 44; CHICAGO, IL; Owner: TELEMUNDO OF CHICAGO, INC.)
- WFLD (Channel 32; CHICAGO, IL; Owner: FOX TELEVISION STATIONS, INC.)
- W68DO (Channel 68; PALATINE, IL; Owner: TRINITY BROADCASTING NETWORK)
- WFBT-CA (Channel 23; CHICAGO, IL; Owner: CHANNEL 23 LIMITED PARTNERSHIP)
- WJYS (Channel 62; HAMMOND, IN; Owner: JOVON BROADCASTING CORPORATION)
- WOCH-LP (Channel 28; CHICAGO, IL; Owner: KM LPTV OF CHICAGO-28, L.L.C.)
- WYCC (Channel 20; CHICAGO, IL; Owner: COLLEGE DIST. #508, COUNTY OF COOK)
- WOCK-CA (Channel 13; CHICAGO, IL; Owner: KM LPTV OF CHICAGO-13, L.L.C.)
- W57DN (Channel 57; ELGIN, IL; Owner: TRINITY BROADCASTING NETWORK)
- W24AJ (Channel 24; AURORA, IL; Owner: NELSON TV, INC.)
- National Bridge Inventory (NBI) Statistics
- 23Number of bridges
- 335ft / 102mTotal length
- $7,319,000Total costs
- 579,300Total average daily traffic
- 29,603Total average daily truck traffic
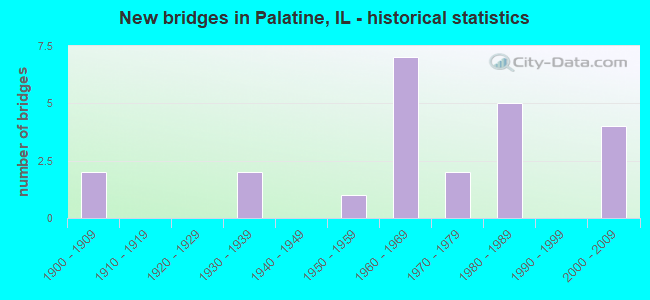
- New bridges - historical statistics
- 21900-1909
- 21930-1939
- 11950-1959
- 71960-1969
- 21970-1979
- 51980-1989
- 42000-2009
FCC Registered Private Land Mobile Towers: 3 (See the full list of FCC Registered Private Land Mobile Towers in Palatine, IL)
FCC Registered Broadcast Land Mobile Towers: 42 (See the full list of FCC Registered Broadcast Land Mobile Towers)
FCC Registered Microwave Towers: 39 (See the full list of FCC Registered Microwave Towers in this town)
FCC Registered Paging Towers: 2 (See the full list of FCC Registered Paging Towers)
FCC Registered Amateur Radio Licenses: 360 (See the full list of FCC Registered Amateur Radio Licenses in Palatine)
FAA Registered Aircraft: 34 (See the full list of FAA Registered Aircraft in Palatine)
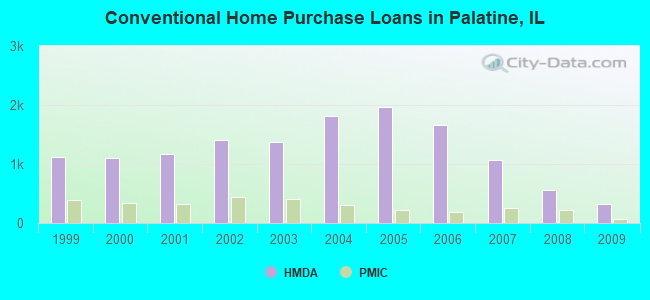
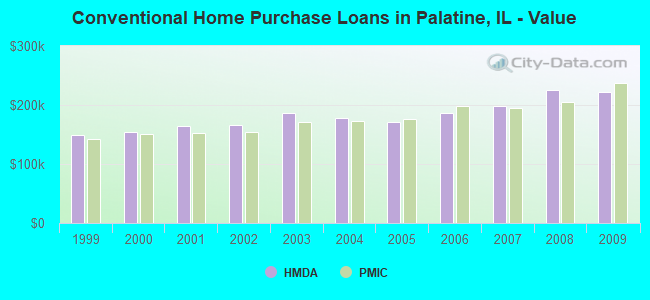
| Home Mortgage Disclosure Act Aggregated Statistics For Year 2009 (Based on 5 full and 7 partial tracts) | ||||||||||||||
| A) FHA, FSA/RHS & VA Home Purchase Loans | B) Conventional Home Purchase Loans | C) Refinancings | D) Home Improvement Loans | E) Loans on Dwellings For 5+ Families | F) Non-occupant Loans on < 5 Family Dwellings (A B C & D) | G) Loans On Manufactured Home Dwelling (A B C & D) | ||||||||
|---|---|---|---|---|---|---|---|---|---|---|---|---|---|---|
| Number | Average Value | Number | Average Value | Number | Average Value | Number | Average Value | Number | Average Value | Number | Average Value | Number | Average Value | |
| LOANS ORIGINATED | 186 | $204,257 | 324 | $221,808 | 2,045 | $234,400 | 45 | $144,340 | 9 | $351,033 | 71 | $141,718 | 6 | $212,332 |
| APPLICATIONS APPROVED, NOT ACCEPTED | 6 | $194,910 | 33 | $218,021 | 197 | $236,145 | 5 | $68,064 | 1 | $382,870 | 14 | $124,708 | 0 | $0 |
| APPLICATIONS DENIED | 34 | $162,941 | 54 | $163,156 | 473 | $229,129 | 25 | $72,749 | 5 | $943,376 | 30 | $137,127 | 0 | $0 |
| APPLICATIONS WITHDRAWN | 6 | $184,148 | 23 | $230,881 | 257 | $223,213 | 4 | $114,980 | 1 | $3,545,330 | 17 | $175,110 | 0 | $0 |
| FILES CLOSED FOR INCOMPLETENESS | 8 | $198,742 | 8 | $197,126 | 88 | $245,504 | 7 | $125,116 | 0 | $0 | 5 | $191,596 | 0 | $0 |
Detailed mortgage data for all 12 tracts in Palatine, IL
| Private Mortgage Insurance Companies Aggregated Statistics For Year 2009 (Based on 5 full and 7 partial tracts) | ||||||
| A) Conventional Home Purchase Loans | B) Refinancings | C) Non-occupant Loans on < 5 Family Dwellings (A & B) | ||||
|---|---|---|---|---|---|---|
| Number | Average Value | Number | Average Value | Number | Average Value | |
| LOANS ORIGINATED | 60 | $237,630 | 38 | $250,126 | 0 | $0 |
| APPLICATIONS APPROVED, NOT ACCEPTED | 28 | $216,128 | 24 | $263,608 | 1 | $232,900 |
| APPLICATIONS DENIED | 5 | $183,154 | 13 | $302,590 | 0 | $0 |
| APPLICATIONS WITHDRAWN | 13 | $245,848 | 6 | $209,305 | 1 | $117,170 |
| FILES CLOSED FOR INCOMPLETENESS | 3 | $220,803 | 3 | $250,000 | 2 | $193,205 |
2002 - 2018 National Fire Incident Reporting System (NFIRS) incidents
- Fire incident types reported to NFIRS in Palatine, IL
- 1,45548.7%Structure Fires
- 1,02434.3%Outside Fires
- 38412.9%Mobile Property/Vehicle Fires
- 1224.1%Other
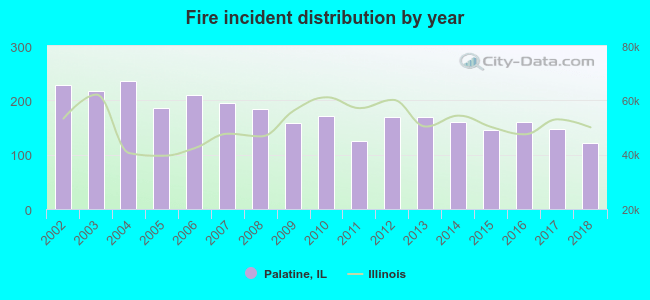 According to the data from the years 2002 - 2018 the average number of fire incidents per year is 176. The highest number of fires - 235 took place in 2004, and the least - 122 in 2018. The data has a decreasing trend.
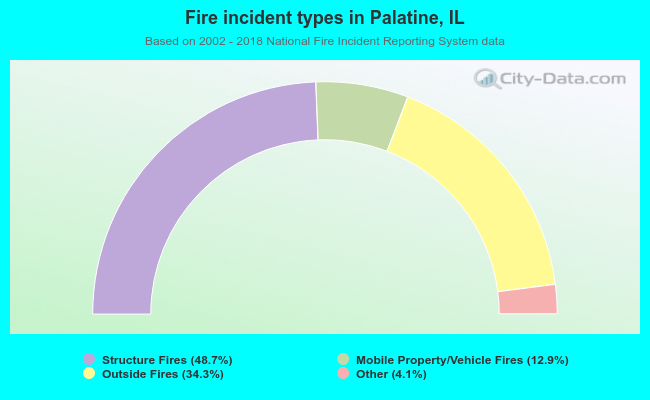 When looking into fire subcategories, the most reports belonged to: Structure Fires (48.7%), and Outside Fires (34.3%).
Fire-safe hotels and motels in Palatine, Illinois:
- Holiday Inn Express Palatine N Arlington HTS, 1550 E Dundee Rd, Palatine, Illinois 60074 , Phone: (847) 934-4900, Fax: (847) 934-6079
- Hotel Bollero, 920 E Northwest Hwy, Palatine, Illinois 60074 , Phone: (847) 359-6900, Fax: (847) 359-6991
| Most common first names in Palatine, IL among deceased individuals | ||
| Name | Count | Lived (average) |
|---|---|---|
| John | 338 | 76.6 years |
| Mary | 275 | 80.8 years |
| Robert | 224 | 71.8 years |
| William | 222 | 75.3 years |
| George | 157 | 76.1 years |
| James | 153 | 69.7 years |
| Joseph | 151 | 77.1 years |
| Helen | 150 | 82.6 years |
| Frank | 136 | 77.1 years |
| Margaret | 134 | 81.9 years |
| Most common last names in Palatine, IL among deceased individuals | ||
| Last name | Count | Lived (average) |
|---|---|---|
| Johnson | 64 | 76.0 years |
| Smith | 58 | 76.6 years |
| Anderson | 49 | 79.6 years |
| Miller | 39 | 76.3 years |
| Nelson | 24 | 80.1 years |
| Meyer | 23 | 73.6 years |
| Peterson | 22 | 76.4 years |
| Thompson | 20 | 80.7 years |
| Larson | 19 | 79.4 years |
| Hansen | 19 | 79.9 years |
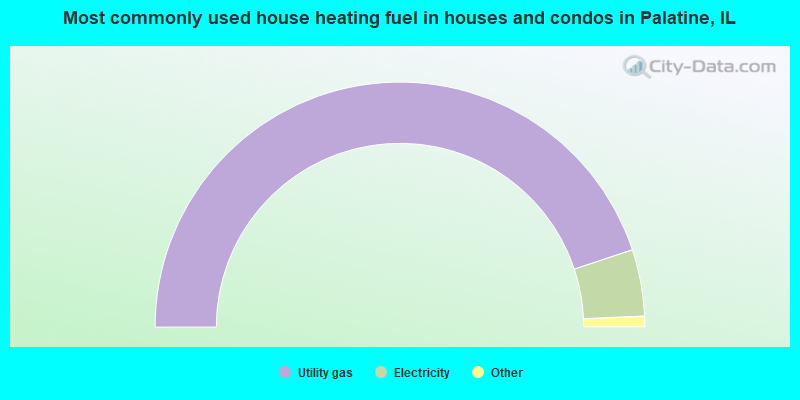
- 89.8%Utility gas
- 8.8%Electricity
- 0.8%Bottled, tank, or LP gas
- 0.3%Other fuel
- 0.2%No fuel used
- 0.1%Solar energy
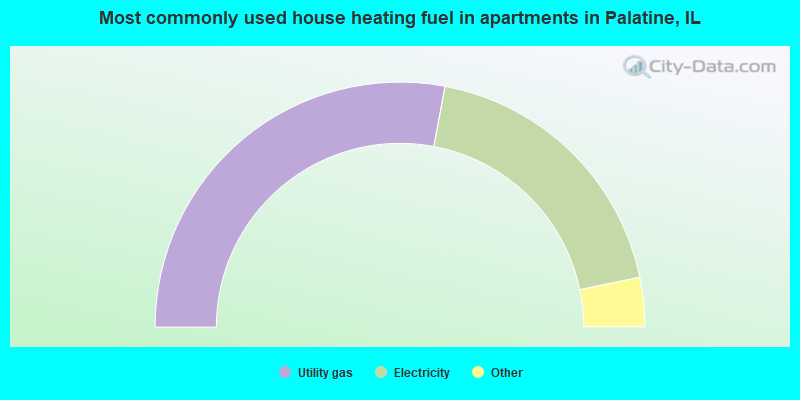
- 55.9%Utility gas
- 37.6%Electricity
- 3.4%No fuel used
- 2.4%Bottled, tank, or LP gas
- 0.7%Other fuel
Palatine compared to Illinois state average:
- Unemployed percentage significantly below state average.
- Black race population percentage significantly below state average.
- Foreign-born population percentage above state average.
- Length of stay since moving in below state average.
- Percentage of population with a bachelor's degree or higher above state average.
Palatine on our top lists:
- #1 on the list of "Top 101 cities with the lowest number of burglaries per 100,000 residents (population 50,000+)"
- #5 on the list of "Top 101 cities with largest percentage of males in industries: management of companies and enterprises (population 50,000+)"
- #5 on the list of "Top 101 cities with largest percentage of females in industries: management of companies and enterprises (population 50,000+)"
- #8 on the list of "Top 101 cities with the smallest city-data.com crime index per police officer (population 50,000+)"
- #9 on the list of "Top 101 cities with the largest city-data.com crime index decrease from 2002 to 2012 (population 50,000+)"
- #9 on the list of "Top 100 safest cities (lowest city-data.com crime index) (pop. 50,000+)"
- #12 on the list of "Top 101 cities with the lowest city-data.com crime index (population 50,000+)"
- #12 on the list of "Top 101 cities with the lowest number of assaults per 100,000 residents (population 50,000+)"
- #14 on the list of "Top 101 cities with the lowest number of auto thefts per 100,000 residents (population 50,000+)"
- #17 on the list of "Top 101 cities with the most people below the poverty level, excluding cities with 15% or more of residents in college and with the median age below 28 (population 50,000+)"
- #17 on the list of "Top 101 cities with the lowest number of robberies per 100,000 residents (population 50,000+)"
- #19 on the list of "Top 101 cities with largest percentage of males in industries: administrative and support and waste management services (population 50,000+)"
- #27 on the list of "Top 101 cities with largest percentage of females in industries: construction (population 50,000+)"
- #42 on the list of "Top 101 cities with the coldest winters (population 50,000+)"
- #44 on the list of "Top 101 cities with the lowest daily low temperatures (population 50,000+)"
- #46 on the list of "Top 101 cities with the most people below 50% of the poverty level, excluding cities with 15% or more of residents in college and with the median age below 28 (population 50,000+)"
- #52 on the list of "Top 101 cities with the largest temperature differences during a year (population 50,000+)"
- #53 on the list of "Top 101 cities with largest percentage population increases in the 1990s) (population 50,000+)"
- #53 on the list of "Top 101 cities with the most residents born in Other Eastern Asia (population 500+)"
- #61 on the list of "Top 101 cities with the smallest percentage of likely homosexual households (counted as self-reported same-sex unmarried-partner households) (population 50,000+)"
- #1 on the list of "Top 101 counties with the most Black Protestant congregations"
- #1 on the list of "Top 101 counties with the most Catholic congregations"
- #1 on the list of "Top 101 counties with the highest surface withdrawal of fresh water for public supply"
- #2 on the list of "Top 101 counties with the most Black Protestant adherents"
- #2 on the list of "Top 101 counties with the most Orthodox congregations (pop. 50,000+)"

|
|
Total of 2263 patent applications in 2008-2024.