Payson, Utah
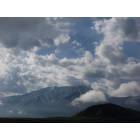
Payson: Payson City Mountain
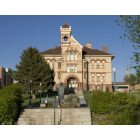
Payson: Peteetneet Academy
Payson: Future site of Payson Temple, 930 West
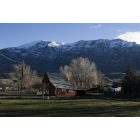
Payson: Winter scene in Payson
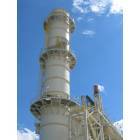
Payson: Nebo Power Station 80' Exhaust Stake - built 2004 - Payson Utah
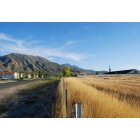
Payson: East Payson, Utah, looking WSW
- add
your
Submit your own pictures of this city and show them to the world
- OSM Map
- General Map
- Google Map
- MSN Map
Population change since 2000: +77.1%
| Males: 11,818 | |
| Females: 10,698 |
| Median resident age: | 28.2 years |
| Utah median age: | 32.1 years |
Zip codes: 84651.
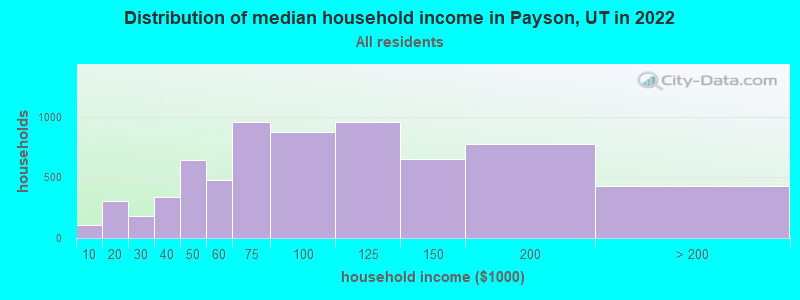
| Payson: | $85,021 |
| UT: | $89,168 |
Estimated per capita income in 2022: $29,057 (it was $14,588 in 2000)
Payson city income, earnings, and wages data
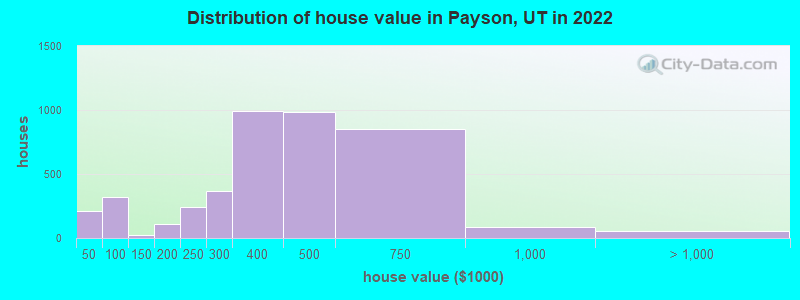
Estimated median house or condo value in 2022: $419,921 (it was $125,800 in 2000)
| Payson: | $419,921 |
| UT: | $499,500 |
Mean prices in 2022: all housing units: $354,327; detached houses: $367,288; townhouses or other attached units: $312,202; in 2-unit structures: $341,548; in 3-to-4-unit structures: $403,671; in 5-or-more-unit structures: $248,519; mobile homes: $97,114
Median gross rent in 2022: $1,307.
(5.4% for White Non-Hispanic residents, 43.0% for Black residents, 7.2% for Hispanic or Latino residents, 7.1% for other race residents)
Detailed information about poverty and poor residents in Payson, UT


Compare current foreclosures in Payson, UT:
| Photo | Address | Area | Beds / Baths | Price | Details |
|---|---|---|---|---|---|

|
#1
S 780 W
Payson, UT 84651
|
1,702 sq. feet
|
2 baths 3 beds |
show details | |

|
#2
Spur Ct
Payson, UT 84651
|
1,738 sq. feet
|
2 baths 3 beds |
show details | |

|
#3
Tomahawk Dr
Payson, UT 84651
|
1,080 sq. feet
|
1 baths 3 beds |
show details | |

|
#4
E 200 N
Payson, UT 84651
|
1,806 sq. feet
|
1 baths 4 beds |
show details | |

|
#5
W 200 N
Payson, UT 84651
|
1,710 sq. feet
|
2 baths 3 beds |
show details | |

|
#6
N 500 E
Payson, UT 84651
|
2,876 sq. feet
|
2 baths 4 beds |
show details | |

|
#7
S 910 W
Payson, UT 84651
|
1,641 sq. feet
|
2 baths 3 beds |
show details | |

|
#8
Pommel Dr
Payson, UT 84651
|
1,060 sq. feet
|
2 baths 3 beds |
show details | |

|
#9
Cougar Cir
Payson, UT 84651
|
1,627 sq. feet
|
2 baths 3 beds |
show details | |

|
#10
S 1600 W
Payson, UT 84651
|
3,136 sq. feet
|
2 baths 6 beds |
show details |
| Photo | Address | Area | Beds / Baths | Price | Details |
|---|---|---|---|---|---|

|
#11
E 600 S
Payson, UT 84651
|
1,760 sq. feet
|
3 baths 4 beds |
show details | |

|
#12
S 200 E
Payson, UT 84651
|
1,147 sq. feet
|
1 baths 3 beds |
show details | |

|
#13
S 580 W
Payson, UT 84651
|
2,028 sq. feet
|
2 baths 3 beds |
show details | |

|
#14
W 400 S
Payson, UT 84651
|
1,534 sq. feet
|
3 baths 3 beds |
show details | |

|
#15
E 100 S, Apt 135
Payson, UT 84651
|
- sq. feet
|
- baths - beds |
show details | |

|
#16
N 200 W
Payson, UT 84651
|
- sq. feet
|
- baths - beds |
show details | |

|
#17
S 410 W
Payson, UT 84651
|
- sq. feet
|
- baths - beds |
show details | |

|
#18
W 100 N
Payson, UT 84651
|
- sq. feet
|
- baths - beds |
show details | |

|
#19
E 300 N
Payson, UT 84651
|
- sq. feet
|
- baths - beds |
show details | |

|
#20
N 600 W, Apt 4
Payson, UT 84651
|
- sq. feet
|
- baths - beds |
show details |
| Photo | Address | Area | Beds / Baths | Price | Details |
|---|---|---|---|---|---|

|
#21
S 1700 W Apt 1432
Payson, UT 84651
|
- sq. feet
|
- baths - beds |
show details | |

|
#22
S 1700 W # 933
Payson, UT 84651
|
- sq. feet
|
- baths - beds |
show details | |

|
#23
S 600 W
Payson, UT 84651
|
- sq. feet
|
- baths - beds |
show details | |

|
#24
S 900 E
Payson, UT 84651
|
- sq. feet
|
- baths - beds |
show details | |

|
#25
N 500 W, Trlr 51
Payson, UT 84651
|
- sq. feet
|
- baths - beds |
show details | |

|
#26
S 830 W
Payson, UT 84651
|
- sq. feet
|
- baths - beds |
show details | |

|
#27
N 400 W, Apt C205
Payson, UT 84651
|
- sq. feet
|
- baths - beds |
show details | |

|
#28
E 50 S, # A
Payson, UT 84651
|
- sq. feet
|
- baths - beds |
show details | |

|
#29
E 700 N
Payson, UT 84651
|
- sq. feet
|
- baths - beds |
show details | |

|
#30
S 1700 W Apt 413
Payson, UT 84651
|
- sq. feet
|
- baths - beds |
show details |
| Photo | Address | Area | Beds / Baths | Price | Details |
|---|---|---|---|---|---|

|
Check over 1 million property listings on Foreclosure.com!
|
browse all offers | |||
| Photo | Address | Area | Beds / Baths | Price | Details |
|---|


- 17,86578.7%White alone
- 3,44115.2%Hispanic
- 5582.5%Two or more races
- 3471.5%Native Hawaiian and Other
Pacific Islander alone - 1860.8%American Indian alone
- 1860.8%Other race alone
- 910.4%Black alone
- 1020.4%Asian alone
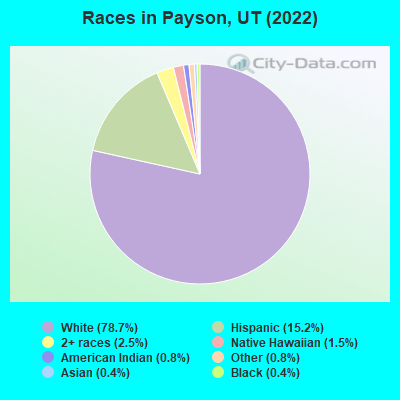
Races in Payson detailed stats: ancestries, foreign born residents, place of birth
According to our research of Utah and other state lists, there were 44 registered sex offenders living in Payson, Utah as of April 27, 2024.
The ratio of all residents to sex offenders in Payson is 465 to 1.
The ratio of registered sex offenders to all residents in this city is lower than the state average.
Type |
2009 |
2010 |
2011 |
2012 |
2013 |
2014 |
2015 |
2016 |
2017 |
2018 |
2019 |
2020 |
2021 |
2022 |
|---|---|---|---|---|---|---|---|---|---|---|---|---|---|---|
| Murders (per 100,000) | 0 (0.0) | 0 (0.0) | 0 (0.0) | 2 (10.5) | 0 (0.0) | 0 (0.0) | 0 (0.0) | 0 (0.0) | 0 (0.0) | 0 (0.0) | 0 (0.0) | 0 (0.0) | 0 (0.0) | 0 (0.0) |
| Rapes (per 100,000) | 4 (22.4) | 0 (0.0) | 1 (5.4) | 3 (15.7) | 1 (5.2) | 3 (15.5) | 4 (20.4) | 2 (10.1) | 0 (0.0) | 3 (14.9) | 6 (30.0) | 2 (9.8) | 8 (37.6) | 6 (26.1) |
| Robberies (per 100,000) | 3 (16.8) | 3 (16.4) | 3 (16.1) | 1 (5.2) | 0 (0.0) | 4 (20.7) | 2 (10.2) | 1 (5.1) | 4 (20.0) | 1 (5.0) | 3 (15.0) | 4 (19.5) | 4 (18.8) | 2 (8.7) |
| Assaults (per 100,000) | 8 (44.7) | 6 (32.8) | 9 (48.3) | 10 (52.5) | 8 (41.8) | 8 (41.4) | 5 (25.6) | 10 (50.7) | 5 (25.0) | 6 (29.9) | 11 (55.1) | 12 (58.5) | 6 (28.2) | 12 (52.2) |
| Burglaries (per 100,000) | 90 (503.1) | 94 (513.8) | 103 (552.4) | 82 (430.4) | 71 (371.3) | 67 (346.5) | 50 (255.6) | 44 (222.9) | 40 (199.9) | 54 (268.9) | 31 (155.1) | 34 (165.9) | 34 (159.7) | 27 (117.4) |
| Thefts (per 100,000) | 465 (2,599) | 523 (2,859) | 619 (3,320) | 477 (2,504) | 384 (2,008) | 399 (2,063) | 308 (1,574) | 386 (1,956) | 312 (1,559) | 254 (1,265) | 272 (1,361) | 318 (1,551) | 181 (850.1) | 162 (704.7) |
| Auto thefts (per 100,000) | 22 (123.0) | 15 (82.0) | 23 (123.3) | 15 (78.7) | 22 (115.1) | 16 (82.7) | 16 (81.8) | 15 (76.0) | 18 (90.0) | 10 (49.8) | 20 (100.1) | 27 (131.7) | 17 (79.8) | 4 (17.4) |
| Arson (per 100,000) | 0 (0.0) | 0 (0.0) | 0 (0.0) | 1 (5.2) | 0 (0.0) | 0 (0.0) | 1 (5.1) | 0 (0.0) | 0 (0.0) | 1 (5.0) | 0 (0.0) | 0 (0.0) | 1 (4.7) | 0 (0.0) |
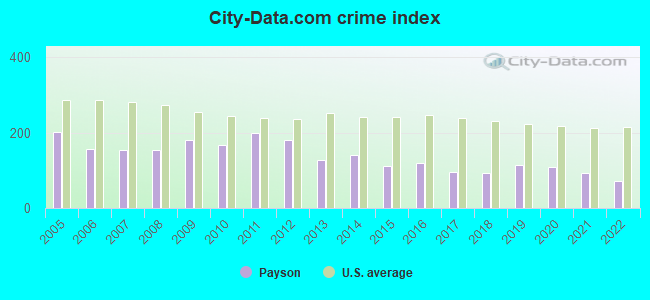
| City-Data.com crime index | 180.9 | 168.4 | 200.1 | 182.2 | 128.1 | 140.3 | 111.9 | 119.7 | 94.6 | 92.8 | 112.9 | 109.6 | 92.9 | 71.7 |
The City-Data.com crime index weighs serious crimes and violent crimes more heavily. Higher means more crime, U.S. average is 246.1. It adjusts for the number of visitors and daily workers commuting into cities.
Crime rate in Payson detailed stats: murders, rapes, robberies, assaults, burglaries, thefts, arson
Full-time law enforcement employees in 2021, including police officers: 27 (24 officers - 21 male; 3 female).
| Officers per 1,000 residents here: | 1.13 |
| Utah average: | 1.67 |
 Recent articles from our blog. Our writers, many of them Ph.D. graduates or candidates, create easy-to-read articles on a wide variety of topics.

 | FrontRunner electrification (5 replies) |
| Seattle vs. Salt Lake City (19 replies) |
| affordable places in Utah next to ATV trails? (6 replies) |
| Orange County CA to Salt Lake City- Who has made the move? (12 replies) |
| Housing in SLC Area (7 replies) |
| Draper/Sandy Area vs Farmington/Kaysville, etc. Area (17 replies) |
Latest news from Payson, UT collected exclusively by city-data.com from local newspapers, TV, and radio stations
Ancestries: English (30.1%), American (10.8%), European (7.5%), German (4.0%), Norwegian (2.4%), British (1.4%).
Current Local Time: MST time zone
Incorporated on 01/21/1853
Elevation: 4700 feet
Land area: 6.79 square miles.
Population density: 3,314 people per square mile (average).
1,348 residents are foreign born (5.1% Latin America).
| This city: | 5.9% |
| Utah: | 8.4% |
Median real estate property taxes paid for housing units with mortgages in 2022: $1,876 (0.4%)
Median real estate property taxes paid for housing units with no mortgage in 2022: $1,675 (0.5%)
Nearest city with pop. 50,000+: Provo, UT  (14.7 miles , pop. 105,166).
Nearest city with pop. 200,000+: Las Vegas, NV (326.7 miles , pop. 478,434).
Nearest city with pop. 1,000,000+: Phoenix, AZ (450.7 miles , pop. 1,321,045).
Nearest cities:
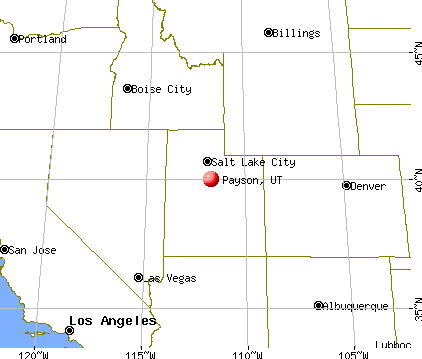
), ), ), )Latitude: 40.04 N, Longitude: 111.73 W
Daytime population change due to commuting: -1,676 (-7.4%)
Workers who live and work in this city: 4,082 (36.3%)
Area code: 801

Payson, Utah accommodation & food services, waste management - Economy and Business Data
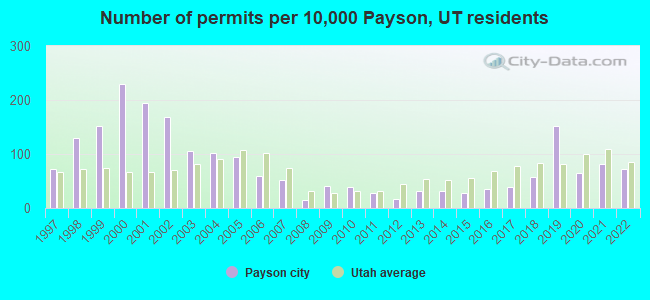
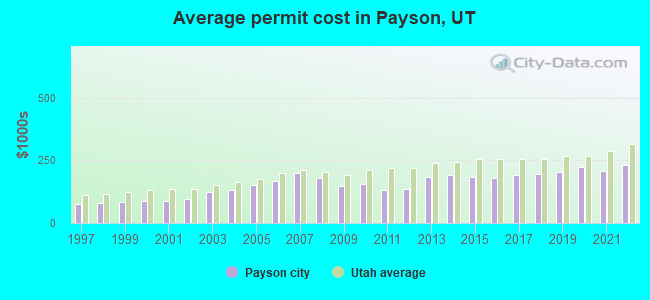
Single-family new house construction building permits:
- 2022: 91 buildings, average cost: $231,800
- 2021: 104 buildings, average cost: $208,200
- 2020: 81 buildings, average cost: $224,900
- 2019: 193 buildings, average cost: $201,500
- 2018: 74 buildings, average cost: $196,500
- 2017: 50 buildings, average cost: $190,400
- 2016: 45 buildings, average cost: $180,900
- 2015: 35 buildings, average cost: $183,000
- 2014: 41 buildings, average cost: $189,700
- 2013: 40 buildings, average cost: $184,300
- 2012: 20 buildings, average cost: $136,300
- 2011: 36 buildings, average cost: $132,600
- 2010: 48 buildings, average cost: $156,800
- 2009: 51 buildings, average cost: $147,500
- 2008: 18 buildings, average cost: $179,500
- 2007: 66 buildings, average cost: $198,900
- 2006: 76 buildings, average cost: $165,700
- 2005: 120 buildings, average cost: $149,500
- 2004: 128 buildings, average cost: $131,700
- 2003: 134 buildings, average cost: $123,500
- 2002: 215 buildings, average cost: $94,700
- 2001: 248 buildings, average cost: $88,000
- 2000: 293 buildings, average cost: $89,300
- 1999: 192 buildings, average cost: $85,400
- 1998: 165 buildings, average cost: $79,600
- 1997: 91 buildings, average cost: $74,200
| Here: | 2.5% |
| Utah: | 2.5% |

Population change in the 1990s: +2,825 (+28.6%).
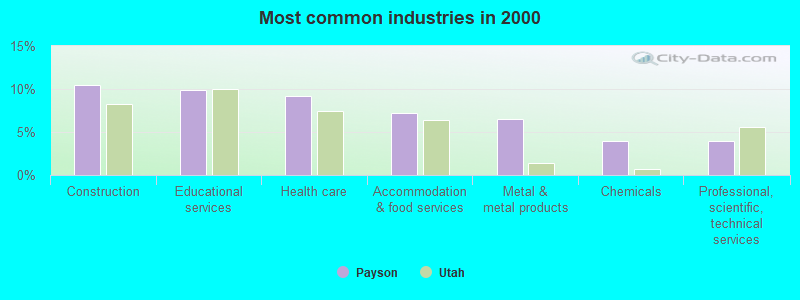
- Construction (10.4%)
- Educational services (9.8%)
- Health care (9.2%)
- Accommodation & food services (7.2%)
- Metal & metal products (6.5%)
- Chemicals (4.0%)
- Professional, scientific, technical services (4.0%)
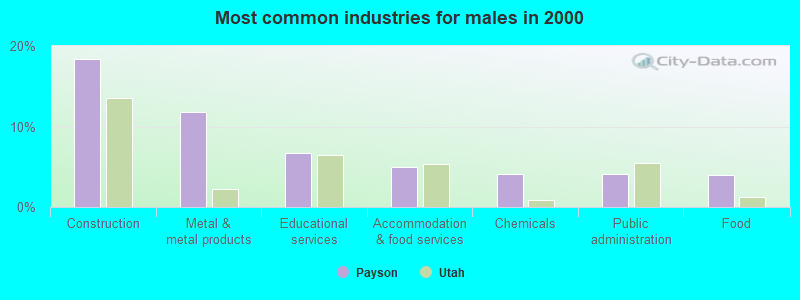
- Construction (18.3%)
- Metal & metal products (11.8%)
- Educational services (6.7%)
- Accommodation & food services (5.0%)
- Chemicals (4.1%)
- Public administration (4.1%)
- Food (4.0%)
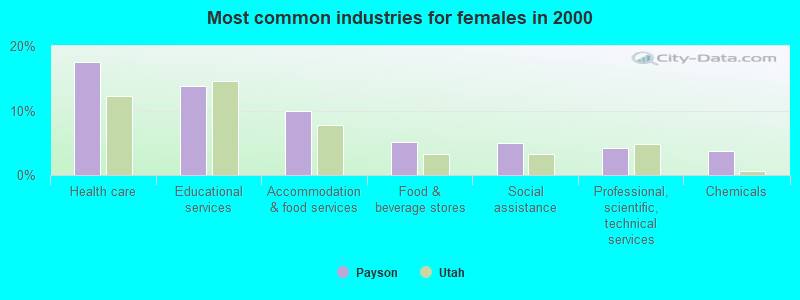
- Health care (17.5%)
- Educational services (13.8%)
- Accommodation & food services (9.9%)
- Food & beverage stores (5.2%)
- Social assistance (4.9%)
- Professional, scientific, technical services (4.2%)
- Chemicals (3.8%)

- Other production occupations, including supervisors (6.1%)
- Other sales and related occupations, including supervisors (3.8%)
- Cooks and food preparation workers (3.7%)
- Other management occupations, except farmers and farm managers (3.6%)
- Material recording, scheduling, dispatching, and distributing workers (3.5%)
- Construction traders workers except carpenters, electricians, painters, plumbers, and construction laborers (3.4%)
- Preschool, kindergarten, elementary, and middle school teachers (3.0%)
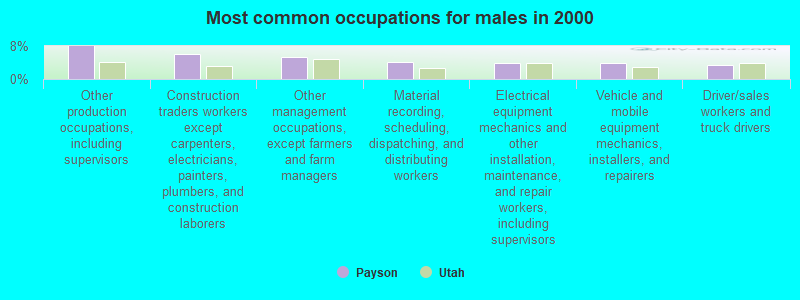
- Other production occupations, including supervisors (8.0%)
- Construction traders workers except carpenters, electricians, painters, plumbers, and construction laborers (6.2%)
- Other management occupations, except farmers and farm managers (5.4%)
- Material recording, scheduling, dispatching, and distributing workers (4.1%)
- Electrical equipment mechanics and other installation, maintenance, and repair workers, including supervisors (3.9%)
- Vehicle and mobile equipment mechanics, installers, and repairers (3.8%)
- Driver/sales workers and truck drivers (3.5%)
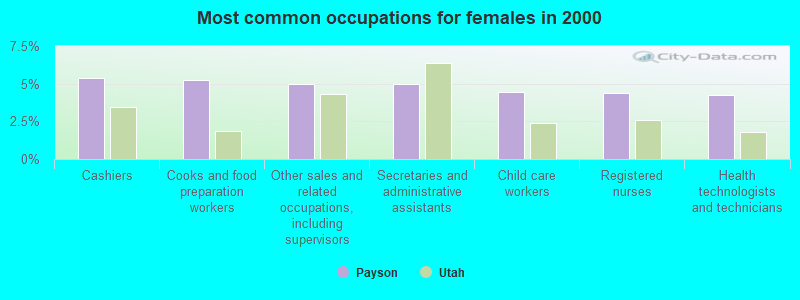
- Cashiers (5.4%)
- Cooks and food preparation workers (5.2%)
- Other sales and related occupations, including supervisors (5.0%)
- Secretaries and administrative assistants (4.9%)
- Child care workers (4.4%)
- Registered nurses (4.4%)
- Health technologists and technicians (4.2%)
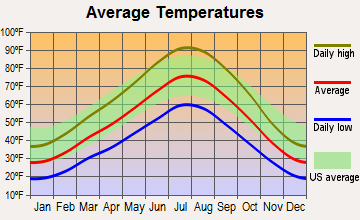
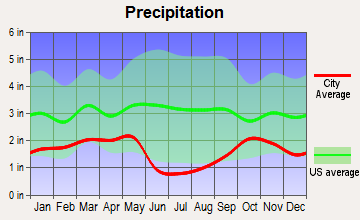
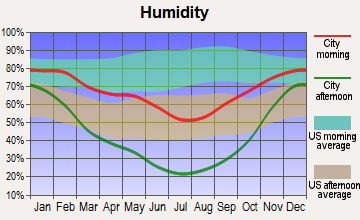
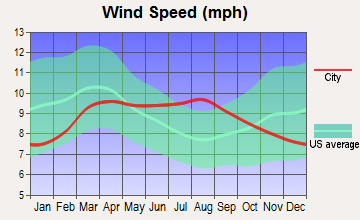
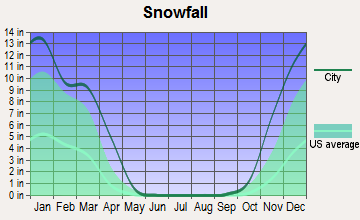
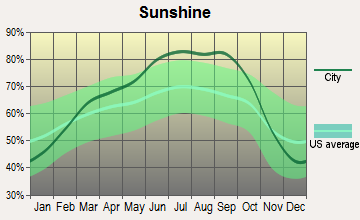
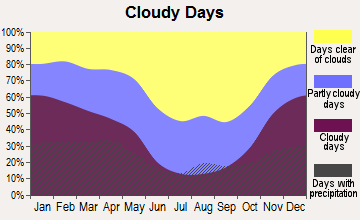
Average climate in Payson, Utah
Based on data reported by over 4,000 weather stations
|
|


(lower is better)
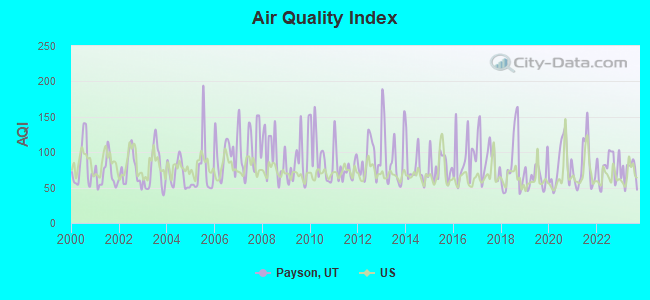
Air Quality Index (AQI) level in 2023 was 72.2. This is about average.
| City: | 72.2 |
| U.S.: | 72.6 |
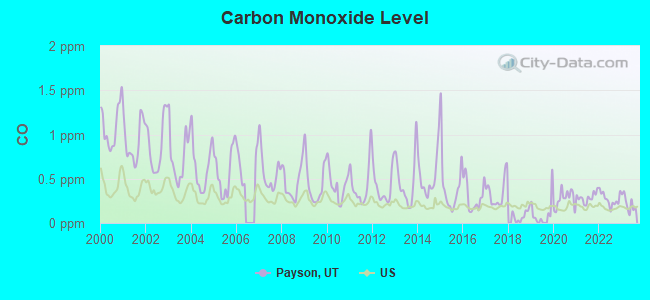
Carbon Monoxide (CO) [ppm] level in 2023 was 0.221. This is about average. Closest monitor was 10.8 miles away from the city center.
| City: | 0.221 |
| U.S.: | 0.251 |
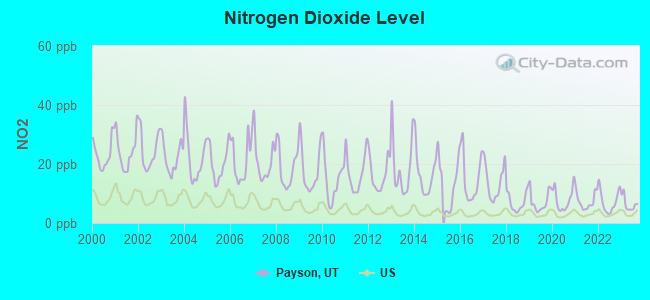
Nitrogen Dioxide (NO2) [ppb] level in 2023 was 6.42. This is worse than average. Closest monitor was 7.8 miles away from the city center.
| City: | 6.42 |
| U.S.: | 5.11 |
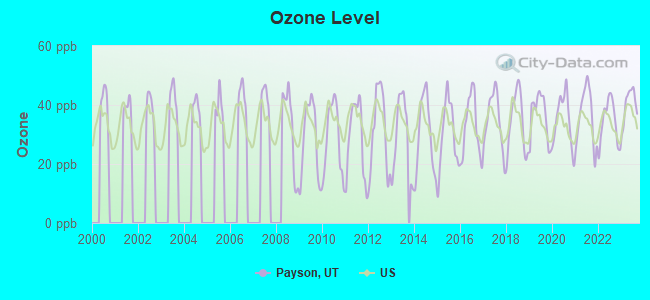
Ozone [ppb] level in 2023 was 40.2. This is worse than average. Closest monitor was 7.8 miles away from the city center.
| City: | 40.2 |
| U.S.: | 33.3 |
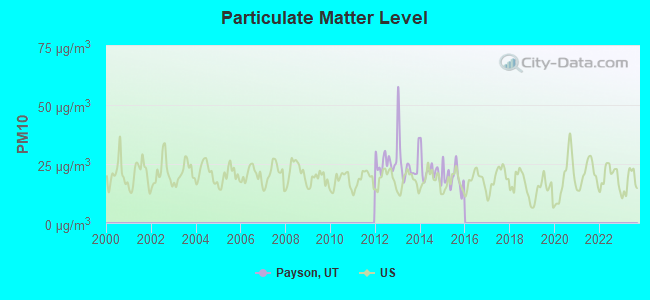
Particulate Matter (PM10) [µg/m3] level in 2015 was 19.4. This is about average. Closest monitor was 15.3 miles away from the city center.
| City: | 19.4 |
| U.S.: | 19.2 |
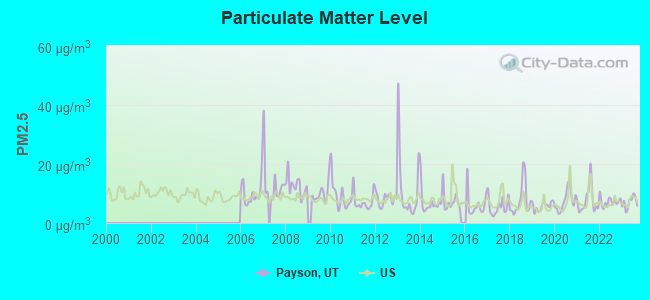
Particulate Matter (PM2.5) [µg/m3] level in 2023 was 6.93. This is about average. Closest monitor was 7.8 miles away from the city center.
| City: | 6.93 |
| U.S.: | 8.11 |
Earthquake activity:
Payson-area historical earthquake activity is significantly above Utah state average. It is 2558% greater than the overall U.S. average.On 8/18/1959 at 06:37:13, a magnitude 7.7 (7.7 UK, Class: Major, Intensity: VIII - XII) earthquake occurred 317.9 miles away from Payson center, causing $26,000,000 total damage
On 10/3/1915 at 06:52:48, a magnitude 7.6 (7.6 UK) earthquake occurred 306.0 miles away from the city center
On 10/28/1983 at 14:06:06, a magnitude 7.3 (6.2 MB, 7.3 MS, 7.0 MW) earthquake occurred 298.8 miles away from Payson center, causing 2 deaths (2 shaking deaths) and 3 injuries, causing $15,000,000 total damage
On 3/28/1975 at 02:31:05, a magnitude 6.2 (6.1 MB, 6.0 MS, 6.2 ML, Class: Strong, Intensity: VII - IX) earthquake occurred 141.9 miles away from Payson center
On 12/21/1932 at 06:10:09, a magnitude 7.2 (7.2 UK) earthquake occurred 356.0 miles away from the city center
On 3/18/2020 at 13:09:31, a magnitude 5.7 (5.7 MW, Depth: 7.4 mi, Class: Moderate, Intensity: VI - VII) earthquake occurred 52.5 miles away from the city center
Magnitude types: body-wave magnitude (MB), local magnitude (ML), surface-wave magnitude (MS), moment magnitude (MW)
Natural disasters:
The number of natural disasters in Utah County (7) is smaller than the US average (15).Major Disasters (Presidential) Declared: 3
Emergencies Declared: 1
Causes of natural disasters: Floods: 3, Fires: 2, Landslides: 2, Storms: 2, Hurricane: 1, Mudslide: 1, Other: 1 (Note: some incidents may be assigned to more than one category).

Hospitals and medical centers in Payson:
- MOUNTAIN VIEW HOSPITAL (Proprietary, 1000 EAST 100 NORTH)
- MOUNTAIN VIEW HOSPITAL CONTINUING CARE CENTER (1000 EAST 100 NORTH)
- PARKWAY HEALTH CENTER (55 SOUTH PROFESSIONAL WAY)
- PAYSON REGIONAL DIALYSIS (15 S 1000 E STE 50)
- ABSOLUTE COMPASSION HOME HEALTH (1172 EAST 100 NORTH #10)
- MEDSHARES CENTRAL UTAH (39 PROFESSIONAL WAY #2)
Heliports located in Payson:
College/University in Payson:
Colleges/universities with over 2000 students nearest to Payson:
- Brigham Young University-Provo (about 16 miles; Provo, UT; Full-time enrollment: 33,525)
- Utah Valley University (about 17 miles; Orem, UT; FT enrollment: 24,403)
- Stevens-Henager College-Murray (about 44 miles; Murray, UT; FT enrollment: 6,395)
- Salt Lake Community College (about 46 miles; Salt Lake City, UT; FT enrollment: 20,797)
- Western Governors University (about 46 miles; Salt Lake City, UT; FT enrollment: 31,481)
- Snow College (about 48 miles; Ephraim, UT; FT enrollment: 3,224)
- Westminster College (about 49 miles; Salt Lake City, UT; FT enrollment: 2,870)
Public high schools in Payson:
- PAYSON JR HIGH (Students: 1,070, Location: 1025 S HIGHWAY 6, Grades: 7-9)
- PAYSON HIGH (Students: 1,031, Location: 1050 S MAIN, Grades: 7-12)
- MT. NEBO JUNIOR HIGH (Students: 878, Location: 851 W 450 S, Grades: 7-10)
Public elementary/middle schools in Payson:
- SPRING LAKE SCHOOL (Students: 735, Location: 1750 S 500 W, Grades: PK-6)
- BARNETT SCHOOL (Students: 704, Location: 456 N 300 E, Grades: PK-6)
- PARK VIEW SCHOOL (Students: 613, Location: 360 S 100 E, Grades: PK-7)
- WILSON SCHOOL (Students: 530, Location: 590 W 500 S, Grades: PK-6)
- TAYLOR SCHOOL (Students: 365, Location: 40 S 500 W, Grades: PK-7)
Points of interest:
Notable locations in Payson: Payson Station (A), Payson Ambulance Association (B), Payson Fire Department (C). Display/hide their locations on the map
Churches in Payson include: First Baptist Chapel (A), Payson Bible Chapel (B), San Andres Catholic Church (C), The Church of Jesus Christ of Latter Day Saints (D). Display/hide their locations on the map
Cemetery: Payson City Cemetery (1). Display/hide its location on the map
Creek: Peteetneet Creek (A). Display/hide its location on the map
Park in Payson: L and J RV Park (1). Display/hide its location on the map
Tourist attractions: Fantasy Acres Miniatures Museum & Model Shop (96 South Main Street), Peteetneet Academy & Museum (10 South 600 East), Avon Sales Representative (Cultural Attractions- Events- & Facilities; 643 East 400 North).
Hotel: Comfort Inn Payson (830 North Main Street).
Court: Court Supportive Services (22 South Main Street).
Birthplace of: Jewel (singer) - Singer-songwriter, Jay E. Jensen - Mormon missionary, Lynn G. Robbins - Businessman, Brandon Jarvis - College football player (Southern Utah Thunderbirds), Craig Hansen - College football player (Southern Utah Thunderbirds), Red Peery - Baseball player.
Drinking water stations with addresses in Payson and their reported violations in the past:
SPRING LAKE (Population served: 475, Groundwater):Past monitoring violations:CHRISTIAN LIFE ASSEMBLY (Population served: 100, Groundwater):
- Failure To Address Deficiency - In DEC-12-2013, Contaminant: GROUNDWATER RULE. Follow-up actions: St Formal NOV issued (JAN-30-2014), St Public Notif requested (JAN-30-2014)
- 2 regular monitoring violations
Past health violations:JEHOVAHS WITNESS CHURCH (Population served: 100, Groundwater):Past monitoring violations:
- MCL, Monthly (TCR) - In JUN-2011, Contaminant: Coliform. Follow-up actions: St Formal NOV issued (AUG-07-2011), St Public Notif requested (AUG-07-2011)
- MCL, Monthly (TCR) - In JUL-2005, Contaminant: Coliform. Follow-up actions: St Violation/Reminder Notice (4 times from NOV-10-2005 to NOV-10-2005), St Compliance achieved (JAN-01-2008)
- 3 routine major monitoring violations
- 2 regular monitoring violations
Past monitoring violations:GOOSENEST WATER COMPANY (Population served: 80, Groundwater):
- 7 routine major monitoring violations
- One regular monitoring violation
Past health violations:MAPLE LAKE ACADEMY (Population served: 30, Groundwater):Past monitoring violations:
- MCL, Monthly (TCR) - In JAN-2009, Contaminant: Coliform. Follow-up actions: St Violation/Reminder Notice (FEB-19-2009), St Public Notif requested (FEB-19-2009), St Compliance achieved (JUL-01-2010)
- Follow-up Or Routine LCR Tap M/R - In JAN-01-2000, Contaminant: Lead and Copper Rule. Follow-up actions: St Compliance achieved (JUN-10-2010)
- One routine major monitoring violation
- One minor monitoring violation
- 4 regular monitoring violations
Past health violations:Past monitoring violations:
- MCL, Monthly (TCR) - In OCT-2013, Contaminant: Coliform. Follow-up actions: St Public Notif received (NOV-30-2013), St Formal NOV issued (JAN-02-2014), St Public Notif requested (JAN-02-2014)
- MCL, Monthly (TCR) - In SEP-2013, Contaminant: Coliform
- 2 routine major monitoring violations
- One minor monitoring violation
- 83 regular monitoring violations
| This city: | 3.6 people |
| Utah: | 3.1 people |
| This city: | 84.2% |
| Whole state: | 75.2% |
| This city: | 2.9% |
| Whole state: | 4.6% |
Likely homosexual households (counted as self-reported same-sex unmarried-partner households)
- Lesbian couples: 0.3% of all households
- Gay men: 0.2% of all households
People in group quarters in Payson in 2010:
- 61 people in nursing facilities/skilled-nursing facilities
- 22 people in residential treatment centers for adults
- 9 people in workers' group living quarters and job corps centers
Banks with branches in Payson (2011 data):
- AmericanWest Bank: Payson Branch at 818 S. Hwy 198, branch established on 1997/06/25. Info updated 2011/12/12: Bank assets: $2,274.6 mil, Deposits: $1,889.1 mil, headquarters in Spokane, WA, positive income, Commercial Lending Specialization, 76 total offices, Holding Company: Skbhc Holdings Llc
- Zions First National Bank: Payson Branch at 80 East 1st North, branch established on 1971/10/01. Info updated 2006/11/03: Bank assets: $17,531.3 mil, Deposits: $14,905.3 mil, headquarters in Salt Lake City, UT, positive income, Commercial Lending Specialization, 151 total offices, Holding Company: Zions Bancorporation
- U.S. Bank National Association: Payson Smiths Branch at 632 South 100 West, branch established on 2004/04/26. Info updated 2012/01/30: Bank assets: $330,470.8 mil, Deposits: $236,091.5 mil, headquarters in Cincinnati, OH, positive income, 3121 total offices, Holding Company: U.S. Bancorp
- Central Bank: Payson Branch at 182 North Main Street, branch established on 1980/08/01. Info updated 2006/11/03: Bank assets: $662.1 mil, Deposits: $508.4 mil, headquarters in Springville, UT, positive income, Commercial Lending Specialization, 10 total offices, Holding Company: Central Bancorporation
- Wells Fargo Bank, National Association: Payson Branch at 95 North Main Street, branch established on 1948/07/01. Info updated 2011/04/05: Bank assets: $1,161,490.0 mil, Deposits: $905,653.0 mil, headquarters in Sioux Falls, SD, positive income, 6395 total offices, Holding Company: Wells Fargo & Company
For population 15 years and over in Payson:
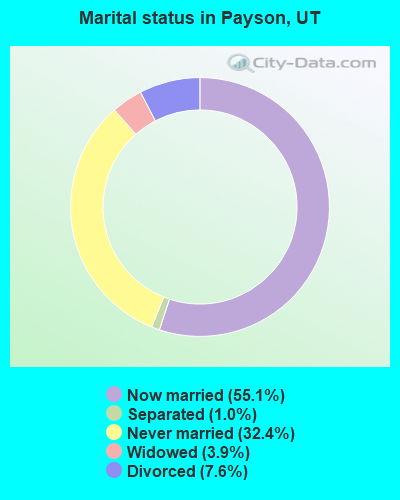
- Never married: 32.4%
- Now married: 55.1%
- Separated: 1.0%
- Widowed: 3.9%
- Divorced: 7.6%
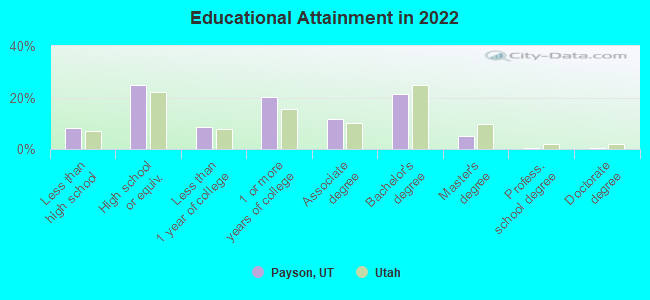
For population 25 years and over in Payson:
- High school or higher: 92.8%
- Bachelor's degree or higher: 26.2%
- Graduate or professional degree: 5.2%
- Unemployed: 4.5%
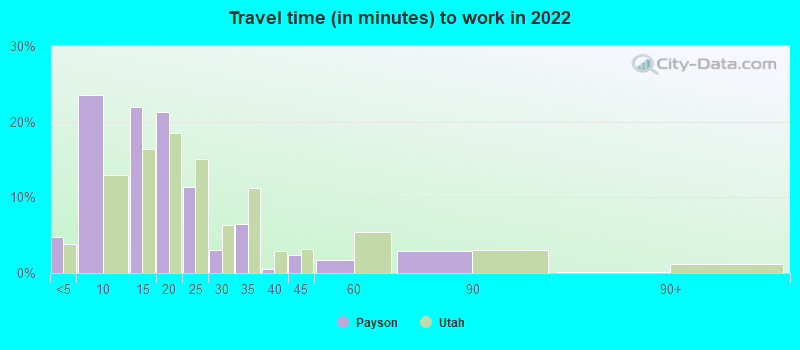
- Mean travel time to work (commute): 17.2 minutes
| Here: | 10.0 |
| Utah average: | 10.9 |
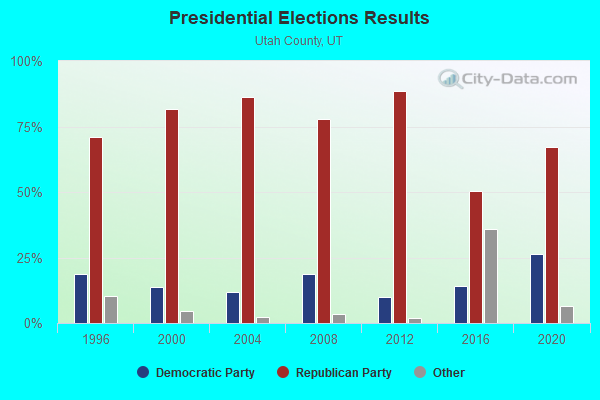
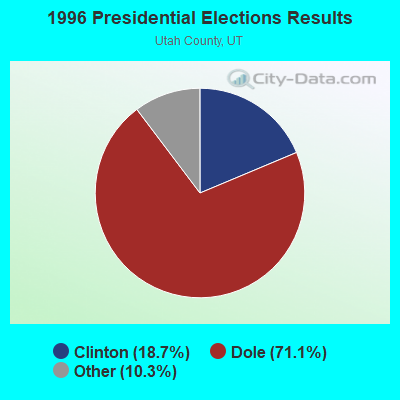
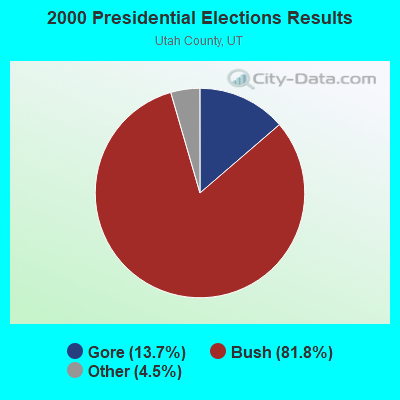
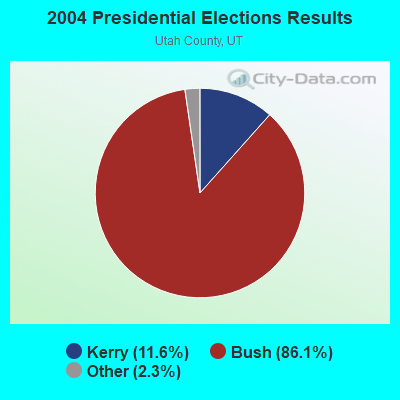
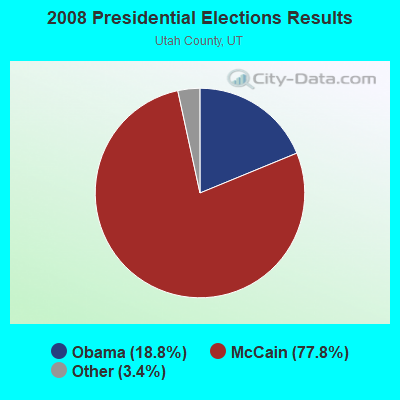
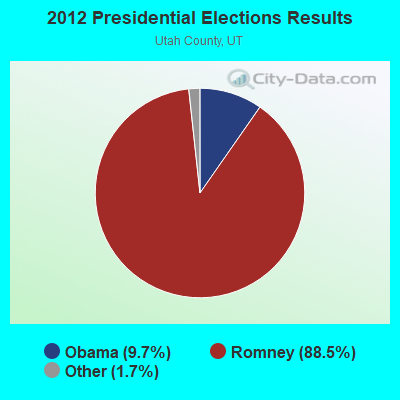
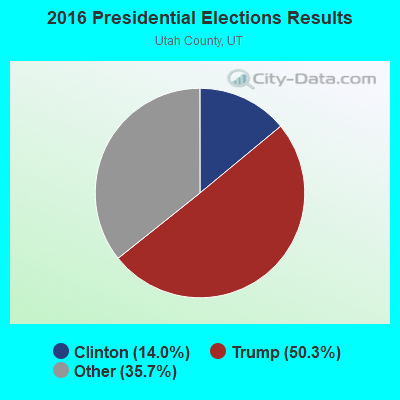
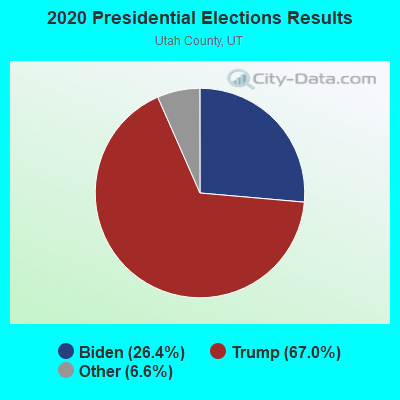
Graphs represent county-level data. Detailed 2008 Election Results
Religion statistics for Payson, UT (based on Utah County data)
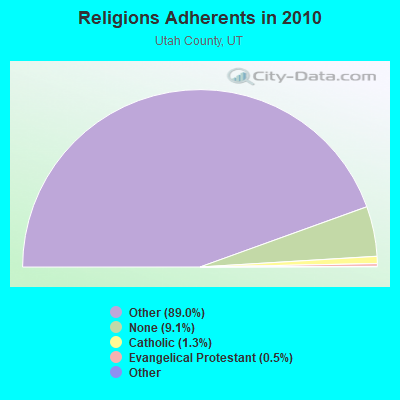
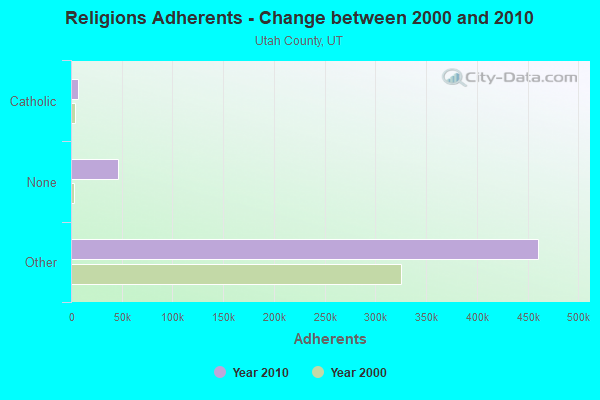
| Religion | Adherents | Congregations |
|---|---|---|
| Other | 459,847 | 1,303 |
| Catholic | 6,792 | 4 |
| Evangelical Protestant | 2,540 | 26 |
| Mainline Protestant | 423 | 6 |
| Black Protestant | 211 | 1 |
| None | 46,751 | - |
Food Environment Statistics:
| Utah County: | 0.84 / 10,000 pop. |
| State: | 1.37 / 10,000 pop. |
| Here: | 0.12 / 10,000 pop. |
| State: | 0.18 / 10,000 pop. |
| This county: | 0.06 / 10,000 pop. |
| Utah: | 0.41 / 10,000 pop. |
| This county: | 1.75 / 10,000 pop. |
| State: | 2.82 / 10,000 pop. |
| Here: | 2.84 / 10,000 pop. |
| Utah: | 5.09 / 10,000 pop. |
| Here: | 5.4% |
| State: | 6.3% |
| Here: | 24.5% |
| Utah: | 23.6% |
Health and Nutrition:
| This city: | 47.1% |
| State: | 48.9% |
| Payson: | 43.7% |
| Utah: | 47.0% |
| Payson: | 28.6 |
| Utah: | 28.4 |
| Payson: | 21.6% |
| Utah: | 21.0% |
| Payson: | 10.5% |
| Utah: | 10.3% |
| Payson: | 6.8 |
| Utah: | 6.8 |
| Payson: | 32.1% |
| Utah: | 31.9% |
| This city: | 55.6% |
| State: | 57.4% |
| Here: | 79.4% |
| Utah: | 80.1% |
More about Health and Nutrition of Payson, UT Residents
| Local government employment and payroll (March 2022) | |||||
| Function | Full-time employees | Monthly full-time payroll | Average yearly full-time wage | Part-time employees | Monthly part-time payroll |
|---|---|---|---|---|---|
| Police Protection - Officers | 23 | $268,350 | $140,009 | 1 | $62 |
| Electric Power | 14 | $114,713 | $98,325 | 0 | $0 |
| Solid Waste Management | 10 | $40,709 | $48,851 | 0 | $0 |
| Parks and Recreation | 10 | $51,785 | $62,142 | 12 | $4,105 |
| Water Supply | 9 | $42,535 | $56,713 | 0 | $0 |
| Housing and Community Development (Local) | 8 | $43,228 | $64,842 | 0 | $0 |
| Streets and Highways | 7 | $33,456 | $57,353 | 0 | $0 |
| Sewerage | 7 | $44,499 | $76,284 | 0 | $0 |
| Judicial and Legal | 5 | $34,073 | $81,775 | 1 | $2,039 |
| Financial Administration | 3 | $25,735 | $102,940 | 4 | $8,375 |
| Local Libraries | 3 | $16,056 | $64,224 | 13 | $9,545 |
| Other Government Administration | 2 | $19,147 | $114,882 | 8 | $10,542 |
| Firefighters | 1 | $10,228 | $122,736 | 10 | $4,831 |
| Police - Other | 1 | $5,888 | $70,656 | 5 | $6,069 |
| Welfare | 1 | $4,905 | $58,860 | 9 | $14,578 |
| Health | 0 | $0 | 34 | $31,291 | |
| Fire - Other | 0 | $0 | 1 | $153 | |
| Other and Unallocable | 0 | $0 | 1 | $550 | |
| Totals for Government | 104 | $755,308 | $87,151 | 99 | $92,139 |
Payson government finances - Expenditure in 2021 (per resident):
- Construction - General - Other: $6,538,000 ($290.37)
Electric Utilities: $1,481,000 ($65.78)
Water Utilities: $582,000 ($25.85)
Natural Resources - Other: $209,000 ($9.28)
Sewerage: $135,000 ($6.00)
Solid Waste Management: $112,000 ($4.97)
General Public Buildings: $108,000 ($4.80)
Parks and Recreation: $67,000 ($2.98)
Miscellaneous Commercial Activities - Other: $17,000 ($0.76)
Libraries: $6,000 ($0.27)
Police Protection: $5,000 ($0.22)
- Current Operations - Electric Utilities: $9,867,000 ($438.22)
Parks and Recreation: $4,086,000 ($181.47)
Central Staff Services: $3,883,000 ($172.46)
Police Protection: $3,155,000 ($140.12)
Sewerage: $2,571,000 ($114.19)
Water Utilities: $1,867,000 ($82.92)
Solid Waste Management: $1,624,000 ($72.13)
Health - Other: $681,000 ($30.25)
Judicial and Legal Services: $613,000 ($27.23)
General Public Buildings: $417,000 ($18.52)
Libraries: $385,000 ($17.10)
Regular Highways: $337,000 ($14.97)
Local Fire Protection: $309,000 ($13.72)
Miscellaneous Commercial Activities - Other: $272,000 ($12.08)
Natural Resources - Other: $246,000 ($10.93)
Public Welfare - Other: $222,000 ($9.86)
General - Other: $36,000 ($1.60)
- Other Capital Outlay - Regular Highways: $246,000 ($10.93)
Solid Waste Management: $106,000 ($4.71)
Electric Utilities: $60,000 ($2.66)
Police Protection: $37,000 ($1.64)
Miscellaneous Commercial Activities - Other: $22,000 ($0.98)
Libraries: $22,000 ($0.98)
Local Fire Protection: $9,000 ($0.40)
Central Staff Services: $5,000 ($0.22)
Parks and Recreation: $2,000 ($0.09)
- Total Salaries and Wages: $8,231,000 ($365.56)
- Water Utilities - Interest on Debt: $246,000 ($10.93)
Payson government finances - Revenue in 2021 (per resident):
- Charges - Other: $6,951,000 ($308.71)
Sewerage: $3,977,000 ($176.63)
Solid Waste Management: $2,819,000 ($125.20)
Parks and Recreation: $2,355,000 ($104.59)
Miscellaneous Commercial Activities: $115,000 ($5.11)
Natural Resources - Other: $1,000 ($0.04)
- Federal Intergovernmental - Other: $207,000 ($9.19)
- Local Intergovernmental - Other: $110,000 ($4.89)
General Local Government Support: $10,000 ($0.44)
Public Welfare: $8,000 ($0.36)
- Miscellaneous - Sale of Property: $1,098,000 ($48.77)
General Revenue - Other: $647,000 ($28.74)
Rents: $512,000 ($22.74)
Interest Earnings: $291,000 ($12.92)
Fines and Forfeits: $261,000 ($11.59)
Donations From Private Sources: $50,000 ($2.22)
- Revenue - Water Utilities: $3,031,000 ($134.62)
Electric Utilities: $2,382,000 ($105.79)
- State Intergovernmental - Other: $950,000 ($42.19)
General Local Government Support: $27,000 ($1.20)
- Tax - General Sales and Gross Receipts: $4,015,000 ($178.32)
Property: $1,703,000 ($75.64)
Public Utilities Sales: $1,195,000 ($53.07)
Other License: $654,000 ($29.05)
Other Selective Sales: $290,000 ($12.88)
Occupation and Business License - Other: $43,000 ($1.91)
Alcoholic Beverage License: $2,000 ($0.09)
Payson government finances - Debt in 2021 (per resident):
- Long Term Debt - Outstanding Unspecified Public Purpose: $4,000 ($0.18)
Issue, Unspecified Public Purpose: $4,000 ($0.18)
Payson government finances - Cash and Securities in 2021 (per resident):
- Bond Funds - Cash and Securities: $3,807,000 ($169.08)
- Sinking Funds - Cash and Securities: $30,000 ($1.33)
8.12% of this county's 2021 resident taxpayers lived in other counties in 2020 ($71,824 average adjusted gross income)
| Here: | 8.12% |
| Utah average: | 7.95% |
0.01% of residents moved from foreign countries ($102 average AGI)
Utah County: 0.01% Utah average: 0.02%
Top counties from which taxpayers relocated into this county between 2020 and 2021:
| from Salt Lake County, UT | |
| from Davis County, UT | |
| from Maricopa County, AZ |
7.26% of this county's 2020 resident taxpayers moved to other counties in 2021 ($74,329 average adjusted gross income)
| Here: | 7.26% |
| Utah average: | 7.39% |
0.01% of residents moved to foreign countries ($122 average AGI)
Utah County: 0.01% Utah average: 0.02%
Top counties to which taxpayers relocated from this county between 2020 and 2021:
| to Salt Lake County, UT | |
| to Davis County, UT | |
| to Washington County, UT |
| Businesses in Payson, UT | ||||
| Name | Count | Name | Count | |
|---|---|---|---|---|
| Arby's | 1 | Maurices | 1 | |
| AutoZone | 1 | McDonald's | 1 | |
| Big O Tires | 1 | Payless | 1 | |
| Blockbuster | 1 | Pizza Hut | 1 | |
| Budget Car Rental | 1 | Quality | 1 | |
| Cricket Wireless | 1 | Rite Aid | 1 | |
| Curves | 1 | T-Mobile | 1 | |
| Domino's Pizza | 1 | U-Haul | 1 | |
| FedEx | 1 | UPS | 2 | |
| H&R Block | 1 | Walgreens | 1 | |
| Kroger | 1 | Walmart | 1 | |
| Little Caesars Pizza | 1 | Wendy's | 1 | |
Strongest AM radio stations in Payson:
- KHQN (1480 AM; 1 kW; SPANISH FORK, UT; Owner: SACE BROADCASTING CORPORATION)
- KOVO (960 AM; 5 kW; PROVO, UT; Owner: MILLCREEK BROADCASTING LLC)
- KALL (700 AM; 50 kW; NORTH SALT LAKE CITY, UT; Owner: CITICASTERS LICENSES, L.P.)
- KIQN (1010 AM; 50 kW; TOOELE, UT)
- KSL (1160 AM; 50 kW; SALT LAKE CITY, UT; Owner: BONNEVILLE HOLDING COMPANY)
- KTKK (630 AM; 10 kW; SANDY, UT; Owner: UNITED BROADCASTING COMPANY)
- KKDS (1060 AM; 10 kW; SOUTH SALT LAKE, UT; Owner: HOLIDAY BROADCASTING COMPANY)
- KMTI (650 AM; 10 kW; MANTI, UT; Owner: SANPETE COUNTY BROADCASTING COMPANY)
- KBEE (860 AM; 10 kW; SALT LAKE CITY, UT; Owner: CITADEL BROADCASTING COMPANY)
- KLLB (1510 AM; daytime; 10 kW; WEST JORDAN, UT; Owner: UNITED SECURITY FINANCIAL, INC.)
- KWDZ (910 AM; 5 kW; SALT LAKE CITY, UT; Owner: ABC, INC.)
- KEYY (1450 AM; 1 kW; PROVO, UT; Owner: BIBLICAL MINISTRIES WORLDWIDE)
- KOAL (750 AM; 10 kW; PRICE, UT; Owner: EASTERN UTAH BROADCASTING CO.)
Strongest FM radio stations in Payson:
- KTCE (92.3 FM; PAYSON, UT; Owner: MOENKOPI COMMUNICATIONS, INC.)
- K264AC (100.7 FM; RURAL UTAH COUNTY, UT; Owner: SIMMONS-SLC, LS, LLC)
- K208BZ (89.5 FM; SPANISH FORK, UT; Owner: BRIGHAM YOUNG UNIVERSITY)
- KQMB (102.7 FM; MIDVALE, UT; Owner: SIMMONS-SLC, LS, LLC)
- KXRK (96.3 FM; PROVO, UT; Owner: SIMMONS-SLC, LS, LLC)
- KENZ (107.5 FM; OREM, UT; Owner: CITADEL BROADCASTING COMPANY)
- KZHT (94.9 FM; PROVO, UT; Owner: CITICASTERS LICENSES, L.P.)
- KMXU (105.1 FM; MANTI, UT; Owner: MILLCREEK BROADCASTING, LLC)
- K217CL (91.3 FM; PROVO, UT; Owner: STOCKTON CHRISTIAN LIFE COLLEGE, INC)
- KSOP-FM (104.3 FM; SALT LAKE CITY, UT; Owner: KSOP, INC.)
- K272DP (102.3 FM; TOOELE, UT; Owner: FAMILY STATIONS, INC.)
- KRCL (90.9 FM; SALT LAKE CITY, UT; Owner: LISTENERS COMMUNITY RADIO OF UTAH)
- KBZN (97.9 FM; OGDEN, UT; Owner: CAPITOL BROADCASTING, INC.)
- KOSY-FM (106.5 FM; SPANISH FORK, UT; Owner: MERCURY BROADCASTING COMPANY, INC.)
- KRSP-FM (103.5 FM; SALT LAKE CITY, UT; Owner: SIMMONS-SLC, LS, LLC)
- KBER (101.1 FM; OGDEN, UT; Owner: CITADEL BROADCASTING COMPANY)
- KISN-FM (97.1 FM; SALT LAKE CITY, UT; Owner: CLEAR CHANNEL BROADCASTING LICENSES, INC.)
- KKAT (101.9 FM; OGDEN, UT; Owner: CITICASTERS LICENSES, L.P.)
- KSFI (100.3 FM; SALT LAKE CITY, UT; Owner: SIMMONS-SLC, LS, LLC)
- KUBL-FM (93.3 FM; SALT LAKE CITY, UT; Owner: CITADEL BROADCASTING COMPANY)
TV broadcast stations around Payson:
- KUPX (Channel 16; PROVO, UT; Owner: PAXSON SALT LAKE CITY LICENSE, INC.)
- KUTV (Channel 2; SALT LAKE CITY, UT; Owner: KUTV HOLDINGS, INC.)
- K34DW (Channel 34; PROVO, UT; Owner: THREE ANGELS BROADCASTING NETWORK)
- National Bridge Inventory (NBI) Statistics
- 17Number of bridges
- 121ft / 36.6mTotal length
- 361,701Total average daily traffic
- 79,013Total average daily truck traffic
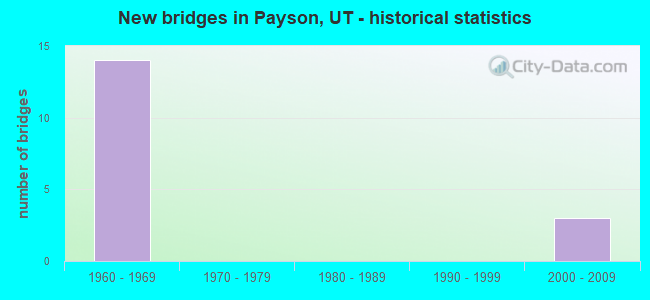
- New bridges - historical statistics
- 141960-1969
- 32000-2009
FCC Registered Private Land Mobile Towers: 1 (See the full list of FCC Registered Private Land Mobile Towers in Payson, UT)
FCC Registered Broadcast Land Mobile Towers: 20 (See the full list of FCC Registered Broadcast Land Mobile Towers)
FCC Registered Microwave Towers: 63 (See the full list of FCC Registered Microwave Towers in this town)
FCC Registered Paging Towers: 6 (See the full list of FCC Registered Paging Towers)
FCC Registered Amateur Radio Licenses: 432 (See the full list of FCC Registered Amateur Radio Licenses in Payson)
FAA Registered Aircraft: 10 (See the full list of FAA Registered Aircraft in Payson)
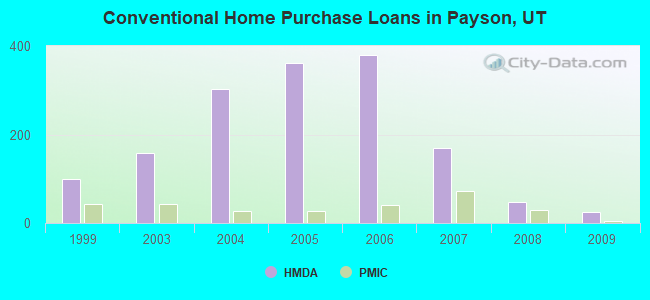
| Home Mortgage Disclosure Act Aggregated Statistics For Year 2009 (Based on 1 full and 2 partial tracts) | ||||||||||||
| A) FHA, FSA/RHS & VA Home Purchase Loans | B) Conventional Home Purchase Loans | C) Refinancings | D) Home Improvement Loans | F) Non-occupant Loans on < 5 Family Dwellings (A B C & D) | G) Loans On Manufactured Home Dwelling (A B C & D) | |||||||
|---|---|---|---|---|---|---|---|---|---|---|---|---|
| Number | Average Value | Number | Average Value | Number | Average Value | Number | Average Value | Number | Average Value | Number | Average Value | |
| LOANS ORIGINATED | 84 | $170,528 | 25 | $146,764 | 402 | $160,637 | 11 | $69,456 | 14 | $115,592 | 2 | $126,925 |
| APPLICATIONS APPROVED, NOT ACCEPTED | 6 | $141,547 | 5 | $116,678 | 58 | $170,198 | 1 | $3,540 | 3 | $112,847 | 0 | $0 |
| APPLICATIONS DENIED | 18 | $159,596 | 8 | $121,396 | 121 | $169,015 | 8 | $84,174 | 10 | $124,619 | 3 | $54,490 |
| APPLICATIONS WITHDRAWN | 6 | $191,057 | 4 | $138,975 | 88 | $162,264 | 4 | $24,905 | 5 | $121,226 | 0 | $0 |
| FILES CLOSED FOR INCOMPLETENESS | 1 | $86,070 | 0 | $0 | 18 | $176,762 | 0 | $0 | 0 | $0 | 0 | $0 |
Detailed HMDA statistics for the following Tracts: 0034.01 , 0034.02, 0034.03
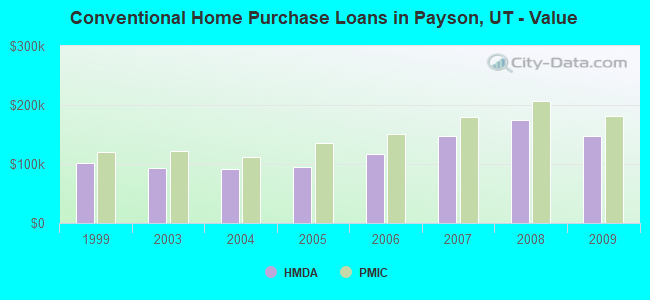
| Private Mortgage Insurance Companies Aggregated Statistics For Year 2009 (Based on 1 full and 2 partial tracts) | ||||||
| A) Conventional Home Purchase Loans | B) Refinancings | C) Non-occupant Loans on < 5 Family Dwellings (A & B) | ||||
|---|---|---|---|---|---|---|
| Number | Average Value | Number | Average Value | Number | Average Value | |
| LOANS ORIGINATED | 5 | $181,620 | 17 | $183,538 | 0 | $0 |
| APPLICATIONS APPROVED, NOT ACCEPTED | 5 | $160,840 | 6 | $255,965 | 0 | $0 |
| APPLICATIONS DENIED | 0 | $0 | 6 | $175,683 | 0 | $0 |
| APPLICATIONS WITHDRAWN | 0 | $0 | 0 | $0 | 0 | $0 |
| FILES CLOSED FOR INCOMPLETENESS | 0 | $0 | 2 | $134,155 | 1 | $108,880 |
Detailed PMIC statistics for the following Tracts: 0034.01 , 0034.02, 0034.03
2002 - 2018 National Fire Incident Reporting System (NFIRS) incidents
- Fire incident types reported to NFIRS in Payson, UT
- 47856.0%Outside Fires
- 19122.4%Structure Fires
- 10912.8%Mobile Property/Vehicle Fires
- 768.9%Other
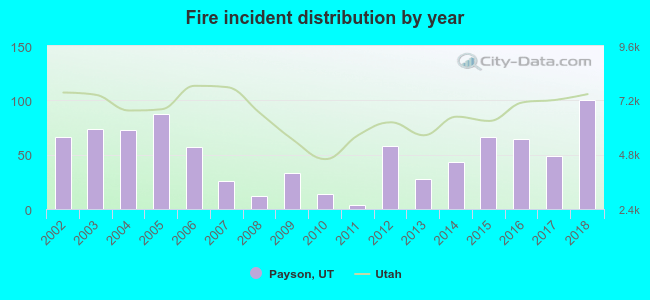 According to the data from the years 2002 - 2018 the average number of fires per year is 50. The highest number of reported fires - 100 took place in 2018, and the least - 4 in 2011. The data has a growing trend.
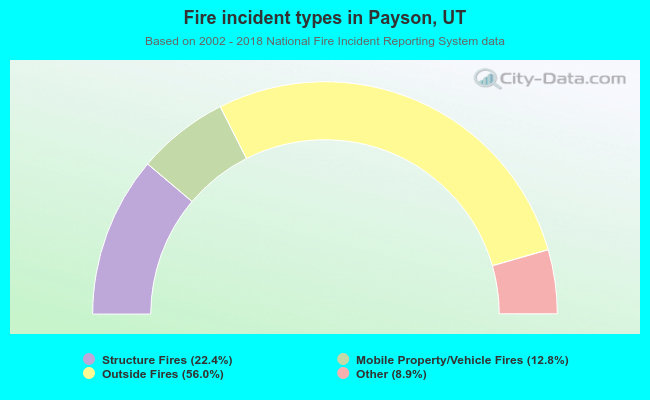 When looking into fire subcategories, the most incidents belonged to: Outside Fires (56.0%), and Structure Fires (22.4%).
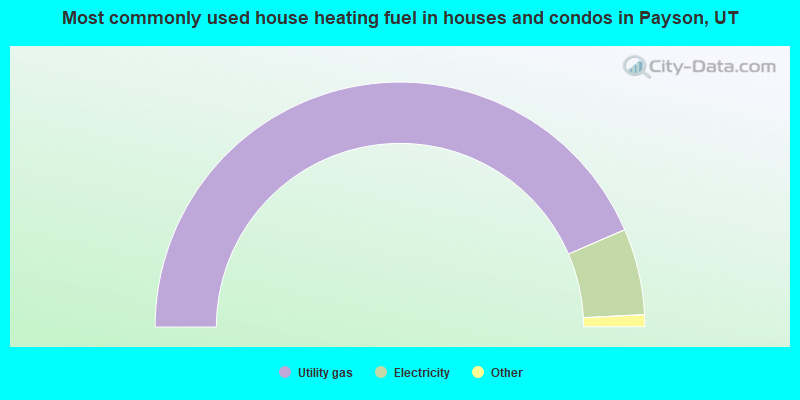
- 87.0%Utility gas
- 11.4%Electricity
- 0.9%Bottled, tank, or LP gas
- 0.3%Wood
- 0.2%Other fuel
- 0.1%Solar energy
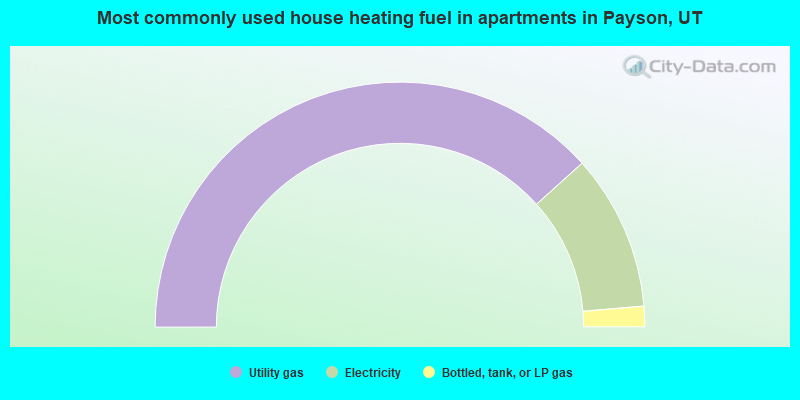
- 76.7%Utility gas
- 20.6%Electricity
- 2.7%Bottled, tank, or LP gas
Payson compared to Utah state average:
- Unemployed percentage below state average.
- Hispanic race population percentage above state average.
- Median age below state average.
- Length of stay since moving in significantly above state average.

|
|
Total of 245 patent applications in 2008-2024.