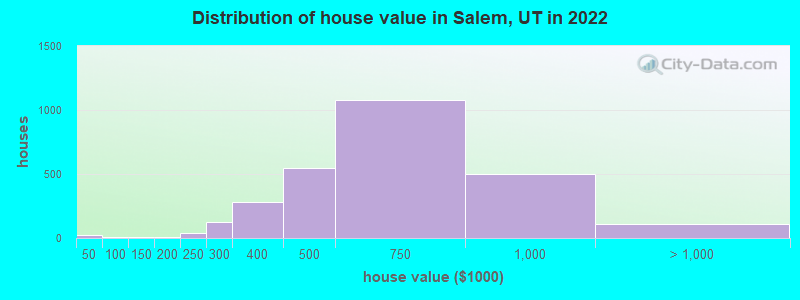
Estimated median house or condo value in 2022: $579,155 (it was $157,600 in 2000)
Salem:
$579,155
UT:
$499,500
Mean prices in 2022:all housing units: $597,657; detached houses: $626,504; townhouses or other attached units: $504,720; in 2-unit structures: $350,380; in 3-to-4-unit structures: $468,789; in 5-or-more-unit structures: $292,655; mobile homes: $229,619
Median gross rent in 2022: $1,538.
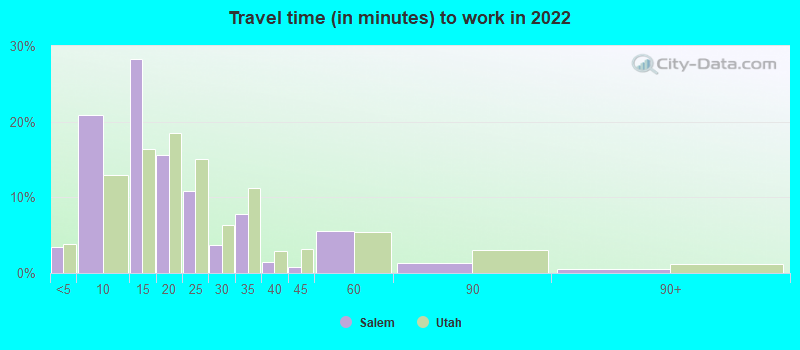
March 2022 cost of living index in Salem: 88.5 (less than average, U.S. average is 100)
According to our research of Utah and other state lists, there were 8 registered sex offenders living in Salem, Utah as of April 27, 2024. The ratio of all residents to sex offenders in Salem is 951 to 1. The ratio of registered sex offenders to all residents in this city is much lower than the state average.
Crime rates in Salem by year
Type
2009
2010
2011
2012
2013
2014
2015
2016
2017
2018
2019
2020
2021
2022
Murders (per 100,000)
0 (0.0)
0 (0.0)
0 (0.0)
0 (0.0)
1 (14.6)
0 (0.0)
0 (0.0)
0 (0.0)
0 (0.0)
0 (0.0)
0 (0.0)
0 (0.0)
0 (0.0)
0 (0.0)
Rapes (per 100,000)
3 (45.2)
0 (0.0)
0 (0.0)
0 (0.0)
1 (14.6)
2 (28.4)
1 (13.4)
0 (0.0)
1 (12.4)
0 (0.0)
0 (0.0)
0 (0.0)
2 (21.9)
1 (9.7)
Robberies (per 100,000)
0 (0.0)
0 (0.0)
0 (0.0)
0 (0.0)
0 (0.0)
0 (0.0)
0 (0.0)
0 (0.0)
0 (0.0)
0 (0.0)
0 (0.0)
0 (0.0)
0 (0.0)
0 (0.0)
Assaults (per 100,000)
1 (15.1)
0 (0.0)
0 (0.0)
3 (44.8)
1 (14.6)
4 (56.7)
3 (40.3)
0 (0.0)
1 (12.4)
1 (11.8)
0 (0.0)
1 (11.2)
2 (21.9)
1 (9.7)
Burglaries (per 100,000)
11 (165.8)
14 (218.0)
18 (274.9)
14 (209.2)
21 (305.8)
12 (170.2)
8 (107.4)
1 (13.0)
2 (24.7)
10 (117.7)
3 (34.2)
4 (44.9)
5 (54.6)
4 (38.8)
Thefts (per 100,000)
60 (904.3)
71 (1,105)
65 (992.8)
79 (1,181)
64 (932.0)
55 (779.9)
66 (886.4)
56 (727.7)
33 (408.1)
57 (670.9)
29 (331.1)
41 (460.6)
35 (382.5)
38 (368.6)
Auto thefts (per 100,000)
4 (60.3)
1 (15.6)
4 (61.1)
3 (44.8)
0 (0.0)
2 (28.4)
0 (0.0)
1 (13.0)
2 (24.7)
2 (23.5)
0 (0.0)
5 (56.2)
1 (10.9)
4 (38.8)
Arson (per 100,000)
0 (0.0)
0 (0.0)
0 (0.0)
0 (0.0)
0 (0.0)
0 (0.0)
0 (0.0)
0 (0.0)
0 (0.0)
0 (0.0)
0 (0.0)
0 (0.0)
0 (0.0)
0 (0.0)
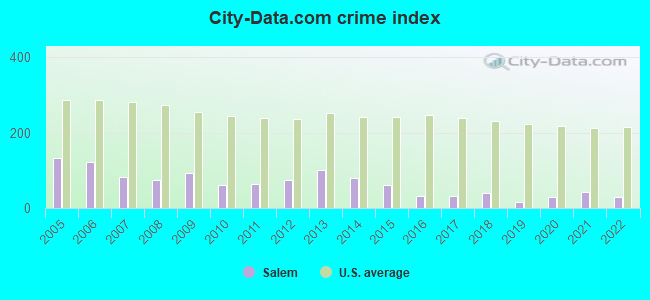
City-Data.com crime index
91.8
60.7
63.8
74.4
102.4
79.4
61.8
31.1
32.4
39.3
15.6
28.3
41.9
30.3
The City-Data.com crime index weighs serious crimes and violent crimes more heavily. Higher means more crime, U.S. average is 246.1. It adjusts for the number of visitors and daily workers commuting into cities.
Latest news from Salem, UT collected exclusively by city-data.com from local newspapers, TV, and radio stations
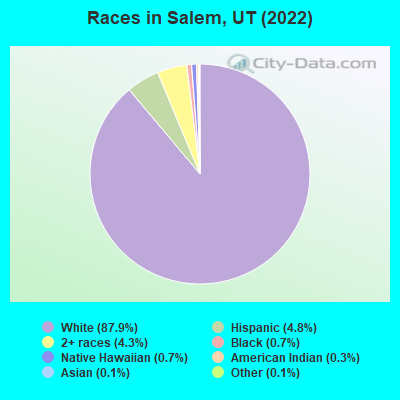
Ancestries: English (25.3%), American (14.9%), German (13.2%), European (5.7%), British (4.9%), Swedish (3.3%).
Current Local Time: MST time zone
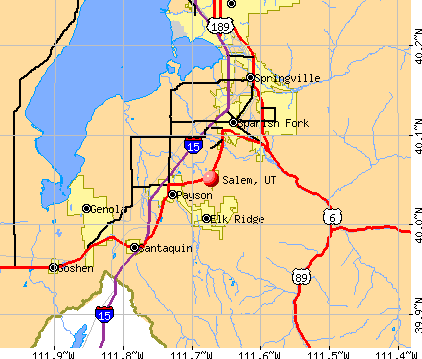
Incorporated in 1886
Elevation: 4600 feet
Land area: 5.30 square miles.
Population density: 1,961 people per square mile (low).
157 residents are foreign born
This city:
1.6%
Utah:
8.4%
Median real estate property taxes paid for housing units with mortgages in 2022: $2,559 (0.4%) Median real estate property taxes paid for housing units with no mortgage in 2022: $2,671 (0.5%)
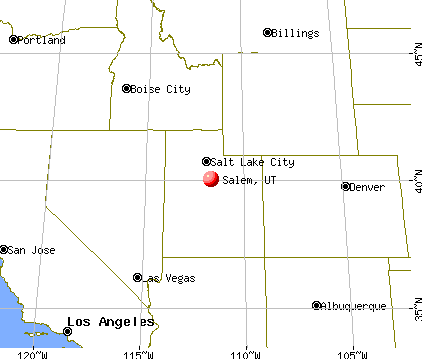
Nearest city with pop. 50,000+: Provo, UT (13.4 miles , pop. 105,166).
Nearest city with pop. 200,000+: Las Vegas, NV (329.3 miles , pop. 478,434).
Nearest city with pop. 1,000,000+: Phoenix, AZ (451.7 miles , pop. 1,321,045).
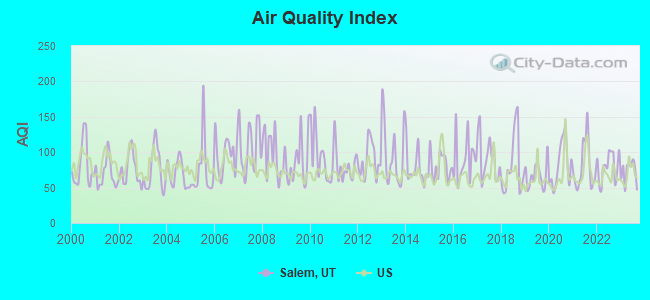
Air Quality Index (AQI) level in 2023 was 72.2. This is about average.
City:
72.2
U.S.:
72.6
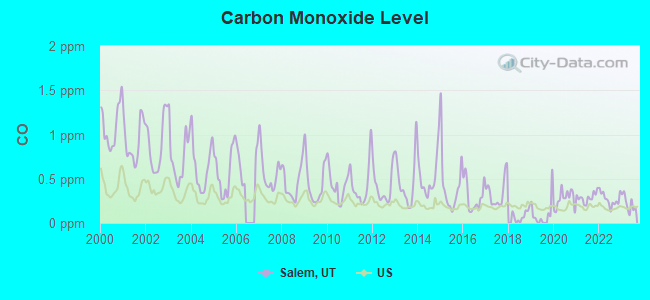
Carbon Monoxide (CO) [ppm] level in 2023 was 0.221. This is about average.Closest monitor was 8.5 miles away from the city center.
City:
0.221
U.S.:
0.251
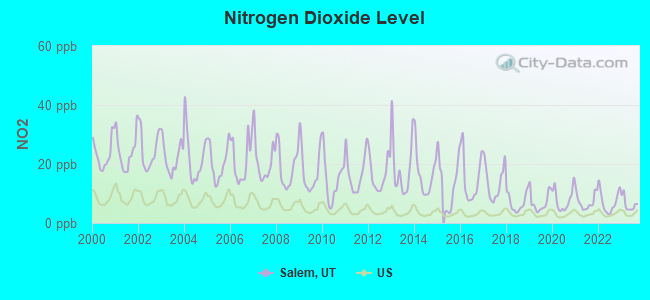
Nitrogen Dioxide (NO2) [ppb] level in 2023 was 6.37. This is worse than average.Closest monitor was 6.0 miles away from the city center.
City:
6.37
U.S.:
5.11
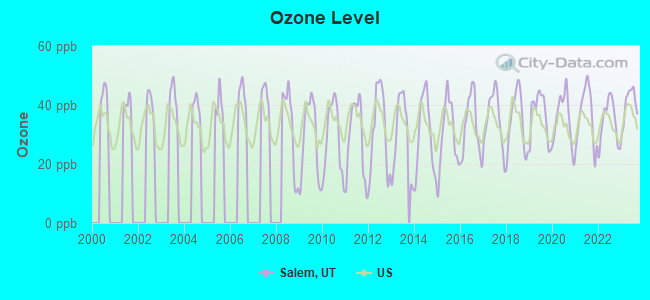
Ozone [ppb] level in 2023 was 40.3. This is worse than average.Closest monitor was 6.0 miles away from the city center.
City:
40.3
U.S.:
33.3
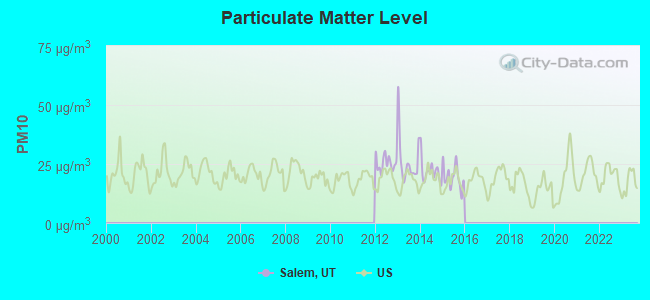
Particulate Matter (PM10) [µg/m3] level in 2015 was 19.4. This is about average.Closest monitor was 14.0 miles away from the city center.
City:
19.4
U.S.:
19.2
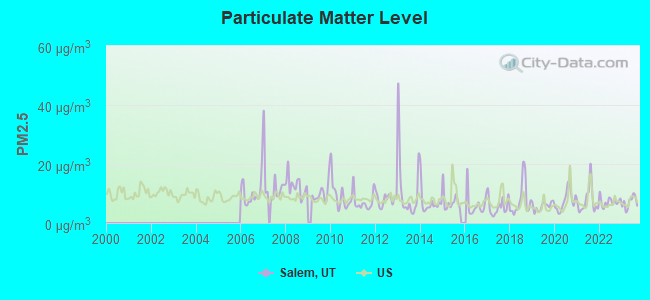
Particulate Matter (PM2.5) [µg/m3] level in 2023 was 6.95. This is about average.Closest monitor was 6.0 miles away from the city center.
City:
6.95
U.S.:
8.11
Earthquake activity:
Salem-area historical earthquake activity is significantly above Utah state average. It is 2535% greater than the overall U.S. average.
On 8/18/1959 at 06:37:13, a magnitude 7.7 (7.7 UK, Class: Major, Intensity: VIII - XII) earthquake occurred 316.6 miles away from the city center, causing $26,000,000 total damage On 10/3/1915 at 06:52:48, a magnitude 7.6 (7.6 UK) earthquake occurred 309.0 miles away from Salem center On 10/28/1983 at 14:06:06, a magnitude 7.3 (6.2 MB, 7.3 MS, 7.0 MW) earthquake occurred 299.2 miles away from the city center, causing 2 deaths (2 shaking deaths) and 3 injuries, causing $15,000,000 total damage On 3/28/1975 at 02:31:05, a magnitude 6.2 (6.1 MB, 6.0 MS, 6.2 ML, Class: Strong, Intensity: VII - IX) earthquake occurred 142.0 miles away from the city center On 12/21/1932 at 06:10:09, a magnitude 7.2 (7.2 UK) earthquake occurred 359.3 miles away from the city center On 3/18/2020 at 13:09:31, a magnitude 5.7 (5.7 MW, Depth: 7.4 mi, Class: Moderate, Intensity: VI - VII) earthquake occurred 52.9 miles away from the city center Magnitude types: body-wave magnitude (MB), local magnitude (ML), surface-wave magnitude (MS), moment magnitude (MW)
Natural disasters:
The number of natural disasters in Utah County (7) is smaller than the US average (15). Major Disasters (Presidential) Declared: 3 Emergencies Declared: 1
Causes of natural disasters: Floods: 3, Fires: 2, Landslides: 2, Storms: 2, Hurricane: 1, Mudslide: 1, Other: 1 (Note: some incidents may be assigned to more than one category).
Hospitals and medical centers near Salem:
ABSOLUTE COMPASSION HOME HEALTH (Home Health Center, about 3 miles away; PAYSON, UT)
MOUNTAIN VIEW HOSPITAL Acute Care Hospitals (about 3 miles away; PAYSON, UT)
MOUNTAIN VIEW HOSPITAL CONTINUING CARE CENTER (Nursing Home, about 3 miles away; PAYSON, UT)
PAYSON REGIONAL DIALYSIS (Dialysis Facility, about 3 miles away; PAYSON, UT)
MEDSHARES CENTRAL UTAH (Home Health Center, about 4 miles away; PAYSON, UT)
PARKWAY HEALTH CENTER (Nursing Home, about 4 miles away; PAYSON, UT)
SPANISH FORK NURSING AND REHAB (Nursing Home, about 5 miles away; SPANISH FORK, UT)
Utah County has a predicted average indoor radon screening level between 2 and 4 pCi/L (pico curies per liter) - Moderate Potential
Average household size:
This city:
3.7 people
Utah:
3.1 people
Percentage of family households:
This city:
87.2%
Whole state:
75.2%
Percentage of households with unmarried partners:
This city:
1.6%
Whole state:
4.6%
Likely homosexual households (counted as self-reported same-sex unmarried-partner households)
Lesbian couples: 0.2% of all households
Gay men: 0.2% of all households
15 people in nursing homes in 2000
Banks with branches in Salem (2011 data):
AmericanWest Bank: Salem Branch at 135 East 200 North On Highway 91, branch established on 1977/12/01. Info updated 2011/12/12: Bank assets: $2,274.6 mil, Deposits: $1,889.1 mil, headquarters in Spokane, WA, positive income, Commercial Lending Specialization, 76 total offices, Holding Company: Skbhc Holdings Llc
Capital Community Bank: Salem Office at 549 State Road 198, branch established on 2007/02/26. Info updated 2012/03/09: Bank assets: $112.2 mil, Deposits: $96.7 mil, headquarters in Provo, UT, positive income, Commercial Lending Specialization, 4 total offices, Holding Company: Capital Community Bancorporation, Inc.
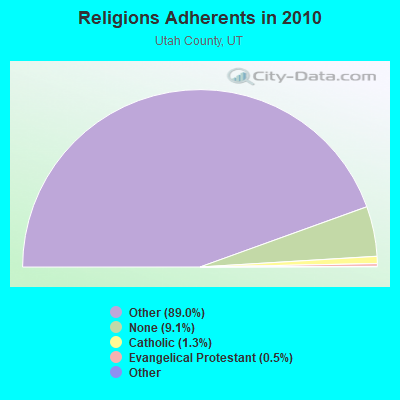
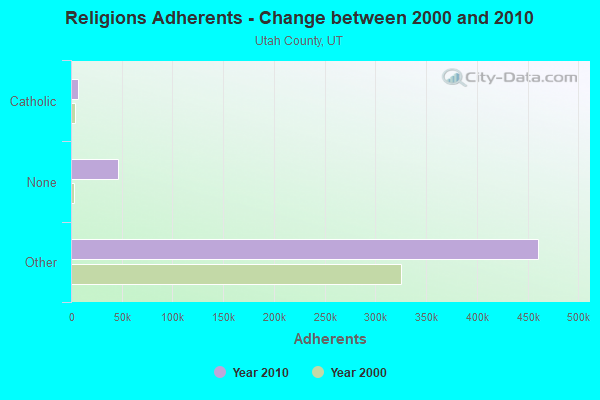
Religion statistics for Salem, UT (based on Utah County data)
Religion
Adherents
Congregations
Other
459,847
1,303
Catholic
6,792
4
Evangelical Protestant
2,540
26
Mainline Protestant
423
6
Black Protestant
211
1
None
46,751
-
Source: Clifford Grammich, Kirk Hadaway, Richard Houseal, Dale E.Jones, Alexei Krindatch, Richie Stanley and Richard H.Taylor. 2012. 2010 U.S.Religion Census: Religious Congregations & Membership Study. Association of Statisticians of American Religious Bodies. Jones, Dale E., et al. 2002. Congregations and Membership in the United States 2000. Nashville, TN: Glenmary Research Center. Graphs represent county-level data
Aircraft: CESSNA AIRCRAFT CO LC41-550FG (Category: Land, Seats: 4, Weight: Up to 12,499 Pounds), Engine: CONT MOTOR TSIO-550-C (310 HP) (Reciprocating) N-Number: 11390, N11390, N-11390, Serial Number: 411139, Year manufactured: 2009, Airworthiness Date: 04/03/2009, Certificate Issue Date: 06/18/2018 Registrant (Individual): Randy Jay Young, 666 Strawberry Rd, Salem, UT 84653
Aircraft: BUCKEYE AVIATION DREAM MACHINE 582 (Category: Land, Seats: 2, Weight: Up to 12,499 Pounds), Engine: ROTAX 582SER (65 HP) (2 Cycle) N-Number: 3519G, N3519G, N-3519G, Serial Number: 4871, Year manufactured: 2000, Airworthiness Date: 01/23/2008, Certificate Issue Date: 10/25/2018 Registrant (Individual): Damian Fink, 9851 S 400 E, Salem, UT 84653
Aircraft: MOONEY M20R (Category: Land, Seats: 2, Weight: Up to 12,499 Pounds), Engine: CONT MOTOR IO-550 SERIES (300 HP) (Reciprocating) N-Number: 35FC, N35FC, N-35FC, Serial Number: 29-0369, Airworthiness Date: 05/13/2005, Certificate Issue Date: 02/12/2019 Registrant (LLC): Convoyant LLC, 185 E 200 N, Salem, UT 84653
Aircraft: DESJARDINS RONALD V KITFOX II (Category: Land, Seats: 2, Weight: Up to 12,499 Pounds), Engine: BOMBARDIER ROTAX (ALL) (Reciprocating) N-Number: 547RD, N547RD, N-547RD, Serial Number: 547, Year manufactured: 1994, Airworthiness Date: 08/18/1994, Certificate Issue Date: 08/30/2019 Registrant (Individual): Kevin H Steadman, 377 W Salem Canal Rd, Salem, UT 84653
Aircraft: DJI PHANTOM 1 (Category: Land, Engines: 4), Engine: Electric N-Number: 5926P, N5926P, N-5926P, Serial Number: PH635117729 Registrant (Individual): Reported Sale, 240 S Main, Salem, UT 84653 Deregistered:Cancel Date: 11/28/1988
Aircraft: CESSNA 172RG (Category: Land, Seats: 4, Weight: Up to 12,499 Pounds), Engine: LYCOMING O&VO-360 SER (180 HP) (Reciprocating) N-Number: 6149V, N6149V, N-6149V, Serial Number: 172RG0587, Year manufactured: 1980, Airworthiness Date: 07/07/1980, Certificate Issue Date: 04/21/2020 Registrant (Individual): Patrick S Steadman, Po Box 832, Salem, UT 84653
Aircraft: SKYKITS CORP SAVANNAH VGW (Category: Land, Seats: 2, Weight: Up to 12,499 Pounds), Engine: ROTAX 912ULS SERIES (100 HP) (4 Cycle) N-Number: 81SK, N81SK, N-81SK, Serial Number: 09-06-51-834, Year manufactured: 2009, Airworthiness Date: 08/30/2011, Certificate Issue Date: 07/11/2016 Registrant (Individual): Rodney Miller, 135 W 100 S, Salem, UT 84653
Home Mortgage Disclosure Act Aggregated Statistics For Year 2009 (Based on 3 partial tracts)
A) FHA, FSA/RHS & VA Home Purchase Loans
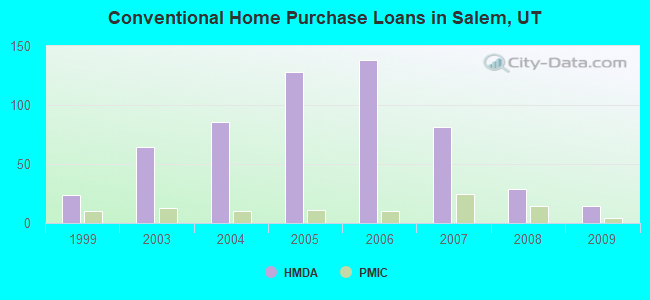
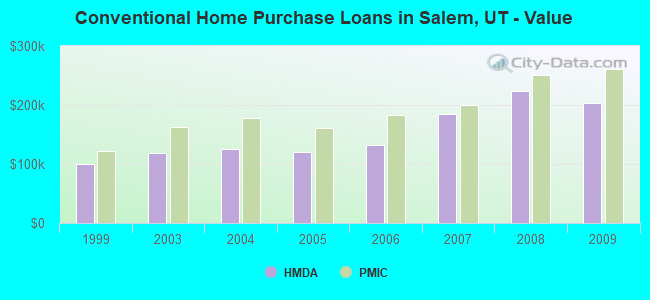
B) Conventional Home Purchase Loans
C) Refinancings
D) Home Improvement Loans
F) Non-occupant Loans on < 5 Family Dwellings (A B C & D)
G) Loans On Manufactured Home Dwelling (A B C & D)
Number
Average Value
Number
Average Value
Number
Average Value
Number
Average Value
Number
Average Value
Number
Average Value
LOANS ORIGINATED
37
$208,984
14
$202,742
202
$189,897
7
$86,781
4
$173,328
1
$147,640
APPLICATIONS APPROVED, NOT ACCEPTED
2
$243,800
2
$201,915
21
$198,264
0
$0
0
$0
0
$0
APPLICATIONS DENIED
7
$184,549
4
$189,955
44
$194,048
3
$55,780
3
$134,353
1
$93,170
APPLICATIONS WITHDRAWN
5
$207,380
1
$199,680
32
$199,355
1
$172,050
0
$0
0
$0
FILES CLOSED FOR INCOMPLETENESS
2
$158,670
0
$0
7
$179,774
0
$0
0
$0
0
$0
Aggregated Statistics For Year 2008 (Based on 3 partial tracts)
A) FHA, FSA/RHS & VA Home Purchase Loans
B) Conventional Home Purchase Loans
C) Refinancings
D) Home Improvement Loans
F) Non-occupant Loans on < 5 Family Dwellings (A B C & D)
G) Loans On Manufactured Home Dwelling (A B C & D)
Number
Average Value
Number
Average Value
Number
Average Value
Number
Average Value
Number
Average Value
Number
Average Value
LOANS ORIGINATED
16
$208,518
29
$224,320
138
$205,337
9
$62,617
6
$227,698
1
$115,130
APPLICATIONS APPROVED, NOT ACCEPTED
2
$147,105
4
$229,182
25
$217,614
1
$218,070
2
$212,110
0
$0
APPLICATIONS DENIED
4
$171,962
14
$266,228
58
$227,411
7
$113,080
4
$310,475
2
$101,560
APPLICATIONS WITHDRAWN
2
$188,910
5
$230,838
18
$212,031
3
$205,763
1
$124,310
0
$0
FILES CLOSED FOR INCOMPLETENESS
1
$227,440
2
$188,410
6
$248,797
1
$47,990
1
$351,820
0
$0
Aggregated Statistics For Year 2007 (Based on 3 partial tracts)
A) FHA, FSA/RHS & VA Home Purchase Loans
B) Conventional Home Purchase Loans
C) Refinancings
D) Home Improvement Loans
F) Non-occupant Loans on < 5 Family Dwellings (A B C & D)
G) Loans On Manufactured Home Dwelling (A B C & D)
Number
Average Value
Number
Average Value
Number
Average Value
Number
Average Value
Number
Average Value
Number
Average Value
LOANS ORIGINATED
6
$146,717
81
$183,989
146
$204,878
11
$95,257
18
$235,517
2
$102,020
APPLICATIONS APPROVED, NOT ACCEPTED
0
$0
12
$239,800
28
$248,932
3
$135,640
2
$174,460
0
$0
APPLICATIONS DENIED
2
$172,800
23
$233,239
69
$214,327
7
$106,520
12
$239,506
1
$32,410
APPLICATIONS WITHDRAWN
0
$0
8
$260,913
26
$206,020
1
$151,470
2
$163,730
0
$0
FILES CLOSED FOR INCOMPLETENESS
0
$0
1
$228,370
8
$364,209
0
$0
1
$204,810
0
$0
Aggregated Statistics For Year 2006 (Based on 3 partial tracts)
A) FHA, FSA/RHS & VA Home Purchase Loans
B) Conventional Home Purchase Loans
C) Refinancings
D) Home Improvement Loans
F) Non-occupant Loans on < 5 Family Dwellings (A B C & D)
G) Loans On Manufactured Home Dwelling (A B C & D)
Number
Average Value
Number
Average Value
Number
Average Value
Number
Average Value
Number
Average Value
Number
Average Value
LOANS ORIGINATED
11
$153,233
138
$131,385
120
$157,576
12
$75,005
17
$139,875
1
$66,070
APPLICATIONS APPROVED, NOT ACCEPTED
2
$121,300
17
$159,306
25
$136,137
1
$83,400
2
$163,620
0
$0
APPLICATIONS DENIED
0
$0
39
$136,659
67
$139,203
7
$57,053
7
$167,114
2
$40,460
APPLICATIONS WITHDRAWN
0
$0
14
$162,245
31
$170,667
2
$63,430
3
$148,873
0
$0
FILES CLOSED FOR INCOMPLETENESS
0
$0
3
$178,957
9
$145,334
0
$0
0
$0
0
$0
Aggregated Statistics For Year 2005 (Based on 3 partial tracts)
A) FHA, FSA/RHS & VA Home Purchase Loans
B) Conventional Home Purchase Loans
C) Refinancings
D) Home Improvement Loans
F) Non-occupant Loans on < 5 Family Dwellings (A B C & D)
G) Loans On Manufactured Home Dwelling (A B C & D)
Number
Average Value
Number
Average Value
Number
Average Value
Number
Average Value
Number
Average Value
Number
Average Value
LOANS ORIGINATED
9
$152,267
128
$120,235
102
$144,642
9
$37,704
15
$126,905
0
$0
APPLICATIONS APPROVED, NOT ACCEPTED
1
$154,020
19
$119,213
21
$130,736
2
$64,010
4
$126,538
0
$0
APPLICATIONS DENIED
2
$141,620
24
$109,876
63
$156,778
13
$60,149
7
$115,709
1
$47,530
APPLICATIONS WITHDRAWN
1
$163,420
17
$115,395
28
$152,197
8
$110,756
4
$109,945
0
$0
FILES CLOSED FOR INCOMPLETENESS
1
$69,380
6
$136,237
17
$142,949
0
$0
3
$92,273
0
$0
Aggregated Statistics For Year 2004 (Based on 3 partial tracts)
A) FHA, FSA/RHS & VA Home Purchase Loans
B) Conventional Home Purchase Loans
C) Refinancings
D) Home Improvement Loans
F) Non-occupant Loans on < 5 Family Dwellings (A B C & D)
G) Loans On Manufactured Home Dwelling (A B C & D)
Number
Average Value
Number
Average Value
Number
Average Value
Number
Average Value
Number
Average Value
Number
Average Value
LOANS ORIGINATED
16
$140,661
86
$124,760
126
$127,385
6
$50,075
12
$108,507
1
$93,220
APPLICATIONS APPROVED, NOT ACCEPTED
1
$78,230
12
$125,512
29
$126,319
2
$56,010
2
$169,650
1
$149,540
APPLICATIONS DENIED
1
$167,720
17
$113,272
60
$140,923
9
$63,760
7
$114,451
0
$0
APPLICATIONS WITHDRAWN
1
$161,440
9
$126,744
36
$151,463
2
$70,150
3
$81,577
1
$89,910
FILES CLOSED FOR INCOMPLETENESS
0
$0
3
$113,367
16
$167,864
0
$0
0
$0
0
$0
Aggregated Statistics For Year 2003 (Based on 3 partial tracts)
A) FHA, FSA/RHS & VA Home Purchase Loans
B) Conventional Home Purchase Loans
C) Refinancings
D) Home Improvement Loans
F) Non-occupant Loans on < 5 Family Dwellings (A B C & D)
Number
Average Value
Number
Average Value
Number
Average Value
Number
Average Value
Number
Average Value
LOANS ORIGINATED
18
$138,107
64
$119,174
276
$138,012
3
$83,063
12
$120,658
APPLICATIONS APPROVED, NOT ACCEPTED
0
$0
10
$130,909
33
$132,191
1
$7,800
2
$185,310
APPLICATIONS DENIED
1
$164,380
13
$115,284
71
$142,506
6
$29,385
5
$130,054
APPLICATIONS WITHDRAWN
2
$145,770
8
$99,460
35
$141,739
1
$48,260
2
$82,660
FILES CLOSED FOR INCOMPLETENESS
1
$88,950
1
$68,920
9
$184,393
1
$25,230
0
$0
Aggregated Statistics For Year 1999 (Based on 1 partial tract)
A) FHA, FSA/RHS & VA Home Purchase Loans
B) Conventional Home Purchase Loans
C) Refinancings
D) Home Improvement Loans
F) Non-occupant Loans on < 5 Family Dwellings (A B C & D)
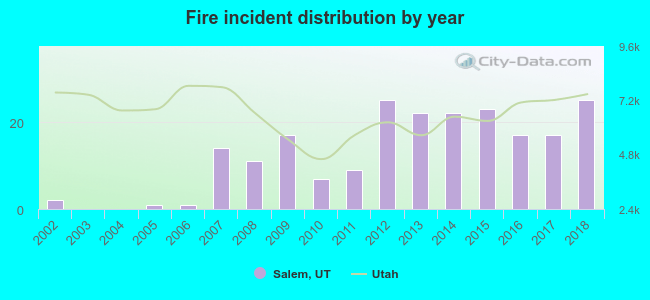
2002 - 2018 National Fire Incident Reporting System (NFIRS) incidents
According to the data from the years 2002 - 2018 the average number of fires per year is 13. The highest number of fires - 25 took place in 2012, and the least - 0 in 2003. The data has a rising trend.
When looking into fire subcategories, the most reports belonged to: Outside Fires (60.1%), and Structure Fires (26.8%).
Fire incident types reported to NFIRS in Salem, UT
#30 on the list of "Top 101 cities with largest percentage of females in occupations: installation, maintenance, and repair occupations (population 5,000+)"
#75 on the list of "Top 101 cities with the lowest number of assaults per 100,000 residents (population 5,000+)"
#85 on the list of "Top 101 cities with largest percentage of females in occupations: office and administrative support occupations (population 5,000+)"
#11 (84653) on the list of "Top 101 zip codes with the largest percentage of English first ancestries (pop 5,000+)"
#13 (84653) on the list of "Top 101 zip codes with the largest charity contributions deductions as a percentage of AGI in 2012 (pop 5,000+)"
#39 (84653) on the list of "Top 101 zip codes with the largest percentage of Danish first ancestries (pop 5,000+)"
#40 (84653) on the list of "Top 101 zip codes with the largest percentage of Welsh first ancestries (pop 5,000+)"
#1 on the list of "Top 101 counties with the lowest percentage of residents that smoked 100+ cigarettes in their lives"
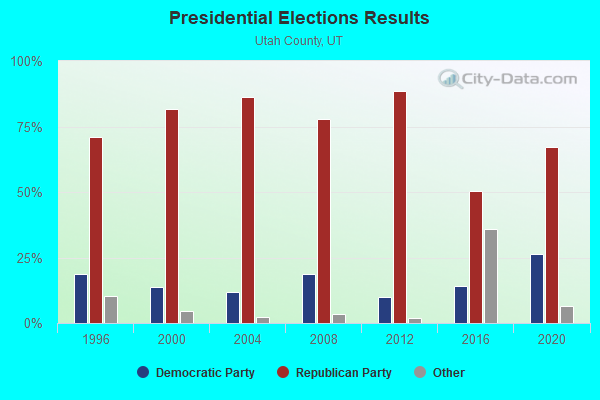
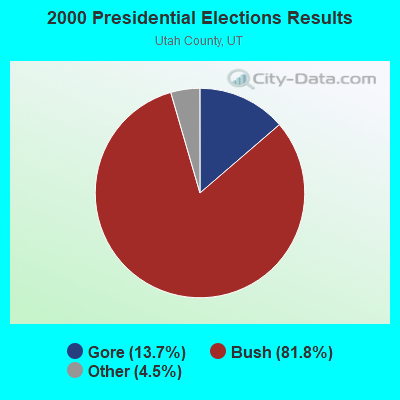
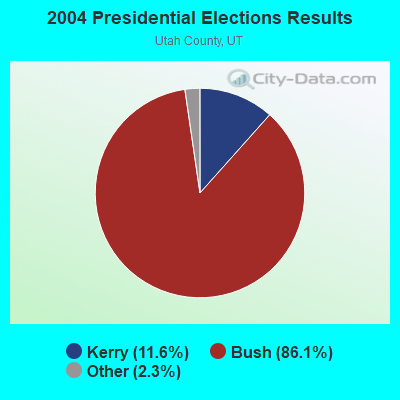
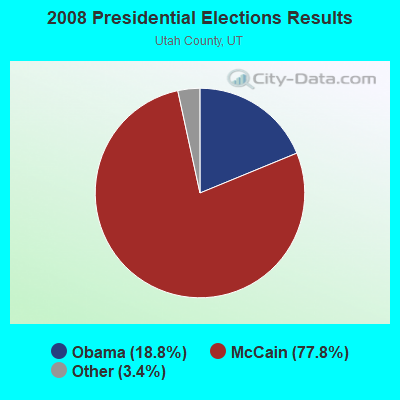
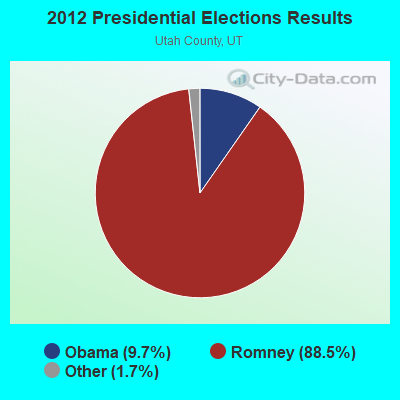
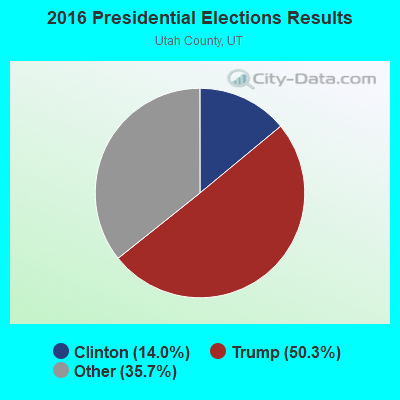
#1 on the list of "Top 101 counties with highest percentage of residents voting for Romney (Republican) in the 2012 Presidential Election (pop. 50,000+)"
#1 on the list of "Top 101 counties with the highest number of births per 1000 residents 2007-2013"
#2 on the list of "Top 101 counties with the most Other adherents"
#2 on the list of "Top 101 counties with the most Other congregations"


 Recent articles from our blog. Our writers, many of them Ph.D. graduates or candidates, create easy-to-read articles on a wide variety of topics.

 (13.4 miles
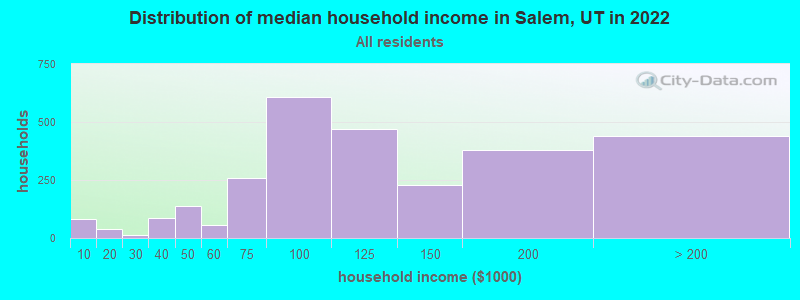


 According to the data from the years 2002 - 2018 the average number of fires per year is 13. The highest number of fires - 25 took place in 2012, and the least - 0 in 2003. The data has a rising trend.
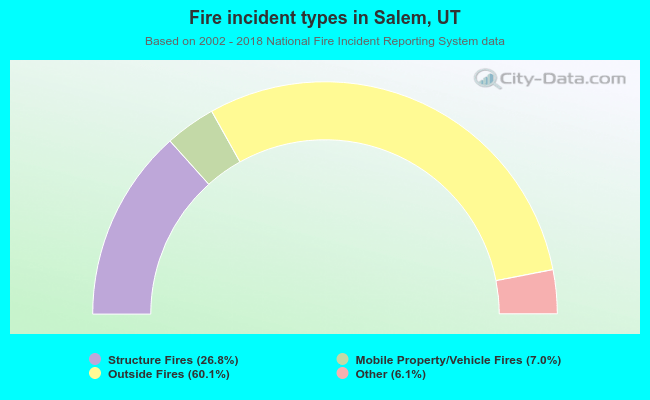 When looking into fire subcategories, the most reports belonged to: Outside Fires (60.1%), and Structure Fires (26.8%).