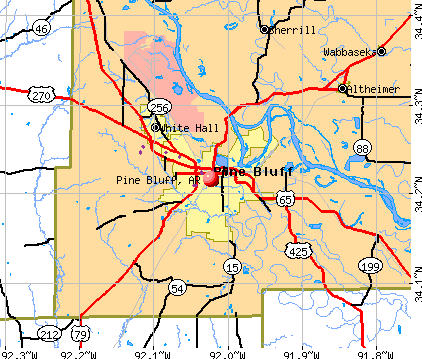
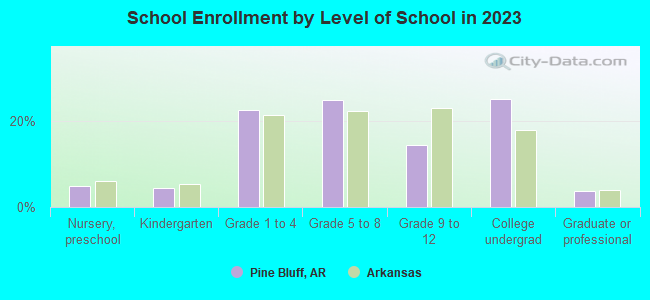
Pine Bluff, Arkansas
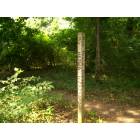
Pine Bluff: Delta Rivers Nature Center in PineBluff Arkansas on the trail walk
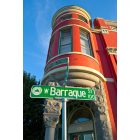
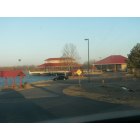
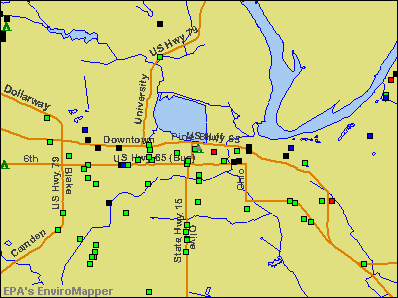
Pine Bluff: Downtown Pine Bluff.
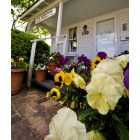
Pine Bluff: Dexter Harding House tourist information center in downtown Pine Bluff.
Pine Bluff: downtown area
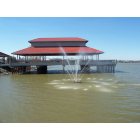
Pine Bluff: Landing Waterfall
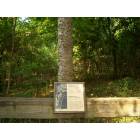
Pine Bluff: Toothache Tree In Arkansas
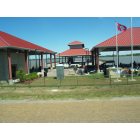
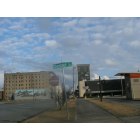
Pine Bluff: Landing at PineBluff
Pine Bluff: saracen landing
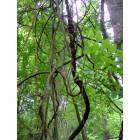
Pine Bluff: Vines growing in the bayou at the Delta Rivers Nature Center

Pine Bluff: The sunset one day in Pine Bluff from my back yard
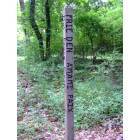
Pine Bluff: "May Peace Prevail" (Found on the Discovery Trail at the Gov. Mike Huckabee Delta Rivers Nature Center)
- add
your
Submit your own pictures of this city and show them to the world
- OSM Map
- General Map
- Google Map
- MSN Map
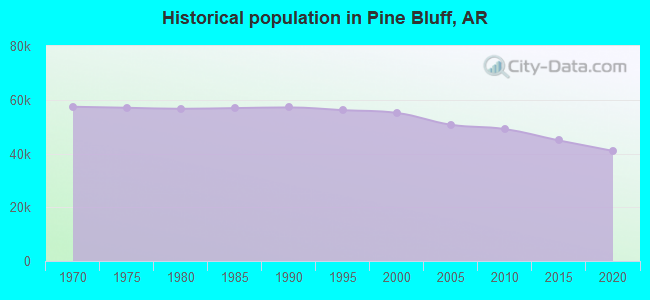
Population change since 2000: -28.3%
 |
| Males: 18,909 | |
| Females: 20,586 |
| Median resident age: | 37.4 years |
| Arkansas median age: | 38.9 years |
Zip codes: 71601, 71602, 71603.
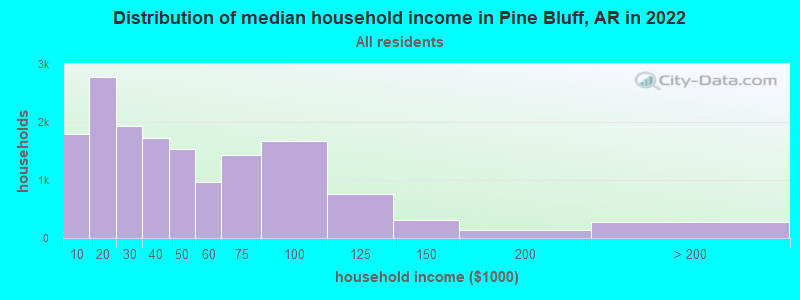
Pine Bluff Zip Code Map| Pine Bluff: | $37,501 |
| AR: | $55,432 |
Estimated per capita income in 2022: $19,674 (it was $14,637 in 2000)
Pine Bluff city income, earnings, and wages data
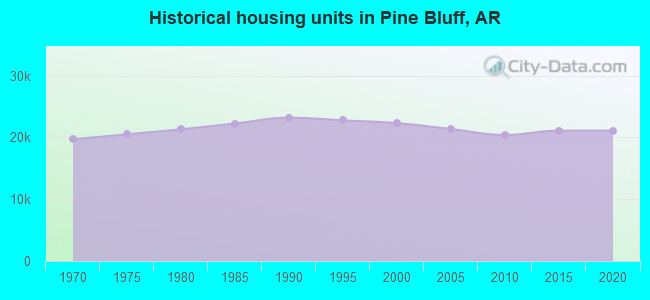
Estimated median house or condo value in 2022: $80,445 (it was $50,000 in 2000)
| Pine Bluff: | $80,445 |
| AR: | $179,800 |
Mean prices in 2022: all housing units: $139,351; detached houses: $145,125; townhouses or other attached units: $139,286; in 2-unit structures: $228,144; mobile homes: $23,480
Median gross rent in 2022: $773.
(26.8% for White Non-Hispanic residents, 24.6% for Black residents, 3.4% for Hispanic or Latino residents, 43.1% for American Indian residents, 13.9% for other race residents, 35.2% for two or more races residents)
Detailed information about poverty and poor residents in Pine Bluff, AR


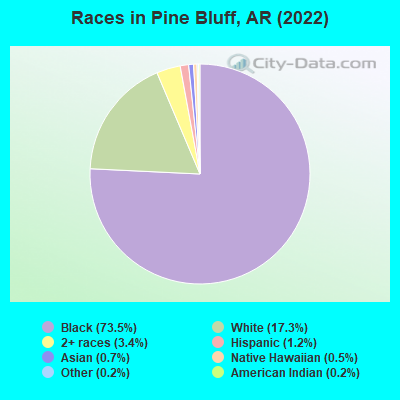
- 30,51273.5%Black alone
- 7,17317.3%White alone
- 1,4023.4%Two or more races
- 4961.2%Hispanic
- 3080.7%Asian alone
- 1900.5%Native Hawaiian and Other
Pacific Islander alone - 800.2%American Indian alone
- 960.2%Other race alone
According to our research of Arkansas and other state lists, there were 204 registered sex offenders living in Pine Bluff, Arkansas as of April 27, 2024.
The ratio of all residents to sex offenders in Pine Bluff is 224 to 1.
The City-Data.com crime index weighs serious crimes and violent crimes more heavily. Higher means more crime, U.S. average is 246.1. It adjusts for the number of visitors and daily workers commuting into cities.
- means the value is much bigger than the state average.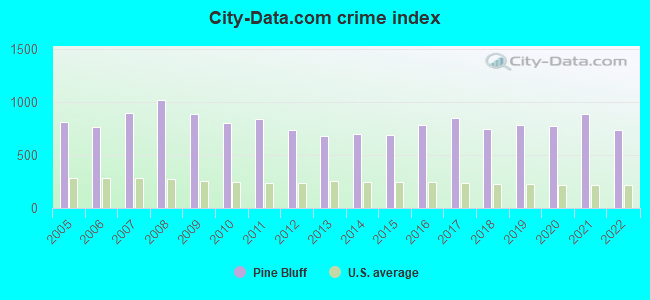
Crime rate in Pine Bluff detailed stats: murders, rapes, robberies, assaults, burglaries, thefts, arson
Full-time law enforcement employees in 2021, including police officers: 124 (102 officers - 73 male; 29 female).
| Officers per 1,000 residents here: | 2.57 |
| Arkansas average: | 2.25 |
 Recent articles from our blog. Our writers, many of them Ph.D. graduates or candidates, create easy-to-read articles on a wide variety of topics.

 | Dollarway School District merging into Pine Bluff School District on July 1 (0 replies) |
| Would Merging The Four NWA Cities Stop The Fighting?? (37 replies) |
| Pine Bluff Gains NEW Resident (45 replies) |
| First case of Coronavirus here (802 replies) |
| Gardening in Pine Bluff (19 replies) |
| Is Arkansas what I'm looking for? (54 replies) |
Latest news from Pine Bluff, AR collected exclusively by city-data.com from local newspapers, TV, and radio stations
Ancestries: African (9.4%), English (3.4%), American (2.2%).
Current Local Time: CST time zone
Incorporated on 01/10/1839
Elevation: 220 feet
Land area: 45.6 square miles.
Population density: 866 people per square mile (low).
535 residents are foreign born
| This city: | 1.4% |
| Arkansas: | 5.0% |
Median real estate property taxes paid for housing units with mortgages in 2022: $799 (0.7%)
Median real estate property taxes paid for housing units with no mortgage in 2022: $470 (0.7%)
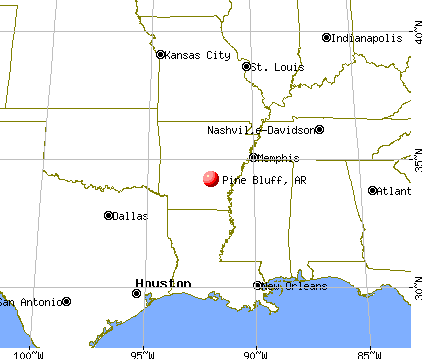
Nearest city with pop. 200,000+: Memphis, TN  (132.3 miles , pop. 650,100).
Nearest city with pop. 1,000,000+: Dallas, TX (291.7 miles , pop. 1,188,580).
Nearest cities:
), ), ), )Latitude: 34.22 N, Longitude: 92.02 W
Daytime population change due to commuting: +3,787 (+9.6%)
Workers who live and work in this city: 11,605 (77.8%)
Area code: 870

Pine Bluff tourist attractions:
Pine Bluff, Arkansas accommodation & food services, waste management - Economy and Business Data
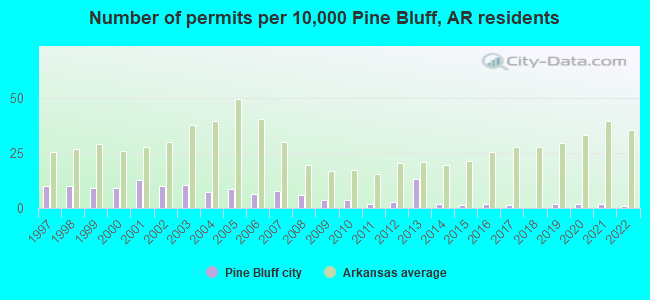
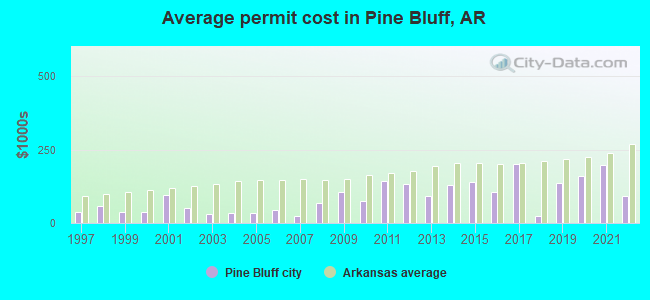
Single-family new house construction building permits:
- 2022: 6 buildings, average cost: $91,200
- 2021: 10 buildings, average cost: $197,800
- 2020: 10 buildings, average cost: $159,200
- 2019: 10 buildings, average cost: $135,400
- 2018: 1 building, cost: $24,000
- 2017: 8 buildings, average cost: $201,800
- 2016: 10 buildings, average cost: $104,300
- 2015: 8 buildings, average cost: $140,800
- 2014: 11 buildings, average cost: $131,000
- 2013: 73 buildings, average cost: $90,600
- 2012: 15 buildings, average cost: $133,700
- 2011: 10 buildings, average cost: $141,500
- 2010: 21 buildings, average cost: $76,300
- 2009: 19 buildings, average cost: $104,200
- 2008: 32 buildings, average cost: $69,000
- 2007: 43 buildings, average cost: $24,300
- 2006: 36 buildings, average cost: $44,500
- 2005: 48 buildings, average cost: $33,100
- 2004: 40 buildings, average cost: $33,400
- 2003: 57 buildings, average cost: $32,400
- 2002: 55 buildings, average cost: $50,600
- 2001: 69 buildings, average cost: $96,100
- 2000: 50 buildings, average cost: $38,100
- 1999: 50 buildings, average cost: $37,400
- 1998: 56 buildings, average cost: $59,300
- 1997: 55 buildings, average cost: $35,700
| Here: | 5.4% |
| Arkansas: | 3.4% |
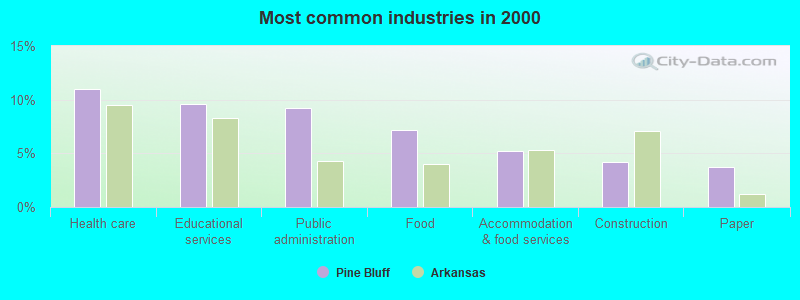
- Health care (11.0%)
- Educational services (9.6%)
- Public administration (9.2%)
- Food (7.2%)
- Accommodation & food services (5.2%)
- Construction (4.2%)
- Paper (3.7%)
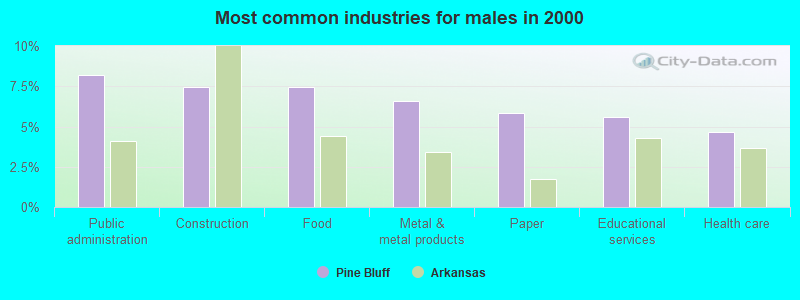
- Public administration (8.2%)
- Construction (7.5%)
- Food (7.5%)
- Metal & metal products (6.6%)
- Paper (5.8%)
- Educational services (5.6%)
- Health care (4.7%)
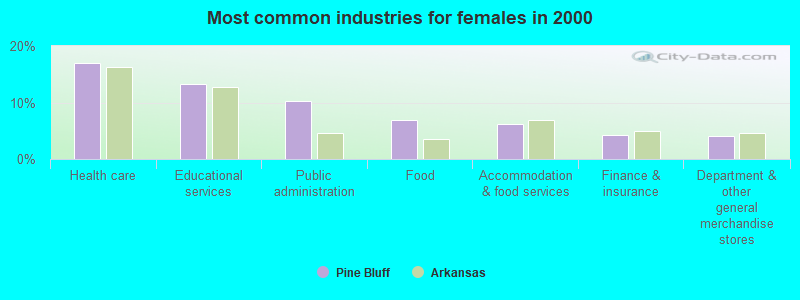
- Health care (16.9%)
- Educational services (13.3%)
- Public administration (10.2%)
- Food (7.0%)
- Accommodation & food services (6.3%)
- Finance & insurance (4.2%)
- Department & other general merchandise stores (4.1%)
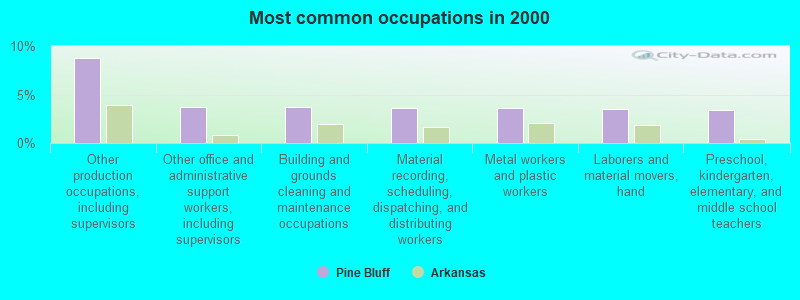
- Other production occupations, including supervisors (8.7%)
- Other office and administrative support workers, including supervisors (3.7%)
- Building and grounds cleaning and maintenance occupations (3.7%)
- Material recording, scheduling, dispatching, and distributing workers (3.6%)
- Metal workers and plastic workers (3.6%)
- Laborers and material movers, hand (3.5%)
- Preschool, kindergarten, elementary, and middle school teachers (3.4%)

- Other production occupations, including supervisors (11.6%)
- Metal workers and plastic workers (5.7%)
- Laborers and material movers, hand (4.7%)
- Material recording, scheduling, dispatching, and distributing workers (4.2%)
- Building and grounds cleaning and maintenance occupations (3.8%)
- Law enforcement workers, including supervisors (3.7%)
- Driver/sales workers and truck drivers (3.6%)
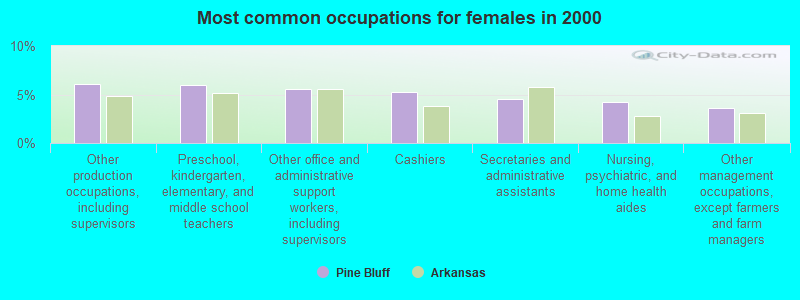
- Other production occupations, including supervisors (6.1%)
- Preschool, kindergarten, elementary, and middle school teachers (6.0%)
- Other office and administrative support workers, including supervisors (5.6%)
- Cashiers (5.3%)
- Secretaries and administrative assistants (4.5%)
- Nursing, psychiatric, and home health aides (4.2%)
- Other management occupations, except farmers and farm managers (3.6%)
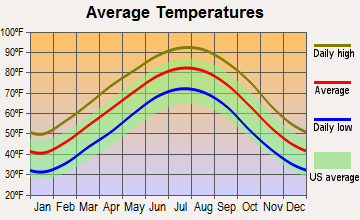
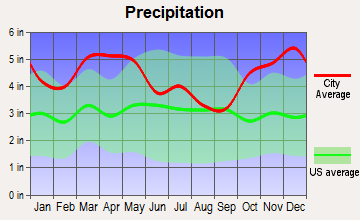
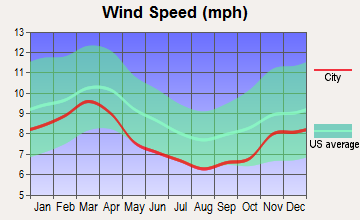
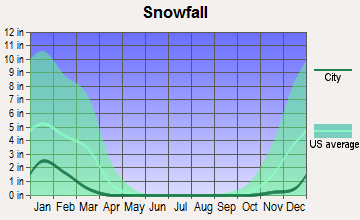
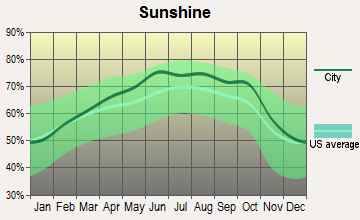
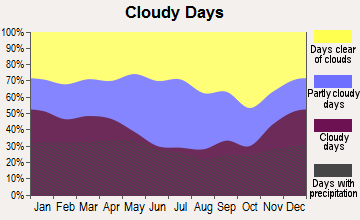
Average climate in Pine Bluff, Arkansas
Based on data reported by over 4,000 weather stations

|
|

Tornado activity:
Pine Bluff-area historical tornado activity is near Arkansas state average. It is 108% greater than the overall U.S. average.
On 4/3/1968, a category F4 (max. wind speeds 207-260 mph) tornado 22.8 miles away from the Pine Bluff city center killed 5 people and injured 16 people and caused between $50,000 and $500,000 in damages.
On 5/14/1983, a category F3 (max. wind speeds 158-206 mph) tornado 3.0 miles away from the city center injured 2 people and caused between $500,000 and $5,000,000 in damages.
Earthquake activity:
Pine Bluff-area historical earthquake activity is significantly above Arkansas state average. It is 424% greater than the overall U.S. average.On 1/21/1982 at 00:33:54, a magnitude 4.7 (4.5 MB, 4.7 LG, 4.5 LG, Class: Light, Intensity: IV - V) earthquake occurred 66.8 miles away from Pine Bluff center
On 5/4/2001 at 06:42:12, a magnitude 4.7 (4.2 MB, 4.7 LG, 4.5 LG) earthquake occurred 69.0 miles away from the city center
On 3/25/1976 at 00:41:20, a magnitude 5.0 (4.9 MB, 5.0 LG, Class: Moderate, Intensity: VI - VII) earthquake occurred 137.5 miles away from the city center
On 2/28/2011 at 05:00:50, a magnitude 4.7 (4.7 MW, Depth: 2.0 mi) earthquake occurred 75.2 miles away from the city center
On 11/6/2011 at 03:53:10, a magnitude 5.7 (5.7 MW, Depth: 3.2 mi) earthquake occurred 284.0 miles away from Pine Bluff center
On 9/3/2016 at 12:02:44, a magnitude 5.8 (5.8 MW, Depth: 3.5 mi) earthquake occurred 316.2 miles away from the city center
Magnitude types: regional Lg-wave magnitude (LG), body-wave magnitude (MB), moment magnitude (MW)
Natural disasters:
The number of natural disasters in Jefferson County (18) is near the US average (15).Major Disasters (Presidential) Declared: 14
Emergencies Declared: 2
Causes of natural disasters: Storms: 13, Floods: 12, Tornadoes: 6, Winds: 4, Winter Storms: 2, Heavy Rain: 1, Hurricane: 1, Other: 1 (Note: some incidents may be assigned to more than one category).
Main business address for: SIMMONS FIRST NATIONAL CORP (NATIONAL COMMERCIAL BANKS).
Hospitals in Pine Bluff:
- HOSPICE CARE SERVICES (3801 CAMDEN ROAD, CHAPEL VILLAGE, SUITE 12)
- HOSPICE HOME CARE INC OF PINE (3801 WEST 28TH STREET)
- JEFFERSON REGIONAL HOSPICE (1600 WEST 40TH AVENUE)
- JEFFERSON REGIONAL MEDICAL CENTER (Voluntary non-profit - Private, provides emergency services, 1600 WEST 40TH AVENUE)
- JEFFERSON SURGERY CENTER PLLC (1609 WEST 40TH AVENUE, SUITE 103)
- SOUTHEAST ARKANSAS HOSPICE CARE (1401 STATE STREET)
Nursing Homes in Pine Bluff:
- ARKANSAS CONVALESCENT CENTER (6301 SOUTH HAZEL)
- DAVIS EAST (6811 SOUTH HAZEL STREET)
- DAVIS LIFE CARE CENTER (6810 SOUTH HAZEL)
- JEFFERSON CONVALESCENT HOME INC (3406 WEST 7TH)
- OAK PARK NH (P O BOX 2618)
- PARK HEALTHCARE (2610 WEST 36TH)
- PINE RIDGE HEALTHCARE, LLC (1501 BAY STREET)
- TRINITY VILLAGE MEDICAL CENTER (6400 TRINITY DRIVE)
Dialysis Facilities in Pine Bluff:
Home Health Centers in Pine Bluff:
Airports and heliports located in Pine Bluff:
- Grider Field Airport (PBF) (Runways: 1, Air Taxi Ops: 300, Itinerant Ops: 4,000, Local Ops: 6,000, Military Ops: 100)
- Jrmc Heliport (13AR)
Colleges/Universities in Pine Bluff:
- University of Arkansas at Pine Bluff (Full-time enrollment: 2,558; Location: 1200 N University Mail Slot 4789; Public; Website: www.uapb.edu; Offers Doctor's degree)
- Southeast Arkansas College (Full-time enrollment: 1,251; Location: 1900 Hazel St.; Public; Website: www.seark.edu)
- Jefferson Regional Medical Center School of Nursing (Full-time enrollment: 126; Location: 1600 West 40th St; Private, not-for-profit; Website: www.jrmc.org)
- Arthur's Beauty School Inc-Pine Bluff (Full-time enrollment: 39; Location: 2710 Commerce Circle; Private, for-profit; Website: www.arthursbeautycollege.com)
Other colleges/universities with over 2000 students near Pine Bluff:
- University of Arkansas at Little Rock (about 40 miles; Little Rock, AR; Full-time enrollment: 9,227)
- Pulaski Technical College (about 43 miles; North Little Rock, AR; FT enrollment: 8,396)
- University of Arkansas at Monticello (about 46 miles; Monticello, AR; FT enrollment: 3,130)
- Henderson State University (about 60 miles; Arkadelphia, AR; FT enrollment: 3,528)
- Arkansas State University-Beebe (about 60 miles; Beebe, AR; FT enrollment: 3,387)
- University of Central Arkansas (about 65 miles; Conway, AR; FT enrollment: 9,972)
- National Park Community College (about 66 miles; Hot Springs, AR; FT enrollment: 2,237)
Public high schools in Pine Bluff:
- JEFFERSON AREA VOCATIONAL CENTER (Location: 221 S BEECH ST, Grades: 9-12)
- ARKANSAS CORRECTIONAL SCHOOL (Location: 8000 CORRECTION CIR, Grades: 9-12)
- PINE BLUFF HIGH SCHOOL (Location: 711 W 11TH ST, Grades: 10-12)
- JACK ROBEY JR. HIGH SCHOOL (Location: 4101 OLIVE ST, Grades: 8-9)
- DOLLARWAY HIGH SCHOOL (Location: 4900 DOLLARWAY RD, Grades: 9-12)
- WATSON CHAPEL HIGH SCHOOL (Location: 4000 CAMDEN RD, Grades: 10-12)
- WATSON CHAPEL JR. HIGH SCHOOL (Location: 3900 CAMDEN RD, Grades: 7-9)
Private high schools in Pine Bluff:
Biggest public elementary/middle schools in Pine Bluff:
- BELAIR MIDDLE SCHOOL (Location: 1301 COMMERCE RD, Grades: 6-7)
- BROADMOOR ELEMENTARY SCHOOL (Location: 1106 WISCONSIN ST, Grades: KG-5)
- OAK PARK ELEMENTARY SCHOOL (Location: 2900 ORANGE ST, Grades: KG-5)
- SOUTHEAST MIDDLE SCHOOL (Location: 2001 OHIO ST, Grades: 6-7)
- SOUTHWOOD ELEMENTARY SCHOOL (Location: 4200 FIR ST, Grades: KG-5)
- THIRTY-FOURTH AVE. ELEM. SCH. (Location: 801 E 34TH AVE, Grades: KG-5)
- W. T. CHENEY ELEMENTARY SCHOOL (Location: 2206 RIDGWAY RD, Grades: KG-5)
- PINE BLUFF LIGHTHOUSE ACADEMY (Location: 708 W SECOND ST, Grades: KG-4, Charter school)
- PB LIGHTHOUSE UPPER ACADEMY (Location: 708 W SECOND AVE, Grades: 5-7, Charter school)
- QUEST MIDDLE SCHOOL OF PINE BLUFF (Location: 308 SOUTH BLAKE ST, Grades: 5-8, Charter school)
Private elementary/middle school in Pine Bluff:
Library in Pine Bluff:
Points of interest:
Notable locations in Pine Bluff: Southeast Arkansas Livestock Showgrounds (A), Eden Park Country Club (B), Pine Bluff Country Club (C), Pine Bluff Port (D), Arkansas Department of Correction Womens Unit (E), Jefferson County Courthouse (F), Pine Bluff Convention Center (G), Pine Bluff Fire Department Station 1 (H), Pine Bluff Fire Department Station 2 (I), Pine Bluff Fire Department Station 3 (J), Pine Bluff Fire Department Station 4 (K), Pine Bluff Fire Department Station 5 (L), Pine Bluff Fire Department Station 6 (M), Pine Bluff Fire Department Station 7 (N), Emergency Ambulance Service (O), Arkansas State Police Criminal Investigations Division Company B (P), Pine Bluff Police Department (Q), Federal Bureau of Investigation Pine Bluff Resident Office (R), Arkansas State Police Troop E (S), Jefferson County Sheriff's Office (T). Display/hide their locations on the map
Shopping Centers: Chapel Village Shopping Center (1), Jefferson Square Shopping Center (2), Olive Street Plaza Shopping Center (3), Camelot Shopping Center (4), Broadmoor Shopping Center (5), Southwest Plaza Shopping Center (6), Oak Park Village Shopping Center (7), East Plaza Shopping Center (8), Magic Mart Shopping Center (9). Display/hide their locations on the map
Main business address in Pine Bluff: SIMMONS FIRST NATIONAL CORP (A). Display/hide its location on the map
Churches in Pine Bluff include: Morning Star Church (A), Hopewell Church (B), Mount Calvary Baptist Church (C), Mount Zion Church (D), New Saint Hurricane Baptist Church (E), Oakland Church (F), Lamkin Chapel Missionary Baptist Church (G), New Hope Christian Methodist Episcopal Church (H), The Apostolic Church (I). Display/hide their locations on the map
Cemeteries: Bellwood Cemetery (1), Smith Chapel Cemetery (2), Greenlee Cemetery (3), Graceland Cemetery (4), Good Faith Cemetery (5), Miller Cemetery (6), Taylor Cemetery (7). Display/hide their locations on the map
Reservoirs: Midland Lake (A), Phillips Lake (B), Lake Pine Bluff (C). Display/hide their locations on the map
Streams, rivers, and creeks: Nevins Creek (A), Harding Drain (B), Caney Bayou (C). Display/hide their locations on the map
Parks in Pine Bluff include: Oakland Park (1), Hutson Park (2), Central Park (3), Belmont Park (4), Pine Bluff Regional Park (5), Townsend Park (6), Lake Pine Bluff Park (7), Poplar Street Park (8), Sainte Marie Public Use Area (9). Display/hide their locations on the map
Tourist attractions: Community Concerts (Museums; 423 South Main Street) (1), Pine Bluff Jefferson County Historical Museum (201 East 4th Avenue) (2), Arts & Science Center for Southeast Arkansas (Museums; 701 South Main Street) (3), Arkansas Railroad Museum (1700 Port Road) (4), Band Museum (423 South Main Street) (5), Pine Bluff-City - Arts & Science Center (Museums; 701 South Main Street) (6), Johnson- Siegfried LBR - Residence (Cultural Attractions- Events- & Facilities; 503 West 33rd Avenue) (7), Slots of Fun (Amusement & Theme Parks; 4204 West 28th Avenue) (8), Lucky Spot Arcade (Amusement & Theme Parks; 1602 South Ohio Street) (9). Display/hide their approximate locations on the map
Hotels: Ramada Inn & Suites Convention Hotel (Two Convention Center Plaza 8th St & Convention Ctr Plaza) (1), Windsor Inn Inc (2902 East Harding Avenue) (2), Days Inn & Suites (406 North Blake Street) (3), Economy Inn (4600 Dollarway Road) (4), Classic Inn (4125 Rhinehart Road) (5), Billi-Sox Lounge (4125 Rhinehart Road) (6), Comfort Inn Pine Bluff (2809 Pines Mall Drive) (7), Super 8 Motel (3008 Market Street) (8), America's Best Inn (2700 East Harding Avenue) (9). Display/hide their approximate locations on the map
Courts: Jefferson-County - Court House Offices- Sheriff's Department- Patrol Divi (113 South Main Street) (1), Federal Bureau Of Investigation (100 East 8th Avenue) (2), Brooks Iris L Certified Court Report - Residence (105 West 37th) (3), Jefferson-County - Court House Offices- Sheriff's Department- Criminal Investigation Divi (117 South Main Street) (4), Jefferson-County - Court House Offices- Sheriff's Department- Educational Programs Junior De (109 South Main Street) (5), Police - Non-Emergencies- Jefferson County Sheriff (Court House) (6), Jefferson-County - Court House Offices- Personal Property- Main Office (Barraque Main Street) (7), Jefferson-County - Court Offices- Circuit Chancery Court- Juvenile Division- Juvenile Justice Ce (301 East 2nd Avenue) (8), Pine Bluff-City - District Court Clerk Division I (200 East 8th Avenue) (9). Display/hide their approximate locations on the map
Birthplace of: Beth Holloway - Mother of Natalee Holloway and missing persons advocate., Dianne Wilkerson - Politician, Albert Bryant, Jr. - Army general, Don Hutson - Football player, Tom Lister, Jr. - Professional wrestler, Andrew Lang (basketball) - Basketball player, Bill Carr - (1909-1966), athlete, Reggie Wilkes - Football player, Camille Keaton - Film actor, Peggy Shannon - Actress.
Drinking water stations with addresses in Pine Bluff and their reported violations in the past:
HARDIN WATER ASSOCIATION (Population served: 4,916, Purch groundwater):Past health violations:LADD WATER ASSOCIATION (Population served: 2,393, Groundwater):
- MCL, Monthly (TCR) - In MAY-2012, Contaminant: Coliform. Follow-up actions: St Public Notif requested (JUN-26-2012), St Public Notif received (JUL-30-2012), St Compliance achieved (NOV-29-2012)
Past health violations:Past monitoring violations:
- MCL, Monthly (TCR) - In JAN-2012, Contaminant: Coliform. Follow-up actions: St Public Notif received (MAR-01-2012), St Public Notif requested (MAR-13-2012), St Formal NOV issued (MAR-19-2012), St Public Notif received (MAR-20-2012), St Compliance achieved (MAR-06-2013)
- MCL, Monthly (TCR) - In DEC-2011, Contaminant: Coliform. Follow-up actions: St Public Notif requested (FEB-06-2012), St Formal NOV issued (MAR-19-2012), St Compliance achieved (MAR-06-2013)
- MCL, Monthly (TCR) - In JUL-2010, Contaminant: Coliform. Follow-up actions: St Public Notif requested (SEP-03-2010), St Public Notif received (OCT-05-2010), St Compliance achieved (JAN-04-2011)
- One minor monitoring violation
Drinking water stations with addresses in Pine Bluff that have no violations reported:
- ARSENAL WATER SYSTEM (Population served: 2,577, Primary Water Source Type: Groundwater)
| This city: | 2.5 people |
| Arkansas: | 2.5 people |
| This city: | 64.2% |
| Whole state: | 67.6% |
| This city: | 6.1% |
| Whole state: | 5.7% |
Likely homosexual households (counted as self-reported same-sex unmarried-partner households)
- Lesbian couples: 0.3% of all households
- Gay men: 0.2% of all households
People in group quarters in Pine Bluff in 2010:
- 1,767 people in state prisons
- 1,389 people in college/university student housing
- 429 people in nursing facilities/skilled-nursing facilities
- 257 people in local jails and other municipal confinement facilities
- 72 people in other noninstitutional facilities
- 59 people in correctional facilities intended for juveniles
- 26 people in emergency and transitional shelters (with sleeping facilities) for people experiencing homelessness
People in group quarters in Pine Bluff in 2000:
- 1,365 people in local jails and other confinement facilities (including police lockups)
- 1,028 people in college dormitories (includes college quarters off campus)
- 745 people in nursing homes
- 534 people in state prisons
- 104 people in other noninstitutional group quarters
- 43 people in homes or halfway houses for drug/alcohol abuse
- 2 people in military transient quarters for temporary residents
Banks with branches in Pine Bluff (2011 data):
- Simmons First National Bank: 7 branches. Info updated 2010/10/19: Bank assets: $1,849.8 mil, Deposits: $1,513.0 mil, local headquarters, positive income, 45 total offices, Holding Company: Simmons First National Corporation
- Pine Bluff National Bank: Olive Street Branch, Watson Chapel Branch, East Harding Branch, at 912 South Poplar Street, 2804 Hazel Street Branch. Info updated 2006/11/03: Bank assets: $386.2 mil, Deposits: $333.5 mil, local headquarters, positive income, Agricultural Specialization, 8 total offices, Holding Company: Jefferson Bancshares, Inc.
- Bank of America, National Association: Oak Park Branch at 2201 West 28th, branch established on 1965/03/23; Pine Bluff Main Branch at 120 West 5th, branch established on 1934/01/01. Info updated 2009/11/18: Bank assets: $1,451,969.3 mil, Deposits: $1,077,176.8 mil, headquarters in Charlotte, NC, positive income, 5782 total offices, Holding Company: Bank Of America Corporation
- Bank of Star City: Pine Bluff Branch at 2401 East Harding, branch established on 1986/12/05; Watson Chapel Branch at 3100 Camden Road, branch established on 2004/02/16. Info updated 2011/09/12: Bank assets: $104.4 mil, Deposits: $83.5 mil, headquarters in Star City, AR, positive income, Commercial Lending Specialization, 5 total offices, Holding Company: Star City Bancshares, Inc.
- Fordyce Bank & Trust Co.: Watson Chapel Financial Center at 3404 Camden Road, branch established on 2005/01/25. Info updated 2011/06/20: Bank assets: $123.2 mil, Deposits: $93.2 mil, headquarters in Fordyce, AR, positive income, 5 total offices, Holding Company: Fbt Bancshares, Inc.
For population 15 years and over in Pine Bluff:
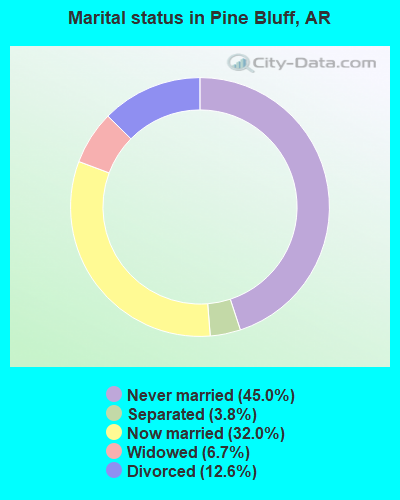
- Never married: 45.0%
- Now married: 32.0%
- Separated: 3.8%
- Widowed: 6.7%
- Divorced: 12.6%
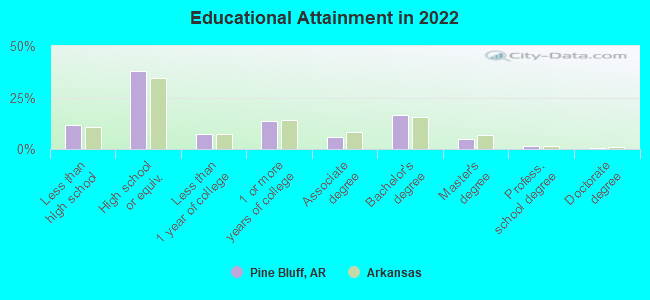
For population 25 years and over in Pine Bluff:
- High school or higher: 88.1%
- Bachelor's degree or higher: 22.2%
- Graduate or professional degree: 6.8%
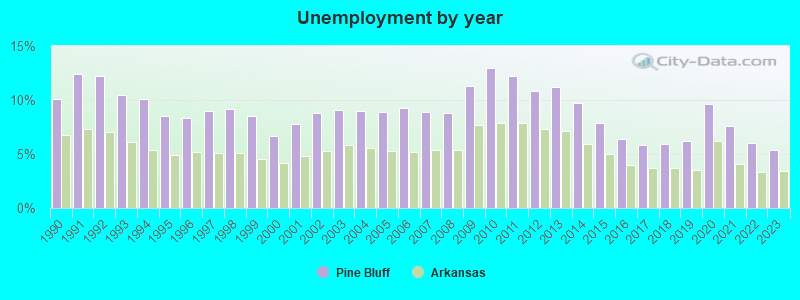
- Unemployed: 10.1%
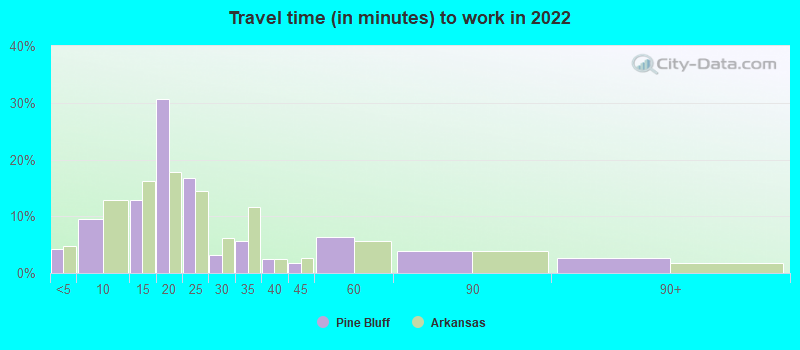
- Mean travel time to work (commute): 15.4 minutes
| Here: | 10.5 |
| Arkansas average: | 11.4 |
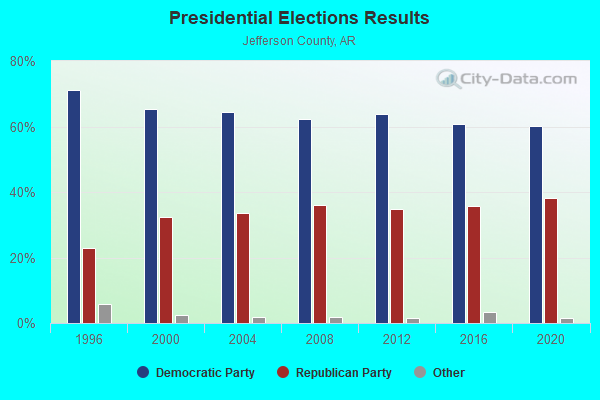
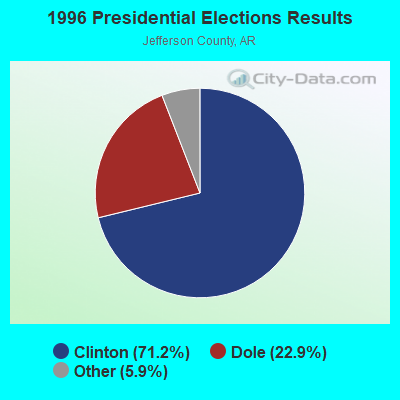
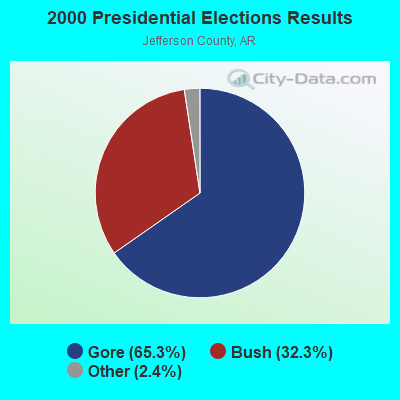
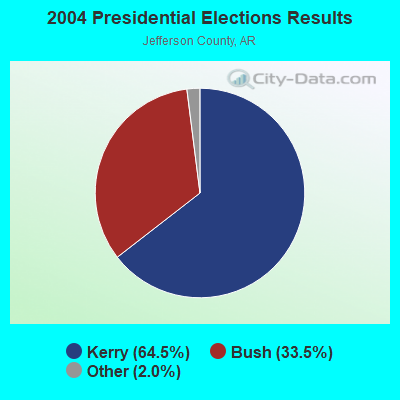
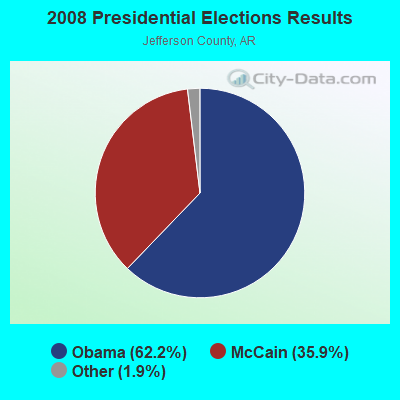
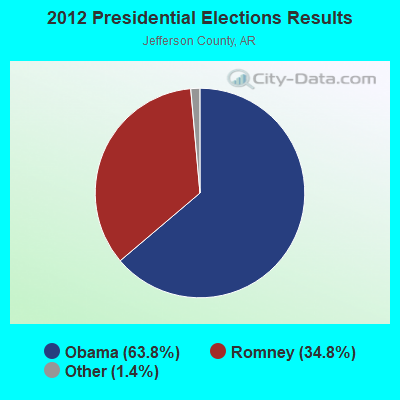
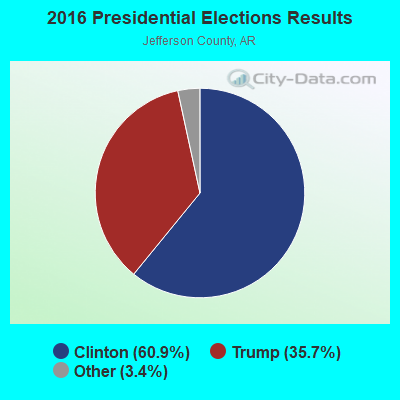
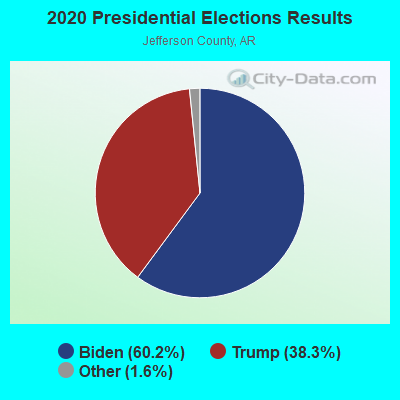
Graphs represent county-level data. Detailed 2008 Election Results
Religion statistics for Pine Bluff, AR (based on Jefferson County data)
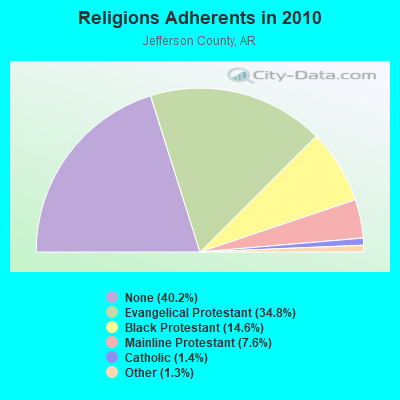
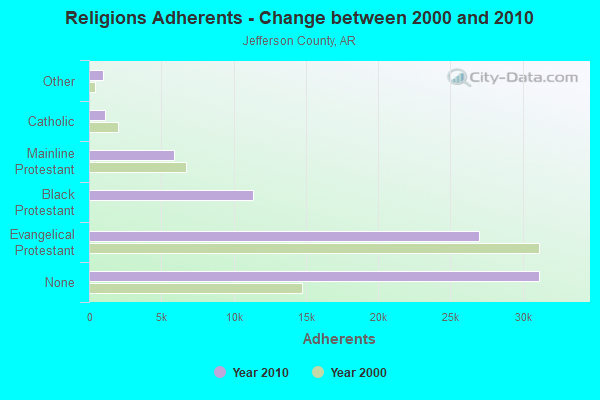
| Religion | Adherents | Congregations |
|---|---|---|
| Evangelical Protestant | 26,985 | 105 |
| Black Protestant | 11,335 | 53 |
| Mainline Protestant | 5,881 | 22 |
| Catholic | 1,121 | 3 |
| Other | 975 | 5 |
| None | 31,138 | - |
Food Environment Statistics:
| Jefferson County: | 1.89 / 10,000 pop. |
| Arkansas: | 2.02 / 10,000 pop. |
| Jefferson County: | 0.25 / 10,000 pop. |
| State: | 0.59 / 10,000 pop. |
| Jefferson County: | 4.04 / 10,000 pop. |
| State: | 4.94 / 10,000 pop. |
| This county: | 3.92 / 10,000 pop. |
| Arkansas: | 6.66 / 10,000 pop. |
| Jefferson County: | 11.6% |
| State: | 9.8% |
| Jefferson County: | 34.9% |
| Arkansas: | 29.1% |
| Jefferson County: | 8.3% |
| Arkansas: | 13.6% |
Health and Nutrition:
| Here: | 49.1% |
| Arkansas: | 48.2% |
| Pine Bluff: | 46.5% |
| Arkansas: | 44.2% |
| This city: | 29.5 |
| Arkansas: | 28.9 |
| This city: | 18.7% |
| State: | 21.6% |
| Here: | 12.6% |
| Arkansas: | 11.3% |
| Pine Bluff: | 6.7 |
| State: | 6.8 |
| Pine Bluff: | 35.3% |
| State: | 34.0% |
| Here: | 54.8% |
| State: | 54.4% |
| Here: | 81.6% |
| Arkansas: | 78.0% |
More about Health and Nutrition of Pine Bluff, AR Residents
| Local government employment and payroll (March 2022) | |||||
| Function | Full-time employees | Monthly full-time payroll | Average yearly full-time wage | Part-time employees | Monthly part-time payroll |
|---|---|---|---|---|---|
| Police Protection - Officers | 135 | $570,260 | $50,690 | 0 | $0 |
| Firefighters | 74 | $273,874 | $44,412 | 0 | $0 |
| Police - Other | 31 | $83,015 | $32,135 | 1 | $1,568 |
| Streets and Highways | 29 | $109,619 | $45,360 | 0 | $0 |
| Fire - Other | 20 | $89,091 | $53,455 | 0 | $0 |
| Judicial and Legal | 14 | $64,942 | $55,665 | 0 | $0 |
| Other Government Administration | 14 | $46,313 | $39,697 | 0 | $0 |
| Transit | 14 | $42,724 | $36,621 | 7 | $8,917 |
| Parks and Recreation | 11 | $39,960 | $43,593 | 5 | $5,008 |
| Financial Administration | 10 | $51,733 | $62,080 | 1 | $1,884 |
| Housing and Community Development (Local) | 9 | $35,433 | $47,244 | 0 | $0 |
| Airports | 5 | $35,080 | $84,192 | 0 | $0 |
| Solid Waste Management | 2 | $6,390 | $38,340 | 0 | $0 |
| Totals for Government | 368 | $1,448,434 | $47,232 | 14 | $17,377 |
Pine Bluff government finances - Expenditure in 2021 (per resident):
- Construction - General - Other: $5,894,000 ($149.23)
Libraries: $4,844,000 ($122.65)
Regular Highways: $1,251,000 ($31.67)
Sewerage: $1,200,000 ($30.38)
- Current Operations - Police Protection: $11,380,000 ($288.14)
Local Fire Protection: $8,589,000 ($217.47)
Parks and Recreation: $4,730,000 ($119.76)
Regular Highways: $4,623,000 ($117.05)
Sewerage: $4,324,000 ($109.48)
Central Staff Services: $4,178,000 ($105.79)
Solid Waste Management: $2,671,000 ($67.63)
Judicial and Legal Services: $1,704,000 ($43.14)
General - Other: $1,696,000 ($42.94)
Housing and Community Development: $1,292,000 ($32.71)
Transit Utilities: $968,000 ($24.51)
Financial Administration: $698,000 ($17.67)
General Public Buildings: $559,000 ($14.15)
Public Welfare - Other: $200,000 ($5.06)
Air Transportation: $192,000 ($4.86)
Health - Other: $46,000 ($1.16)
Miscellaneous Commercial Activities - Other: $5,000 ($0.13)
- General - Interest on Debt: $1,275,000 ($32.28)
- Intergovernmental to Local - Other - Libraries: $649,000 ($16.43)
- Other Capital Outlay - General - Other: $57,000 ($1.44)
- Total Salaries and Wages: $2,093,000 ($52.99)
Pine Bluff government finances - Revenue in 2021 (per resident):
- Charges - Sewerage: $7,104,000 ($179.87)
Solid Waste Management: $2,612,000 ($66.13)
Parks and Recreation: $347,000 ($8.79)
- Federal Intergovernmental - Health and Hospitals: $1,945,000 ($49.25)
Housing and Community Development: $911,000 ($23.07)
Other: $865,000 ($21.90)
Transit Utilities: $802,000 ($20.31)
General Local Government Support: $57,000 ($1.44)
- Local Intergovernmental - General Local Government Support: $6,926,000 ($175.36)
- Miscellaneous - General Revenue - Other: $5,637,000 ($142.73)
Interest Earnings: $966,000 ($24.46)
Fines and Forfeits: $812,000 ($20.56)
Donations From Private Sources: $381,000 ($9.65)
- Revenue - Transit Utilities: $35,000 ($0.89)
- State Intergovernmental - Highways: $3,705,000 ($93.81)
General Local Government Support: $2,140,000 ($54.18)
Other: $228,000 ($5.77)
Transit Utilities: $101,000 ($2.56)
- Tax - General Sales and Gross Receipts: $17,877,000 ($452.64)
Property: $5,306,000 ($134.35)
Public Utilities Sales: $3,006,000 ($76.11)
Other License: $1,241,000 ($31.42)
Pari - mutuels Sales: $1,084,000 ($27.45)
Pine Bluff government finances - Debt in 2021 (per resident):
- Long Term Debt - Beginning Outstanding - Unspecified Public Purpose: $45,611,000 ($1154.86)
Outstanding Unspecified Public Purpose: $43,756,000 ($1107.89)
Beginning Outstanding - Public Debt for Private Purpose: $2,547,000 ($64.49)
Retired Unspecified Public Purpose: $2,325,000 ($58.87)
Outstanding Nonguaranteed - Industrial Revenue: $1,734,000 ($43.90)
Retired Nonguaranteed - Public Debt for Private Purpose: $813,000 ($20.58)
Issue, Unspecified Public Purpose: $470,000 ($11.90)
Pine Bluff government finances - Cash and Securities in 2021 (per resident):
- Bond Funds - Cash and Securities: $2,444,000 ($61.88)
- Other Funds - Cash and Securities: $28,433,000 ($719.91)
- Sinking Funds - Cash and Securities: $3,819,000 ($96.70)
| Businesses in Pine Bluff, AR | ||||
| Name | Count | Name | Count | |
|---|---|---|---|---|
| AT&T | 3 | Lane Furniture | 1 | |
| Advance Auto Parts | 1 | Little Caesars Pizza | 2 | |
| Arby's | 1 | Long John Silver's | 1 | |
| AutoZone | 2 | Lowe's | 1 | |
| Baskin-Robbins | 1 | MasterBrand Cabinets | 1 | |
| Best Western | 1 | McDonald's | 5 | |
| Budget Car Rental | 1 | Nike | 7 | |
| Burger King | 2 | Nissan | 1 | |
| Church's Chicken | 1 | Payless | 2 | |
| Comfort Inn | 1 | Penske | 1 | |
| Cricket Wireless | 3 | Pizza Hut | 2 | |
| Days Inn | 1 | Popeyes | 1 | |
| Domino's Pizza | 2 | Quiznos | 1 | |
| FedEx | 8 | RadioShack | 1 | |
| Firestone Complete Auto Care | 1 | Ramada | 1 | |
| Ford | 1 | Red Lobster | 1 | |
| GNC | 1 | SONIC Drive-In | 3 | |
| GameStop | 1 | Sears | 2 | |
| Goodwill | 3 | Staples | 1 | |
| H&R Block | 3 | Subway | 4 | |
| Hardee's | 1 | Super 8 | 1 | |
| Havertys Furniture | 1 | T-Mobile | 1 | |
| Hilton | 1 | Taco Bell | 2 | |
| Holiday Inn | 2 | Toyota | 1 | |
| JCPenney | 1 | U-Haul | 4 | |
| Jones New York | 2 | UPS | 8 | |
| Journeys | 1 | Vans | 1 | |
| KFC | 3 | Verizon Wireless | 1 | |
| Kincaid | 1 | Walmart | 1 | |
| La Quinta | 1 | Wendy's | 3 | |
| La-Z-Boy | 1 | |||
Strongest AM radio stations in Pine Bluff:
- KCAT (1340 AM; 1 kW; PINE BLUFF, AR; Owner: JAMES J.B. SCANLON)
- KPBA (1270 AM; 5 kW; PINE BLUFF, AR; Owner: METRO BIRCH ENTERPRISES, INC)
- KCLA (1400 AM; 1 kW; PINE BLUFF, AR; Owner: M.R.S. VENTURES, INC.)
- KOTN (1490 AM; 1 kW; PINE BLUFF, AR; Owner: M.R.S. VENTURES, INC.)
- KAAY (1090 AM; 50 kW; LITTLE ROCK, AR; Owner: CITADEL BROADCASTING COMPANY)
- KGHT (880 AM; 50 kW; SHERIDAN, AR; Owner: METROPOLITAN RADIO GROUP, INC.)
- KMTL (760 AM; daytime; 10 kW; SHERWOOD, AR; Owner: GEORGE V. DOMERESE)
- WCRV (640 AM; 50 kW; COLLIERVILLE, TN; Owner: BOTT BROADCASTING COMPANY/TENNESSEE)
- KARN (920 AM; 5 kW; LITTLE ROCK, AR; Owner: CITADEL BROADCASTING COMPANY)
- KEEL (710 AM; 50 kW; SHREVEPORT, LA; Owner: CITICASTERS LICENSES, L.P.)
- KLRG (1150 AM; 5 kW; NORTH LITTLE ROCK, AR; Owner: ARKANSAS RADIO CORPORATION)
- WGSF (1030 AM; 50 kW; MEMPHIS, TN; Owner: FLINN BROADCASTING CORPORATION)
- WDIA (1070 AM; 50 kW; MEMPHIS, TN; Owner: CLEAR CHANNEL BROADCASTING LICENSES, INC.)
Strongest FM radio stations in Pine Bluff:
- KANX (91.1 FM; SHERIDAN, AR; Owner: AMERICAN FAMILY ASSOCIATION)
- K226AG (93.1 FM; PINE BLUFF, AR; Owner: CENTRAL ARKANSAS CHRISTIAN BCG INC)
- KUAP (89.7 FM; PINE BLUFF, AR; Owner: BOARD OF TRUSTEES OF THE UNIV OF AR)
- KTRN (104.5 FM; WHITE HALL, AR; Owner: BAYOU BROADCASTING, INC.)
- KPBQ-FM (101.3 FM; PINE BLUFF, AR; Owner: M.R.S. VENTURES, INC.)
- KZYP (99.3 FM; PINE BLUFF, AR; Owner: M.R.S. VENTURES, INC.)
- KMSX (94.9 FM; MAUMELLE, AR; Owner: CLEAR CHANNEL BROADCASTING LICENSES, INC.)
- KIPR (92.3 FM; PINE BLUFF, AR; Owner: CITADEL BROADCASTING COMPANY)
- KSSN (95.7 FM; LITTLE ROCK, AR; Owner: CLEAR CHANNEL BROADCASTING LICENSES, INC.)
- KKPT (94.1 FM; LITTLE ROCK, AR; Owner: SIGNAL MEDIA OF ARKANSAS, INC.)
- KHTE-FM (96.5 FM; ENGLAND, AR; Owner: ABG ARKANSAS, LLC)
- KABZ (103.7 FM; LITTLE ROCK, AR; Owner: SIGNAL MEDIA OF ARKANSAS, INC)
- KHKN (106.7 FM; BENTON, AR; Owner: CLEAR CHANNEL BROADCASTING LICENSES, INC.)
- K265CD (100.9 FM; PINE BLUFF, AR; Owner: J AND J BROADCASTING)
- KURB (98.5 FM; LITTLE ROCK, AR; Owner: CITADEL BROADCASTING COMPANY)
- KVLO (102.9 FM; SHERIDAN, AR; Owner: CITADEL BROADCASTING COMPANY)
- KKZR (93.3 FM; BRYANT, AR; Owner: ABG ARKANSAS, LLC)
- KDEW-FM (97.3 FM; DE WITT, AR; Owner: ARKANSAS COUNTY BROADCASTERS, INC.)
- K204DO (88.7 FM; PINE BLUFF, AR; Owner: CALVARY CHAPEL OF TWIN FALLS, INC.)
TV broadcast stations around Pine Bluff:
- KIPB-LP (Channel 65; PINE BLUFF, AR; Owner: IMMANUEL BROADCASTING CORPORATION)
- KWBK-LP (Channel 36; PINE BLUFF, AR; Owner: ARKANSAS 49, INC.)
- KATV (Channel 7; LITTLE ROCK, AR; Owner: KATV, LLC)
- KETS (Channel 2; LITTLE ROCK, AR; Owner: ARKANSAS EDUCATIONAL TELEVISION COMMISSION)
- KASN (Channel 38; PINE BLUFF, AR; Owner: CLEAR CHANNEL BROADCASTING LICENSES, INC.)
- KVTN (Channel 25; PINE BLUFF, AR; Owner: AGAPE CHURCH, INC.)
- KLRT-TV (Channel 16; LITTLE ROCK, AR; Owner: CLEAR CHANNEL BROADCASTING LICENSES, INC.)
Medal of Honor Recipients
Medal of Honor Recipient born in Pine Bluff: James L. Stone.
- National Bridge Inventory (NBI) Statistics
- 199Number of bridges
- 4,400ft / 1,341mTotal length
- $13,201,000Total costs
- 1,066,902Total average daily traffic
- 60,501Total average daily truck traffic
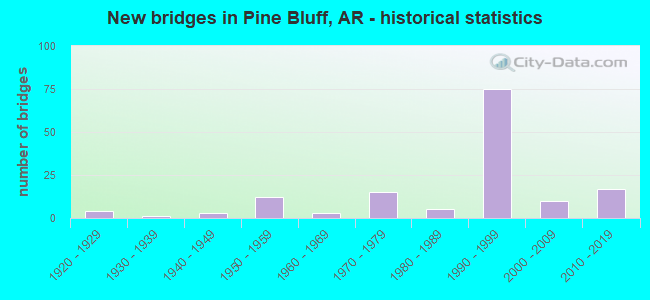
- New bridges - historical statistics
- 41920-1929
- 11930-1939
- 31940-1949
- 121950-1959
- 31960-1969
- 151970-1979
- 51980-1989
- 751990-1999
- 102000-2009
- 172010-2019
FCC Registered Antenna Towers: 387 (See the full list of FCC Registered Antenna Towers)
FCC Registered Commercial Land Mobile Towers: 7 (See the full list of FCC Registered Commercial Land Mobile Towers in Pine Bluff, AR)
FCC Registered Private Land Mobile Towers: 6 (See the full list of FCC Registered Private Land Mobile Towers)
FCC Registered Broadcast Land Mobile Towers: 65 (See the full list of FCC Registered Broadcast Land Mobile Towers)
FCC Registered Microwave Towers: 76 (See the full list of FCC Registered Microwave Towers in this town)
FCC Registered Paging Towers: 12 (See the full list of FCC Registered Paging Towers)
FCC Registered Maritime Coast & Aviation Ground Towers: 5 (See the full list of FCC Registered Maritime Coast & Aviation Ground Towers)
FCC Registered Amateur Radio Licenses: 111 (See the full list of FCC Registered Amateur Radio Licenses in Pine Bluff)
FAA Registered Aircraft Manufacturers and Dealers: 9 (See the full list of FAA Registered Manufacturers and Dealers in Pine Bluff)
FAA Registered Aircraft: 46 (See the full list of FAA Registered Aircraft)
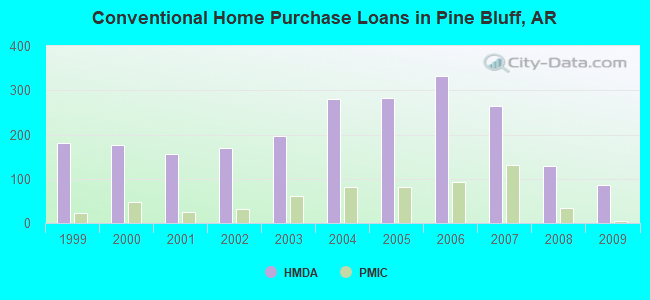
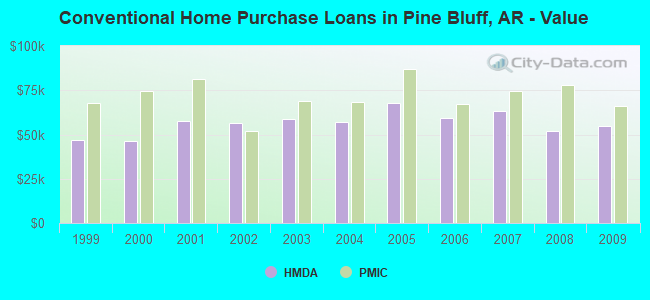
| Home Mortgage Disclosure Act Aggregated Statistics For Year 2009 (Based on 11 full and 6 partial tracts) | ||||||||||||||
| A) FHA, FSA/RHS & VA Home Purchase Loans | B) Conventional Home Purchase Loans | C) Refinancings | D) Home Improvement Loans | E) Loans on Dwellings For 5+ Families | F) Non-occupant Loans on < 5 Family Dwellings (A B C & D) | G) Loans On Manufactured Home Dwelling (A B C & D) | ||||||||
|---|---|---|---|---|---|---|---|---|---|---|---|---|---|---|
| Number | Average Value | Number | Average Value | Number | Average Value | Number | Average Value | Number | Average Value | Number | Average Value | Number | Average Value | |
| LOANS ORIGINATED | 120 | $91,425 | 86 | $55,060 | 184 | $90,926 | 39 | $21,666 | 4 | $432,598 | 61 | $45,317 | 5 | $49,944 |
| APPLICATIONS APPROVED, NOT ACCEPTED | 10 | $92,986 | 16 | $55,654 | 18 | $81,715 | 7 | $43,059 | 1 | $900,710 | 6 | $25,408 | 9 | $48,596 |
| APPLICATIONS DENIED | 33 | $84,537 | 44 | $58,576 | 132 | $76,459 | 51 | $16,908 | 1 | $2,560,000 | 19 | $46,636 | 17 | $40,882 |
| APPLICATIONS WITHDRAWN | 11 | $82,935 | 4 | $73,875 | 81 | $84,510 | 4 | $35,000 | 1 | $3,148,000 | 6 | $47,310 | 1 | $102,380 |
| FILES CLOSED FOR INCOMPLETENESS | 7 | $64,077 | 2 | $125,765 | 14 | $98,919 | 1 | $20,000 | 0 | $0 | 2 | $50,700 | 0 | $0 |
Detailed mortgage data for all 17 tracts in Pine Bluff, AR
| Private Mortgage Insurance Companies Aggregated Statistics For Year 2009 (Based on 6 full and 4 partial tracts) | ||||||
| A) Conventional Home Purchase Loans | B) Refinancings | C) Non-occupant Loans on < 5 Family Dwellings (A & B) | ||||
|---|---|---|---|---|---|---|
| Number | Average Value | Number | Average Value | Number | Average Value | |
| LOANS ORIGINATED | 4 | $66,275 | 4 | $110,302 | 1 | $47,000 |
| APPLICATIONS APPROVED, NOT ACCEPTED | 2 | $175,920 | 5 | $154,166 | 0 | $0 |
| APPLICATIONS DENIED | 0 | $0 | 0 | $0 | 0 | $0 |
| APPLICATIONS WITHDRAWN | 0 | $0 | 0 | $0 | 0 | $0 |
| FILES CLOSED FOR INCOMPLETENESS | 0 | $0 | 0 | $0 | 0 | $0 |
2002 - 2018 National Fire Incident Reporting System (NFIRS) incidents
- Fire incident types reported to NFIRS in Pine Bluff, AR
- 5,00346.6%Structure Fires
- 3,60533.6%Outside Fires
- 1,84917.2%Mobile Property/Vehicle Fires
- 2782.6%Other
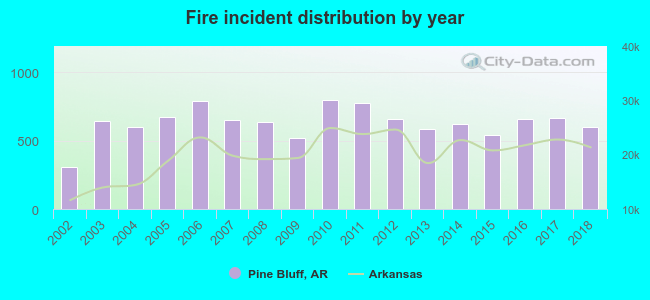 According to the data from the years 2002 - 2018 the average number of fire incidents per year is 631. The highest number of fire incidents - 796 took place in 2010, and the least - 305 in 2002. The data has an increasing trend.
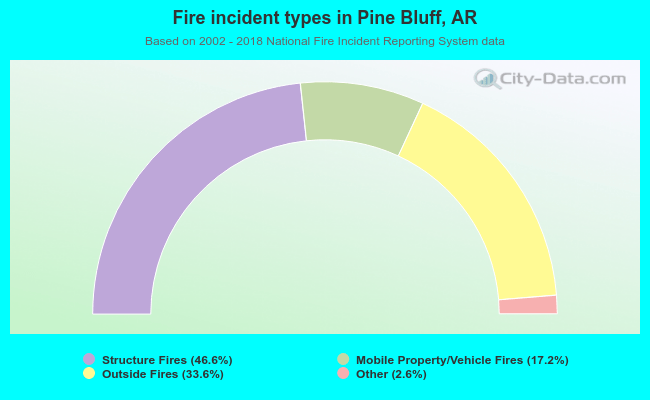 When looking into fire subcategories, the most reports belonged to: Structure Fires (46.6%), and Outside Fires (33.6%).
Fire-safe hotels and motels in Pine Bluff, Arkansas:
- Royal Arkansas Hotel & Suites, 2 Convention Center Plz, Pine Bluff, Arkansas 71601 , Phone: (870) 535-3111, Fax: (870) 536-9359
- America's Best Inn & Suites, 2700 E Harding Ave, Pine Bluff, Arkansas 71601 , Phone: (870) 535-8640, Fax: (870) 535-2648
- Red Roof Inn, 210 N Blake St, Pine Bluff, Arkansas 71601 , Phone: (870) 534-7222, Fax: (501) 534-5705
- Econo Lodge, 4101 W Barraque St, Pine Bluff, Arkansas 71602 , Phone: (870) 575-0400, Fax: (870) 575-0408
- Comfort Inn, 2809 Pnes Mall Dr, Pine Bluff, Arkansas 71601 , Phone: (870) 535-5300, Fax: (870) 535-1264
- Pine Bluff Super 8 Motel, 3008 Market St, Pine Bluff, Arkansas 71601 , Phone: (800) 800-8000, Fax: (870) 540-0009
- Days Inn & Siutes, 406 N Blake St, Pine Bluff, Arkansas 71601 , Phone: (870) 534-1800, Fax: (870) 534-1800
- Holiday Inn Express Hotel & Suites, 2903 Pnes Mall Dr, Pine Bluff, Arkansas 71601 , Phone: (870) 534-1810, Fax: (870) 536-0401
- 4 other hotels and motels
| Most common first names in Pine Bluff, AR among deceased individuals | ||
| Name | Count | Lived (average) |
|---|---|---|
| James | 629 | 71.3 years |
| Mary | 567 | 78.3 years |
| John | 456 | 74.7 years |
| William | 392 | 73.9 years |
| Willie | 390 | 75.3 years |
| Robert | 306 | 71.9 years |
| George | 266 | 75.5 years |
| Charles | 181 | 70.1 years |
| Henry | 170 | 76.9 years |
| Annie | 165 | 80.2 years |
| Most common last names in Pine Bluff, AR among deceased individuals | ||
| Last name | Count | Lived (average) |
|---|---|---|
| Williams | 359 | 73.5 years |
| Smith | 338 | 75.0 years |
| Johnson | 338 | 74.4 years |
| Jones | 294 | 73.4 years |
| Brown | 222 | 76.7 years |
| Davis | 211 | 74.7 years |
| Harris | 164 | 75.5 years |
| Taylor | 145 | 77.1 years |
| Jackson | 143 | 75.2 years |
| Thomas | 126 | 72.1 years |
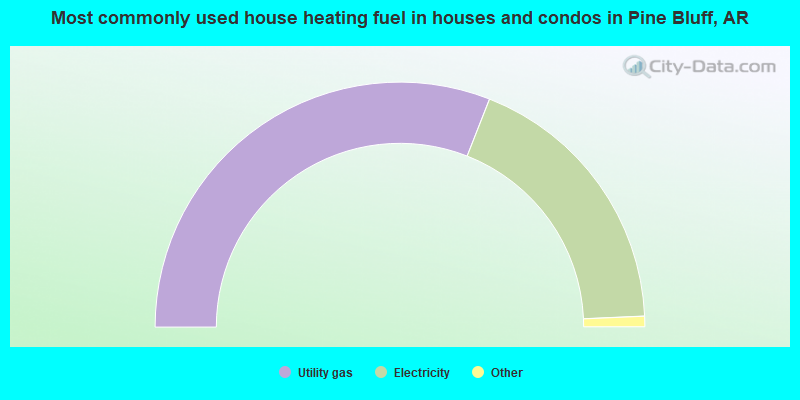
- 62.0%Utility gas
- 36.7%Electricity
- 1.1%Bottled, tank, or LP gas
- 0.1%Other fuel
- 0.1%No fuel used
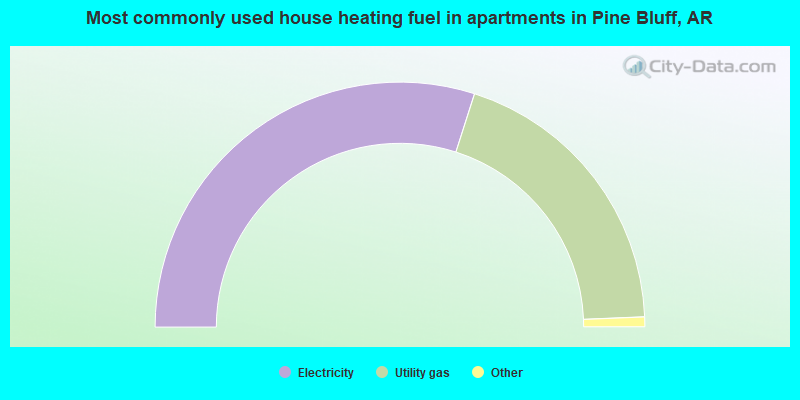
- 59.8%Electricity
- 38.8%Utility gas
- 0.9%No fuel used
- 0.5%Bottled, tank, or LP gas
Pine Bluff compared to Arkansas state average:
- Median house value below state average.
- Black race population percentage significantly above state average.
- Hispanic race population percentage significantly below state average.
- Median age below state average.
- Foreign-born population percentage significantly below state average.
- Length of stay since moving in significantly above state average.
- House age above state average.
- Institutionalized population percentage above state average.
Pine Bluff on our top lists:
- #48 on the list of "Top 101 cities with the smallest percentage of high school students in private schools (3,000+ students)"
- #65 on the list of "Top 101 cities with the largest percentage of one, detached housing units in structures (20,000+ housing units)"
- #70 on the list of "Top 101 cities with the highest number of murders per 100,000 residents, excludes tourist destinations and others with a lot of outsiders visiting based on city industries data (population 5,000+)"
- #71 on the list of "Top 101 cities with the largest percentage population decrease from 2000 (population 5,000+)"
- #74 on the list of "Top 101 cities with the highest city-data.com crime index, excludes tourist destinations and others with a lot of outsiders visiting based on city industries data (population 5,000+)"
- #82 on the list of "Top 101 cities with the highest number of arson incidents per 100,000 residents, excludes tourist destinations and others with a lot of outsiders visiting based on city industries data (population 5,000+)"
- #84 on the list of "Top 101 cities with the highest number of burglaries per 100,000 residents, excludes tourist destinations and others with a lot of outsiders visiting based on city industries data (population 5,000+)"
- #87 on the list of "Top 100 cities with declining populations from 2000 to 2014 (pop. 5,000+)"
- #92 on the list of "Top 100 least-safe cities (highest city-data.com crime index) (pop. 5,000+)"
- #97 on the list of "Top 101 cities with the smallest percentage of elementary and middle school students in private schools (5,000+ students)"
- #100 on the list of "Top 101 cities with the largest percentage of people in military transient quarters for temporary residents (population 1,000+)"
- #43 (71602) on the list of "Top 101 zip codes with the largest percentage of English first ancestries (pop 5,000+)"
- #2 on the list of "Top 101 counties with the largest number of people moving out compared to moving in (pop. 50,000+)"
- #51 on the list of "Top 101 counties with the most Black Protestant congregations"
- #84 on the list of "Top 101 counties with the most Black Protestant adherents"
- #93 on the list of "Top 101 counties with highest percentage of residents voting for Obama (Democrat) in the 2012 Presidential Election (pop. 50,000+)"

|
|
Total of 14 patent applications in 2008-2024.