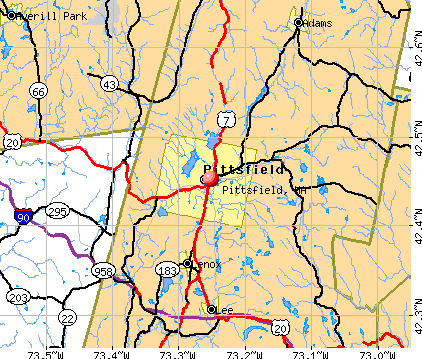
Pittsfield, Massachusetts
Pittsfield: Pittsfield State Forest
Pittsfield
Pittsfield
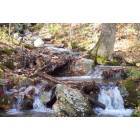
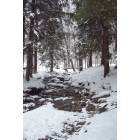
Pittsfield: Tucked away in Pittsfield State Forest
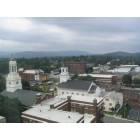
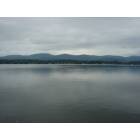
Pittsfield: From 12th floor of Crowne Plaza

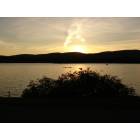
Pittsfield: A lovely look over pontoosuc lake, with a manificent tree hangging in front, and the mountians in the back of the lake.
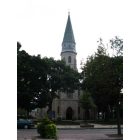
Pittsfield: St. Joseph Catholic Church

Pittsfield: A lovely look over the pittsfield side of pontoosuc lake, with a manificent tree hangging in front, and the mountians in the back of the lake.

Pittsfield: A lovely look over pontoosuc lake, with a manificent tree hangging in front, and the mountians in the back of the lake.
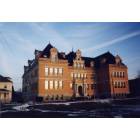
Pittsfield: Old Pittsfield High School
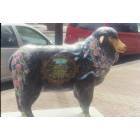
Pittsfield: Sheeptacular event in Downtown Pittsfield, MA. A Mount Greylock sheep.
- see
14
more - add
your
Submit your own pictures of this city and show them to the world
- OSM Map
- General Map
- Google Map
- MSN Map
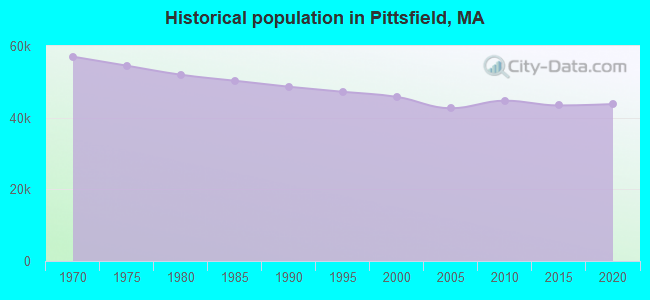
Population change since 2000: -5.4%
 |
| Males: 21,636 | |
| Females: 21,674 |
| Median resident age: | 45.1 years |
| Massachusetts median age: | 40.3 years |
Zip codes: 01201.
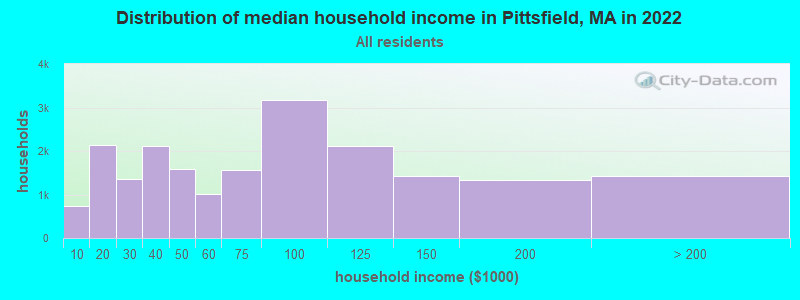
| Pittsfield: | $71,108 |
| MA: | $94,488 |
Estimated per capita income in 2022: $45,677 (it was $20,549 in 2000)
Pittsfield city income, earnings, and wages data
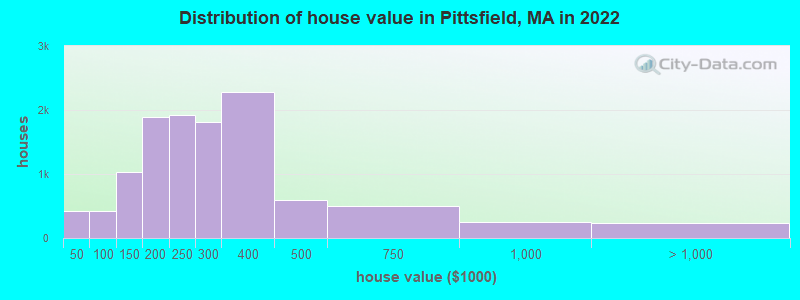
Estimated median house or condo value in 2022: $253,727 (it was $98,200 in 2000)
| Pittsfield: | $253,727 |
| MA: | $534,700 |
Mean prices in 2022: all housing units: $279,245; detached houses: $279,301; townhouses or other attached units: $523,409; in 2-unit structures: $236,124; in 3-to-4-unit structures: $281,771; in 5-or-more-unit structures: $126,475; mobile homes: $53,699
Median gross rent in 2022: $991.
(10.9% for White Non-Hispanic residents, 28.8% for Black residents, 27.1% for Hispanic or Latino residents, 29.2% for other race residents, 26.5% for two or more races residents)
Detailed information about poverty and poor residents in Pittsfield, MA


- 34,05478.4%White alone
- 3,8348.8%Hispanic
- 2,5886.0%Black alone
- 2,5265.8%Two or more races
- 4581.1%Asian alone
- 2610.6%Other race alone
- 500.1%American Indian alone
- 120.03%Native Hawaiian and Other
Pacific Islander alone
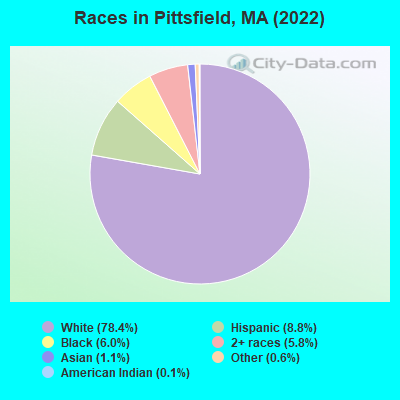
Races in Pittsfield detailed stats: ancestries, foreign born residents, place of birth
According to our research of Massachusetts and other state lists, there were 89 registered sex offenders living in Pittsfield, Massachusetts as of April 26, 2024.
The ratio of all residents to sex offenders in Pittsfield is 495 to 1.
Type |
2009 |
2010 |
2011 |
2012 |
2013 |
2014 |
2015 |
2016 |
2017 |
2018 |
2019 |
2020 |
2021 |
2022 |
|---|---|---|---|---|---|---|---|---|---|---|---|---|---|---|
| Murders (per 100,000) | 2 (4.6) | 1 (2.2) | 4 (8.9) | 0 (0.0) | 0 (0.0) | 0 (0.0) | 4 (9.2) | 3 (7.0) | 4 (9.4) | 3 (7.1) | 2 (4.7) | 1 (2.4) | 1 (2.4) | 3 (6.9) |
| Rapes (per 100,000) | 34 (79.0) | 26 (58.1) | 31 (68.9) | 34 (75.8) | 31 (70.5) | 36 (82.0) | 38 (87.5) | 37 (86.0) | 51 (119.9) | 44 (104.0) | 36 (85.2) | 37 (88.4) | 36 (86.6) | 40 (92.0) |
| Robberies (per 100,000) | 23 (53.4) | 17 (38.0) | 40 (88.9) | 38 (84.7) | 29 (65.9) | 30 (68.3) | 34 (78.3) | 39 (90.6) | 43 (101.1) | 34 (80.4) | 31 (73.3) | 34 (81.2) | 28 (67.4) | 32 (73.6) |
| Assaults (per 100,000) | 226 (525.0) | 237 (529.8) | 194 (431.0) | 119 (265.2) | 51 (115.9) | 129 (293.9) | 208 (478.7) | 262 (608.9) | 278 (653.4) | 275 (650.1) | 231 (546.5) | 271 (647.3) | 211 (507.7) | 251 (577.1) |
| Burglaries (per 100,000) | 319 (741.0) | 374 (836.0) | 458 (1,018) | 373 (831.3) | 481 (1,093) | 459 (1,046) | 414 (952.8) | 364 (845.9) | 399 (937.8) | 464 (1,097) | 263 (622.2) | 232 (554.2) | 226 (543.8) | 231 (531.1) |
| Thefts (per 100,000) | 637 (1,480) | 750 (1,676) | 739 (1,642) | 751 (1,674) | 826 (1,878) | 845 (1,925) | 808 (1,860) | 622 (1,445) | 657 (1,544) | 662 (1,565) | 491 (1,162) | 370 (883.8) | 368 (885.6) | 390 (896.6) |
| Auto thefts (per 100,000) | 50 (116.1) | 59 (131.9) | 69 (153.3) | 43 (95.8) | 44 (100.0) | 40 (91.1) | 49 (112.8) | 32 (74.4) | 37 (87.0) | 71 (167.9) | 43 (101.7) | 63 (150.5) | 64 (154.0) | 72 (165.5) |
| Arson (per 100,000) | 10 (23.2) | 10 (22.4) | 9 (20.0) | 5 (11.1) | 3 (6.8) | 7 (15.9) | 5 (11.5) | 9 (20.9) | 5 (11.8) | 13 (30.7) | 6 (14.2) | 8 (19.1) | 10 (24.1) | 9 (20.7) |
| City-Data.com crime index | 313.8 | 304.4 | 334.9 | 271.9 | 259.0 | 302.4 | 357.7 | 354.7 | 410.1 | 404.4 | 307.1 | 315.5 | 281.7 | 311.1 |
The City-Data.com crime index weighs serious crimes and violent crimes more heavily. Higher means more crime, U.S. average is 246.1. It adjusts for the number of visitors and daily workers commuting into cities.
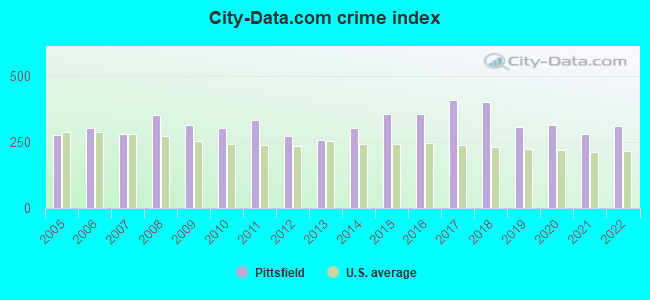
Crime rate in Pittsfield detailed stats: murders, rapes, robberies, assaults, burglaries, thefts, arson
Full-time law enforcement employees in 2020, including police officers: 107 (86 officers - 76 male; 10 female).
| Officers per 1,000 residents here: | 2.05 |
| Massachusetts average: | 2.59 |
 Recent articles from our blog. Our writers, many of them Ph.D. graduates or candidates, create easy-to-read articles on a wide variety of topics.

 | What Pittsfield area like ? (44 replies) |
| Tell me about Pittsfield! (82 replies) |
| Pittsfield, North Adams: pedestrian safety? (9 replies) |
| Pittsfield heating up :-( (2 replies) |
| medium size affordable cities to move too? (45 replies) |
| Best Yankees Bar in Massachusetts (2022 Update)? (49 replies) |
Latest news from Pittsfield, MA collected exclusively by city-data.com from local newspapers, TV, and radio stations
Pittsfield, MA City Guides:
Ancestries: Italian (14.9%), Irish (12.8%), American (10.9%), English (6.7%), German (4.2%), Polish (3.9%).
Current Local Time: EST time zone
Elevation: 1039 feet
Land area: 40.7 square miles.
Population density: 1,063 people per square mile (low).
3,062 residents are foreign born (2.0% Europe, 1.9% Latin America, 1.7% Africa, 0.8% Asia).
| This city: | 7.1% |
| Massachusetts: | 17.6% |
Median real estate property taxes paid for housing units with mortgages in 2022: $3,648 (1.4%)
Median real estate property taxes paid for housing units with no mortgage in 2022: $3,637 (1.4%)
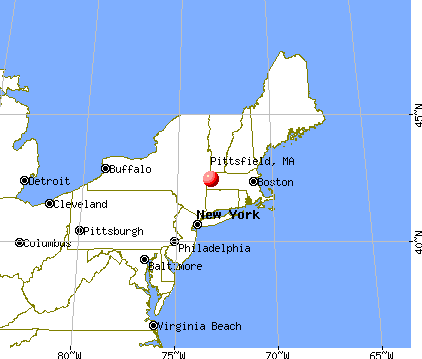
Nearest city with pop. 50,000+: Albany, NY  (30.6 miles , pop. 95,658).
Nearest city with pop. 200,000+: Boston, MA (110.8 miles , pop. 589,141).
Nearest city with pop. 1,000,000+: Bronx, NY (115.6 miles , pop. 1,332,650).
Nearest cities:
), ), ), ), ), ), )Latitude: 42.45 N, Longitude: 73.25 W
Daytime population change due to commuting: +4,412 (+10.2%)
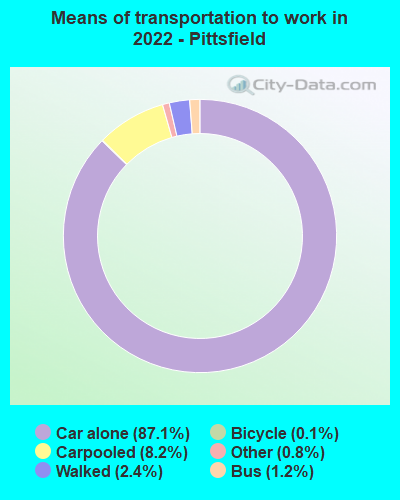
Workers who live and work in this city: 13,882 (64.2%)
Area code: 413
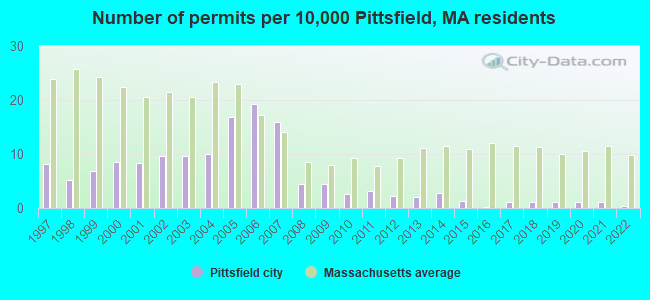
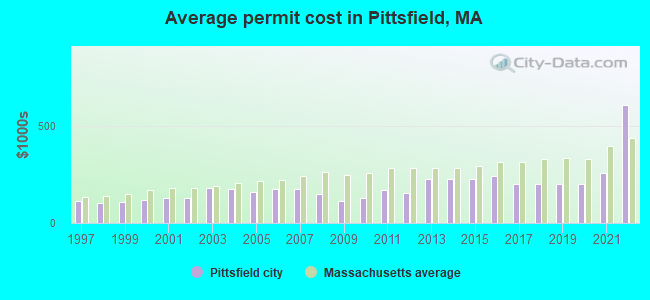
Single-family new house construction building permits:
- 2022: 2 buildings, average cost: $606,200
- 2021: 5 buildings, average cost: $259,200
- 2020: 5 buildings, average cost: $197,900
- 2019: 5 buildings, average cost: $197,900
- 2018: 5 buildings, average cost: $197,900
- 2017: 5 buildings, average cost: $197,900
- 2016: 1 building, cost: $240,100
- 2015: 6 buildings, average cost: $226,500
- 2014: 13 buildings, average cost: $225,100
- 2013: 9 buildings, average cost: $225,100
- 2012: 10 buildings, average cost: $151,800
- 2011: 14 buildings, average cost: $168,700
- 2010: 12 buildings, average cost: $125,500
- 2009: 20 buildings, average cost: $114,000
- 2008: 20 buildings, average cost: $148,400
- 2007: 73 buildings, average cost: $176,400
- 2006: 88 buildings, average cost: $176,400
- 2005: 77 buildings, average cost: $157,600
- 2004: 46 buildings, average cost: $174,900
- 2003: 44 buildings, average cost: $178,800
- 2002: 44 buildings, average cost: $127,600
- 2001: 38 buildings, average cost: $127,600
- 2000: 39 buildings, average cost: $117,200
- 1999: 31 buildings, average cost: $106,900
- 1998: 24 buildings, average cost: $100,700
- 1997: 37 buildings, average cost: $114,900
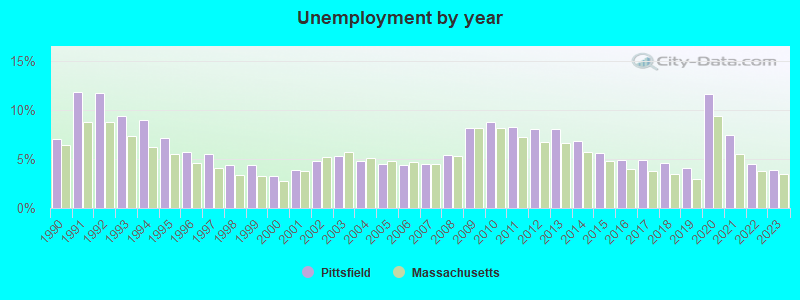
| Here: | 3.9% |
| Massachusetts: | 3.5% |
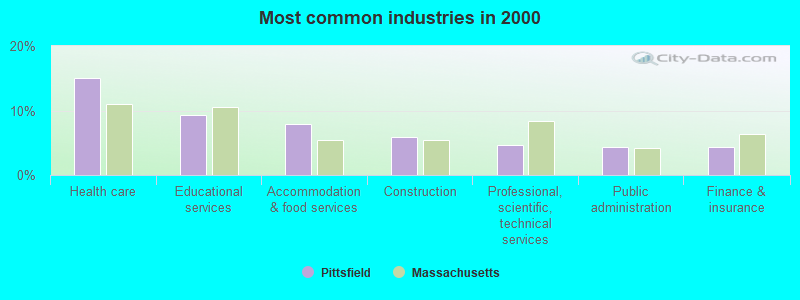
- Health care (15.1%)
- Educational services (9.4%)
- Accommodation & food services (7.9%)
- Construction (6.0%)
- Professional, scientific, technical services (4.7%)
- Public administration (4.4%)
- Finance & insurance (4.3%)
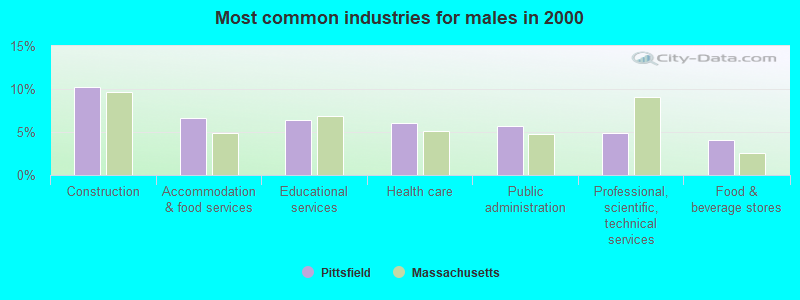
- Construction (10.3%)
- Accommodation & food services (6.6%)
- Educational services (6.4%)
- Health care (6.1%)
- Public administration (5.6%)
- Professional, scientific, technical services (4.9%)
- Food & beverage stores (4.0%)
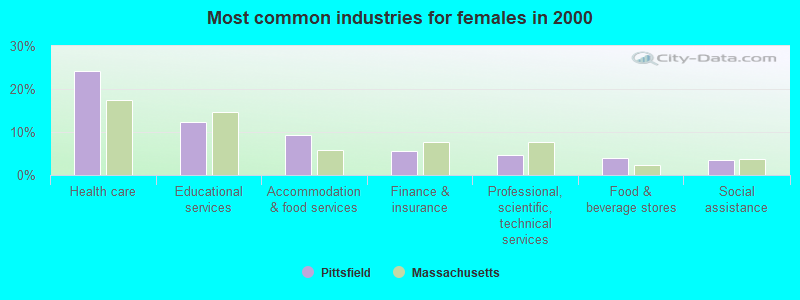
- Health care (24.1%)
- Educational services (12.4%)
- Accommodation & food services (9.2%)
- Finance & insurance (5.7%)
- Professional, scientific, technical services (4.5%)
- Food & beverage stores (4.1%)
- Social assistance (3.5%)
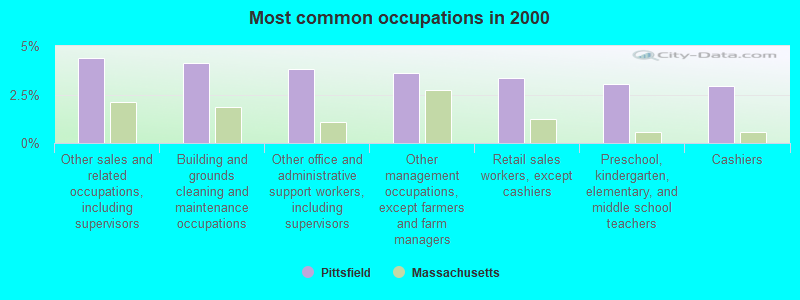
- Other sales and related occupations, including supervisors (4.4%)
- Building and grounds cleaning and maintenance occupations (4.1%)
- Other office and administrative support workers, including supervisors (3.8%)
- Other management occupations, except farmers and farm managers (3.6%)
- Retail sales workers, except cashiers (3.3%)
- Preschool, kindergarten, elementary, and middle school teachers (3.0%)
- Cashiers (2.9%)
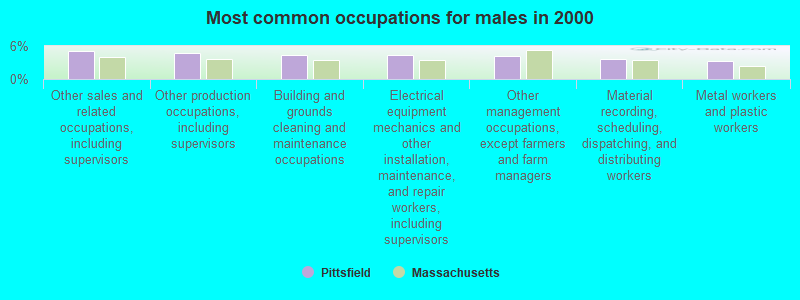
- Other sales and related occupations, including supervisors (5.0%)
- Other production occupations, including supervisors (4.7%)
- Building and grounds cleaning and maintenance occupations (4.4%)
- Electrical equipment mechanics and other installation, maintenance, and repair workers, including supervisors (4.3%)
- Other management occupations, except farmers and farm managers (4.2%)
- Material recording, scheduling, dispatching, and distributing workers (3.6%)
- Metal workers and plastic workers (3.2%)
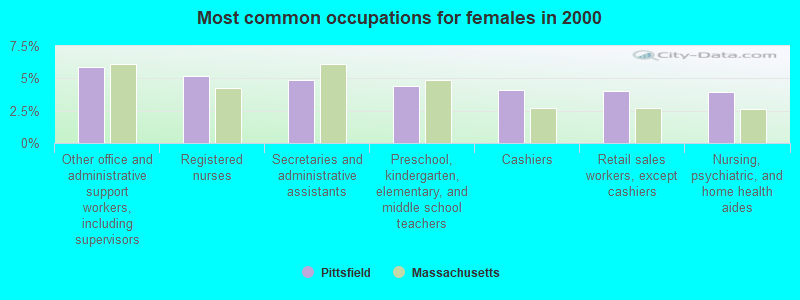
- Other office and administrative support workers, including supervisors (5.8%)
- Registered nurses (5.2%)
- Secretaries and administrative assistants (4.9%)
- Preschool, kindergarten, elementary, and middle school teachers (4.4%)
- Cashiers (4.1%)
- Retail sales workers, except cashiers (4.0%)
- Nursing, psychiatric, and home health aides (3.9%)
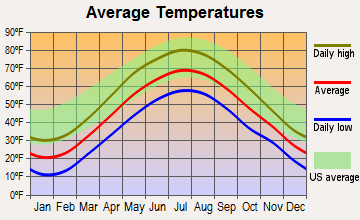
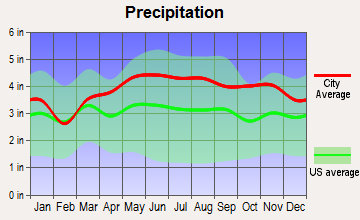
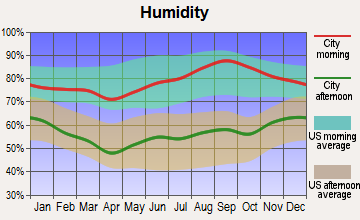
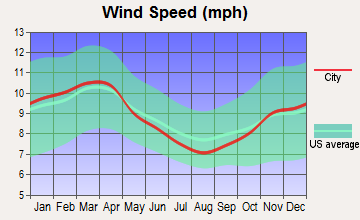
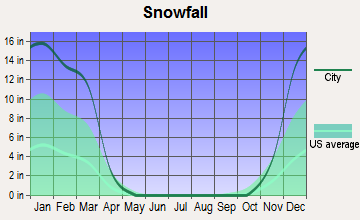
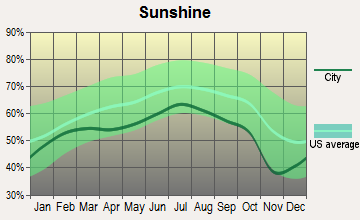
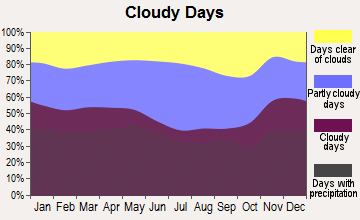
Average climate in Pittsfield, Massachusetts
Based on data reported by over 4,000 weather stations
|
|

(lower is better)
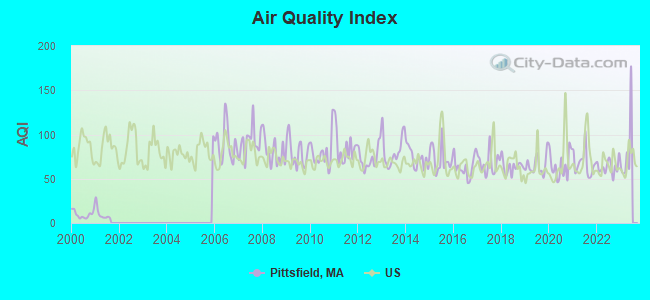
Air Quality Index (AQI) level in 2022 was 63.5. This is about average.
| City: | 63.5 |
| U.S.: | 72.6 |
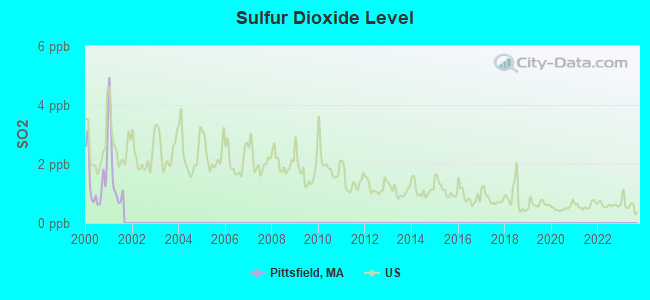
Sulfur Dioxide (SO2) [ppb] level in 2001 was 1.71. This is about average. Closest monitor was 0.9 miles away from the city center.
| City: | 1.71 |
| U.S.: | 1.51 |
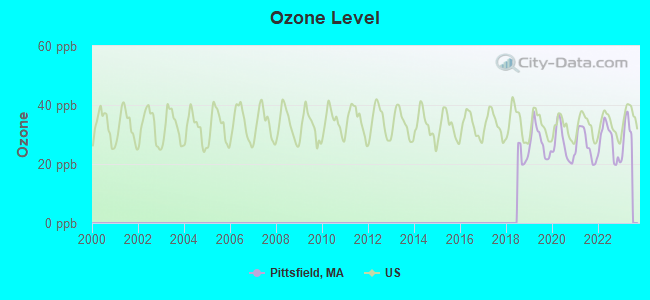
Ozone [ppb] level in 2022 was 27.5. This is better than average. Closest monitor was 0.6 miles away from the city center.
| City: | 27.5 |
| U.S.: | 33.3 |
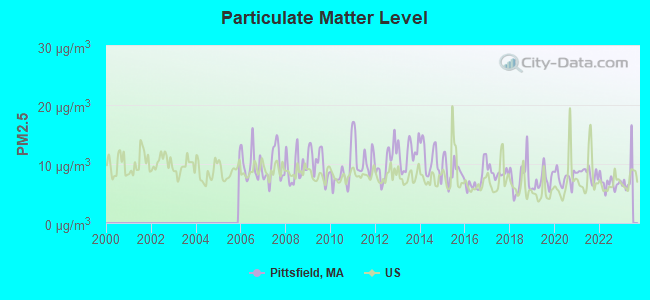
Particulate Matter (PM2.5) [µg/m3] level in 2022 was 6.76. This is about average. Closest monitor was 0.2 miles away from the city center.
| City: | 6.76 |
| U.S.: | 8.11 |
Tornado activity:
Pittsfield-area historical tornado activity is slightly above Massachusetts state average. It is 21% smaller than the overall U.S. average.
On 8/28/1973, a category F4 (max. wind speeds 207-260 mph) tornado 8.9 miles away from the Pittsfield city center killed 4 people and injured 36 people and caused between $5,000,000 and $50,000,000 in damages.
On 5/29/1995, a category F4 tornado 19.7 miles away from the city center killed 3 people and injured 24 people and caused between $5,000,000 and $50,000,000 in damages.
Earthquake activity:
Pittsfield-area historical earthquake activity is significantly above Massachusetts state average. It is 69% smaller than the overall U.S. average.On 10/7/1983 at 10:18:46, a magnitude 5.3 (5.1 MB, 5.3 LG, 5.1 ML, Class: Moderate, Intensity: VI - VII) earthquake occurred 117.5 miles away from Pittsfield center
On 4/20/2002 at 10:50:47, a magnitude 5.3 (5.3 ML, Depth: 3.0 mi) earthquake occurred 144.2 miles away from Pittsfield center
On 4/20/2002 at 10:50:47, a magnitude 5.2 (5.2 MB, 4.2 MS, 5.2 MW, 5.0 MW) earthquake occurred 142.7 miles away from Pittsfield center
On 1/19/1982 at 00:14:42, a magnitude 4.7 (4.5 MB, 4.7 MD, 4.5 LG, Class: Light, Intensity: IV - V) earthquake occurred 110.6 miles away from Pittsfield center
On 10/16/2012 at 23:12:25, a magnitude 4.7 (4.7 ML, Depth: 10.0 mi) earthquake occurred 153.3 miles away from Pittsfield center
On 6/17/1991 at 08:53:16, a magnitude 4.1 (4.0 MB, 4.0 LG, Depth: 3.1 mi) earthquake occurred 73.7 miles away from Pittsfield center
Magnitude types: regional Lg-wave magnitude (LG), body-wave magnitude (MB), duration magnitude (MD), local magnitude (ML), surface-wave magnitude (MS), moment magnitude (MW)
Natural disasters:
The number of natural disasters in Berkshire County (21) is greater than the US average (15).Major Disasters (Presidential) Declared: 10
Emergencies Declared: 10
Causes of natural disasters: Floods: 5, Snowstorms: 5, Storms: 5, Hurricanes: 4, Winter Storms: 4, Blizzards: 2, Snows: 2, Snowfall: 1, Tropical Storm: 1, Wind: 1, Other: 1 (Note: some incidents may be assigned to more than one category).
Main business address for: BERKSHIRE HILLS BANCORP INC (SAVINGS INSTITUTIONS, NOT FEDERALLY CHARTERED).
Hospitals in Pittsfield:
- BERKSHIRE MEDICAL CENTER INC (Voluntary non-profit - Other, provides emergency services, 725 NORTH STREET)
- HILLCREST HOSPITAL (165 TOR COURT)
- HOSPICE OF THE BERKSHIRES, INC (369 SOUTH STREET)
Nursing Homes in Pittsfield:
- BERKSHIRE PLACE (89 SOUTH STREET)
- CENTER FOR OPTIMUM CARE-BERKSHIRE (360 HOUSATONIC STREET)
- HILLCREST COMMONS NURSING AND REHABILITATION CENTER (169 VALENTINE ROAD)
- MT GREYLOCK EXTENDED CARE FACILITY (1000 NORTH STREET)
- SKILLED NURSING UNIT BERKSHIRE MEDICAL CENTER (725 NORTH STREET 1ST FL JONES BLDG)
- SPRINGSIDE REHABILITATION AND SKILLED CARE CENTER (255 LEBANON AVENUE)
Dialysis Facilities in Pittsfield:
Home Health Centers in Pittsfield:
Airports located in Pittsfield:
- Pittsfield Municipal Airport (PSF) (Runways: 2, Air Taxi Ops: 3,500, Itinerant Ops: 9,000, Local Ops: 20,000, Military Ops: 500)
Colleges/Universities in Pittsfield:
Colleges/universities with over 2000 students nearest to Pittsfield:
- Williams College (about 19 miles; Williamstown, MA; Full-time enrollment: 2,141)
- Hudson Valley Community College (about 28 miles; Troy, NY; FT enrollment: 9,346)
- Rensselaer Polytechnic Institute (about 29 miles; Troy, NY; FT enrollment: 6,940)
- The Sage Colleges (about 30 miles; Troy, NY; FT enrollment: 2,499)
- The College of Saint Rose (about 31 miles; Albany, NY; FT enrollment: 4,085)
- Siena College (about 32 miles; Loudonville, NY; FT enrollment: 3,153)
- Westfield State University (about 33 miles; Westfield, MA; FT enrollment: 5,548)
Public high schools in Pittsfield:
- TACONIC HIGH (Students: 1,002, Location: 96 VALENTINE ROAD, Grades: 9-12)
- PITTSFIELD HIGH (Students: 998, Location: 300 EAST STREET, Grades: 9-12)
Private high schools in Pittsfield:
Biggest public elementary/middle schools in Pittsfield:
- THEODORE HERBERG MIDDLE (Students: 757, Location: 501 POMEROY AVENUE, Grades: 6-8)
- JOHN T REID MIDDLE (Students: 692, Location: 950 NORTH STREET, Grades: 6-8)
- EGREMONT (Students: 496, Location: 84 EGREMONT AVENUE, Grades: KG-5)
- SILVIO O CONTE COMMUNITY (Students: 442, Location: 200 WEST UNION STREET, Grades: PK-5)
- MORNINGSIDE COMMUNITY SCHOOL (Students: 429, Location: 100 BURBANK STREET, Grades: PK-5)
- CROSBY (Students: 408, Location: 517 WEST STREET, Grades: PK-5)
- WILLIAMS (Students: 337, Location: 50 BUSHEY ROAD, Grades: KG-5)
- ALLENDALE (Students: 309, Location: 180 CONNECTICUT AVENUE, Grades: KG-5)
- ROBERT T. CAPELESS ELEMENTARY SCHOOL (Students: 251, Location: 86 BROOKS AVENUE, Grades: PK-5)
- STEARNS (Students: 231, Location: 75 LEBANON AVENUE, Grades: KG-5)
Private elementary/middle schools in Pittsfield:
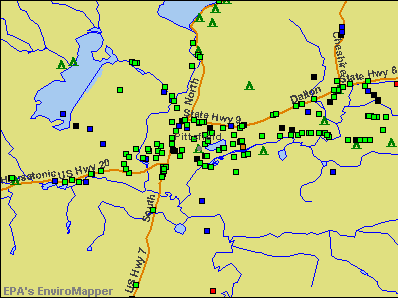
Points of interest:
Notable locations in Pittsfield: Downing Industrial Park (A), Federico Office Park (B), G E Athletic Association Golf Course (C), The Pittsfield Plaza (D), Ponterril (E), Berkshire Hills Country Club (F), Bousquet Ski Area (G), Pittsfield Country Club (H), Camp Stevenson (I), Catamount Ski Area (J), Memorial Park (K), Pontoosuc Lake Country Club (L), County Ambulance Service (M), Pittsfield Fire Department Company 6 (N), Pittsfield Fire Department Company 5 (O), Pittsfield Fire Department Company 2 (P), Pittsfield Fire Department Company 1 (Q), Pittsfield Fire Department Headquarters (R), Wahconah Street Greenhouses (S), Taconic High School Resource Center (T). Display/hide their locations on the map
Shopping Centers: Berkshire Common Shopping Center (1), Bradlees Plaza Shopping Center (2), Dalton Avenue Plaza Shopping Center (3), Pittsfield Mall Shopping Center (4), Pittsfield Plaza Shopping Center (5), Stop and Shop Plaza Shopping Center (6), A-Z Shopping Center (7), Allendale Shopping Center (8), Pittsfield Mall (9). Display/hide their locations on the map
Main business address in Pittsfield: BERKSHIRE HILLS BANCORP INC (A). Display/hide its location on the map
Churches in Pittsfield include: Morningside Baptist Church (A), Jacobs Ladder Ministry (B), First United Methodist Church (C), First Church of Christ Scientist (D), First Church of Christ Congregational (E), First Baptist Church (F), Faith Evangelical Lutheran Church (G), Evangelical Free Church (H), Cornerstone Baptist Church (I). Display/hide their locations on the map
Cemeteries: Pittsfield Cemetery (1), Saint Josephs Cemetery (2), East Part Cemetery (3). Display/hide their locations on the map
Lakes and reservoirs: Goodrich Pond (A), Morewood Lake (B), Mud Pond (C), Pecks Pond (D), Silver Lake (E), West Branch Housatonic River Reservoir (F), Onota Lake (G), Pontoosuc Lake (H). Display/hide their locations on the map
Streams, rivers, and creeks: West Branch Housatonic River (A), East Branch Housatonic River (B), Wampenum Brook (C), Unkamet Brook (D), Sykes Brook (E), Southwest Branch Housatonic River (F), Smith Brook (G), Shaker Brook (H), Sackett Brook (I). Display/hide their locations on the map
Parks in Pittsfield include: Osceola Park (1), Clapp Park (2), Wahcohah Park (3), Park Square Historic District (4), Canoe Meadows Wildlife Sanctuary (5), Sackett Brook Park (6), Berkshire County Softball Complex (7), Springside Park (8), Deming Park (9). Display/hide their locations on the map
Tourist attractions: Berkshire County Historical Society (Museums; 780 Holmes Road) (1), Berkshire Museum (39 South Street) (2), Arrowhead Museum (780 Holmes Road) (3), Berkshire Travel (Ski & Helicopter Tours; 39 Willis Street) (4), Berkshire Athenaeum - Reference Information Desk (Cultural Attractions- Events- & Facilities; 1 Wendell Avenue) (5), Cyberstation (Amusement & Theme Parks; Berkshire Cmn) (6), Amusement Games Inc (Amusement & Theme Parks; 518 East Street) (7), Burris Vending (Amusement & Theme Parks; 518 East Street) (8), East St Rentals (Amusement & Theme Parks; 745 East Street) (9). Display/hide their approximate locations on the map
Hotels: Comfort Inn (1055 South Street) (1), Crowne Plaza Berkshires (1 West Street) (2), Berkshire Inn (Ip) (150 W Housatonic St) (3), Heart of the Berkshires Motel (970 West Housatonic Street) (4), Colonial Motor Lodge (509 Lebanon Ave Rt 20w) (5), Huntsman Truck Caps (1350 West Housatonic Street) (6), Pittsfield Travelodge (16 Cheshire Rd) (7), Ramada Limited Inn & Suites Pittsfield (1350 W Housatonic St) (8), Ramada Inn & Suites (1350 West Housatonic Street) (9). Display/hide their approximate locations on the map
Courts: Mass Commonwealth - Courts- Berkshire Superior Court- Chief Court Off (24 Wendell Avenue) (1), Pittsfield District Court - Clerk's Office (24 Wendell Avenue) (2), Berkshire County - Superior Court- Probation Ofcr (76 East Street) (3), Mass Commonwealth - Courts- Berkshire Superior Court- Clerk's Office (76 East Street) (4), Mass Commonwealth - Courts- Central Berkshire District Court Adult Proba (24 Wendell Avenue) (5). Display/hide their approximate locations on the map
Birthplace of: Martha Coakley - Lawyer, Emily Robison - Musician, Marc Gafni - Jewish Renewal rabbi, Elizabeth Banks - Actress, Ben Silverman - Television executive, Andrea F. Nuciforo, Jr. - Politician, Edward Partridge - Mormon Bishop, Garrett McNamara - Surfer, Mary Ann Glendon - Diplomat, Jim Nutt - Artist.
Drinking water stations with addresses in Pittsfield and their reported violations in the past:
PITTSFIELD DPU WATER DEPT (Population served: 44,737, Surface water):Past health violations:ORONOQUE CONDOMINIUM TRUST (Address: 1 FENN STREET , Population served: 25, Groundwater):Past monitoring violations:
- MCL, Monthly (TCR) - In AUG-2008, Contaminant: Coliform. Follow-up actions: St AO (w/o penalty) issued (SEP-22-2008)
- Monitoring and Reporting (DBP) - Between OCT-2013 and DEC-2013, Contaminant: Total Haloacetic Acids (HAA5). Follow-up actions: St AO (w/o penalty) issued (MAR-10-2014)
- Follow-up Or Routine LCR Tap M/R - In JUN-01-2011, Contaminant: Lead and Copper Rule. Follow-up actions: St AO (w/o penalty) issued (NOV-08-2011)
- 2 minor monitoring violations
- One regular monitoring violation
Past health violations:Past monitoring violations:
- MCL, Monthly (TCR) - In FEB-2014, Contaminant: Coliform. Follow-up actions: St AO (w/o penalty) issued (MAR-14-2014)
- MCL, Monthly (TCR) - In MAY-2012, Contaminant: Coliform. Follow-up actions: St AO (w/o penalty) issued (JUN-01-2012)
- 23 regular monitoring violations
| This city: | 2.2 people |
| Massachusetts: | 2.5 people |
| This city: | 57.4% |
| Whole state: | 63.0% |
| This city: | 8.6% |
| Whole state: | 7.0% |
Likely homosexual households (counted as self-reported same-sex unmarried-partner households)
- Lesbian couples: 0.5% of all households
- Gay men: 0.2% of all households
People in group quarters in Pittsfield in 2010:
- 501 people in nursing facilities/skilled-nursing facilities
- 352 people in local jails and other municipal confinement facilities
- 134 people in residential treatment centers for adults
- 58 people in group homes intended for adults
- 47 people in emergency and transitional shelters (with sleeping facilities) for people experiencing homelessness
- 45 people in other noninstitutional facilities
- 25 people in residential treatment centers for juveniles (non-correctional)
- 16 people in group homes for juveniles (non-correctional)
- 6 people in college/university student housing
People in group quarters in Pittsfield in 2000:
- 621 people in nursing homes
- 279 people in local jails and other confinement facilities (including police lockups)
- 110 people in other noninstitutional group quarters
- 79 people in other nonhousehold living situations
- 64 people in homes for the mentally retarded
- 40 people in homes or halfway houses for drug/alcohol abuse
- 36 people in other group homes
- 28 people in homes for the mentally ill
- 7 people in short-term care, detention or diagnostic centers for delinquent children
- 3 people in mental (psychiatric) hospitals or wards
Banks with branches in Pittsfield (2011 data):
- Berkshire Bank: 8 branches. Info updated 2011/08/24: Bank assets: $3,955.6 mil, Deposits: $3,176.2 mil, local headquarters, positive income, Commercial Lending Specialization, 64 total offices
- TD Bank, National Association: Coltsville Branch at 660 Merril Road, branch established on 1986/09/22; West Street Branch at 99 West Street, branch established on 1818/01/01. Info updated 2010/10/04: Bank assets: $188,912.6 mil, Deposits: $153,149.8 mil, headquarters in Wilmington, DE, positive income, 1314 total offices, Holding Company: Toronto-Dominion Bank, The
- The Pittsfield Co-operative Bank: Dalton Avenue Branch at 110 Dalton Avenue, branch established on 1999/11/15; The Pittsfield Co-Operative Bank at 70 South Street, branch established on 1889/01/01. Info updated 2006/11/03: Bank assets: $230.2 mil, Deposits: $182.7 mil, local headquarters, positive income, 4 total offices
- TrustCo Bank: Pittsfield Branch at 1 Dan Fox Dr, branch established on 2006/09/21; Allendale Branch at 5 Cheshire Rd, Suite 18, branch established on 2007/04/25. Info updated 2011/07/21: Bank assets: $4,250.1 mil, Deposits: $3,736.0 mil, headquarters in Glenville, NY, positive income, Mortgage Lending Specialization, 135 total offices
- RBS Citizens, National Association: Pittsfield Rte. 7 Stop & Shop Branch at 1 Dan Fox Road, branch established on 2001/09/30; Pittsfield Stop & Shop Branch at 600 Merrill Road, branch established on 2001/09/30. Info updated 2007/09/19: Bank assets: $106,940.6 mil, Deposits: $75,690.2 mil, headquarters in Providence, RI, positive income, 1135 total offices, Holding Company: Uk Financial Investments Limited
- NBT Bank, National Association: Free Standing Building Branch at 609 Merrill Road, branch established on 1971/09/11. Info updated 2012/02/02: Bank assets: $5,558.5 mil, Deposits: $4,381.4 mil, headquarters in Norwich, NY, positive income, Commercial Lending Specialization, 133 total offices, Holding Company: Nbt Bancorp Inc.
For population 15 years and over in Pittsfield:
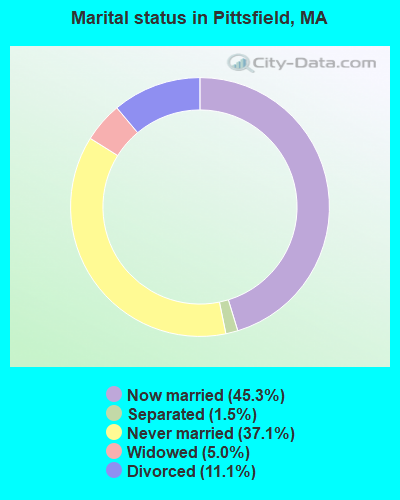
- Never married: 37.1%
- Now married: 45.3%
- Separated: 1.5%
- Widowed: 5.0%
- Divorced: 11.1%
For population 25 years and over in Pittsfield:
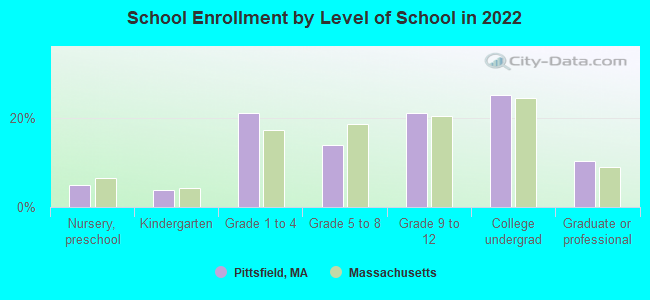
- High school or higher: 92.6%
- Bachelor's degree or higher: 34.2%
- Graduate or professional degree: 13.9%
- Unemployed: 7.6%
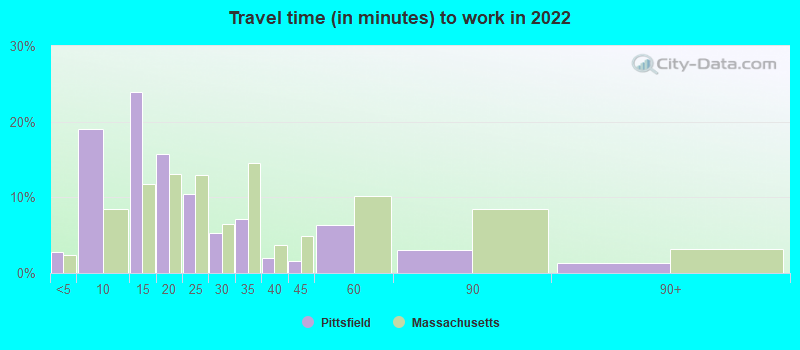
- Mean travel time to work (commute): 16.6 minutes

| Here: | 11.3 |
| Massachusetts average: | 13.0 |
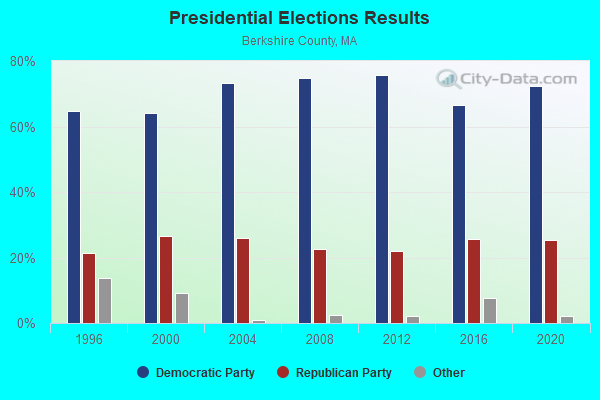
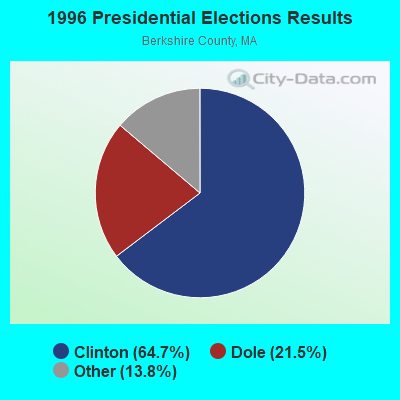

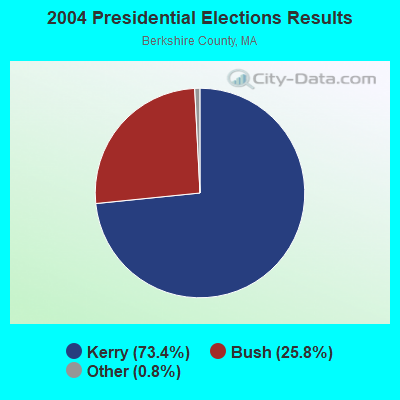
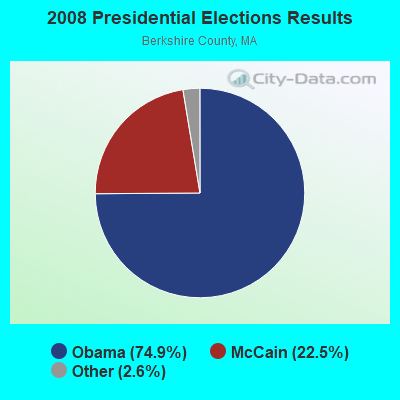

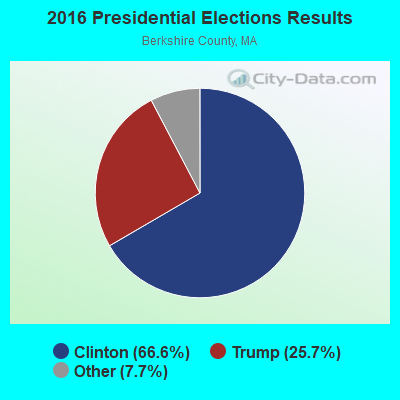

Graphs represent county-level data. Detailed 2008 Election Results
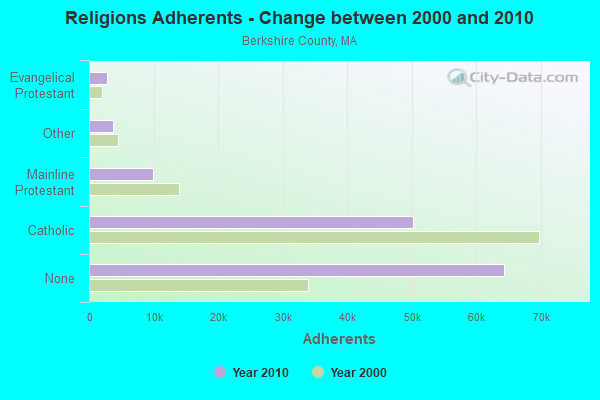
Religion statistics for Pittsfield, MA (based on Berkshire County data)
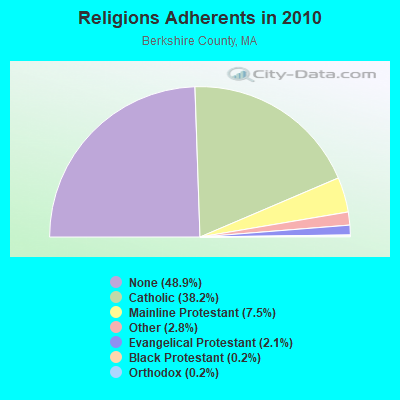
| Religion | Adherents | Congregations |
|---|---|---|
| Catholic | 50,187 | 32 |
| Mainline Protestant | 9,895 | 63 |
| Other | 3,647 | 20 |
| Evangelical Protestant | 2,817 | 28 |
| Black Protestant | 233 | 2 |
| Orthodox | 225 | 2 |
| None | 64,215 | - |
Food Environment Statistics:
| Berkshire County: | 2.54 / 10,000 pop. |
| Massachusetts: | 1.98 / 10,000 pop. |
| Berkshire County: | 1.61 / 10,000 pop. |
| Massachusetts: | 2.22 / 10,000 pop. |
| This county: | 4.08 / 10,000 pop. |
| State: | 1.77 / 10,000 pop. |
| Berkshire County: | 15.00 / 10,000 pop. |
| State: | 8.76 / 10,000 pop. |
| Here: | 8.0% |
| Massachusetts: | 8.1% |
| This county: | 22.8% |
| Massachusetts: | 22.5% |
| Berkshire County: | 9.9% |
| State: | 16.5% |
Health and Nutrition:
| This city: | 49.7% |
| Massachusetts: | 50.5% |
| Pittsfield: | 46.1% |
| Massachusetts: | 48.0% |
| Pittsfield: | 28.8 |
| State: | 28.4 |
| Pittsfield: | 21.9% |
| State: | 20.7% |
| Pittsfield: | 11.1% |
| Massachusetts: | 10.4% |
| Pittsfield: | 6.9 |
| Massachusetts: | 6.8 |
| Here: | 34.9% |
| Massachusetts: | 33.4% |
| Pittsfield: | 55.5% |
| Massachusetts: | 57.1% |
| Pittsfield: | 76.9% |
| State: | 79.2% |
More about Health and Nutrition of Pittsfield, MA Residents
| Local government employment and payroll (March 2022) | |||||
| Function | Full-time employees | Monthly full-time payroll | Average yearly full-time wage | Part-time employees | Monthly part-time payroll |
|---|---|---|---|---|---|
| Elementary and Secondary - Instruction | 754 | $4,700,900 | $74,815 | 81 | $187,758 |
| Elementary and Secondary - Other Total | 214 | $697,214 | $39,096 | 50 | $83,472 |
| Police Protection - Officers | 64 | $511,219 | $95,854 | 0 | $0 |
| Firefighters | 63 | $407,126 | $77,548 | 0 | $0 |
| Other and Unallocable | 31 | $116,221 | $44,989 | 0 | $0 |
| Sewerage | 20 | $74,361 | $44,617 | 0 | $0 |
| Financial Administration | 18 | $75,245 | $50,163 | 0 | $0 |
| Police - Other | 16 | $76,210 | $57,158 | 1 | $832 |
| Local Libraries | 12 | $41,295 | $41,295 | 2 | $2,428 |
| Water Supply | 10 | $45,961 | $55,153 | 0 | $0 |
| Housing and Community Development (Local) | 10 | $47,892 | $57,470 | 0 | $0 |
| Other Government Administration | 8 | $34,247 | $51,371 | 1 | $1,022 |
| Welfare | 8 | $21,975 | $32,963 | 0 | $0 |
| Health | 5 | $22,082 | $52,997 | 0 | $0 |
| Fire - Other | 2 | $14,568 | $87,408 | 0 | $0 |
| Airports | 1 | $6,999 | $83,988 | 0 | $0 |
| Judicial and Legal | 1 | $7,200 | $86,400 | 0 | $0 |
| Totals for Government | 1,237 | $6,900,715 | $66,943 | 135 | $275,512 |
Pittsfield government finances - Expenditure in 2021 (per resident):
- Construction - Parking Facilities: $176,000 ($4.06)
- Current Operations - Elementary and Secondary Education: $98,920,000 ($2284.00)
General - Other: $50,353,000 ($1162.62)
Police Protection: $10,488,000 ($242.16)
Local Fire Protection: $7,997,000 ($184.65)
Regular Highways: $6,352,000 ($146.66)
Sewerage: $4,826,000 ($111.43)
Solid Waste Management: $3,601,000 ($83.14)
Water Utilities: $3,368,000 ($77.76)
Housing and Community Development: $2,019,000 ($46.62)
General Public Buildings: $1,763,000 ($40.71)
Libraries: $1,166,000 ($26.92)
Financial Administration: $1,035,000 ($23.90)
Central Staff Services: $849,000 ($19.60)
Public Welfare - Other: $763,000 ($17.62)
Parks and Recreation: $745,000 ($17.20)
Protective Inspection and Regulation - Other: $485,000 ($11.20)
Health - Other: $470,000 ($10.85)
Parking Facilities: $235,000 ($5.43)
Judicial and Legal Services: $209,000 ($4.83)
Natural Resources - Other: $59,000 ($1.36)
- General - Interest on Debt: $4,608,000 ($106.40)
- Intergovernmental to Local - Other - Elementary and Secondary Education: $4,161,000 ($96.07)
Other - Health - Other: $163,000 ($3.76)
- Intergovernmental to State - Transit Utilities: $451,000 ($10.41)
General - Other: $90,000 ($2.08)
- Other Capital Outlay - Sewerage: $29,469,000 ($680.42)
Elementary and Secondary Education: $1,959,000 ($45.23)
Water Utilities: $299,000 ($6.90)
General Public Building: $177,000 ($4.09)
Solid Waste Management: $100,000 ($2.31)
- Total Salaries and Wages: $57,991,000 ($1338.97)
- Water Utilities - Interest on Debt: $456,000 ($10.53)
Pittsfield government finances - Revenue in 2021 (per resident):
- Charges - Sewerage: $7,518,000 ($173.59)
Other: $1,699,000 ($39.23)
Elementary and Secondary Education School Lunch: $1,201,000 ($27.73)
Parking Facilities: $588,000 ($13.58)
Elementary and Secondary Education School Tuition and Transportation: $140,000 ($3.23)
Elementary and Secondary Education - Other: $33,000 ($0.76)
Parks and Recreation: $10,000 ($0.23)
- Federal Intergovernmental - Other: $17,433,000 ($402.52)
Housing and Community Development: $1,871,000 ($43.20)
- Local Intergovernmental - Education: $730,000 ($16.86)
- Miscellaneous - General Revenue - Other: $10,321,000 ($238.31)
Fines and Forfeits: $270,000 ($6.23)
Donations From Private Sources: $195,000 ($4.50)
Interest Earnings: $60,000 ($1.39)
- Revenue - Water Utilities: $5,293,000 ($122.21)
- State Intergovernmental - Education: $60,108,000 ($1387.85)
General Local Government Support: $9,485,000 ($219.00)
Highways: $4,401,000 ($101.62)
Other: $3,932,000 ($90.79)
Public Welfare: $608,000 ($14.04)
Sewerage: $44,000 ($1.02)
- Tax - Property: $96,855,000 ($2236.32)
Other Selective Sales: $2,489,000 ($57.47)
Other License: $739,000 ($17.06)
Pittsfield government finances - Debt in 2021 (per resident):
- Long Term Debt - Outstanding Unspecified Public Purpose: $206,204,000 ($4761.12)
Beginning Outstanding - Unspecified Public Purpose: $137,672,000 ($3178.76)
Issue, Unspecified Public Purpose: $86,157,000 ($1989.31)
Retired Unspecified Public Purpose: $17,625,000 ($406.95)
- Short Term Debt Outstanding - Beginning: $85,258,000 ($1968.55)
End of Fiscal Year: $14,712,000 ($339.69)
Pittsfield government finances - Cash and Securities in 2021 (per resident):
- Bond Funds - Cash and Securities: $50,652,000 ($1169.52)
- Other Funds - Cash and Securities: $51,197,000 ($1182.11)
| Businesses in Pittsfield, MA | ||||
| Name | Count | Name | Count | |
|---|---|---|---|---|
| AT&T | 1 | New Balance | 1 | |
| Advance Auto Parts | 1 | Nike | 3 | |
| Applebee's | 1 | Nissan | 1 | |
| Ashley Furniture | 1 | Old Country Buffet | 1 | |
| Audi | 1 | Panera Bread | 1 | |
| BMW | 1 | Penske | 1 | |
| Barnes & Noble | 1 | Pier 1 Imports | 1 | |
| Bed Bath & Beyond | 1 | Pizza Hut | 2 | |
| Ben & Jerry's | 1 | RadioShack | 1 | |
| Burger King | 3 | Ramada | 1 | |
| CVS | 1 | Rite Aid | 4 | |
| Comfort Inn | 1 | SAS Shoes | 1 | |
| Curves | 1 | Staples | 1 | |
| Domino's Pizza | 2 | Starbucks | 1 | |
| Dunkin Donuts | 5 | Stop & Shop | 2 | |
| Fashion Bug | 1 | Subaru | 1 | |
| FedEx | 6 | Subway | 6 | |
| Ford | 1 | T.J.Maxx | 1 | |
| GameStop | 1 | Taco Bell | 1 | |
| Goodwill | 4 | Toyota | 1 | |
| H&R Block | 2 | Travelodge | 1 | |
| Holiday Inn | 1 | True Value | 1 | |
| Home Depot | 1 | U-Haul | 3 | |
| Hyundai | 1 | UPS | 9 | |
| La-Z-Boy | 1 | Verizon Wireless | 1 | |
| Lane Furniture | 2 | Volkswagen | 1 | |
| MasterBrand Cabinets | 8 | Walmart | 1 | |
| Mazda | 1 | Wendy's | 1 | |
| McDonald's | 2 | YMCA | 1 | |
Strongest AM radio stations in Pittsfield:
- WUHN (1110 AM; daytime; 5 kW; PITTSFIELD, MA; Owner: WEINER BROADCASTING, INC.)
- WBEC (1420 AM; 1 kW; PITTSFIELD, MA; Owner: GREAT NORTHERN RADIO, LLC)
- WBRK (1340 AM; 1 kW; PITTSFIELD, MA; Owner: WBRK, INC.)
- WNNZ (640 AM; 50 kW; WESTFIELD, MA; Owner: CLEAR CHANNEL BROADCASTING LICENSES, INC.)
- WGY (810 AM; 50 kW; SCHENECTADY, NY; Owner: CLEAR CHANNEL BROADCASTING LICENSES, INC.)
- WPTR (1540 AM; 50 kW; ALBANY, NY; Owner: KIMTRON, INC.)
- WTIC (1080 AM; 50 kW; HARTFORD, CT; Owner: INFINITY RADIO OPERATIONS INC.)
- WCRN (830 AM; 50 kW; WORCESTER, MA; Owner: CARTER BROADCASTING CORPORATION)
- WSBS (860 AM; 3 kW; GREAT BARRINGTON, MA; Owner: BERKSHIRE BROADCASTING CO., INC.)
- WROW (590 AM; 5 kW; ALBANY, NY; Owner: 6 JOHNSON ROAD LICENSES, INC.)
- WVNE (760 AM; daytime; 25 kW; LEICESTER, MA; Owner: BLOUNT MASSCOM, INC.)
- WHYN (560 AM; 5 kW; SPRINGFIELD, MA; Owner: CLEAR CHANNEL BROADCASTING LICENSES, INC.)
- WRKO (680 AM; 50 kW; BOSTON, MA; Owner: ENTERCOM BOSTON LICENSE, LLC)
Strongest FM radio stations in Pittsfield:
- WBEC-FM (105.5 FM; PITTSFIELD, MA; Owner: GREAT NORTHERN RADIO, LLC)
- WUPE (95.9 FM; PITTSFIELD, MA; Owner: WEINER BROADCASTING, INC.)
- WBRK-FM (101.7 FM; PITTSFIELD, MA; Owner: WBRK, INC.)
- WAMC-FM (90.3 FM; ALBANY, NY; Owner: WAMC)
- WHVP (91.1 FM; HUDSON, NY; Owner: SOUND OF LIFE, INC.)
- WTBR-FM (89.7 FM; PITTSFIELD, MA; Owner: PITTSFIELD PUBLIC SCHL. COMMITTEE)
- WZEC (97.5 FM; HOOSICK FALLS, NY; Owner: GREAT NORTHERN RADIO, LLC)
- WAMQ (105.1 FM; GREAT BARRINGTON, MA; Owner: WAMC)
- WEQX (102.7 FM; MANCHESTER, VT; Owner: NORTHSHIRE COMMUNICATIONS, INC.)
- WJAN (95.1 FM; SUNDERLAND, VT; Owner: 6 JOHNSON ROAD LICENSES, INC.)
- WVAY (100.7 FM; WILMINGTON, VT; Owner: GREAT NORTHERN RADIO, L.L.C.)
- WMNB (100.1 FM; NORTH ADAMS, MA; Owner: BERKSHIRE BROADCASTING CO., INC.)
- WHYN-FM (93.1 FM; SPRINGFIELD, MA; Owner: CLEAR CHANNEL BROADCASTING LICENSES, INC.)
- WRNX (100.9 FM; AMHERST, MA; Owner: WESTERN MASSACHUSETTS RADIO COMPANY)
- WAJZ (96.3 FM; VOORHEESVILLE, NY; Owner: 6 JOHNSON ROAD LICENSES, INC.)
- WAMK (90.9 FM; KINGSTON, NY; Owner: W A M C)
- WFGB (89.7 FM; KINGSTON, NY; Owner: SOUND OF LIFE, INC.)
- WZMR (104.9 FM; ALTAMONT, NY; Owner: 6 JOHNSON ROAD LICENSES, INC.)
- WYJB (95.5 FM; ALBANY, NY; Owner: 6 JOHNSON ROAD LICENSES, INC.)
- WGNA-FM (107.7 FM; ALBANY, NY; Owner: REGENT LICENSEE OF MANSFIELD, INC.)
TV broadcast stations around Pittsfield:
- W07AI (Channel 7; PITTSFIELD, ETC., MA; Owner: WNYT-TV, LLC)
- WTIC-TV (Channel 61; HARTFORD, CT; Owner: TRIBUNE TELEVISION COMPANY)
- WCDC-TV (Channel 19; ADAMS, MA; Owner: YOUNG BROADCASTING OF ALBANY, INC.)
- W38DL (Channel 38; ADAMS, ETC., MA; Owner: WNYT-TV, LLC)
- W35BK (Channel 35; PLAINFIELD, MA; Owner: LYDIA SYLVANE STOCKWELL)
- National Bridge Inventory (NBI) Statistics
- 52Number of bridges
- 335ft / 102mTotal length
- $71,155,000Total costs
- 433,397Total average daily traffic
- 27,670Total average daily truck traffic
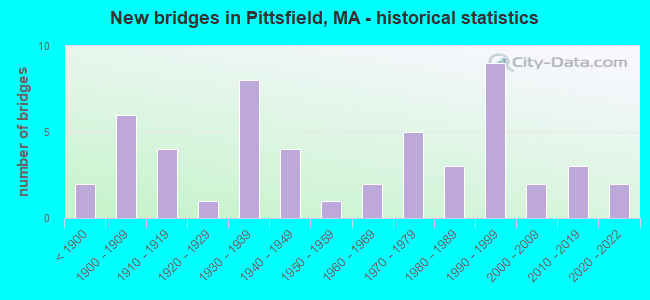
- New bridges - historical statistics
- 2Before 1900
- 61900-1909
- 41910-1919
- 11920-1929
- 81930-1939
- 41940-1949
- 11950-1959
- 21960-1969
- 51970-1979
- 31980-1989
- 91990-1999
- 22000-2009
- 32010-2019
- 22020-2022
FCC Registered Commercial Land Mobile Towers: 2 (See the full list of FCC Registered Commercial Land Mobile Towers in Pittsfield, MA)
FCC Registered Private Land Mobile Towers: 1 (See the full list of FCC Registered Private Land Mobile Towers)
FCC Registered Broadcast Land Mobile Towers: 37 (See the full list of FCC Registered Broadcast Land Mobile Towers)
FCC Registered Microwave Towers: 33 (See the full list of FCC Registered Microwave Towers in this town)
FCC Registered Paging Towers: 10 (See the full list of FCC Registered Paging Towers)
FCC Registered Maritime Coast & Aviation Ground Towers: 5 (See the full list of FCC Registered Maritime Coast & Aviation Ground Towers)
FCC Registered Amateur Radio Licenses: 263 (See the full list of FCC Registered Amateur Radio Licenses in Pittsfield)
FAA Registered Aircraft Manufacturers and Dealers: 3 (See the full list of FAA Registered Manufacturers and Dealers in Pittsfield)
FAA Registered Aircraft: 32 (See the full list of FAA Registered Aircraft)
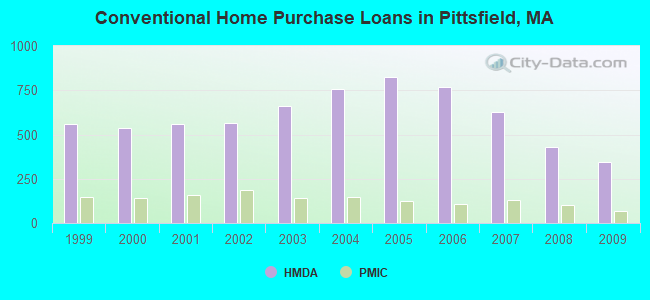
| Home Mortgage Disclosure Act Aggregated Statistics For Year 2009 (Based on 12 full tracts) | ||||||||||||||
| A) FHA, FSA/RHS & VA Home Purchase Loans | B) Conventional Home Purchase Loans | C) Refinancings | D) Home Improvement Loans | E) Loans on Dwellings For 5+ Families | F) Non-occupant Loans on < 5 Family Dwellings (A B C & D) | G) Loans On Manufactured Home Dwelling (A B C & D) | ||||||||
|---|---|---|---|---|---|---|---|---|---|---|---|---|---|---|
| Number | Average Value | Number | Average Value | Number | Average Value | Number | Average Value | Number | Average Value | Number | Average Value | Number | Average Value | |
| LOANS ORIGINATED | 47 | $148,553 | 345 | $145,472 | 1,023 | $144,573 | 219 | $66,776 | 6 | $264,167 | 86 | $141,477 | 9 | $35,222 |
| APPLICATIONS APPROVED, NOT ACCEPTED | 0 | $0 | 11 | $162,545 | 60 | $174,600 | 10 | $50,300 | 0 | $0 | 6 | $264,667 | 1 | $30,000 |
| APPLICATIONS DENIED | 9 | $123,667 | 68 | $123,118 | 223 | $148,197 | 34 | $46,029 | 0 | $0 | 16 | $175,812 | 4 | $49,250 |
| APPLICATIONS WITHDRAWN | 8 | $127,375 | 42 | $147,119 | 181 | $152,320 | 7 | $51,714 | 2 | $503,000 | 16 | $137,375 | 2 | $41,500 |
| FILES CLOSED FOR INCOMPLETENESS | 0 | $0 | 3 | $80,000 | 39 | $145,179 | 2 | $157,000 | 0 | $0 | 1 | $127,000 | 0 | $0 |
Detailed mortgage data for all 12 tracts in Pittsfield, MA
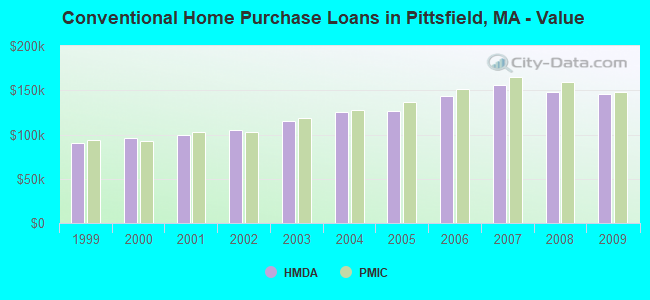
| Private Mortgage Insurance Companies Aggregated Statistics For Year 2009 (Based on 11 full tracts) | ||||||
| A) Conventional Home Purchase Loans | B) Refinancings | C) Non-occupant Loans on < 5 Family Dwellings (A & B) | ||||
|---|---|---|---|---|---|---|
| Number | Average Value | Number | Average Value | Number | Average Value | |
| LOANS ORIGINATED | 66 | $147,939 | 26 | $183,615 | 0 | $0 |
| APPLICATIONS APPROVED, NOT ACCEPTED | 21 | $192,952 | 14 | $214,000 | 0 | $0 |
| APPLICATIONS DENIED | 8 | $200,375 | 6 | $209,167 | 1 | $462,000 |
| APPLICATIONS WITHDRAWN | 10 | $172,000 | 6 | $148,000 | 0 | $0 |
| FILES CLOSED FOR INCOMPLETENESS | 1 | $198,000 | 1 | $226,000 | 1 | $226,000 |
2002 - 2018 National Fire Incident Reporting System (NFIRS) incidents
- Fire incident types reported to NFIRS in Pittsfield, MA
- 2,23450.7%Structure Fires
- 1,63537.1%Outside Fires
- 3337.6%Mobile Property/Vehicle Fires
- 2014.6%Other
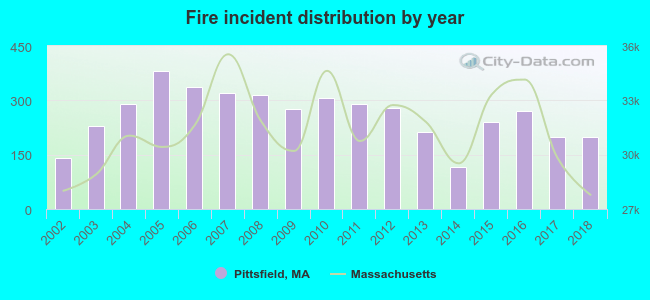 According to the data from the years 2002 - 2018 the average number of fire incidents per year is 259. The highest number of fires - 381 took place in 2005, and the least - 115 in 2014. The data has a rising trend.
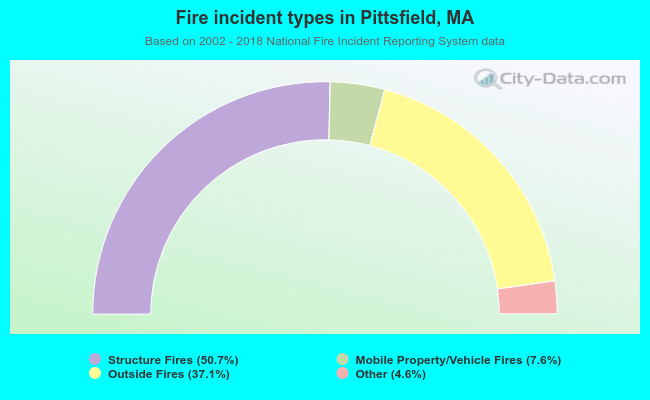 When looking into fire subcategories, the most reports belonged to: Structure Fires (50.7%), and Outside Fires (37.1%).
Fire-safe hotels and motels in Pittsfield, Massachusetts:
- Holiday Inn and Suites PIttsfield, 1 West St, Pittsfield, Massachusetts 01201 , Phone: (413) 499-2000, Fax: (413) 442-0449
- Comfort Inn, 1055 South St, Pittsfield, Massachusetts 01201 , Phone: (413) 443-4714, Fax: (413) 445-7400
- Patriot Suites Hotel, 8 Dan Fox Dr, Pittsfield, Massachusetts 01201 , Phone: (413) 997-3300, Fax: (413) 997-3301
- Best Western Berkshire Hills Inn And Suites, 1350 W Housatonic, Pittsfield, Massachusetts 01201 , Phone: (413) 442-8714
- Berkshire Inn, 150 W Housatonic St, Pittsfield, Massachusetts 01201 , Phone: (413) 443-3000, Fax: (413) 443-3549
- Hotel on North, 297 North St, Pittsfield, Massachusetts 01201 , Phone: (413) 358-4741, Fax: (413) 499-1809
- Hilton Garden Inn Lenox-Pittsfield, 1032 South St, Pittsfield, Massachusetts 01201 , Phone: (800) 774-1500, Fax: (413) 448-2224
| Most common first names in Pittsfield, MA among deceased individuals | ||
| Name | Count | Lived (average) |
|---|---|---|
| Mary | 782 | 81.5 years |
| John | 682 | 73.9 years |
| William | 492 | 74.0 years |
| Joseph | 416 | 76.4 years |
| George | 318 | 76.0 years |
| James | 308 | 73.9 years |
| Robert | 305 | 68.7 years |
| Margaret | 303 | 80.7 years |
| Elizabeth | 295 | 79.4 years |
| Charles | 289 | 74.4 years |
| Most common last names in Pittsfield, MA among deceased individuals | ||
| Last name | Count | Lived (average) |
|---|---|---|
| Smith | 124 | 76.6 years |
| Kelly | 75 | 78.2 years |
| Williams | 71 | 78.1 years |
| Murphy | 69 | 78.0 years |
| Johnson | 63 | 74.8 years |
| Brown | 62 | 74.2 years |
| Obrien | 59 | 77.0 years |
| Martin | 59 | 80.2 years |
| White | 56 | 76.2 years |
| Jones | 55 | 74.7 years |
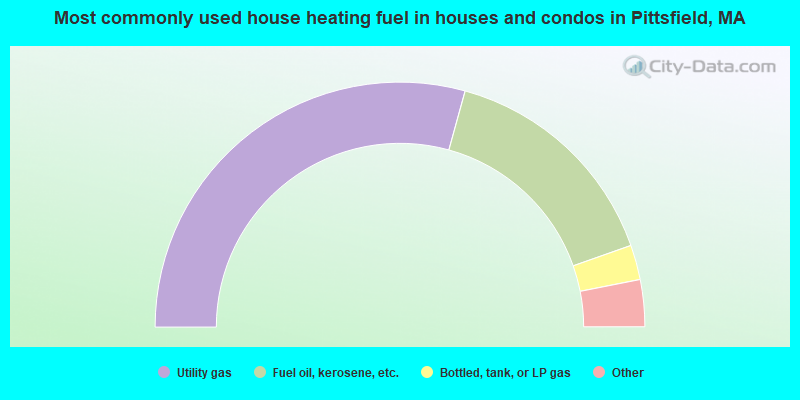
- 57.8%Utility gas
- 31.0%Fuel oil, kerosene, etc.
- 4.3%Bottled, tank, or LP gas
- 4.3%Electricity
- 1.6%Wood
- 0.7%Other fuel
- 0.3%Solar energy
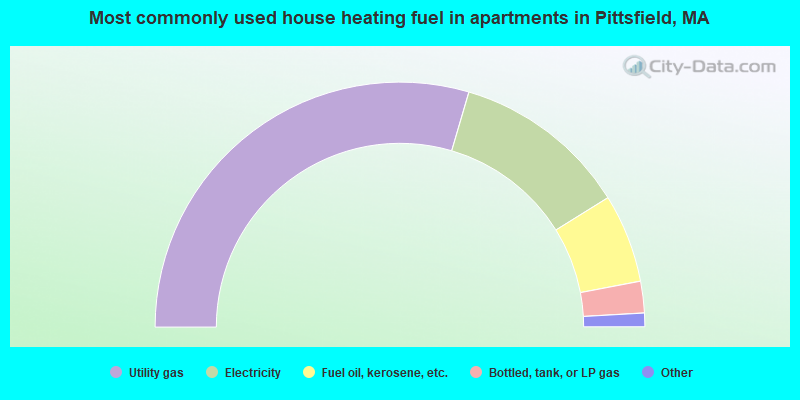
- 61.7%Utility gas
- 21.8%Electricity
- 9.7%Fuel oil, kerosene, etc.
- 4.1%Bottled, tank, or LP gas
- 1.8%Other fuel
- 0.8%No fuel used
- 0.1%Wood
Pittsfield compared to Massachusetts state average:
- Median house value below state average.
- Unemployed percentage below state average.
- Foreign-born population percentage significantly below state average.
- Length of stay since moving in significantly above state average.
Pittsfield on our top lists:
- #78 on the list of "Top 101 cities with the biggest property tax revenues per resident (population 10,000+)"
- #14 on the list of "Top 101 counties with the lowest number of births per 1000 residents 2007-2013"
- #22 on the list of "Top 101 counties with the lowest percentage of residents relocating from other counties between 2010 and 2011"
- #28 on the list of "Top 101 counties with the lowest percentage of residents relocating to other counties in 2011"
- #53 on the list of "Top 101 counties with highest percentage of residents voting for Obama (Democrat) in the 2012 Presidential Election"
- #71 on the list of "Top 101 counties with the largest number of people moving out compared to moving in (pop. 50,000+)"

|
|
Total of 156 patent applications in 2008-2024.