Queen City, Texas
Submit your own pictures of this city and show them to the world
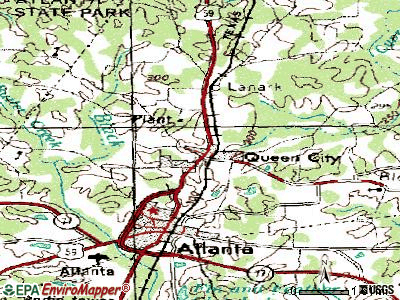
- OSM Map
- General Map
- Google Map
- MSN Map
Population change since 2000: -13.6%
 |
| Males: 620 | |
| Females: 774 |
| Median resident age: | 41.2 years |
| Texas median age: | 35.6 years |
Zip codes: 75572.
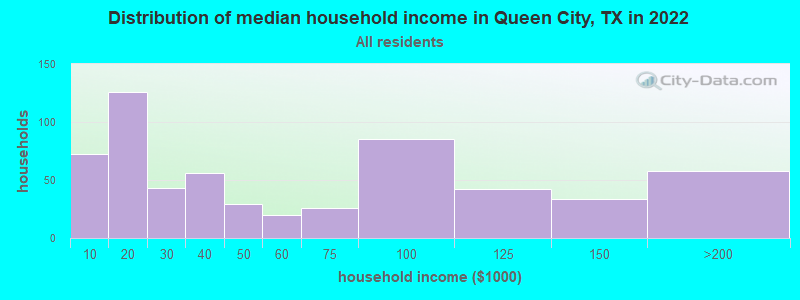
| Queen City: | $39,743 |
| TX: | $72,284 |
Estimated per capita income in 2022: $27,026 (it was $13,492 in 2000)
Queen City city income, earnings, and wages data
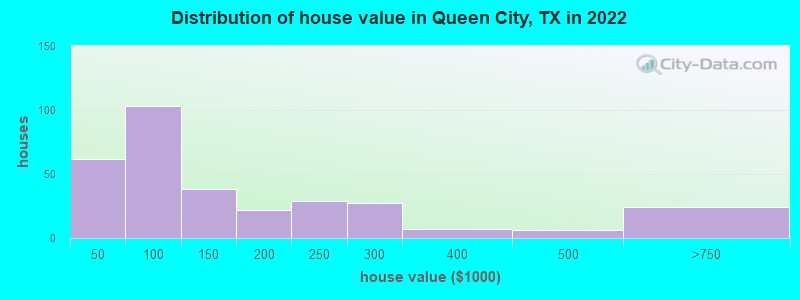
Estimated median house or condo value in 2022: $111,780 (it was $46,400 in 2000)
| Queen City: | $111,780 |
| TX: | $275,400 |
Mean prices in 2022: all housing units: $218,642; detached houses: $258,148; townhouses or other attached units: $174,908; mobile homes: $96,761; occupied boats, rvs, vans, etc.: $24,816
Median gross rent in 2022: $767.
(14.4% for White Non-Hispanic residents, 53.8% for Black residents)
Detailed information about poverty and poor residents in Queen City, TX
Compare current foreclosures near Queen City, TX:
| Photo | Address | Area | Beds / Baths | Price | Details |
|---|---|---|---|---|---|

|
#1
Co Rd 3784
Queen City, TX 75572
|
884 sq. feet
|
1 baths 2 beds |
show details | |

|
#2
Fm 2327
Queen City, TX 75572
|
- sq. feet
|
- baths - beds |
show details | |

|
#3
County Road 3656
Queen City, TX 75572
|
- sq. feet
|
- baths - beds |
show details | |

|
#4
Fm 2327
Queen City, TX 75572
|
- sq. feet
|
- baths - beds |
show details | |

|
#5
Mc 28
Texarkana, AR 71854
|
2,432 sq. feet
|
3 baths 3 beds |
$239,900
|
show details |

|
#6
Robinson
Rodessa, LA 71069
|
- sq. feet
|
- baths - beds |
$5,875
|
show details |

|
#7
Fm 251
Mc Leod, TX 75565
|
1,534 sq. feet
|
2 baths 3 beds |
show details | |

|
#8
Front
Rodessa, LA 71069
|
- sq. feet
|
- baths - beds |
$5,875
|
show details |

|
#9
Hosston Rd
Rodessa, LA 71069
|
- sq. feet
|
- baths - beds |
$5,875
|
show details |

|
#10
Journey St
Rodessa, LA 71069
|
- sq. feet
|
- baths - beds |
$5,800
|
show details |
| Photo | Address | Area | Beds / Baths | Price | Details |
|---|---|---|---|---|---|

|
#11
Spearman
Rodessa, LA 71069
|
- sq. feet
|
- baths - beds |
$5,800
|
show details |

|
#12
Bois D Arc St
Rodessa, LA 71069
|
- sq. feet
|
- baths - beds |
$5,875
|
show details |

|
#13
Tyson Rd
Rodessa, LA 71069
|
- sq. feet
|
- baths - beds |
$5,875
|
show details |

|
#14
Church Rd
Rodessa, LA 71069
|
- sq. feet
|
- baths - beds |
$5,800
|
show details |

|
#15
County Road 1116
Maud, TX 75567
|
1,512 sq. feet
|
2 baths 3 beds |
show details | |

|
#16
Shelia St
Atlanta, TX 75551
|
1,450 sq. feet
|
2 baths 3 beds |
show details | |

|
#17
Blackman Ferry Rd
Texarkana, AR 71854
|
2,000 sq. feet
|
2 baths - beds |
show details | |

|
#18
N Lake Davis Dr
Texarkana, AR 71854
|
2,140 sq. feet
|
2 baths - beds |
show details | |

|
#19
Woodland Lake Dr
Atlanta, TX 75551
|
2,419 sq. feet
|
- baths - beds |
show details | |

|
#20
Cherokee Trl
Texarkana, TX 75501
|
1,260 sq. feet
|
- baths - beds |
show details |
| Photo | Address | Area | Beds / Baths | Price | Details |
|---|---|---|---|---|---|

|
#21
Cummings Ln
Texarkana, TX 75501
|
- sq. feet
|
- baths - beds |
show details | |

|
#22
Redwater Blvd E
Texarkana, TX 75501
|
- sq. feet
|
- baths - beds |
show details | |

|
#23
Eylau Loop Rd
Texarkana, TX 75501
|
872 sq. feet
|
- baths - beds |
show details | |

|
#24
Miller County 20
Texarkana, AR 71854
|
- sq. feet
|
- baths - beds |
show details | |

|
#25
Tony Ln
Texarkana, TX 75501
|
- sq. feet
|
- baths - beds |
show details | |

|
#26
S Kings Hwy
Texarkana, TX 75501
|
- sq. feet
|
- baths - beds |
show details | |

|
#27
County Road 1204
Maud, TX 75567
|
- sq. feet
|
- baths - beds |
show details | |

|
#28
Stipp Ln
Texarkana, TX 75501
|
3,010 sq. feet
|
- baths - beds |
show details | |

|
#29
Clara Ln
Texarkana, TX 75501
|
- sq. feet
|
- baths - beds |
show details | |

|
#30
Fm 251 S
Bivins, TX 75555
|
1,648 sq. feet
|
- baths - beds |
show details |
| Photo | Address | Area | Beds / Baths | Price | Details |
|---|---|---|---|---|---|

|
#31
Lakeshore Dr
Texarkana, TX 75501
|
- sq. feet
|
- baths - beds |
show details | |

|
#32
Parkway Dr
Texarkana, TX 75501
|
- sq. feet
|
- baths - beds |
show details | |

|
#33
Alpine Dr
Texarkana, TX 75501
|
2,222 sq. feet
|
- baths - beds |
show details | |

|
#34
N Elmwood Dr
Texarkana, TX 75501
|
- sq. feet
|
- baths - beds |
show details | |

|
#35
Iris Ln
Texarkana, TX 75501
|
1,269 sq. feet
|
- baths - beds |
show details | |

|
#36
Mimosa Ln
Atlanta, TX 75551
|
1,080 sq. feet
|
- baths - beds |
show details | |

|
#37
Timber Ridge Dr
Atlanta, TX 75551
|
1,582 sq. feet
|
- baths - beds |
show details | |

|
#38
Massie St
Atlanta, TX 75551
|
1,404 sq. feet
|
- baths - beds |
show details | |

|
#39
Fm 2328
Atlanta, TX 75551
|
- sq. feet
|
- baths - beds |
show details | |

|
#40
Fm 1154
Atlanta, TX 75551
|
648 sq. feet
|
- baths - beds |
show details |
| Photo | Address | Area | Beds / Baths | Price | Details |
|---|---|---|---|---|---|

|
#41
E Taylor St
Atlanta, TX 75551
|
- sq. feet
|
- baths - beds |
show details | |

|
#42
Chuck St
Atlanta, TX 75551
|
- sq. feet
|
- baths - beds |
show details | |

|
#43
W Main St # 95
Atlanta, TX 75551
|
15,204 sq. feet
|
- baths - beds |
show details | |

|
#44
Choctaw Dr
Atlanta, TX 75551
|
2,592 sq. feet
|
- baths - beds |
show details | |

|
#45
Chickasaw Cir
Atlanta, TX 75551
|
2,436 sq. feet
|
- baths - beds |
show details | |

|
#46
Private Road 190
Atlanta, TX 75551
|
- sq. feet
|
- baths - beds |
show details | |

|
#47
County Road 4673
Atlanta, TX 75551
|
- sq. feet
|
- baths - beds |
show details | |

|
#48
County Road 4228
Atlanta, TX 75551
|
- sq. feet
|
- baths - beds |
show details | |

|
#49
Miller County 3
Doddridge, AR 71834
|
- sq. feet
|
- baths - beds |
show details | |

|
Check over 1 million property listings on Foreclosure.com!
|
browse all offers | |||


- 1,02276.2%White alone
- 24017.9%Black alone
- 251.9%Two or more races
- 241.8%Asian alone
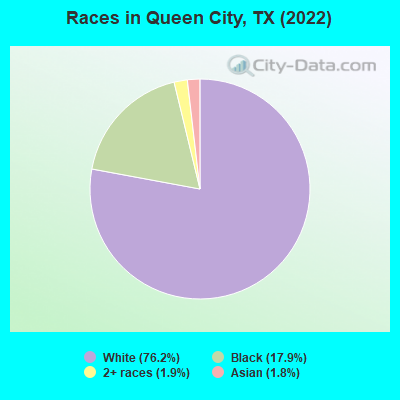
Races in Queen City detailed stats: ancestries, foreign born residents, place of birth
According to our research of Texas and other state lists, there were 13 registered sex offenders living in Queen City, Texas as of April 27, 2024.
The ratio of all residents to sex offenders in Queen City is 156 to 1.
Type |
2009 |
2010 |
2011 |
2012 |
2013 |
2014 |
2015 |
2016 |
2017 |
2018 |
2019 |
2020 |
2021 |
2022 |
|---|---|---|---|---|---|---|---|---|---|---|---|---|---|---|
| Murders (per 100,000) | 0 (0.0) | 0 (0.0) | 0 (0.0) | 0 (0.0) | 0 (0.0) | 1 (67.8) | 0 (0.0) | 0 (0.0) | 0 (0.0) | 0 (0.0) | 1 (69.0) | 0 (0.0) | 0 (0.0) | 0 (0.0) |
| Rapes (per 100,000) | 1 (64.9) | 7 (474.3) | 2 (132.7) | 0 (0.0) | 2 (136.6) | 0 (0.0) | 3 (204.2) | 1 (68.2) | 1 (68.3) | 1 (69.0) | 2 (137.9) | 0 (0.0) | 2 (141.9) | 2 (141.8) |
| Robberies (per 100,000) | 0 (0.0) | 1 (67.8) | 2 (132.7) | 0 (0.0) | 0 (0.0) | 1 (67.8) | 1 (68.1) | 0 (0.0) | 2 (136.6) | 0 (0.0) | 0 (0.0) | 0 (0.0) | 0 (0.0) | 0 (0.0) |
| Assaults (per 100,000) | 10 (648.9) | 10 (677.5) | 2 (132.7) | 6 (401.6) | 7 (478.1) | 16 (1,085) | 6 (408.4) | 15 (1,023) | 5 (341.5) | 9 (621.1) | 11 (758.6) | 4 (279.3) | 2 (141.9) | 2 (141.8) |
| Burglaries (per 100,000) | 18 (1,168) | 15 (1,016) | 34 (2,256) | 23 (1,539) | 22 (1,503) | 17 (1,153) | 6 (408.4) | 4 (272.9) | 3 (204.9) | 2 (138.0) | 10 (689.7) | 11 (768.2) | 7 (496.8) | 10 (709.2) |
| Thefts (per 100,000) | 19 (1,233) | 32 (2,168) | 45 (2,986) | 25 (1,673) | 42 (2,869) | 27 (1,831) | 14 (953.0) | 15 (1,023) | 12 (819.7) | 15 (1,035) | 15 (1,034) | 12 (838.0) | 13 (922.6) | 5 (354.6) |
| Auto thefts (per 100,000) | 3 (194.7) | 4 (271.0) | 5 (331.8) | 5 (334.7) | 1 (68.3) | 0 (0.0) | 0 (0.0) | 4 (272.9) | 2 (136.6) | 1 (69.0) | 1 (69.0) | 5 (349.2) | 25 (1,774) | 1 (70.9) |
| Arson (per 100,000) | 0 (0.0) | 0 (0.0) | 0 (0.0) | 0 (0.0) | 0 (0.0) | 0 (0.0) | 2 (136.1) | 0 (0.0) | 0 (0.0) | 0 (0.0) | 0 (0.0) | 0 (0.0) | 0 (0.0) | 0 (0.0) |
| City-Data.com crime index | 328.4 | 714.8 | 476.4 | 281.8 | 430.3 | 526.8 | 332.2 | 341.1 | 222.0 | 236.0 | 495.2 | 171.1 | 355.6 | 211.3 |
The City-Data.com crime index weighs serious crimes and violent crimes more heavily. Higher means more crime, U.S. average is 246.1. It adjusts for the number of visitors and daily workers commuting into cities.
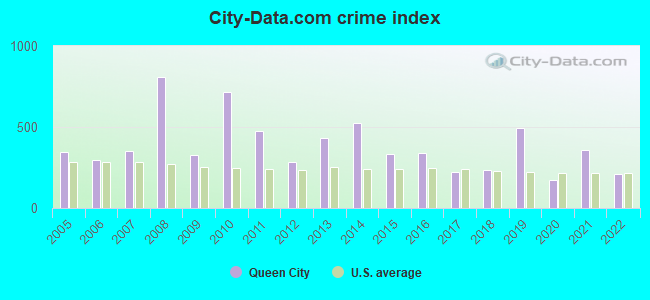
Crime rate in Queen City detailed stats: murders, rapes, robberies, assaults, burglaries, thefts, arson
Full-time law enforcement employees in 2021, including police officers: 5 (5 officers - 3 male; 2 female).
| Officers per 1,000 residents here: | 3.55 |
| Texas average: | 2.07 |
 Recent articles from our blog. Our writers, many of them Ph.D. graduates or candidates, create easy-to-read articles on a wide variety of topics.

 | Houston -Dallas ..one has it. The other doesn't (244 replies) |
| Historically, what has been the most dangerous city in Texas (48 replies) |
| DFW Neighborhood stereotypes (31 replies) |
| Best and Worst City in Texas to Live in ? (316 replies) |
| How does Fort Worth differ from Dallas? (189 replies) |
| Best towns in East texas (12 replies) |
Latest news from Queen City, TX collected exclusively by city-data.com from local newspapers, TV, and radio stations
Ancestries: American (54.3%), English (5.3%), German (4.3%), Lebanese (2.7%), Irish (2.4%), European (1.3%).
Current Local Time: CST time zone
Land area: 3.58 square miles.
Population density: 390 people per square mile (very low).
18 residents are foreign born
| This city: | 1.3% |
| Texas: | 17.1% |
Median real estate property taxes paid for housing units with mortgages in 2022: $2,588 (1.6%)
Median real estate property taxes paid for housing units with no mortgage in 2022: $1,542 (1.6%)
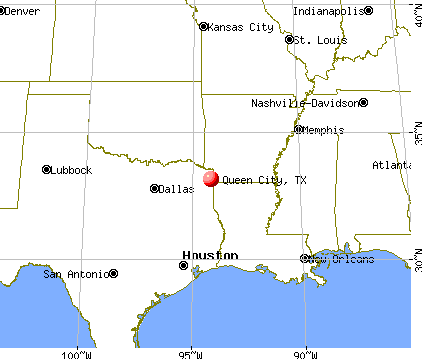
Nearest city with pop. 50,000+: Bossier City, LA  (51.6 miles , pop. 56,461).
Nearest city with pop. 200,000+: Shreveport, LA (52.4 miles , pop. 200,145).
Nearest city with pop. 1,000,000+: Dallas, TX (154.7 miles , pop. 1,188,580).
Nearest cities:
), ), ), ), ), )Latitude: 33.15 N, Longitude: 94.16 W
Area code commonly used in this area: 903
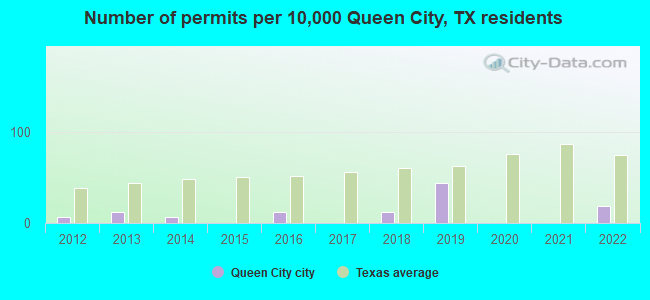
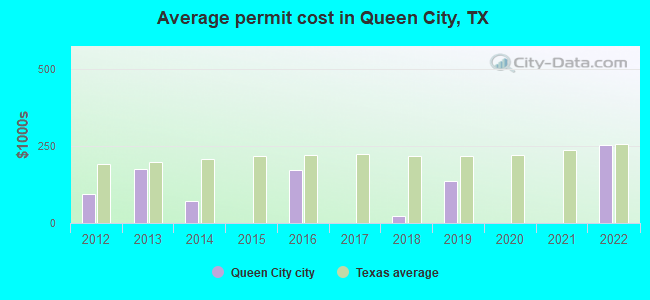
Single-family new house construction building permits:
- 2022: 3 buildings, average cost: $253,200
- 2019: 7 buildings, average cost: $138,100
- 2018: 2 buildings, average cost: $22,100
- 2016: 2 buildings, average cost: $172,500
- 2014: 1 building, cost: $70,000
- 2013: 2 buildings, average cost: $175,000
- 2012: 1 building, cost: $96,000
| Here: | 4.3% |
| Texas: | 3.5% |
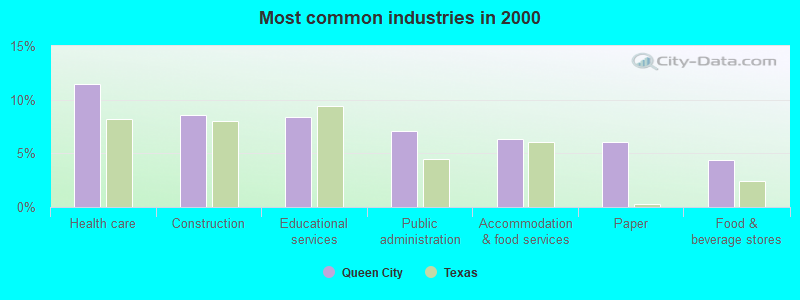
- Health care (11.4%)
- Construction (8.6%)
- Educational services (8.4%)
- Public administration (7.1%)
- Accommodation & food services (6.3%)
- Paper (6.0%)
- Food & beverage stores (4.4%)
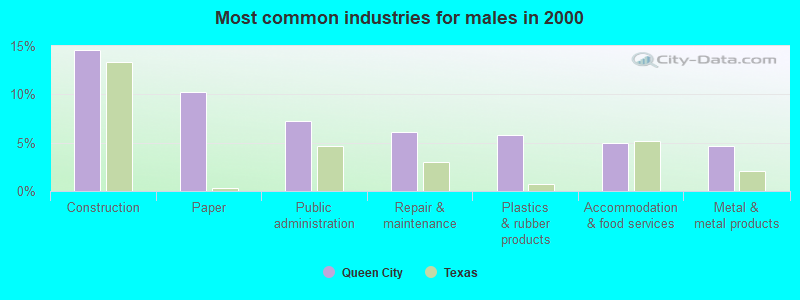
- Construction (14.6%)
- Paper (10.2%)
- Public administration (7.3%)
- Repair & maintenance (6.1%)
- Plastics & rubber products (5.8%)
- Accommodation & food services (5.0%)
- Metal & metal products (4.7%)
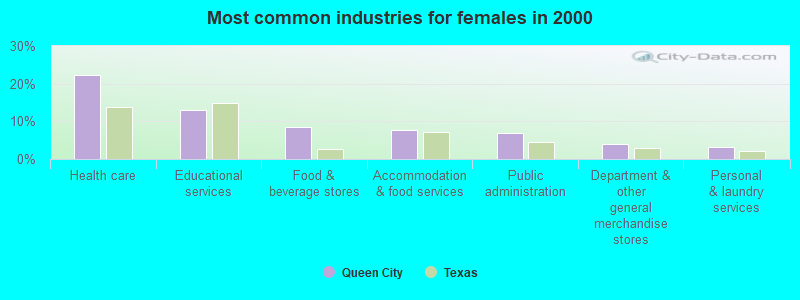
- Health care (22.4%)
- Educational services (13.0%)
- Food & beverage stores (8.4%)
- Accommodation & food services (7.8%)
- Public administration (6.8%)
- Department & other general merchandise stores (4.0%)
- Personal & laundry services (3.1%)
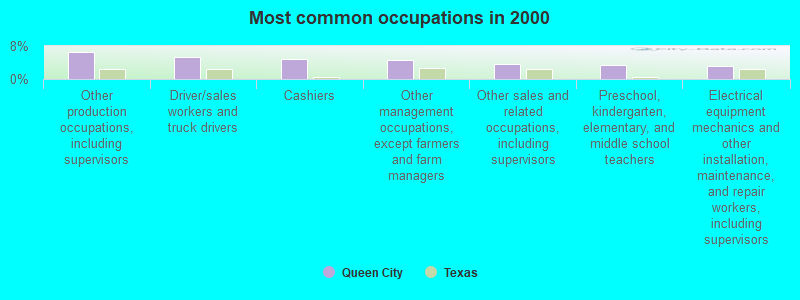
- Other production occupations, including supervisors (6.5%)
- Driver/sales workers and truck drivers (5.3%)
- Cashiers (5.0%)
- Other management occupations, except farmers and farm managers (4.5%)
- Other sales and related occupations, including supervisors (3.6%)
- Preschool, kindergarten, elementary, and middle school teachers (3.3%)
- Electrical equipment mechanics and other installation, maintenance, and repair workers, including supervisors (3.2%)
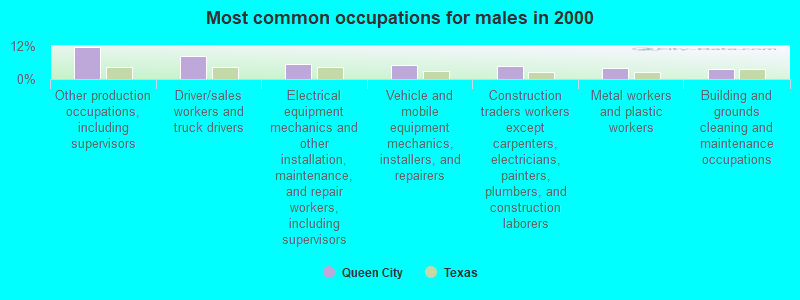
- Other production occupations, including supervisors (11.7%)
- Driver/sales workers and truck drivers (8.5%)
- Electrical equipment mechanics and other installation, maintenance, and repair workers, including supervisors (5.5%)
- Vehicle and mobile equipment mechanics, installers, and repairers (5.2%)
- Construction traders workers except carpenters, electricians, painters, plumbers, and construction laborers (4.7%)
- Metal workers and plastic workers (4.1%)
- Building and grounds cleaning and maintenance occupations (3.5%)
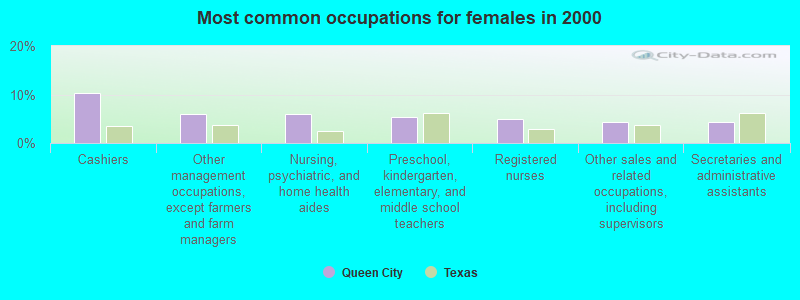
- Cashiers (10.2%)
- Other management occupations, except farmers and farm managers (5.9%)
- Nursing, psychiatric, and home health aides (5.9%)
- Preschool, kindergarten, elementary, and middle school teachers (5.3%)
- Registered nurses (5.0%)
- Other sales and related occupations, including supervisors (4.3%)
- Secretaries and administrative assistants (4.3%)
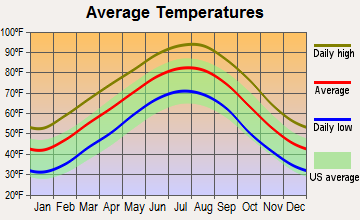
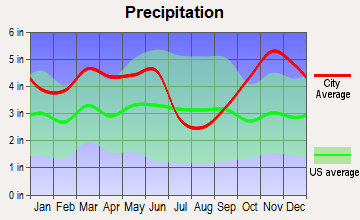
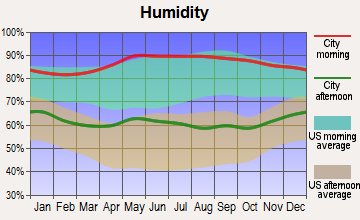
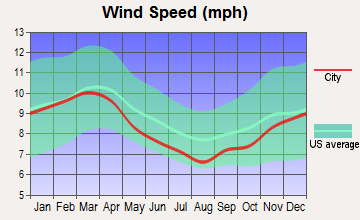
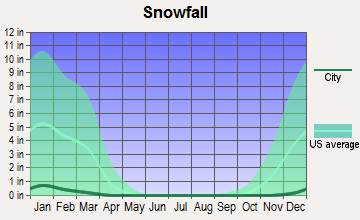
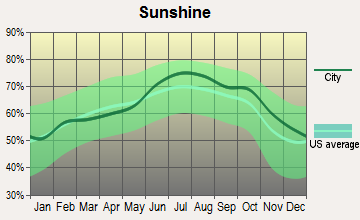
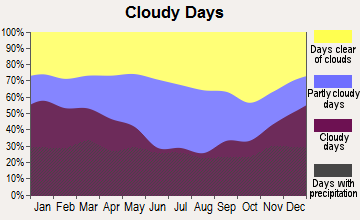
Average climate in Queen City, Texas
Based on data reported by over 4,000 weather stations
|
|

(lower is better)
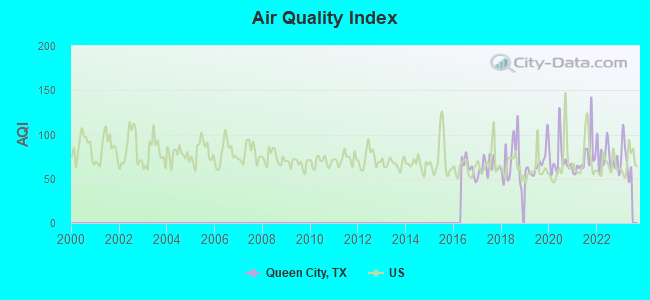
Air Quality Index (AQI) level in 2022 was 73.6. This is about average.
| City: | 73.6 |
| U.S.: | 72.6 |
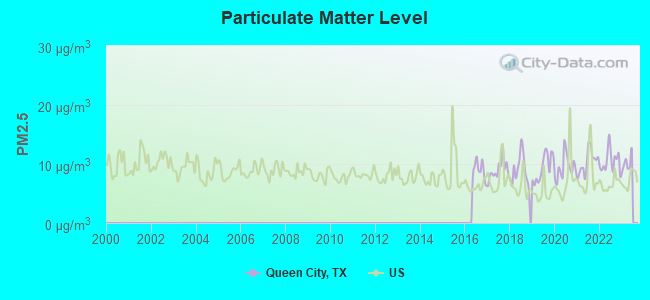
Particulate Matter (PM2.5) [µg/m3] level in 2022 was 10.4. This is worse than average. Closest monitor was 19.5 miles away from the city center.
| City: | 10.4 |
| U.S.: | 8.1 |
Tornado activity:
Queen City-area historical tornado activity is above Texas state average. It is 118% greater than the overall U.S. average.
On 3/12/1971, a category F4 (max. wind speeds 207-260 mph) tornado 27.8 miles away from the Queen City city center killed one person and injured 5 people.
On 4/23/2000, a category F3 (max. wind speeds 158-206 mph) tornado 7.6 miles away from the city center caused $170,000 in damages.
Earthquake activity:
Queen City-area historical earthquake activity is significantly above Texas state average. It is 428% greater than the overall U.S. average.On 11/6/2011 at 03:53:10, a magnitude 5.7 (5.7 MW, Depth: 3.2 mi, Class: Moderate, Intensity: VI - VII) earthquake occurred 222.0 miles away from the city center
On 9/3/2016 at 12:02:44, a magnitude 5.8 (5.8 MW, Depth: 3.5 mi) earthquake occurred 275.7 miles away from Queen City center
On 5/17/2012 at 08:12:00, a magnitude 4.8 (4.8 MW, Depth: 3.1 mi, Class: Light, Intensity: IV - V) earthquake occurred 85.8 miles away from the city center
On 9/2/2013 at 23:51:15, a magnitude 4.3 (4.3 MW, Depth: 2.9 mi) earthquake occurred 87.5 miles away from Queen City center
On 1/21/1982 at 00:33:54, a magnitude 4.7 (4.5 MB, 4.7 LG, 4.5 LG) earthquake occurred 178.5 miles away from Queen City center
On 2/28/2011 at 05:00:50, a magnitude 4.7 (4.7 MW, Depth: 2.0 mi) earthquake occurred 178.9 miles away from the city center
Magnitude types: regional Lg-wave magnitude (LG), body-wave magnitude (MB), moment magnitude (MW)
Natural disasters:
The number of natural disasters in Cass County (19) is greater than the US average (15).Major Disasters (Presidential) Declared: 12
Emergencies Declared: 5
Causes of natural disasters: Floods: 8, Storms: 7, Hurricanes: 5, Tornadoes: 5, Fires: 4, Winds: 2, Winter Storms: 2, Other: 1 (Note: some incidents may be assigned to more than one category).
Hospitals and medical centers near Queen City:
- EVERGREEN CLEARVIEW COMMUNITY HOME (Hospital, about 2 miles away; ATLANTA, TX)
- NORTHEAST TEXAS DIALYSIS CTR (Dialysis Facility, about 3 miles away; ATLANTA, TX)
- ROSE HAVEN RETREAT (Nursing Home, about 4 miles away; ATLANTA, TX)
- ATLANTA MEMORIAL HOSPITAL (Hospital, about 4 miles away; ATLANTA, TX)
- ATLANTA MEMORIAL TRANSITI (Nursing Home, about 4 miles away; ATLANTA, TX)
- EVERGREEN CHOCTAW COMMUNITY HOME (Hospital, about 5 miles away; ATLANTA, TX)
- EVERGREEN MARYLAND COMMUNITY HOME (Hospital, about 15 miles away; TEXARKANA, TX)
Colleges/universities with over 2000 students nearest to Queen City:
- Texarkana College (about 21 miles; Texarkana, TX; Full-time enrollment: 2,629)
- Northeast Texas Community College (about 43 miles; Mount Pleasant, TX; FT enrollment: 2,320)
- Southern University at Shreveport (about 46 miles; Shreveport, LA; FT enrollment: 2,277)
- Bossier Parish Community College (about 52 miles; Bossier City, LA; FT enrollment: 6,209)
- Southern Arkansas University Main Campus (about 55 miles; Magnolia, AR; FT enrollment: 3,005)
- Louisiana State University-Shreveport (about 57 miles; Shreveport, LA; FT enrollment: 3,159)
- LeTourneau University (about 58 miles; Longview, TX; FT enrollment: 2,357)
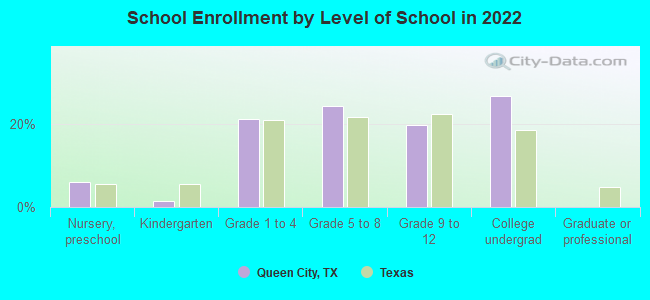
Public high school in Queen City:
- QUEEN CITY H S (Students: 314, Location: 905 HOUSTON ST, Grades: 9-12)
Public elementary/middle schools in Queen City:
- J K HILEMAN EL (Students: 453, Location: 1013 HOUSTON ST, Grades: PK-4)
- MORRIS UPCHURCH MIDDLE (Students: 321, Location: 500 5TH ST, Grades: 5-8)
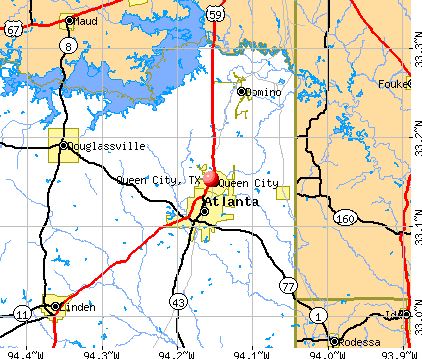
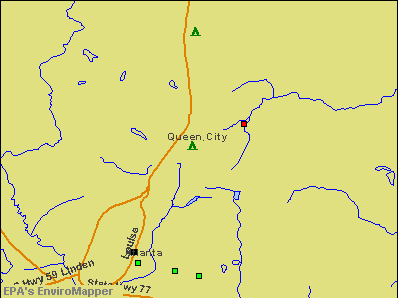
Points of interest:
Notable locations in Queen City: Mathews-Powell House (A), Elmo R Willard Branch Library (B), Cass County Fire District Station 2 (C). Display/hide their locations on the map
Birthplace of: Jason Peters - 2005 NFL player (Buffalo Bills, born: Jan 22, 1982).
| This city: | 2.4 people |
| Texas: | 2.8 people |
| This city: | 66.9% |
| Whole state: | 69.9% |
| This city: | 3.2% |
| Whole state: | 6.0% |
Likely homosexual households (counted as self-reported same-sex unmarried-partner households)
- Lesbian couples: 0.3% of all households
- Gay men: 0.3% of all households
Banks with branches in Queen City (2011 data):
- The Morris County National Bank of Naples: Cass County Bank at 401 Hwy 59 N, branch established on 2002/05/22. Info updated 2010/06/01: Bank assets: $89.8 mil, Deposits: $81.0 mil, headquarters in Naples, TX, positive income, 2 total offices, Holding Company: Morris County Bankshares, Incorporated
- The First National Bank of Hughes Springs: Atlanta-Queen City Drive-In at 305 Sthy 59, branch established on 1994/01/03. Info updated 2012/02/07: Bank assets: $186.5 mil, Deposits: $153.7 mil, headquarters in Hughes Springs, TX, positive income, Commercial Lending Specialization, 11 total offices, Holding Company: Chalybeate Springs Corporation
For population 15 years and over in Queen City:
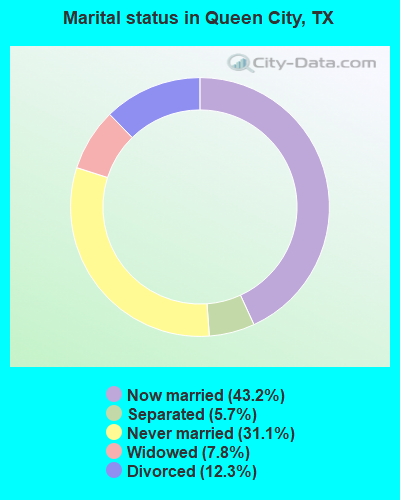
- Never married: 31.1%
- Now married: 43.2%
- Separated: 5.7%
- Widowed: 7.8%
- Divorced: 12.3%
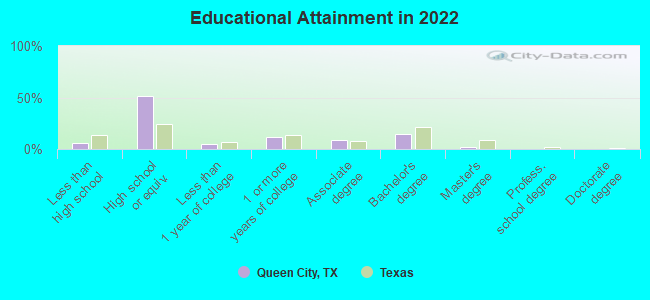
For population 25 years and over in Queen City:
- High school or higher: 93.6%
- Bachelor's degree or higher: 16.6%
- Graduate or professional degree: 2.5%
- Unemployed: 3.5%
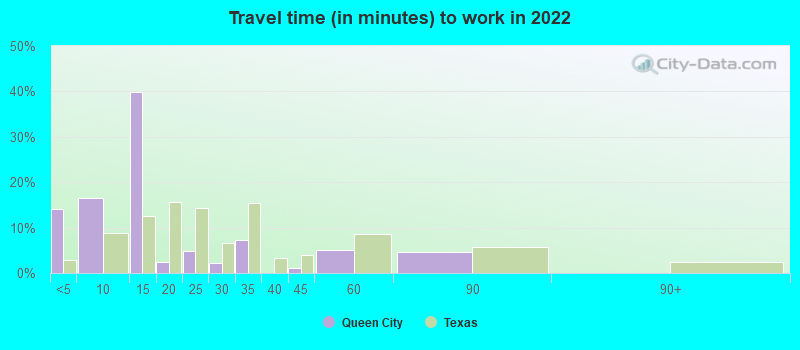
- Mean travel time to work (commute): 21.3 minutes
| Here: | 7.9 |
| Texas average: | 14.0 |
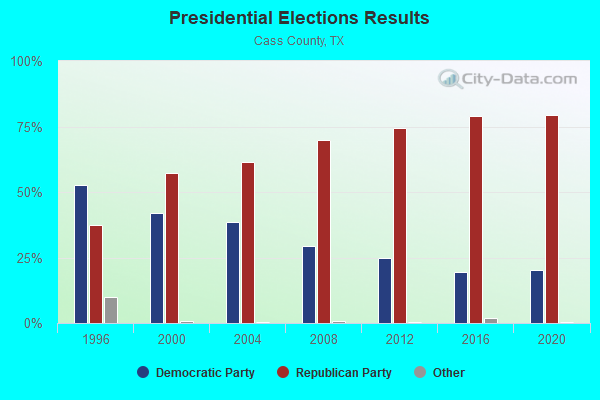
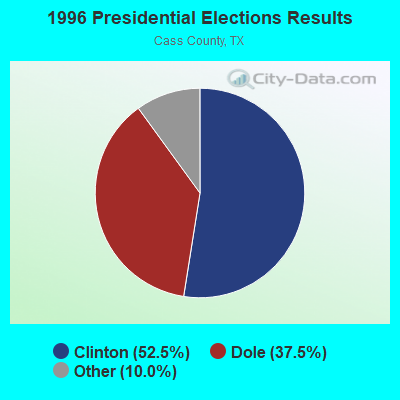
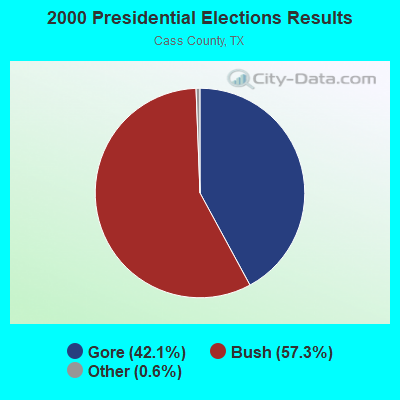
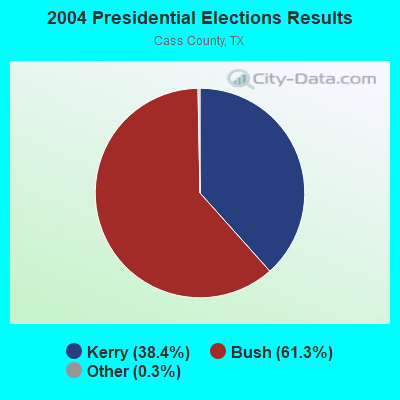
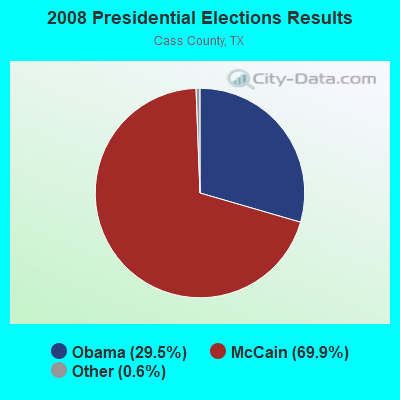
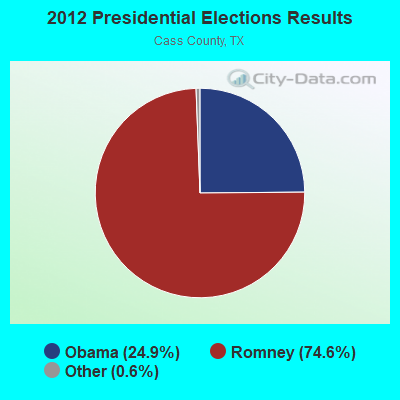
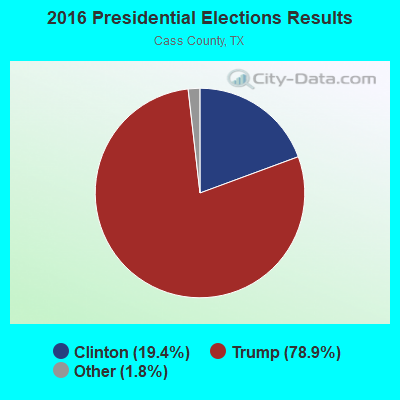
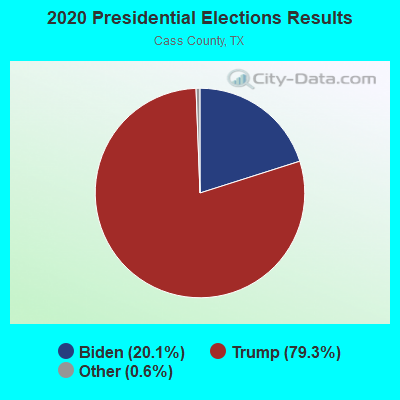
Graphs represent county-level data. Detailed 2008 Election Results
Religion statistics for Queen City, TX (based on Cass County data)

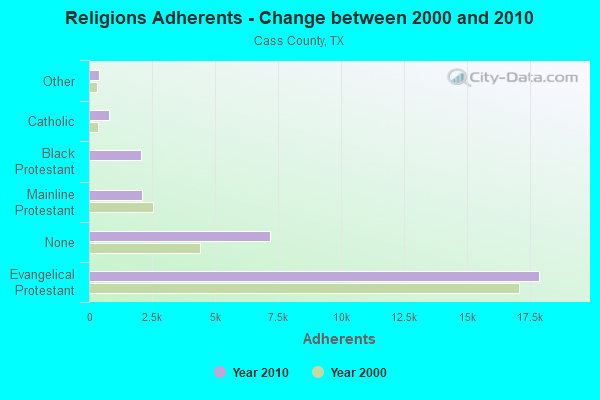
| Religion | Adherents | Congregations |
|---|---|---|
| Evangelical Protestant | 17,887 | 77 |
| Mainline Protestant | 2,115 | 15 |
| Black Protestant | 2,074 | 15 |
| Catholic | 810 | 2 |
| Other | 396 | 2 |
| None | 7,182 | - |
Food Environment Statistics:
| Cass County: | 2.39 / 10,000 pop. |
| Texas: | 1.47 / 10,000 pop. |
| Cass County: | 0.34 / 10,000 pop. |
| State: | 0.14 / 10,000 pop. |
| Cass County: | 1.02 / 10,000 pop. |
| Texas: | 1.11 / 10,000 pop. |
| This county: | 5.46 / 10,000 pop. |
| Texas: | 3.95 / 10,000 pop. |
| Here: | 6.14 / 10,000 pop. |
| Texas: | 6.13 / 10,000 pop. |
| This county: | 11.4% |
| Texas: | 8.9% |
| Cass County: | 29.2% |
| Texas: | 26.6% |
| Here: | 14.8% |
| State: | 15.7% |
Health and Nutrition:
| This city: | 47.7% |
| State: | 48.6% |
| Queen City: | 43.2% |
| State: | 47.4% |
| Queen City: | 29.6 |
| Texas: | 28.5 |
| Queen City: | 20.8% |
| Texas: | 20.6% |
| This city: | 15.0% |
| Texas: | 10.3% |
| Here: | 6.8 |
| State: | 6.8 |
| This city: | 36.2% |
| Texas: | 33.1% |
| Queen City: | 53.7% |
| Texas: | 56.2% |
| Queen City: | 77.1% |
| State: | 80.7% |
More about Health and Nutrition of Queen City, TX Residents
| Local government employment and payroll (March 2022) | |||||
| Function | Full-time employees | Monthly full-time payroll | Average yearly full-time wage | Part-time employees | Monthly part-time payroll |
|---|---|---|---|---|---|
| Water Supply | 6 | $18,061 | $36,122 | 0 | $0 |
| Police Protection - Officers | 6 | $24,308 | $48,616 | 0 | $0 |
| Other Government Administration | 1 | $4,125 | $49,500 | 1 | $511 |
| Judicial and Legal | 0 | $0 | 3 | $5,481 | |
| Totals for Government | 13 | $46,494 | $42,918 | 4 | $5,992 |
Queen City government finances - Expenditure in 2017 (per resident):
- Construction - Regular Highways: $267,000 ($191.54)
Sewerage: $75,000 ($53.80)
- Current Operations - Water Utilities: $517,000 ($370.88)
Police Protection: $407,000 ($291.97)
Central Staff Services: $219,000 ($157.10)
Solid Waste Management: $156,000 ($111.91)
General - Other: $131,000 ($93.97)
Judicial and Legal Services: $63,000 ($45.19)
Health - Other: $16,000 ($11.48)
- General - Interest on Debt: $66,000 ($47.35)
- Total Salaries and Wages: $470,000 ($337.16)
Queen City government finances - Revenue in 2017 (per resident):
- Charges - Solid Waste Management: $154,000 ($110.47)
Other: $39,000 ($27.98)
- Miscellaneous - Fines and Forfeits: $95,000 ($68.15)
Rents: $30,000 ($21.52)
Sale of Property: $4,000 ($2.87)
- Revenue - Water Utilities: $553,000 ($396.70)
- State Intergovernmental - Sewerage: $77,000 ($55.24)
- Tax - Property: $413,000 ($296.27)
General Sales and Gross Receipts: $186,000 ($133.43)
Public Utilities Sales: $148,000 ($106.17)
Occupation and Business License - Other: $4,000 ($2.87)
Queen City government finances - Debt in 2017 (per resident):
- Long Term Debt - Beginning Outstanding - Unspecified Public Purpose: $1,658,000 ($1189.38)
Outstanding Unspecified Public Purpose: $1,504,000 ($1078.91)
Retired Unspecified Public Purpose: $191,000 ($137.02)
Issue, Unspecified Public Purpose: $36,000 ($25.82)
Queen City government finances - Cash and Securities in 2017 (per resident):
- Other Funds - Cash and Securities: $176,000 ($126.26)
- Sinking Funds - Cash and Securities: $90,000 ($64.56)
Businesses in Queen City, TX
- Subway: 1
Strongest AM radio stations in Queen City:
- KPYN (900 AM; 10 kW; ATLANTA, TX; Owner: FAMILY WORSHIP CENTER CHURCH, INC.)
- KEEL (710 AM; 50 kW; SHREVEPORT, LA; Owner: CITICASTERS LICENSES, L.P.)
- KWKH (1130 AM; 50 kW; SHREVEPORT, LA; Owner: CITICASTERS LICENSES, L.P.)
- KNCB (1320 AM; 5 kW; VIVIAN, LA; Owner: NORTH CADDO BROADCASTING CO.)
- KTFS (940 AM; 2 kW; TEXARKANA, TX; Owner: ARKLATEX, LLC)
- KOSY (790 AM; 1 kW; TEXARKANA, AR; Owner: CAPSTAR TX LIMITED PARTNERSHIP)
- KCMC (740 AM; 1 kW; TEXARKANA, TX; Owner: ARKLATEX, LLC)
- KGHT (880 AM; 50 kW; SHERIDAN, AR; Owner: METROPOLITAN RADIO GROUP, INC.)
- KFXR (1190 AM; 50 kW; DALLAS, TX; Owner: CLEAR CHANNEL BROADCASTING LICENSES, INC.)
- KNBO (1530 AM; daytime; 2 kW; NEW BOSTON, TX; Owner: BOWIE COUNTY BROADCASTING CO., INC.)
- KOKA (980 AM; 5 kW; SHREVEPORT, LA; Owner: ACCESS.1 COMMUNICATIONS - SHREVEPORT, LLC)
- KRLD (1080 AM; 50 kW; DALLAS, TX; Owner: TEXAS INFINITY BROADCASTING L.P.)
- KAAY (1090 AM; 50 kW; LITTLE ROCK, AR; Owner: CITADEL BROADCASTING COMPANY)
Strongest FM radio stations in Queen City:
- KNRB (100.1 FM; ATLANTA, TX; Owner: FAMILY WORSHIP CENTER CHURCH, INC.)
- KTAL-FM (98.1 FM; TEXARKANA, TX; Owner: ACCESS.1 COMMUNICATIONS - SHREVEPORT, LLC)
- KRMD-FM (101.1 FM; SHREVEPORT, LA; Owner: CUMULUS LICENSING CORP.)
- KVMA-FM (107.9 FM; MAGNOLIA, AR; Owner: COLUMBIA BROADCASTING CO., INC.)
- KRUF (94.5 FM; SHREVEPORT, LA; Owner: CITICASTERS LICENSES, L.P.)
- KFYX (107.1 FM; TEXARKANA, AR; Owner: ARKLATEX, LLC)
- KYGL (106.3 FM; TEXARKANA, AR; Owner: CAPSTAR TX LIMITED PARTNERSHIP)
- KKYR-FM (102.5 FM; TEXARKANA, TX; Owner: CAPSTAR TX LIMITED PARTNERSHIP)
- KXKS-FM (93.7 FM; SHREVEPORT, LA; Owner: CITICASTERS LICENSES, L.P.)
- KNCB-FM (105.3 FM; VIVIAN, LA; Owner: NORTH CADDO BROADCASTING COMPANY)
- KPWW (95.9 FM; HOOKS, TX; Owner: CAPSTAR TX LIMITED PARTNERSHIP)
- KMJI (93.3 FM; ASHDOWN, AR; Owner: CLEAR CHANNEL BROADCASTING LICENSES, INC.)
- KDAQ (89.9 FM; SHREVEPORT, LA; Owner: BD. SUP. LA ST. UNIV. & AGRIC. MECH.)
- KTXK (91.5 FM; TEXARKANA, TX; Owner: TEXARKANA COMMUNITY COLLEGE)
- KTOY (104.7 FM; TEXARKANA, AR; Owner: JO-AL BROADCASTING, INC.)
- KJTX (104.5 FM; JEFFERSON, TX; Owner: WISDOM MINISTRIES, INC.)
- KZRB (103.5 FM; NEW BOSTON, TX; Owner: B & H BROADCASTING SYSTEMS, INC.)
- KHTA (92.5 FM; WAKE VILLAGE, TX; Owner: HOUSTON CHRISTIAN BROADCASTERS, INC.)
- KEWL-FM (95.1 FM; NEW BOSTON, TX; Owner: PETRACOM OF TEXARKANA, L.L.C.)
TV broadcast stations around Queen City:
- KTAL-TV (Channel 6; TEXARKANA, TX; Owner: NEXSTAR BROADCASTING OF LOUISIANA, LLC)
- KTBS-TV (Channel 3; SHREVEPORT, LA; Owner: KTBS, INC.)
- KSLA-TV (Channel 12; SHREVEPORT, LA; Owner: KSLA, LLC)
- KMSS-TV (Channel 33; SHREVEPORT, LA; Owner: COMCORP OF TEXAS LICENSE CORP.)
- KSHV (Channel 45; SHREVEPORT, LA; Owner: WHITE KNIGHT BROADCASTING OF SHREVEPORT LIC. CORP.)
- KLFI-LP (Channel 35; TEXARKANA, AR; Owner: BEECH STREET COMMUNICATIONS CORP.)
- KLTS-TV (Channel 24; SHREVEPORT, LA; Owner: LOUISIANA EDUCATIONAL TELEVISION AUTHORITY)
- K41EQ (Channel 41; TEXARKANA, TX; Owner: THREE ANGELS BROADCASTING NETWORK)
- K59GO (Channel 59; SHREVEPORT, LA; Owner: TRINITY BROADCASTING NETWORK, INC.)
- K30EA (Channel 30; TEXARKANA, TX; Owner: TRINITY BROADCASTING NETWORK)
- Queen City, Texas
- Fatal accident count22
- Vehicles involved in fatal accidents39
- Fatal accidents involving drunk persons:2
- Fatalities25
- Persons involved in fatal accidents64
- Pedestrians involved in fatal accidents1
- Texas average
- Fatal accident count49388
- Vehicles involved in fatal accidents74481
- Fatal accidents involving drunk persons14233
- Fatalities55869
- Persons involved in fatal accidents127826
- Pedestrians involved in fatal accidents5898
- National Bridge Inventory (NBI) Statistics
- 2Number of bridges
- 7ft / 2.0mTotal length
- 1,998Total average daily traffic
- 278Total average daily truck traffic
- 3,280Total future (year 2033) average daily traffic
2003 - 2017 National Fire Incident Reporting System (NFIRS) incidents
- Fire incident types reported to NFIRS in Queen City, TX
- 52259.9%Outside Fires
- 23527.0%Structure Fires
- 10812.4%Mobile Property/Vehicle Fires
- 60.7%Other
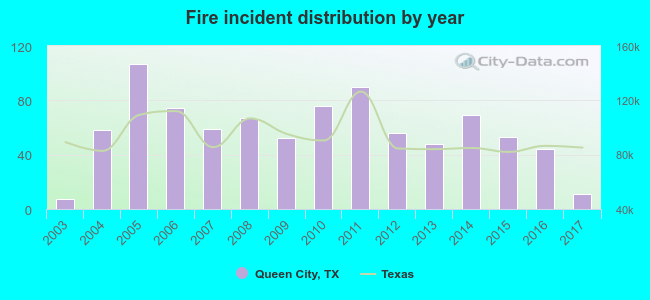 Based on the data from the years 2003 - 2017 the average number of fires per year is 58. The highest number of reported fires - 107 took place in 2005, and the least - 7 in 2003. The data has a growing trend.
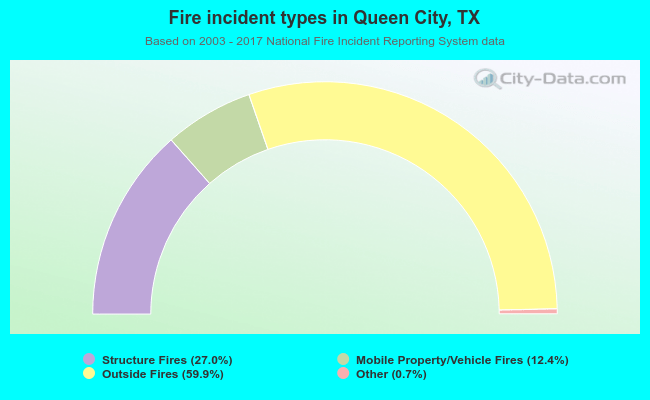 When looking into fire subcategories, the most reports belonged to: Outside Fires (59.9%), and Structure Fires (27.0%).
| Most common first names in Queen City, TX among deceased individuals | ||
| Name | Count | Lived (average) |
|---|---|---|
| James | 32 | 72.6 years |
| Mary | 25 | 69.5 years |
| William | 23 | 73.9 years |
| John | 22 | 72.5 years |
| Willie | 21 | 75.9 years |
| George | 10 | 72.3 years |
| Robert | 9 | 78.0 years |
| Frances | 8 | 72.7 years |
| Clarence | 7 | 78.4 years |
| Martha | 7 | 85.7 years |
| Most common last names in Queen City, TX among deceased individuals | ||
| Last name | Count | Lived (average) |
|---|---|---|
| Chamblee | 14 | 74.8 years |
| Johnson | 13 | 74.9 years |
| Alexander | 12 | 63.8 years |
| Smith | 12 | 78.4 years |
| Clements | 11 | 80.2 years |
| Moore | 11 | 68.4 years |
| Brown | 10 | 76.9 years |
| Richardson | 10 | 70.2 years |
| Wall | 10 | 79.7 years |
| Lee | 10 | 74.5 years |
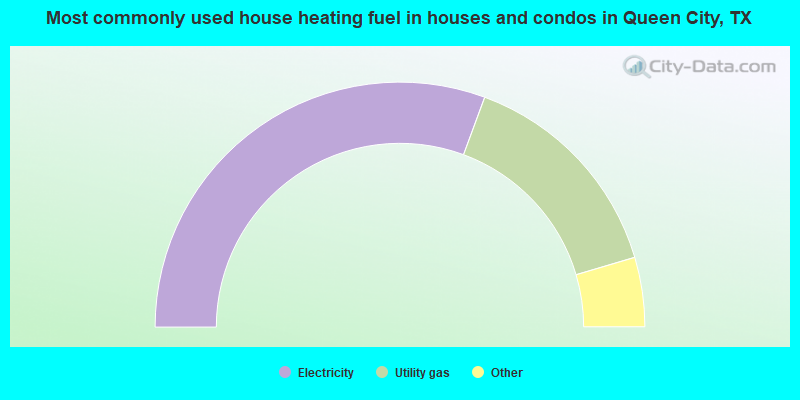
- 61.5%Electricity
- 29.7%Utility gas
- 3.9%No fuel used
- 3.6%Bottled, tank, or LP gas
- 1.2%Wood
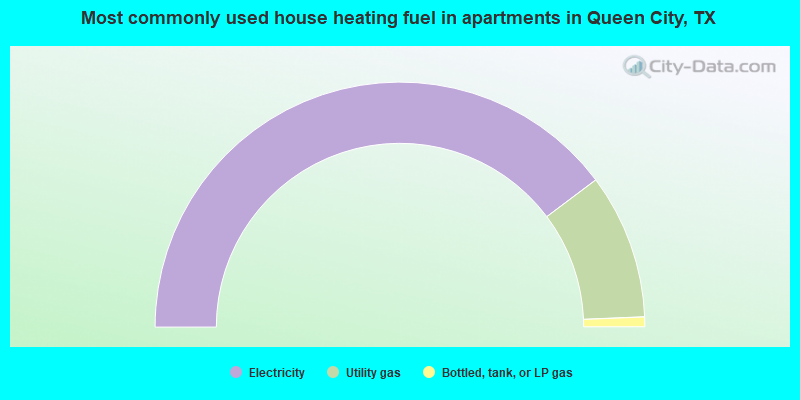
- 79.5%Electricity
- 19.2%Utility gas
- 1.3%Bottled, tank, or LP gas
Queen City compared to Texas state average:
- Median household income below state average.
- Median house value significantly below state average.
- Unemployed percentage significantly below state average.
- Hispanic race population percentage significantly below state average.
- Median age above state average.
- Foreign-born population percentage significantly below state average.
- Length of stay since moving in significantly above state average.
Queen City on our top lists:
- #56 on the list of "Top 101 cities with the most residents born in Oceania, n.e.c. (population 500+)"
- #91 on the list of "Top 101 cities with the most residents born in Oceania (population 500+)"

|
Total of 2 patent applications in 2008-2024.