Richland Hills, Texas Submit your own pictures of this city and show them to the world
OSM Map
General Map
Google Map
MSN Map
OSM Map
General Map
Google Map
MSN Map
OSM Map
General Map
Google Map
MSN Map
OSM Map
General Map
Google Map
MSN Map
Please wait while loading the map...
Population in 2022: 8,407 (100% urban, 0% rural). Population change since 2000: +3.4%Males: 3,857 Females: 4,550
March 2022 cost of living index in Richland Hills: 95.5 (near average, U.S. average is 100) Percentage of residents living in poverty in 2022: 6.8%for White Non-Hispanic residents , 5.9% for Hispanic or Latino residents , 7.8% for other race residents )Business Search - 14 Million verified businesses
Data:
Median household income ($)
Median household income (% change since 2000)
Household income diversity
Ratio of average income to average house value (%)
Ratio of average income to average rent
Median household income ($) - White
Median household income ($) - Black or African American
Median household income ($) - Asian
Median household income ($) - Hispanic or Latino
Median household income ($) - American Indian and Alaska Native
Median household income ($) - Multirace
Median household income ($) - Other Race
Median household income for houses/condos with a mortgage ($)
Median household income for apartments without a mortgage ($)
Races - White alone (%)
Races - White alone (% change since 2000)
Races - Black alone (%)
Races - Black alone (% change since 2000)
Races - American Indian alone (%)
Races - American Indian alone (% change since 2000)
Races - Asian alone (%)
Races - Asian alone (% change since 2000)
Races - Hispanic (%)
Races - Hispanic (% change since 2000)
Races - Native Hawaiian and Other Pacific Islander alone (%)
Races - Native Hawaiian and Other Pacific Islander alone (% change since 2000)
Races - Two or more races (%)
Races - Two or more races (% change since 2000)
Races - Other race alone (%)
Races - Other race alone (% change since 2000)
Racial diversity
Unemployment (%)
Unemployment (% change since 2000)
Unemployment (%) - White
Unemployment (%) - Black or African American
Unemployment (%) - Asian
Unemployment (%) - Hispanic or Latino
Unemployment (%) - American Indian and Alaska Native
Unemployment (%) - Multirace
Unemployment (%) - Other Race
Population density (people per square mile)
Population - Males (%)
Population - Females (%)
Population - Males (%) - White
Population - Males (%) - Black or African American
Population - Males (%) - Asian
Population - Males (%) - Hispanic or Latino
Population - Males (%) - American Indian and Alaska Native
Population - Males (%) - Multirace
Population - Males (%) - Other Race
Population - Females (%) - White
Population - Females (%) - Black or African American
Population - Females (%) - Asian
Population - Females (%) - Hispanic or Latino
Population - Females (%) - American Indian and Alaska Native
Population - Females (%) - Multirace
Population - Females (%) - Other Race
Coronavirus confirmed cases (Apr 27, 2024)
Deaths caused by coronavirus (Apr 27, 2024)
Coronavirus confirmed cases (per 100k population) (Apr 27, 2024)
Deaths caused by coronavirus (per 100k population) (Apr 27, 2024)
Daily increase in number of cases (Apr 27, 2024)
Weekly increase in number of cases (Apr 27, 2024)
Cases doubled (in days) (Apr 27, 2024)
Hospitalized patients (Apr 18, 2022)
Negative test results (Apr 18, 2022)
Total test results (Apr 18, 2022)
COVID Vaccine doses distributed (per 100k population) (Sep 19, 2023)
COVID Vaccine doses administered (per 100k population) (Sep 19, 2023)
COVID Vaccine doses distributed (Sep 19, 2023)
COVID Vaccine doses administered (Sep 19, 2023)
Likely homosexual households (%)
Likely homosexual households (% change since 2000)
Likely homosexual households - Lesbian couples (%)
Likely homosexual households - Lesbian couples (% change since 2000)
Likely homosexual households - Gay men (%)
Likely homosexual households - Gay men (% change since 2000)
Cost of living index
Median gross rent ($)
Median contract rent ($)
Median monthly housing costs ($)
Median house or condo value ($)
Median house or condo value ($ change since 2000)
Mean house or condo value by units in structure - 1, detached ($)
Mean house or condo value by units in structure - 1, attached ($)
Mean house or condo value by units in structure - 2 ($)
Mean house or condo value by units in structure by units in structure - 3 or 4 ($)
Mean house or condo value by units in structure - 5 or more ($)
Mean house or condo value by units in structure - Boat, RV, van, etc. ($)
Mean house or condo value by units in structure - Mobile home ($)
Median house or condo value ($) - White
Median house or condo value ($) - Black or African American
Median house or condo value ($) - Asian
Median house or condo value ($) - Hispanic or Latino
Median house or condo value ($) - American Indian and Alaska Native
Median house or condo value ($) - Multirace
Median house or condo value ($) - Other Race
Median resident age
Resident age diversity
Median resident age - Males
Median resident age - Females
Median resident age - White
Median resident age - Black or African American
Median resident age - Asian
Median resident age - Hispanic or Latino
Median resident age - American Indian and Alaska Native
Median resident age - Multirace
Median resident age - Other Race
Median resident age - Males - White
Median resident age - Males - Black or African American
Median resident age - Males - Asian
Median resident age - Males - Hispanic or Latino
Median resident age - Males - American Indian and Alaska Native
Median resident age - Males - Multirace
Median resident age - Males - Other Race
Median resident age - Females - White
Median resident age - Females - Black or African American
Median resident age - Females - Asian
Median resident age - Females - Hispanic or Latino
Median resident age - Females - American Indian and Alaska Native
Median resident age - Females - Multirace
Median resident age - Females - Other Race
Commute - mean travel time to work (minutes)
Travel time to work - Less than 5 minutes (%)
Travel time to work - Less than 5 minutes (% change since 2000)
Travel time to work - 5 to 9 minutes (%)
Travel time to work - 5 to 9 minutes (% change since 2000)
Travel time to work - 10 to 19 minutes (%)
Travel time to work - 10 to 19 minutes (% change since 2000)
Travel time to work - 20 to 29 minutes (%)
Travel time to work - 20 to 29 minutes (% change since 2000)
Travel time to work - 30 to 39 minutes (%)
Travel time to work - 30 to 39 minutes (% change since 2000)
Travel time to work - 40 to 59 minutes (%)
Travel time to work - 40 to 59 minutes (% change since 2000)
Travel time to work - 60 to 89 minutes (%)
Travel time to work - 60 to 89 minutes (% change since 2000)
Travel time to work - 90 or more minutes (%)
Travel time to work - 90 or more minutes (% change since 2000)
Marital status - Never married (%)
Marital status - Now married (%)
Marital status - Separated (%)
Marital status - Widowed (%)
Marital status - Divorced (%)
Median family income ($)
Median family income (% change since 2000)
Median non-family income ($)
Median non-family income (% change since 2000)
Median per capita income ($)
Median per capita income (% change since 2000)
Median family income ($) - White
Median family income ($) - Black or African American
Median family income ($) - Asian
Median family income ($) - Hispanic or Latino
Median family income ($) - American Indian and Alaska Native
Median family income ($) - Multirace
Median family income ($) - Other Race
Median year house/condo built
Median year apartment built
Year house built - Built 2005 or later (%)
Year house built - Built 2000 to 2004 (%)
Year house built - Built 1990 to 1999 (%)
Year house built - Built 1980 to 1989 (%)
Year house built - Built 1970 to 1979 (%)
Year house built - Built 1960 to 1969 (%)
Year house built - Built 1950 to 1959 (%)
Year house built - Built 1940 to 1949 (%)
Year house built - Built 1939 or earlier (%)
Average household size
Household density (households per square mile)
Average household size - White
Average household size - Black or African American
Average household size - Asian
Average household size - Hispanic or Latino
Average household size - American Indian and Alaska Native
Average household size - Multirace
Average household size - Other Race
Occupied housing units (%)
Vacant housing units (%)
Owner occupied housing units (%)
Renter occupied housing units (%)
Vacancy status - For rent (%)
Vacancy status - For sale only (%)
Vacancy status - Rented or sold, not occupied (%)
Vacancy status - For seasonal, recreational, or occasional use (%)
Vacancy status - For migrant workers (%)
Vacancy status - Other vacant (%)
Residents with income below the poverty level (%)
Residents with income below 50% of the poverty level (%)
Children below poverty level (%)
Poor families by family type - Married-couple family (%)
Poor families by family type - Male, no wife present (%)
Poor families by family type - Female, no husband present (%)
Poverty status for native-born residents (%)
Poverty status for foreign-born residents (%)
Poverty among high school graduates not in families (%)
Poverty among people who did not graduate high school not in families (%)
Residents with income below the poverty level (%) - White
Residents with income below the poverty level (%) - Black or African American
Residents with income below the poverty level (%) - Asian
Residents with income below the poverty level (%) - Hispanic or Latino
Residents with income below the poverty level (%) - American Indian and Alaska Native
Residents with income below the poverty level (%) - Multirace
Residents with income below the poverty level (%) - Other Race
Air pollution - Air Quality Index (AQI)
Air pollution - CO
Air pollution - NO2
Air pollution - SO2
Air pollution - Ozone
Air pollution - PM10
Air pollution - PM25
Air pollution - Pb
Crime - Murders per 100,000 population
Crime - Rapes per 100,000 population
Crime - Robberies per 100,000 population
Crime - Assaults per 100,000 population
Crime - Burglaries per 100,000 population
Crime - Thefts per 100,000 population
Crime - Auto thefts per 100,000 population
Crime - Arson per 100,000 population
Crime - City-data.com crime index
Crime - Violent crime index
Crime - Property crime index
Crime - Murders per 100,000 population (5 year average)
Crime - Rapes per 100,000 population (5 year average)
Crime - Robberies per 100,000 population (5 year average)
Crime - Assaults per 100,000 population (5 year average)
Crime - Burglaries per 100,000 population (5 year average)
Crime - Thefts per 100,000 population (5 year average)
Crime - Auto thefts per 100,000 population (5 year average)
Crime - Arson per 100,000 population (5 year average)
Crime - City-data.com crime index (5 year average)
Crime - Violent crime index (5 year average)
Crime - Property crime index (5 year average)
1996 Presidential Elections Results (%) - Democratic Party (Clinton)
1996 Presidential Elections Results (%) - Republican Party (Dole)
1996 Presidential Elections Results (%) - Other
2000 Presidential Elections Results (%) - Democratic Party (Gore)
2000 Presidential Elections Results (%) - Republican Party (Bush)
2000 Presidential Elections Results (%) - Other
2004 Presidential Elections Results (%) - Democratic Party (Kerry)
2004 Presidential Elections Results (%) - Republican Party (Bush)
2004 Presidential Elections Results (%) - Other
2008 Presidential Elections Results (%) - Democratic Party (Obama)
2008 Presidential Elections Results (%) - Republican Party (McCain)
2008 Presidential Elections Results (%) - Other
2012 Presidential Elections Results (%) - Democratic Party (Obama)
2012 Presidential Elections Results (%) - Republican Party (Romney)
2012 Presidential Elections Results (%) - Other
2016 Presidential Elections Results (%) - Democratic Party (Clinton)
2016 Presidential Elections Results (%) - Republican Party (Trump)
2016 Presidential Elections Results (%) - Other
2020 Presidential Elections Results (%) - Democratic Party (Biden)
2020 Presidential Elections Results (%) - Republican Party (Trump)
2020 Presidential Elections Results (%) - Other
Ancestries Reported - Arab (%)
Ancestries Reported - Czech (%)
Ancestries Reported - Danish (%)
Ancestries Reported - Dutch (%)
Ancestries Reported - English (%)
Ancestries Reported - French (%)
Ancestries Reported - French Canadian (%)
Ancestries Reported - German (%)
Ancestries Reported - Greek (%)
Ancestries Reported - Hungarian (%)
Ancestries Reported - Irish (%)
Ancestries Reported - Italian (%)
Ancestries Reported - Lithuanian (%)
Ancestries Reported - Norwegian (%)
Ancestries Reported - Polish (%)
Ancestries Reported - Portuguese (%)
Ancestries Reported - Russian (%)
Ancestries Reported - Scotch-Irish (%)
Ancestries Reported - Scottish (%)
Ancestries Reported - Slovak (%)
Ancestries Reported - Subsaharan African (%)
Ancestries Reported - Swedish (%)
Ancestries Reported - Swiss (%)
Ancestries Reported - Ukrainian (%)
Ancestries Reported - United States (%)
Ancestries Reported - Welsh (%)
Ancestries Reported - West Indian (%)
Ancestries Reported - Other (%)
Educational Attainment - No schooling completed (%)
Educational Attainment - Less than high school (%)
Educational Attainment - High school or equivalent (%)
Educational Attainment - Less than 1 year of college (%)
Educational Attainment - 1 or more years of college (%)
Educational Attainment - Associate degree (%)
Educational Attainment - Bachelor's degree (%)
Educational Attainment - Master's degree (%)
Educational Attainment - Professional school degree (%)
Educational Attainment - Doctorate degree (%)
School Enrollment - Nursery, preschool (%)
School Enrollment - Kindergarten (%)
School Enrollment - Grade 1 to 4 (%)
School Enrollment - Grade 5 to 8 (%)
School Enrollment - Grade 9 to 12 (%)
School Enrollment - College undergrad (%)
School Enrollment - Graduate or professional (%)
School Enrollment - Not enrolled in school (%)
School enrollment - Public schools (%)
School enrollment - Private schools (%)
School enrollment - Not enrolled (%)
Median number of rooms in houses and condos
Median number of rooms in apartments
Housing units lacking complete plumbing facilities (%)
Housing units lacking complete kitchen facilities (%)
Density of houses
Urban houses (%)
Rural houses (%)
Households with people 60 years and over (%)
Households with people 65 years and over (%)
Households with people 75 years and over (%)
Households with one or more nonrelatives (%)
Households with no nonrelatives (%)
Population in households (%)
Family households (%)
Nonfamily households (%)
Population in families (%)
Family households with own children (%)
Median number of bedrooms in owner occupied houses
Mean number of bedrooms in owner occupied houses
Median number of bedrooms in renter occupied houses
Mean number of bedrooms in renter occupied houses
Median number of vehichles in owner occupied houses
Mean number of vehichles in owner occupied houses
Median number of vehichles in renter occupied houses
Mean number of vehichles in renter occupied houses
Mortgage status - with mortgage (%)
Mortgage status - with second mortgage (%)
Mortgage status - with home equity loan (%)
Mortgage status - with both second mortgage and home equity loan (%)
Mortgage status - without a mortgage (%)
Average family size
Average family size - White
Average family size - Black or African American
Average family size - Asian
Average family size - Hispanic or Latino
Average family size - American Indian and Alaska Native
Average family size - Multirace
Average family size - Other Race
Geographical mobility - Same house 1 year ago (%)
Geographical mobility - Moved within same county (%)
Geographical mobility - Moved from different county within same state (%)
Geographical mobility - Moved from different state (%)
Geographical mobility - Moved from abroad (%)
Place of birth - Born in state of residence (%)
Place of birth - Born in other state (%)
Place of birth - Native, outside of US (%)
Place of birth - Foreign born (%)
Housing units in structures - 1, detached (%)
Housing units in structures - 1, attached (%)
Housing units in structures - 2 (%)
Housing units in structures - 3 or 4 (%)
Housing units in structures - 5 to 9 (%)
Housing units in structures - 10 to 19 (%)
Housing units in structures - 20 to 49 (%)
Housing units in structures - 50 or more (%)
Housing units in structures - Mobile home (%)
Housing units in structures - Boat, RV, van, etc. (%)
House/condo owner moved in on average (years ago)
Renter moved in on average (years ago)
Year householder moved into unit - Moved in 1999 to March 2000 (%)
Year householder moved into unit - Moved in 1995 to 1998 (%)
Year householder moved into unit - Moved in 1990 to 1994 (%)
Year householder moved into unit - Moved in 1980 to 1989 (%)
Year householder moved into unit - Moved in 1970 to 1979 (%)
Year householder moved into unit - Moved in 1969 or earlier (%)
Means of transportation to work - Drove car alone (%)
Means of transportation to work - Carpooled (%)
Means of transportation to work - Public transportation (%)
Means of transportation to work - Bus or trolley bus (%)
Means of transportation to work - Streetcar or trolley car (%)
Means of transportation to work - Subway or elevated (%)
Means of transportation to work - Railroad (%)
Means of transportation to work - Ferryboat (%)
Means of transportation to work - Taxicab (%)
Means of transportation to work - Motorcycle (%)
Means of transportation to work - Bicycle (%)
Means of transportation to work - Walked (%)
Means of transportation to work - Other means (%)
Working at home (%)
Industry diversity
Most Common Industries - Agriculture, forestry, fishing and hunting, and mining (%)
Most Common Industries - Agriculture, forestry, fishing and hunting (%)
Most Common Industries - Mining, quarrying, and oil and gas extraction (%)
Most Common Industries - Construction (%)
Most Common Industries - Manufacturing (%)
Most Common Industries - Wholesale trade (%)
Most Common Industries - Retail trade (%)
Most Common Industries - Transportation and warehousing, and utilities (%)
Most Common Industries - Transportation and warehousing (%)
Most Common Industries - Utilities (%)
Most Common Industries - Information (%)
Most Common Industries - Finance and insurance, and real estate and rental and leasing (%)
Most Common Industries - Finance and insurance (%)
Most Common Industries - Real estate and rental and leasing (%)
Most Common Industries - Professional, scientific, and management, and administrative and waste management services (%)
Most Common Industries - Professional, scientific, and technical services (%)
Most Common Industries - Management of companies and enterprises (%)
Most Common Industries - Administrative and support and waste management services (%)
Most Common Industries - Educational services, and health care and social assistance (%)
Most Common Industries - Educational services (%)
Most Common Industries - Health care and social assistance (%)
Most Common Industries - Arts, entertainment, and recreation, and accommodation and food services (%)
Most Common Industries - Arts, entertainment, and recreation (%)
Most Common Industries - Accommodation and food services (%)
Most Common Industries - Other services, except public administration (%)
Most Common Industries - Public administration (%)
Occupation diversity
Most Common Occupations - Management, business, science, and arts occupations (%)
Most Common Occupations - Management, business, and financial occupations (%)
Most Common Occupations - Management occupations (%)
Most Common Occupations - Business and financial operations occupations (%)
Most Common Occupations - Computer, engineering, and science occupations (%)
Most Common Occupations - Computer and mathematical occupations (%)
Most Common Occupations - Architecture and engineering occupations (%)
Most Common Occupations - Life, physical, and social science occupations (%)
Most Common Occupations - Education, legal, community service, arts, and media occupations (%)
Most Common Occupations - Community and social service occupations (%)
Most Common Occupations - Legal occupations (%)
Most Common Occupations - Education, training, and library occupations (%)
Most Common Occupations - Arts, design, entertainment, sports, and media occupations (%)
Most Common Occupations - Healthcare practitioners and technical occupations (%)
Most Common Occupations - Health diagnosing and treating practitioners and other technical occupations (%)
Most Common Occupations - Health technologists and technicians (%)
Most Common Occupations - Service occupations (%)
Most Common Occupations - Healthcare support occupations (%)
Most Common Occupations - Protective service occupations (%)
Most Common Occupations - Fire fighting and prevention, and other protective service workers including supervisors (%)
Most Common Occupations - Law enforcement workers including supervisors (%)
Most Common Occupations - Food preparation and serving related occupations (%)
Most Common Occupations - Building and grounds cleaning and maintenance occupations (%)
Most Common Occupations - Personal care and service occupations (%)
Most Common Occupations - Sales and office occupations (%)
Most Common Occupations - Sales and related occupations (%)
Most Common Occupations - Office and administrative support occupations (%)
Most Common Occupations - Natural resources, construction, and maintenance occupations (%)
Most Common Occupations - Farming, fishing, and forestry occupations (%)
Most Common Occupations - Construction and extraction occupations (%)
Most Common Occupations - Installation, maintenance, and repair occupations (%)
Most Common Occupations - Production, transportation, and material moving occupations (%)
Most Common Occupations - Production occupations (%)
Most Common Occupations - Transportation occupations (%)
Most Common Occupations - Material moving occupations (%)
People in Group quarters - Institutionalized population (%)
People in Group quarters - Correctional institutions (%)
People in Group quarters - Federal prisons and detention centers (%)
People in Group quarters - Halfway houses (%)
People in Group quarters - Local jails and other confinement facilities (including police lockups) (%)
People in Group quarters - Military disciplinary barracks (%)
People in Group quarters - State prisons (%)
People in Group quarters - Other types of correctional institutions (%)
People in Group quarters - Nursing homes (%)
People in Group quarters - Hospitals/wards, hospices, and schools for the handicapped (%)
People in Group quarters - Hospitals/wards and hospices for chronically ill (%)
People in Group quarters - Hospices or homes for chronically ill (%)
People in Group quarters - Military hospitals or wards for chronically ill (%)
People in Group quarters - Other hospitals or wards for chronically ill (%)
People in Group quarters - Hospitals or wards for drug/alcohol abuse (%)
People in Group quarters - Mental (Psychiatric) hospitals or wards (%)
People in Group quarters - Schools, hospitals, or wards for the mentally retarded (%)
People in Group quarters - Schools, hospitals, or wards for the physically handicapped (%)
People in Group quarters - Institutions for the deaf (%)
People in Group quarters - Institutions for the blind (%)
People in Group quarters - Orthopedic wards and institutions for the physically handicapped (%)
People in Group quarters - Wards in general hospitals for patients who have no usual home elsewhere (%)
People in Group quarters - Wards in military hospitals for patients who have no usual home elsewhere (%)
People in Group quarters - Juvenile institutions (%)
People in Group quarters - Long-term care (%)
People in Group quarters - Homes for abused, dependent, and neglected children (%)
People in Group quarters - Residential treatment centers for emotionally disturbed children (%)
People in Group quarters - Training schools for juvenile delinquents (%)
People in Group quarters - Short-term care, detention or diagnostic centers for delinquent children (%)
People in Group quarters - Type of juvenile institution unknown (%)
People in Group quarters - Noninstitutionalized population (%)
People in Group quarters - College dormitories (includes college quarters off campus) (%)
People in Group quarters - Military quarters (%)
People in Group quarters - On base (%)
People in Group quarters - Barracks, unaccompanied personnel housing (UPH), (Enlisted/Officer), ;and similar group living quarters for military personnel (%)
People in Group quarters - Transient quarters for temporary residents (%)
People in Group quarters - Military ships (%)
People in Group quarters - Group homes (%)
People in Group quarters - Homes or halfway houses for drug/alcohol abuse (%)
People in Group quarters - Homes for the mentally ill (%)
People in Group quarters - Homes for the mentally retarded (%)
People in Group quarters - Homes for the physically handicapped (%)
People in Group quarters - Other group homes (%)
People in Group quarters - Religious group quarters (%)
People in Group quarters - Dormitories (%)
People in Group quarters - Agriculture workers' dormitories on farms (%)
People in Group quarters - Job Corps and vocational training facilities (%)
People in Group quarters - Other workers' dormitories (%)
People in Group quarters - Crews of maritime vessels (%)
People in Group quarters - Other nonhousehold living situations (%)
People in Group quarters - Other noninstitutional group quarters (%)
Residents speaking English at home (%)
Residents speaking English at home - Born in the United States (%)
Residents speaking English at home - Native, born elsewhere (%)
Residents speaking English at home - Foreign born (%)
Residents speaking Spanish at home (%)
Residents speaking Spanish at home - Born in the United States (%)
Residents speaking Spanish at home - Native, born elsewhere (%)
Residents speaking Spanish at home - Foreign born (%)
Residents speaking other language at home (%)
Residents speaking other language at home - Born in the United States (%)
Residents speaking other language at home - Native, born elsewhere (%)
Residents speaking other language at home - Foreign born (%)
Class of Workers - Employee of private company (%)
Class of Workers - Self-employed in own incorporated business (%)
Class of Workers - Private not-for-profit wage and salary workers (%)
Class of Workers - Local government workers (%)
Class of Workers - State government workers (%)
Class of Workers - Federal government workers (%)
Class of Workers - Self-employed workers in own not incorporated business and Unpaid family workers (%)
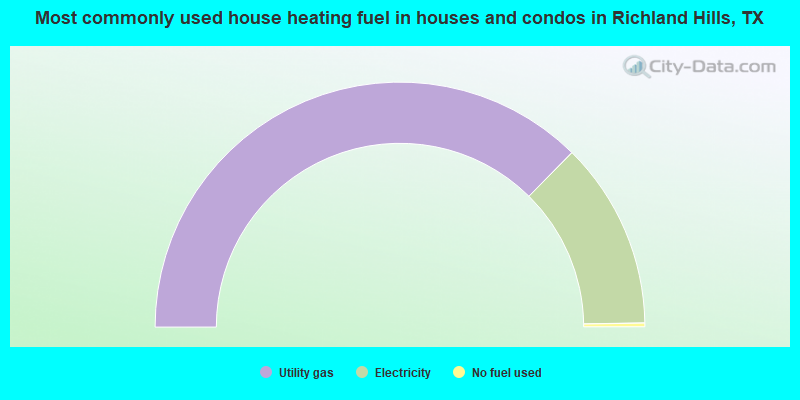
House heating fuel used in houses and condos - Utility gas (%)
House heating fuel used in houses and condos - Bottled, tank, or LP gas (%)
House heating fuel used in houses and condos - Electricity (%)
House heating fuel used in houses and condos - Fuel oil, kerosene, etc. (%)
House heating fuel used in houses and condos - Coal or coke (%)
House heating fuel used in houses and condos - Wood (%)
House heating fuel used in houses and condos - Solar energy (%)
House heating fuel used in houses and condos - Other fuel (%)
House heating fuel used in houses and condos - No fuel used (%)
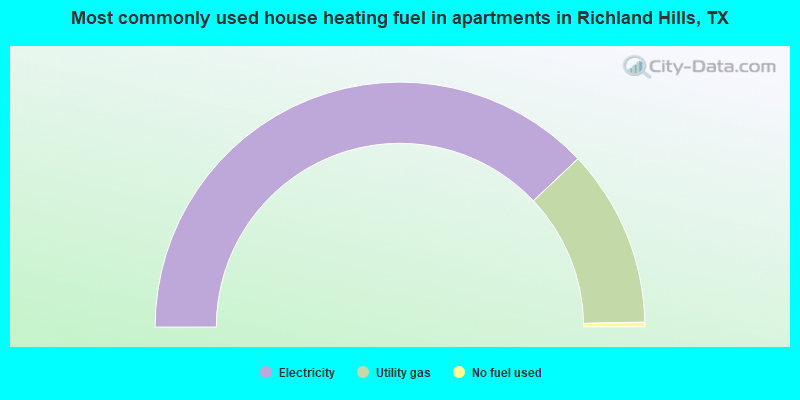
House heating fuel used in apartments - Utility gas (%)
House heating fuel used in apartments - Bottled, tank, or LP gas (%)
House heating fuel used in apartments - Electricity (%)
House heating fuel used in apartments - Fuel oil, kerosene, etc. (%)
House heating fuel used in apartments - Coal or coke (%)
House heating fuel used in apartments - Wood (%)
House heating fuel used in apartments - Solar energy (%)
House heating fuel used in apartments - Other fuel (%)
House heating fuel used in apartments - No fuel used (%)
Armed forces status - In Armed Forces (%)
Armed forces status - Civilian (%)
Armed forces status - Civilian - Veteran (%)
Armed forces status - Civilian - Nonveteran (%)
Fatal accidents locations in years 2005-2021
Fatal accidents locations in 2005
Fatal accidents locations in 2006
Fatal accidents locations in 2007
Fatal accidents locations in 2008
Fatal accidents locations in 2009
Fatal accidents locations in 2010
Fatal accidents locations in 2011
Fatal accidents locations in 2012
Fatal accidents locations in 2013
Fatal accidents locations in 2014
Fatal accidents locations in 2015
Fatal accidents locations in 2016
Fatal accidents locations in 2017
Fatal accidents locations in 2018
Fatal accidents locations in 2019
Fatal accidents locations in 2020
Fatal accidents locations in 2021
Alcohol use - People drinking some alcohol every month (%)
Alcohol use - People not drinking at all (%)
Alcohol use - Average days/month drinking alcohol
Alcohol use - Average drinks/week
Alcohol use - Average days/year people drink much
Audiometry - Average condition of hearing (%)
Audiometry - People that can hear a whisper from across a quiet room (%)
Audiometry - People that can hear normal voice from across a quiet room (%)
Audiometry - Ears ringing, roaring, buzzing (%)
Audiometry - Had a job exposure to loud noise (%)
Audiometry - Had off-work exposure to loud noise (%)
Blood Pressure & Cholesterol - Has high blood pressure (%)
Blood Pressure & Cholesterol - Checking blood pressure at home (%)
Blood Pressure & Cholesterol - Frequently checking blood cholesterol (%)
Blood Pressure & Cholesterol - Has high cholesterol level (%)
Consumer Behavior - Money monthly spent on food at supermarket/grocery store
Consumer Behavior - Money monthly spent on food at other stores
Consumer Behavior - Money monthly spent on eating out
Consumer Behavior - Money monthly spent on carryout/delivered foods
Consumer Behavior - Income spent on food at supermarket/grocery store (%)
Consumer Behavior - Income spent on food at other stores (%)
Consumer Behavior - Income spent on eating out (%)
Consumer Behavior - Income spent on carryout/delivered foods (%)
Current Health Status - General health condition (%)
Current Health Status - Blood donors (%)
Current Health Status - Has blood ever tested for HIV virus (%)
Current Health Status - Left-handed people (%)
Dermatology - People using sunscreen (%)
Diabetes - Diabetics (%)
Diabetes - Had a blood test for high blood sugar (%)
Diabetes - People taking insulin (%)
Diet Behavior & Nutrition - Diet health (%)
Diet Behavior & Nutrition - Milk product consumption (# of products/month)
Diet Behavior & Nutrition - Meals not home prepared (#/week)
Diet Behavior & Nutrition - Meals from fast food or pizza place (#/week)
Diet Behavior & Nutrition - Ready-to-eat foods (#/month)
Diet Behavior & Nutrition - Frozen meals/pizza (#/month)
Drug Use - People that ever used marijuana or hashish (%)
Drug Use - Ever used hard drugs (%)
Drug Use - Ever used any form of cocaine (%)
Drug Use - Ever used heroin (%)
Drug Use - Ever used methamphetamine (%)
Health Insurance - People covered by health insurance (%)
Kidney Conditions-Urology - Avg. # of times urinating at night
Medical Conditions - People with asthma (%)
Medical Conditions - People with anemia (%)
Medical Conditions - People with psoriasis (%)
Medical Conditions - People with overweight (%)
Medical Conditions - Elderly people having difficulties in thinking or remembering (%)
Medical Conditions - People who ever received blood transfusion (%)
Medical Conditions - People having trouble seeing even with glass/contacts (%)
Medical Conditions - People with arthritis (%)
Medical Conditions - People with gout (%)
Medical Conditions - People with congestive heart failure (%)
Medical Conditions - People with coronary heart disease (%)
Medical Conditions - People with angina pectoris (%)
Medical Conditions - People who ever had heart attack (%)
Medical Conditions - People who ever had stroke (%)
Medical Conditions - People with emphysema (%)
Medical Conditions - People with thyroid problem (%)
Medical Conditions - People with chronic bronchitis (%)
Medical Conditions - People with any liver condition (%)
Medical Conditions - People who ever had cancer or malignancy (%)
Mental Health - People who have little interest in doing things (%)
Mental Health - People feeling down, depressed, or hopeless (%)
Mental Health - People who have trouble sleeping or sleeping too much (%)
Mental Health - People feeling tired or having little energy (%)
Mental Health - People with poor appetite or overeating (%)
Mental Health - People feeling bad about themself (%)
Mental Health - People who have trouble concentrating on things (%)
Mental Health - People moving or speaking slowly or too fast (%)
Mental Health - People having thoughts they would be better off dead (%)
Oral Health - Average years since last visit a dentist
Oral Health - People embarrassed because of mouth (%)
Oral Health - People with gum disease (%)
Oral Health - General health of teeth and gums (%)
Oral Health - Average days a week using dental floss/device
Oral Health - Average days a week using mouthwash for dental problem
Oral Health - Average number of teeth
Pesticide Use - Households using pesticides to control insects (%)
Pesticide Use - Households using pesticides to kill weeds (%)
Physical Activity - People doing vigorous-intensity work activities (%)
Physical Activity - People doing moderate-intensity work activities (%)
Physical Activity - People walking or bicycling (%)
Physical Activity - People doing vigorous-intensity recreational activities (%)
Physical Activity - People doing moderate-intensity recreational activities (%)
Physical Activity - Average hours a day doing sedentary activities
Physical Activity - Average hours a day watching TV or videos
Physical Activity - Average hours a day using computer
Physical Functioning - People having limitations keeping them from working (%)
Physical Functioning - People limited in amount of work they can do (%)
Physical Functioning - People that need special equipment to walk (%)
Physical Functioning - People experiencing confusion/memory problems (%)
Physical Functioning - People requiring special healthcare equipment (%)
Prescription Medications - Average number of prescription medicines taking
Preventive Aspirin Use - Adults 40+ taking low-dose aspirin (%)
Reproductive Health - Vaginal deliveries (%)
Reproductive Health - Cesarean deliveries (%)
Reproductive Health - Deliveries resulted in a live birth (%)
Reproductive Health - Pregnancies resulted in a delivery (%)
Reproductive Health - Women breastfeeding newborns (%)
Reproductive Health - Women that had a hysterectomy (%)
Reproductive Health - Women that had both ovaries removed (%)
Reproductive Health - Women that have ever taken birth control pills (%)
Reproductive Health - Women taking birth control pills (%)
Reproductive Health - Women that have ever used Depo-Provera or injectables (%)
Reproductive Health - Women that have ever used female hormones (%)
Sexual Behavior - People 18+ that ever had sex (vaginal, anal, or oral) (%)
Sexual Behavior - Males 18+ that ever had vaginal sex with a woman (%)
Sexual Behavior - Males 18+ that ever performed oral sex on a woman (%)
Sexual Behavior - Males 18+ that ever had anal sex with a woman (%)
Sexual Behavior - Males 18+ that ever had any sex with a man (%)
Sexual Behavior - Females 18+ that ever had vaginal sex with a man (%)
Sexual Behavior - Females 18+ that ever performed oral sex on a man (%)
Sexual Behavior - Females 18+ that ever had anal sex with a man (%)
Sexual Behavior - Females 18+ that ever had any kind of sex with a woman (%)
Sexual Behavior - Average age people first had sex
Sexual Behavior - Average number of female sex partners in lifetime (males 18+)
Sexual Behavior - Average number of female vaginal sex partners in lifetime (males 18+)
Sexual Behavior - Average age people first performed oral sex on a woman (18+)
Sexual Behavior - Average number of woman performed oral sex on in lifetime (18+)
Sexual Behavior - Average number of male sex partners in lifetime (males 18+)
Sexual Behavior - Average number of male anal sex partners in lifetime (males 18+)
Sexual Behavior - Average age people first performed oral sex on a man (18+)
Sexual Behavior - Average number of male oral sex partners in lifetime (18+)
Sexual Behavior - People using protection when performing oral sex (%)
Sexual Behavior - Average number of times people have vaginal or anal sex a year
Sexual Behavior - People having sex without condom (%)
Sexual Behavior - Average number of male sex partners in lifetime (females 18+)
Sexual Behavior - Average number of male vaginal sex partners in lifetime (females 18+)
Sexual Behavior - Average number of female sex partners in lifetime (females 18+)
Sexual Behavior - Circumcised males 18+ (%)
Sleep Disorders - Average hours sleeping at night
Sleep Disorders - People that has trouble sleeping (%)
Smoking-Cigarette Use - People smoking cigarettes (%)
Taste & Smell - People 40+ having problems with smell (%)
Taste & Smell - People 40+ having problems with taste (%)
Taste & Smell - People 40+ that ever had wisdom teeth removed (%)
Taste & Smell - People 40+ that ever had tonsils teeth removed (%)
Taste & Smell - People 40+ that ever had a loss of consciousness because of a head injury (%)
Taste & Smell - People 40+ that ever had a broken nose or other serious injury to face or skull (%)
Taste & Smell - People 40+ that ever had two or more sinus infections (%)
Weight - Average height (inches)
Weight - Average weight (pounds)
Weight - Average BMI
Weight - People that are obese (%)
Weight - People that ever were obese (%)
Weight - People trying to lose weight (%)
According to our research of Texas and other state lists, there were 13 registered sex offenders living in Richland Hills, Texas as of April 26, 2024 . The ratio of all residents to sex offenders in Richland Hills is 640 to 1.The ratio of registered sex offenders to all residents in this city is lower than the state average.
Officers per 1,000 residents here:
2.42Texas average:
2.07
Latest news from Richland Hills, TX collected exclusively by city-data.com from local newspapers, TV, and radio stations
Ancestries: English (19.2%), American (8.7%), German (5.3%), Irish (3.2%), European (1.8%), Polish (1.2%).
Current Local Time:
Land area: 3.15 square miles.
Population density: 2,672 people per square mile (average).
687 residents are foreign born (5.8% Latin America , 1.6% Asia ).
This city:
7.9%Texas:
17.1%
Median real estate property taxes paid for housing units with mortgages in 2022: $3,574 (1.4%)Median real estate property taxes paid for housing units with no mortgage in 2022: $3,047 (1.3%)
Nearest city with pop. 50,000+: North Richland Hills, TX
Nearest city with pop. 200,000+: Northeast Tarrant, TX (4.9 miles
Nearest city with pop. 1,000,000+: Dallas, TX
Nearest cities:
Latitude: 32.81 N, Longitude: 97.23 W
Daytime population change due to commuting: -990 (-11.4%)Workers who live and work in this city: 823 (16.5%)
Property values in Richland Hills, TX
Single-family new house construction building permits:
2022: 1 building , cost: $600,0002021: 5 buildings , average cost: $287,8002020: 2 buildings , average cost: $233,1002019: 5 buildings , average cost: $201,5002017: 3 buildings , average cost: $200,0002016: 1 building , cost: $179,0002015: 1 building , cost: $50,0002014: 6 buildings , average cost: $90,0002013: 2 buildings , average cost: $90,0002012: 1 building , cost: $274,0002011: 1 building , cost: $80,0002010: 2 buildings , average cost: $80,0002008: 1 building , cost: $325,0002007: 1 building , cost: $179,0002006: 6 buildings , average cost: $177,3002005: 6 buildings , average cost: $160,0002004: 11 buildings , average cost: $133,3002003: 14 buildings , average cost: $144,0002002: 9 buildings , average cost: $110,8002001: 5 buildings , average cost: $112,7002000: 5 buildings , average cost: $95,5001999: 4 buildings , average cost: $85,3001998: 4 buildings , average cost: $136,300Unemployment in December 2023:
Population change in the 1990s: +118 (+1.5%).
Most common occupations in Richland Hills, TX (%)
Both Males Females
Retail sales workers, except cashiers (5.5%)
Other office and administrative support workers, including supervisors (5.0%)
Other management occupations, except farmers and farm managers (4.6%)
Other production occupations, including supervisors (4.6%)
Electrical equipment mechanics and other installation, maintenance, and repair workers, including supervisors (4.2%)
Other sales and related occupations, including supervisors (4.1%)
Sales representatives, services, wholesale and manufacturing (4.0%)
Electrical equipment mechanics and other installation, maintenance, and repair workers, including supervisors (8.0%)
Other production occupations, including supervisors (5.9%)
Retail sales workers, except cashiers (4.7%)
Material recording, scheduling, dispatching, and distributing workers (4.6%)
Other management occupations, except farmers and farm managers (4.5%)
Sales representatives, services, wholesale and manufacturing (4.4%)
Vehicle and mobile equipment mechanics, installers, and repairers (4.4%)
Other office and administrative support workers, including supervisors (7.3%)
Retail sales workers, except cashiers (6.3%)
Preschool, kindergarten, elementary, and middle school teachers (6.0%)
Secretaries and administrative assistants (5.9%)
Information and record clerks, except customer service representatives (4.7%)
Other management occupations, except farmers and farm managers (4.7%)
Other sales and related occupations, including supervisors (4.4%)
Tornado activity:
Richland Hills-area historical tornado activity is above Texas state average. It is 153% greater than the overall U.S. average.
On 4/25/1990, a category F4 (max. wind speeds 207-260 mph) tornado 31.1 miles away from the Richland Hills city center caused between $500,000 and $5,000,000 in damages.
On 5/4/1960, a category F3 (max. wind speeds 158-206 mph) tornado 7.3 miles away from the city center injured 12 people and caused between $50,000 and $500,000 in damages.
Earthquake activity:
Richland Hills-area historical earthquake activity is significantly above Texas state average. It is 471% greater than the overall U.S. average. On 11/6/2011 at 03:53:10, a magnitude 5.7 (5.7 MW, Depth: 3.2 mi, Class: Moderate, Intensity: VI - VII) earthquake occurred 190.1 miles away from the city center On 9/3/2016 at 12:02:44, a magnitude 5.8 (5.8 MW, Depth: 3.5 mi) earthquake occurred 250.6 miles away from the city center On 6/16/1978 at 11:46:54, a magnitude 5.3 (4.4 MB, 4.6 UK, 5.3 ML) earthquake occurred 206.1 miles away from Richland Hills center On 5/17/2012 at 08:12:00, a magnitude 4.8 (4.8 MW, Depth: 3.1 mi, Class: Light, Intensity: IV - V) earthquake occurred 177.8 miles away from Richland Hills center On 11/7/2016 at 01:44:24, a magnitude 5.0 (5.0 MW, Depth: 2.8 mi) earthquake occurred 221.3 miles away from Richland Hills center On 5/7/2015 at 22:58:05, a magnitude 4.0 (4.0 MW, Depth: 1.6 mi) earthquake occurred 23.9 miles away from Richland Hills center Magnitude types: body-wave magnitude (MB), local magnitude (ML), moment magnitude (MW) Natural disasters: The number of natural disasters in Tarrant County (23) is greater than the US average (15).Major Disasters (Presidential) Declared: 10Emergencies Declared: 10Storms: 8, Floods: 7, Hurricanes: 7, Fires: 6, Tornadoes: 5, Wind: 1, Other: 2 (Note: some incidents may be assigned to more than one category). Hospitals and medical centers in Richland Hills: BESTCARE HOME HEALTH INC (7215 A BAKER BLVD)
BOULEVARD MANOR CARE CENTER (7146 BAKER BOULEVARD)
LEXINGTON PLACE NURSING AND REHABILITATION (7146 BAKER BLVD)
Amtrak station near Richland Hills: 8 miles: FORT WORTH (1501 JONES ST.) Services: ticket office, fully wheelchair accessible, enclosed waiting area, public restrooms, public payphones, vending machines, free short-term parking, paid long-term parking, call for car rental service, call for taxi service, public transit connection.
Colleges/universities with over 2000 students nearest to Richland Hills:
Tarrant County College District (about 8 miles; Fort Worth, TX ; Full-time enrollment: 33,775)
The University of Texas at Arlington (about 9 miles; Arlington, TX ; FT enrollment: 27,453)
Texas Christian University (about 11 miles; Fort Worth, TX ; FT enrollment: 9,131)
DeVry University-Texas (about 16 miles; Irving, TX ; FT enrollment: 4,098)
North Lake College (about 16 miles; Irving, TX ; FT enrollment: 6,191)
Dallas Baptist University (about 18 miles; Dallas, TX ; FT enrollment: 4,280)
University of Dallas (about 18 miles; Irving, TX ; FT enrollment: 2,192)
Public high school in Richland Hills: RICHLAND MIDDLE Location: 7400 HOVENKAMP AVE, Grades: 6-9)
Public elementary/middle schools in Richland Hills: JACK C BINION EL Students: 634, Location: 7400 GLENVIEW DR, Grades: PK-5)RICHLAND EL Students: 582, Location: 3250 SCRUGGS PARK DR, Grades: PK-5)Private elementary/middle school in Richland Hills: ST JOHN THE APOSTLE CATHOLIC Students: 291, Location: 7421 GLENVIEW DR, Grades: PK-8)
See full list of schools located in Richland Hills Library in Richland Hills: RICHLAND HILLS PUBLIC LIBRARY Operating income: $317,732; Location: 6724 RENA DR; 35,849 books ; 1,381 audio materials ; 2,082 video materials ; 2 local licensed databases ; 50 state licensed databases ; 98 print serial subscriptions ; 2 electronic serial subscriptions )
Birthplace of: Adam Warren - College basketball player (Dartmouth Big Green).
Tarrant County has a predicted average indoor radon screening level less than 2 pCi/L (pico curies per liter) - Low Potential Average household size: This city:
2.5 peopleTexas:
2.8 people
Percentage of family households: This city:
64.3%Whole state:
69.9%
Percentage of households with unmarried partners: This city:
6.1%Whole state:
6.0%
Likely homosexual households (counted as self-reported same-sex unmarried-partner households)
Lesbian couples: 0.4% of all households Gay men: 0.2% of all households
166 people in nursing facilities/skilled-nursing facilities in 2010People in group quarters in Richland Hills in 2000:
191 people in nursing homes
33 people in other noninstitutional group quarters
9 people in other group homes
For population 15 years and over in Richland Hills:
Never married: 27.2%Now married: 45.8%Separated: 2.5%Widowed: 9.4%Divorced: 15.1% For population 25 years and over in Richland Hills:
High school or higher: 90.0%Bachelor's degree or higher: 18.3%Graduate or professional degree: 6.5%Unemployed: 3.4%Mean travel time to work (commute): 18.6 minutes
Education Gini index (Inequality in education) Here:
10.1Texas average:
14.0
Religion statistics for Richland Hills, TX (based on Tarrant County data)
Religion Adherents Congregations Evangelical Protestant 544,670 1,272 Catholic 200,645 33 Mainline Protestant 141,938 158 Other 75,335 122 Black Protestant 33,665 103 Orthodox 2,596 7 None 810,185 -
Source: Clifford Grammich, Kirk Hadaway, Richard Houseal, Dale E.Jones, Alexei Krindatch, Richie Stanley and Richard H.Taylor. 2012. 2010 U.S.Religion Census: Religious Congregations & Membership Study. Association of Statisticians of American Religious Bodies. Jones, Dale E., et al. 2002. Congregations and Membership in the United States 2000. Nashville, TN: Glenmary Research Center. Graphs represent county-level data
Food Environment Statistics: Number of grocery stores : 212Tarrant County :
1.24 / 10,000 pop.Texas :
1.47 / 10,000 pop.
Number of supercenters and club stores : 25This county :
0.15 / 10,000 pop.Texas :
0.14 / 10,000 pop.
Number of convenience stores (no gas) : 194Here :
1.14 / 10,000 pop.Texas :
1.11 / 10,000 pop.
Number of convenience stores (with gas) : 609Here :
3.56 / 10,000 pop.Texas :
3.95 / 10,000 pop.
Number of full-service restaurants : 970This county :
5.68 / 10,000 pop.State :
6.13 / 10,000 pop.
Adult diabetes rate : Tarrant County :
8.1%State :
8.9%
Adult obesity rate : This county :
26.1%Texas :
26.6%
Low-income preschool obesity rate : Tarrant County :
14.5%State :
15.7%
Health and Nutrition:
Average overall health of teeth and gums : This city:
46.6%Texas:
47.4%
People feeling badly about themselves : People not drinking alcohol at all : Average hours sleeping at night : Richland Hills:
6.9Texas:
6.8
Overweight people : This city:
34.3%Texas:
33.1%
General health condition : Richland Hills:
55.2%State:
56.2%
Average condition of hearing : This city:
76.8%Texas:
80.7%
More about Health and Nutrition of Richland Hills, TX Residents
Local government employment and payroll (March 2022)
Function
Full-time employees
Monthly full-time payroll
Average yearly full-time wage
Part-time employees
Monthly part-time payroll
Police - Other
23 $145,988 $76,168 1 $255 Firefighters
17 $102,223 $72,157 4 $4,216 Housing and Community Development (Local)
6 $29,964 $59,928 0 $0 Financial Administration
4 $26,950 $80,850 0 $0 Sewerage
3 $11,138 $44,552 0 $0 Local Libraries
3 $13,567 $54,268 4 $6,007 Water Supply
3 $9,344 $37,376 0 $0 Parks and Recreation
3 $18,939 $75,756 20 $17,934 Other Government Administration
2 $16,450 $98,700 0 $0 Judicial and Legal
2 $13,620 $81,720 1 $2,861 Streets and Highways
1 $3,840 $46,080 0 $0 Police Protection - Officers
1 $5,128 $61,536 0 $0 Natural Resources
1 $3,419 $41,028 0 $0 Other and Unallocable
1 $2,823 $33,876 2 $2,425
Totals for Government
70 $403,392 $69,153 32 $33,697
Richland Hills government finances - Expenditure in 2017 (per resident):
Construction - Parks and Recreation: $4,171,000 ($496.13)
Regular Highways: $872,000 ($103.72)Water Utilities: $809,000 ($96.23)Current Operations - Police Protection: $2,958,000 ($351.85)
Water Utilities: $1,659,000 ($197.34)Local Fire Protection: $1,619,000 ($192.58)Central Staff Services: $1,538,000 ($182.94)Sewerage: $800,000 ($95.16)Parks and Recreation: $498,000 ($59.24)Protective Inspection and Regulation - Other: $371,000 ($44.13)Libraries: $357,000 ($42.46)Judicial and Legal Services: $233,000 ($27.71)Natural Resources - Other: $211,000 ($25.10)Regular Highways: $174,000 ($20.70)General - Other: $113,000 ($13.44)General - Interest on Debt: $237,000 ($28.19)
Intergovernmental to Local - Other - Sewerage: $711,000 ($84.57)
Other Capital Outlay - Police Protection: $281,000 ($33.42)
Central Staff Services: $232,000 ($27.60)Total Salaries and Wages: $30,000 ($3.57)
Water Utilities - Interest on Debt: $183,000 ($21.77)
Richland Hills government finances - Revenue in 2017 (per resident):
Charges - Sewerage: $1,593,000 ($189.48)
Natural Resources - Other: $987,000 ($117.40)Other: $451,000 ($53.65)Local Intergovernmental - Highways: $110,000 ($13.08)
Miscellaneous - Fines and Forfeits: $784,000 ($93.26)
General Revenue - Other: $70,000 ($8.33)Sale of Property: $62,000 ($7.37)Royalties: $42,000 ($5.00)Interest Earnings: $21,000 ($2.50)Revenue - Water Utilities: $2,027,000 ($241.11)
State Intergovernmental - Highways: $228,000 ($27.12)
Other: $88,000 ($10.47)Water Utilities: $87,000 ($10.35)Sewerage: $87,000 ($10.35)General Local Government Support: $2,000 ($0.24)Tax - General Sales and Gross Receipts: $4,733,000 ($562.98)
Property: $2,910,000 ($346.14)Public Utilities Sales: $528,000 ($62.80)Other Selective Sales: $227,000 ($27.00)Other License: $169,000 ($20.10)
Richland Hills government finances - Debt in 2017 (per resident):
Long Term Debt - Outstanding Unspecified Public Purpose: $24,626,000 ($2929.23)
Issue, Unspecified Public Purpose: $13,475,000 ($1602.83)Beginning Outstanding - Unspecified Public Purpose: $12,335,000 ($1467.23)Retired Unspecified Public Purpose: $1,183,000 ($140.72)
Richland Hills government finances - Cash and Securities in 2017 (per resident):
Bond Funds - Cash and Securities: $10,316,000 ($1227.07)
Other Funds - Cash and Securities: $7,823,000 ($930.53)
Sinking Funds - Cash and Securities: $238,000 ($28.31)
7.43% of this county's 2021 resident taxpayers lived in other counties in 2020 ($70,478 average adjusted gross income )
Here:
7.43%Texas average:
8.12%
0.03% of residents moved from foreign countries ($213 average AGI )Tarrant County:
0.03%Texas average:
0.04%
Top counties from which taxpayers relocated into this county between 2020 and 2021:
7.19% of this county's 2020 resident taxpayers moved to other counties in 2021 ($70,939 average adjusted gross income )
Here:
7.19%Texas average:
7.40%
0.03% of residents moved to foreign countries ($199 average AGI )Tarrant County:
0.03%Texas average:
0.03%
Top counties to which taxpayers relocated from this county between 2020 and 2021:
Businesses in Richland Hills, TX
Name Count Name Count
AutoZone 1 Home Depot 1 CVS 1 La Quinta 1 Church's Chicken 1 McDonald's 1 Domino's Pizza 1 SONIC Drive-In 1 FedEx 1
Strongest AM radio stations in Richland Hills:
KESS (1270 AM; 50 kW; FORT WORTH, TX; Owner: KESS-AM LICENSE CORP.)
KHVN (970 AM; 10 kW; FORT WORTH, TX; Owner: MORTENSON BROADCASTING COMPANY)
KAHZ (1360 AM; 50 kW; HURST, TX)
WBAP (820 AM; 50 kW; FORT WORTH, TX; Owner: WBAP-KSCS OPERATING, LTD.)
KZMP (1540 AM; 50 kW; UNIVERSITY PARK, TX; Owner: ENTRAVISION HOLDINGS, LLC)
KNAX (1630 AM; 10 kW; FT. WORTH, TX; Owner: MORTENSON BROADCASTING COMPANY)
KBIS (1150 AM; 25 kW; HIGHLAND PARK, TX; Owner: DALLAS AM RADIO PARTNERS, L.P.)
KRLD (1080 AM; 50 kW; DALLAS, TX; Owner: TEXAS INFINITY BROADCASTING L.P.)
KLIF (570 AM; 5 kW; DALLAS, TX; Owner: KLIF LICO, INC.)
KSKY (660 AM; 20 kW; BALCH SPRINGS, TX; Owner: BISON MEDIA, INC.)
KTCK (1310 AM; 9 kW; DALLAS, TX; Owner: KRBE LICO, INC.)
KFXR (1190 AM; 50 kW; DALLAS, TX; Owner: CLEAR CHANNEL BROADCASTING LICENSES, INC.)
KFJZ (870 AM; daytime; 0 kW; FORT WORTH, TX; Owner: GARDEN CITY BROADCASTING, INC. D.I.P)
Strongest FM radio stations in Richland Hills:
K217BS (91.3 FM; NORTH RICHLAND HILLS, TX; Owner: CSN INTERNATIONAL)
KPLX (99.5 FM; FORT WORTH, TX; Owner: KPLX LICO, INC.)
KLLI (105.3 FM; DALLAS, TX; Owner: INFINITY BROADCASTING CORPORATION OF DALLAS)
KLUV-FM (98.7 FM; DALLAS, TX; Owner: INFINITY BROADCASTING CORPORATION OF DALLAS)
KKDA-FM (104.5 FM; DALLAS, TX; Owner: SERVICE BROADCASTING I, LTD.)
KZPS (92.5 FM; DALLAS, TX; Owner: AMFM TEXAS LICENSES LIMITED PARTNERSHIP)
KHKS (106.1 FM; DENTON, TX; Owner: AMFM TEXAS LICENSES LIMITED PARTNERSHIP)
KVIL-FM (103.7 FM; HIGHLAND PARK-DALLAS, TX; Owner: INFINITY BROADCASTING CORPORATION OF TEXAS)
KOAI (107.5 FM; FORT WORTH, TX; Owner: INFINITY KOAI-FM, INC.)
KLNO (94.1 FM; FORT WORTH, TX; Owner: HBC LICENSE CORPORATION)
KBFB (97.9 FM; DALLAS, TX; Owner: RADIO ONE LICENSES, LLC)
KSCS (96.3 FM; FORT WORTH, TX; Owner: WBAP-KSCS OPERATING, LTD.)
KEGL (97.1 FM; FORT WORTH, TX; Owner: CITICASTERS LICENSES, L.P.)
KRBV (100.3 FM; DALLAS, TX; Owner: INFINITY BROADCASTING CORP. OF FORT WORTH)
KCBI (90.9 FM; DALLAS, TX; Owner: CRISWELL CENTER FOR BIBLICAL STUDIES)
KDGE (102.1 FM; FORT WORTH-DALLAS, TX; Owner: CAPSTAR TX LIMITED PARTNERSHIP)
KDMX (102.9 FM; DALLAS, TX; Owner: CITICASTERS LICENSES, L.P.)
WRR (101.1 FM; DALLAS, TX; Owner: CITY OF DALLAS, TEXAS)
KERA (90.1 FM; DALLAS, TX; Owner: NORTH TEXAS PUBLIC BROADCASTING, INC.)
KVTT (91.7 FM; DALLAS, TX; Owner: RESEARCH EDUCATIONAL FOUNDATION, INC)
TV broadcast stations around Richland Hills:
KXAS-TV (Channel 5; FORT WORTH, TX; Owner: STATION VENTURE OPERATIONS, LP)
KDTN (Channel 2; DENTON, TX; Owner: NORTH TEXAS PUBLIC BROADCASTING, INC.)
KTVT (Channel 11; FORT WORTH, TX; Owner: CBS STATIONS GROUP OF TEXAS L.P.)
KLDT (Channel 55; LAKE DALLAS, TX; Owner: JOHNSON BROADCASTING OF DALLAS, INC.)
KSTR-TV (Channel 49; IRVING, TX; Owner: TELEFUTURA DALLAS LLC)
KPXD (Channel 68; ARLINGTON, TX; Owner: PAXSON DALLAS LICENSE, INC.)
KUVN (Channel 23; GARLAND, TX; Owner: KUVN LICENSE PARTNERSHIP, L.P.)
KTXA (Channel 21; FORT WORTH, TX; Owner: VIACOM TELEVISION STATIONS GROUP OF DALLAS/FORT WORTH L.P.)
KMPX (Channel 29; DECATUR, TX; Owner: WORD OF GOD FELLOWSHIP, INC.)
KFWD (Channel 52; FORT WORTH, TX; Owner: HIC BROADCAST, INC.)
WFAA-TV (Channel 8; DALLAS, TX; Owner: WFAA-TV, L.P.)
KDFW (Channel 4; DALLAS, TX; Owner: KDFW LICENSE, INC.)
KDTX-TV (Channel 58; DALLAS, TX; Owner: TRINITY BROADCASTING OF TEXAS, INC.)
KXTX-TV (Channel 39; DALLAS, TX; Owner: TELEMUNDO OF TEXAS PARTNERSHIP, LP)
KERA-TV (Channel 13; DALLAS, TX; Owner: NORTH TEXAS PUBLIC BROADCASTING, INC.)
KDAF (Channel 33; DALLAS, TX; Owner: TRIBUNE TELEVISION COMPANY)
KDFI (Channel 27; DALLAS, TX; Owner: NEW DMIC, INC.)
KUVN-CA (Channel 31; FORT WORTH, TX; Owner: KUVN LICENSE PARTNERSHIP, L.P.)
K26HF (Channel 26; BRITTON, TX; Owner: MAKO COMMUNICATIONS, LLC)
KHPK-LP (Channel 28; DE SOTO, TX; Owner: MAKO COMMUNICATIONS, LLC)
K25FW (Channel 25; CORSICANA, TX; Owner: VENTANA TELEVISION, INC.)
KATA-LP (Channel 60; MESQUITE, TX; Owner: JANE McGINNIS)
KLEG-LP (Channel 44; DALLAS, TX; Owner: DILIP VISWANATH)
KVFW-LP (Channel 65; FORT WORTH, TX; Owner: GERALD BENAVIDES)
KJJM-LP (Channel 46; DALLAS/MESQUITE, TX; Owner: JANE McGINNIS)
FCC Registered Antenna Towers: 14 (
See the full list of FCC Registered Antenna Towers in Richland Hills )
FCC Registered Broadcast Land Mobile Towers: 2
Lat: 32.834167 Lon: -97.228611, Call Sign: WPUJ671, Licensee ID: L00031959, Assigned Frequencies: 30.8400 MHz, Grant Date: 03/18/2002, Expiration Date: 03/18/2012, Cancellation Date: 05/19/2012, Certifier: Tom Jaggard, Registrant: Whataburger Inc., 4600 Parkdale, Corpus Christi, TX 78411-2981, Phone: (361) 878-0383, Fax: (361) 878-0669, Email:
Lat: 32.906667 Lon: -97.191944, Call Sign: WPXE284, Assigned Frequencies: 461.037 MHz, 462.912 MHz, 466.287 MHz, 469.487 MHz, Grant Date: 03/14/2003, Expiration Date: 03/14/2013, Cancellation Date: 05/18/2013, Certifier: Joan Anderberg, Registrant: Advanced Wireless Communications, 20855 Kensington Blvd., Lakeville, MN 55044-7486, Phone: (952) 469-5400, Fax: (952) 469-0170FCC Registered Microwave Towers: 5
DLS0603, 6455 Hilltop Dr. #120 (Lat: 32.845556 Lon: -97.239444), Type: Pole, Structure height: 24.4 m, Call Sign: WQBR679, Assigned Frequencies: 18040.0 MHz, 18080.0 MHz, Grant Date: 12/01/2004, Expiration Date: 12/01/2014, Cancellation Date: 01/19/2007, Certifier: Eric M Botto, Registrant: Fibertower Corporation, 1730 Rhode Island Avenue N.W., Suite 317, Washington, DC 20036, Phone: (703) 873-4175, Fax: (202) 315-3415, Email:
DLS0625, 8112 Green Valley Dr (Lat: 32.888889 Lon: -97.204278), Type: Pole, Structure height: 36.6 m, Call Sign: WQBR734, Licensee ID: L01728370, Assigned Frequencies: 19440.0 MHz, 21925.0 MHz, 11285.0 MHz, Grant Date: 12/01/2004, Expiration Date: 12/01/2014, Cancellation Date: 09/13/2013, Certifier: Joseph M Sandri Jr., Registrant: Fibertower Network Services, Corp., Debtor-In-Possession, 1875 Eye Street, Nw, 5th Floor, Room 505, Washington, DC 20006, Phone: (202) 223-1028, Email:
TX-DAL5808D, Campus Drive & Airport Fwy (Lat: 32.839778 Lon: -97.190833), Type: Bant, Structure height: 35.5 m, Overall height: 38 m, Call Sign: WQLD681, Assigned Frequencies: 19375.0 MHz, 19375.0 MHz, 21875.0 MHz, 19475.0 MHz, 19475.0 MHz, Grant Date: 02/04/2020, Expiration Date: 12/15/2029, Cancellation Date: 09/08/2021, Certifier: Nadja S Sodos-Wallace, Registrant: T-Mobile Usa, Inc., 12920 Se 38th Street, Bellevue, WA 98006, Phone: (425) 383-8401, Fax: (425) 383-4840, Email:
TX-DAL6457A, 7258 Midway Rd (Lat: 32.794417 Lon: -97.222417), Type: Upole, Structure height: 29 m, Call Sign: WQLF322, Assigned Frequencies: 21925.0 MHz, Grant Date: 01/05/2010, Expiration Date: 01/05/2020, Cancellation Date: 12/27/2019, Certifier: Nadja S Sodos-Wallace, Registrant: Sprint Corporation, 12502 Sunrise Valley Drive, M/S: Varesa, Reston, VA 20196, Phone: (800) 572-8256, Fax: (703) 433-4483, Email:
STATION, Belton St At Handley Ederville Rd (Lat: 32.796500 Lon: -97.223889), Structure height: 6.1 m, Overall height: 15.2 m, Call Sign: WHK668, Assigned Frequencies: 22125.0 MHz, 18690.0 MHz, Grant Date: 04/05/1994, Expiration Date: 04/05/1999, Phone: (817) 280-2011 FCC Registered Amateur Radio Licenses: 112 (
See the full list of FCC Registered Amateur Radio Licenses in Richland Hills )
FAA Registered Aircraft Manufacturers and Dealers: 2 (
See the full list of FAA Registered Manufacturers and Dealers in Richland Hills )
FAA Registered Aircraft: 30 (
See the full list of FAA Registered Aircraft )
Home Mortgage Disclosure Act Aggregated Statistics For Year 2009(Based on 2 full tracts) A) FHA, FSA/RHS & VA B) Conventional C) Refinancings D) Home Improvement Loans F) Non-occupant Loans on Number Average Value Number Average Value Number Average Value Number Average Value Number Average Value
LOANS ORIGINATED 40 $120,197 36 $113,142 44 $104,866 8 $38,020 11 $59,036 APPLICATIONS APPROVED, NOT ACCEPTED 3 $74,443 2 $33,765 6 $62,242 0 $0 1 $50,310 APPLICATIONS DENIED 9 $103,489 6 $79,865 28 $83,985 19 $31,863 1 $99,630 APPLICATIONS WITHDRAWN 7 $101,143 5 $163,270 19 $93,682 6 $26,767 2 $55,770 FILES CLOSED FOR INCOMPLETENESS 4 $68,968 0 $0 4 $78,342 3 $33,100 0 $0
Aggregated Statistics For Year 2008(Based on 2 full tracts) A) FHA, FSA/RHS & VA B) Conventional C) Refinancings D) Home Improvement Loans F) Non-occupant Loans on G) Loans On Manufactured Number Average Value Number Average Value Number Average Value Number Average Value Number Average Value Number Average Value
LOANS ORIGINATED 40 $103,991 53 $88,768 37 $80,905 15 $23,465 30 $73,999 0 $0 APPLICATIONS APPROVED, NOT ACCEPTED 6 $96,587 3 $62,417 7 $86,251 6 $9,357 3 $62,417 0 $0 APPLICATIONS DENIED 9 $108,520 17 $90,967 55 $101,917 36 $33,796 10 $80,866 1 $34,520 APPLICATIONS WITHDRAWN 5 $94,100 7 $97,797 20 $101,834 4 $36,695 6 $73,063 0 $0 FILES CLOSED FOR INCOMPLETENESS 2 $62,185 2 $106,040 9 $102,102 4 $31,985 0 $0 0 $0
Aggregated Statistics For Year 2007(Based on 2 full tracts) A) FHA, FSA/RHS & VA B) Conventional C) Refinancings D) Home Improvement Loans E) Loans on Dwellings For 5+ Families F) Non-occupant Loans on G) Loans On Manufactured Number Average Value Number Average Value Number Average Value Number Average Value Number Average Value Number Average Value Number Average Value
LOANS ORIGINATED 25 $102,088 120 $83,487 51 $101,284 23 $35,207 1 $2,009,070 40 $73,614 0 $0 APPLICATIONS APPROVED, NOT ACCEPTED 1 $89,760 17 $72,832 15 $93,103 7 $19,541 0 $0 3 $69,980 1 $23,920 APPLICATIONS DENIED 7 $105,284 41 $87,322 82 $96,877 31 $32,340 0 $0 17 $70,936 3 $51,343 APPLICATIONS WITHDRAWN 1 $74,620 14 $99,221 43 $95,937 3 $80,557 0 $0 6 $111,560 0 $0 FILES CLOSED FOR INCOMPLETENESS 0 $0 6 $109,045 11 $98,863 3 $37,410 0 $0 1 $130,200 0 $0
Aggregated Statistics For Year 2006(Based on 2 full tracts) A) FHA, FSA/RHS & VA B) Conventional C) Refinancings D) Home Improvement Loans E) Loans on Dwellings For 5+ Families F) Non-occupant Loans on G) Loans On Manufactured Number Average Value Number Average Value Number Average Value Number Average Value Number Average Value Number Average Value Number Average Value
LOANS ORIGINATED 17 $104,155 142 $74,319 56 $87,464 24 $37,619 1 $538,620 43 $70,410 1 $76,540 APPLICATIONS APPROVED, NOT ACCEPTED 2 $98,500 28 $69,577 14 $79,102 9 $35,001 0 $0 11 $66,625 2 $26,860 APPLICATIONS DENIED 1 $119,350 41 $69,714 74 $82,565 38 $26,970 0 $0 13 $57,952 1 $18,180 APPLICATIONS WITHDRAWN 3 $64,450 29 $72,747 65 $93,374 10 $43,301 1 $1,435,050 10 $56,439 0 $0 FILES CLOSED FOR INCOMPLETENESS 1 $132,020 14 $78,472 19 $88,267 1 $51,660 0 $0 0 $0 0 $0
Aggregated Statistics For Year 2005(Based on 2 full tracts) A) FHA, FSA/RHS & VA B) Conventional C) Refinancings D) Home Improvement Loans E) Loans on Dwellings For 5+ Families F) Non-occupant Loans on G) Loans On Manufactured Number Average Value Number Average Value Number Average Value Number Average Value Number Average Value Number Average Value Number Average Value
LOANS ORIGINATED 20 $100,269 113 $76,224 106 $82,383 35 $59,231 1 $493,200 37 $77,223 0 $0 APPLICATIONS APPROVED, NOT ACCEPTED 0 $0 18 $63,809 18 $80,003 4 $36,725 0 $0 1 $63,140 0 $0 APPLICATIONS DENIED 3 $84,703 28 $68,684 95 $85,618 26 $36,088 0 $0 14 $67,519 4 $62,990 APPLICATIONS WITHDRAWN 1 $84,190 21 $78,705 92 $93,141 8 $239,231 0 $0 8 $55,765 0 $0 FILES CLOSED FOR INCOMPLETENESS 0 $0 2 $79,425 32 $87,459 2 $17,700 0 $0 2 $70,040 0 $0
Aggregated Statistics For Year 2004(Based on 2 full tracts) A) FHA, FSA/RHS & VA B) Conventional C) Refinancings D) Home Improvement Loans E) Loans on Dwellings For 5+ Families F) Non-occupant Loans on G) Loans On Manufactured Number Average Value Number Average Value Number Average Value Number Average Value Number Average Value Number Average Value Number Average Value
LOANS ORIGINATED 41 $92,676 121 $86,417 151 $76,451 19 $43,091 3 $827,147 27 $86,054 0 $0 APPLICATIONS APPROVED, NOT ACCEPTED 2 $52,140 19 $63,283 28 $60,700 5 $24,106 1 $710,210 5 $68,100 1 $46,880 APPLICATIONS DENIED 5 $88,994 46 $81,141 137 $77,260 39 $26,436 0 $0 13 $79,360 5 $44,008 APPLICATIONS WITHDRAWN 8 $113,340 16 $87,014 87 $85,139 1 $66,090 0 $0 5 $96,036 0 $0 FILES CLOSED FOR INCOMPLETENESS 1 $87,790 4 $65,140 37 $85,634 1 $52,620 0 $0 4 $92,872 0 $0
Aggregated Statistics For Year 2003(Based on 2 full tracts) A) FHA, FSA/RHS & VA B) Conventional C) Refinancings D) Home Improvement Loans F) Non-occupant Loans on Number Average Value Number Average Value Number Average Value Number Average Value Number Average Value
LOANS ORIGINATED 48 $106,448 111 $91,309 301 $75,418 17 $25,263 30 $72,638 APPLICATIONS APPROVED, NOT ACCEPTED 3 $110,203 18 $109,967 42 $74,291 5 $33,484 3 $82,110 APPLICATIONS DENIED 7 $107,944 45 $72,031 146 $72,063 23 $27,610 16 $60,201 APPLICATIONS WITHDRAWN 15 $98,865 21 $91,964 113 $78,773 2 $22,195 2 $80,295 FILES CLOSED FOR INCOMPLETENESS 1 $137,760 9 $66,531 16 $84,358 1 $21,050 2 $49,270
Aggregated Statistics For Year 2002(Based on 2 full tracts) A) FHA, FSA/RHS & VA B) Conventional C) Refinancings D) Home Improvement Loans E) Loans on Dwellings For 5+ Families F) Non-occupant Loans on Number Average Value Number Average Value Number Average Value Number Average Value Number Average Value Number Average Value
LOANS ORIGINATED 65 $99,066 102 $75,922 151 $72,375 20 $20,312 1 $229,610 30 $75,114 APPLICATIONS APPROVED, NOT ACCEPTED 0 $0 11 $64,940 27 $66,902 10 $15,353 0 $0 5 $58,908 APPLICATIONS DENIED 3 $126,283 29 $77,579 62 $63,016 29 $22,390 1 $1,479,600 2 $52,405 APPLICATIONS WITHDRAWN 7 $103,871 22 $88,755 65 $75,404 2 $62,635 0 $0 6 $45,503 FILES CLOSED FOR INCOMPLETENESS 3 $76,270 8 $67,011 17 $85,532 0 $0 1 $2,870,100 0 $0
Aggregated Statistics For Year 2001(Based on 2 full tracts) A) FHA, FSA/RHS & VA B) Conventional C) Refinancings D) Home Improvement Loans E) Loans on Dwellings For 5+ Families F) Non-occupant Loans on Number Average Value Number Average Value Number Average Value Number Average Value Number Average Value Number Average Value
LOANS ORIGINATED 75 $92,819 84 $68,228 93 $64,463 31 $19,936 1 $3,109,280 19 $59,564 APPLICATIONS APPROVED, NOT ACCEPTED 2 $84,670 10 $58,440 14 $54,601 12 $26,238 0 $0 1 $14,350 APPLICATIONS DENIED 2 $90,750 32 $53,846 64 $52,628 25 $12,807 1 $3,348,450 8 $75,225 APPLICATIONS WITHDRAWN 3 $63,460 11 $73,490 43 $64,937 3 $10,093 0 $0 4 $83,990 FILES CLOSED FOR INCOMPLETENESS 1 $53,580 3 $44,007 18 $62,716 0 $0 0 $0 2 $45,620
Aggregated Statistics For Year 2000(Based on 2 full tracts) A) FHA, FSA/RHS & VA B) Conventional C) Refinancings D) Home Improvement Loans F) Non-occupant Loans on Number Average Value Number Average Value Number Average Value Number Average Value Number Average Value
LOANS ORIGINATED 86 $90,632 72 $68,421 33 $58,650 22 $17,883 9 $63,051 APPLICATIONS APPROVED, NOT ACCEPTED 6 $81,558 9 $63,203 10 $43,770 8 $21,571 3 $58,510 APPLICATIONS DENIED 2 $53,810 24 $49,921 26 $49,102 15 $22,933 1 $14,350 APPLICATIONS WITHDRAWN 3 $85,140 9 $97,583 15 $75,472 0 $0 0 $0 FILES CLOSED FOR INCOMPLETENESS 0 $0 4 $52,770 12 $56,571 0 $0 0 $0
Aggregated Statistics For Year 1999(Based on 2 full tracts) A) FHA, FSA/RHS & VA B) Conventional C) Refinancings D) Home Improvement Loans E) Loans on Dwellings For 5+ Families F) Non-occupant Loans on Number Average Value Number Average Value Number Average Value Number Average Value Number Average Value Number Average Value
LOANS ORIGINATED 67 $79,740 61 $74,074 91 $56,696 32 $25,836 1 $1,247,320 21 $70,616 APPLICATIONS APPROVED, NOT ACCEPTED 4 $63,070 17 $64,665 19 $54,247 10 $32,687 0 $0 4 $54,902 APPLICATIONS DENIED 6 $76,778 64 $51,474 31 $39,795 22 $14,656 0 $0 12 $51,688 APPLICATIONS WITHDRAWN 7 $74,220 18 $59,557 32 $55,642 2 $28,045 0 $0 5 $66,232 FILES CLOSED FOR INCOMPLETENESS 1 $47,530 1 $33,270 20 $59,983 3 $16,767 0 $0 2 $55,175
Detailed HMDA statistics for the following Tracts:
1133.01
, 1133.02
Private Mortgage Insurance Companies Aggregated Statistics For Year 2009(Based on 2 full tracts) A) Conventional B) Refinancings Number Average Value Number Average Value
LOANS ORIGINATED 9 $124,171 1 $97,580 APPLICATIONS APPROVED, NOT ACCEPTED 1 $176,570 1 $98,540 APPLICATIONS DENIED 2 $121,325 1 $95,670 APPLICATIONS WITHDRAWN 1 $115,410 0 $0 FILES CLOSED FOR INCOMPLETENESS 1 $46,880 0 $0
Aggregated Statistics For Year 2008(Based on 2 full tracts) A) Conventional B) Refinancings C) Non-occupant Loans on Number Average Value Number Average Value Number Average Value
LOANS ORIGINATED 23 $107,560 4 $103,818 5 $105,686 APPLICATIONS APPROVED, NOT ACCEPTED 4 $88,175 2 $145,325 2 $104,390 APPLICATIONS DENIED 4 $80,968 0 $0 2 $72,005 APPLICATIONS WITHDRAWN 2 $150,920 0 $0 0 $0 FILES CLOSED FOR INCOMPLETENESS 3 $106,530 1 $78,450 2 $98,640
Aggregated Statistics For Year 2007(Based on 2 full tracts) A) Conventional B) Refinancings C) Non-occupant Loans on Number Average Value Number Average Value Number Average Value
LOANS ORIGINATED 50 $98,018 2 $117,380 7 $78,849 APPLICATIONS APPROVED, NOT ACCEPTED 11 $97,146 0 $0 2 $83,350 APPLICATIONS DENIED 3 $83,843 0 $0 1 $92,720 APPLICATIONS WITHDRAWN 0 $0 0 $0 0 $0 FILES CLOSED FOR INCOMPLETENESS 0 $0 0 $0 0 $0
Aggregated Statistics For Year 2006(Based on 2 full tracts) A) Conventional B) Refinancings C) Non-occupant Loans on Number Average Value Number Average Value Number Average Value
LOANS ORIGINATED 20 $90,034 2 $96,625 5 $66,046 APPLICATIONS APPROVED, NOT ACCEPTED 1 $123,300 3 $67,683 0 $0 APPLICATIONS DENIED 0 $0 0 $0 0 $0 APPLICATIONS WITHDRAWN 1 $176,570 0 $0 0 $0 FILES CLOSED FOR INCOMPLETENESS 0 $0 0 $0 0 $0
Aggregated Statistics For Year 2005(Based on 2 full tracts) A) Conventional B) Refinancings C) Non-occupant Loans on Number Average Value Number Average Value Number Average Value
LOANS ORIGINATED 10 $86,327 4 $85,268 0 $0 APPLICATIONS APPROVED, NOT ACCEPTED 3 $102,913 0 $0 1 $130,200 APPLICATIONS DENIED 0 $0 0 $0 0 $0 APPLICATIONS WITHDRAWN 0 $0 0 $0 0 $0 FILES CLOSED FOR INCOMPLETENESS 0 $0 0 $0 0 $0
Aggregated Statistics For Year 2004(Based on 2 full tracts) A) Conventional B) Refinancings C) Non-occupant Loans on Number Average Value Number Average Value Number Average Value
LOANS ORIGINATED 31 $97,158 9 $86,018 4 $78,055 APPLICATIONS APPROVED, NOT ACCEPTED 4 $89,598 2 $121,005 0 $0 APPLICATIONS DENIED 0 $0 0 $0 0 $0 APPLICATIONS WITHDRAWN 1 $130,200 1 $71,750 1 $130,200 FILES CLOSED FOR INCOMPLETENESS 0 $0 0 $0 0 $0
Aggregated Statistics For Year 2003(Based on 2 full tracts) A) Conventional B) Refinancings C) Non-occupant Loans on Number Average Value Number Average Value Number Average Value
LOANS ORIGINATED 33 $120,887 20 $108,002 3 $70,457 APPLICATIONS APPROVED, NOT ACCEPTED 2 $121,865 8 $107,722 1 $54,530 APPLICATIONS DENIED 1 $88,970 0 $0 0 $0 APPLICATIONS WITHDRAWN 1 $136,810 2 $86,930 0 $0 FILES CLOSED FOR INCOMPLETENESS 0 $0 0 $0 0 $0
Aggregated Statistics For Year 2002(Based on 2 full tracts) A) Conventional B) Refinancings C) Non-occupant Loans on Number Average Value Number Average Value Number Average Value
LOANS ORIGINATED 36 $88,801 9 $88,151 10 $82,279 APPLICATIONS APPROVED, NOT ACCEPTED 1 $81,870 2 $96,200 0 $0 APPLICATIONS DENIED 0 $0 0 $0 0 $0 APPLICATIONS WITHDRAWN 2 $51,355 0 $0 0 $0 FILES CLOSED FOR INCOMPLETENESS 0 $0 0 $0 0 $0
Aggregated Statistics For Year 2001(Based on 2 full tracts) A) Conventional B) Refinancings C) Non-occupant Loans on Number Average Value Number Average Value Number Average Value
LOANS ORIGINATED 26 $86,308 3 $109,490 3 $59,750 APPLICATIONS APPROVED, NOT ACCEPTED 0 $0 1 $33,480 1 $33,480 APPLICATIONS DENIED 1 $68,060 0 $0 0 $0 APPLICATIONS WITHDRAWN 0 $0 1 $121,330 0 $0 FILES CLOSED FOR INCOMPLETENESS 0 $0 0 $0 0 $0
Aggregated Statistics For Year 2000(Based on 2 full tracts) A) Conventional B) Refinancings C) Non-occupant Loans on Number Average Value Number Average Value Number Average Value
LOANS ORIGINATED 15 $73,043 4 $62,400 2 $58,265 APPLICATIONS APPROVED, NOT ACCEPTED 1 $50,710 1 $44,960 0 $0 APPLICATIONS DENIED 1 $47,840 0 $0 0 $0 APPLICATIONS WITHDRAWN 2 $56,720 0 $0 0 $0 FILES CLOSED FOR INCOMPLETENESS 0 $0 0 $0 0 $0
Aggregated Statistics For Year 1999(Based on 2 full tracts) A) Conventional B) Refinancings C) Non-occupant Loans on Number Average Value Number Average Value Number Average Value
LOANS ORIGINATED 17 $86,971 4 $55,935 3 $82,773 APPLICATIONS APPROVED, NOT ACCEPTED 0 $0 0 $0 0 $0 APPLICATIONS DENIED 0 $0 0 $0 0 $0 APPLICATIONS WITHDRAWN 1 $73,980 1 $36,020 1 $36,020 FILES CLOSED FOR INCOMPLETENESS 0 $0 0 $0 0 $0
Detailed PMIC statistics for the following Tracts:
1133.01
, 1133.02 Richland Hills compared to Texas state average:
Unemployed percentage significantly below state average. Black race population percentage significantly below state average. Median age significantly above state average. Foreign-born population percentage below state average. Length of stay since moving in significantly above state average. House age above state average. Richland Hills on our top lists :
#7 on the list of "Top 101 cities with the largest percentage of people in dormitories (population 1,000+)"
#7 on the list of "Top 101 cities with the largest percentage of people in group homes (population 1,000+)"
#7 on the list of "Top 101 cities with the largest percentage of people in hospitals/wards, hospices, and schools for the handicapped (population 1,000+)"
#7 on the list of "Top 101 cities with the largest percentage of people in long-term care (population 1,000+)"
#7 on the list of "Top 101 cities with the largest percentage of people in military quarters (population 1,000+)"
#7 on the list of "Top 101 cities with the largest percentage of people in noninstitutionalized settings (population 1,000+)"
#7 on the list of "Top 101 cities with the largest percentage of people in on base quarters (population 1,000+)"
#7 on the list of "Top 101 cities with the largest percentage of people in schools, hospitals, or wards for the physically handicapped (population 1,000+)"
#4 on the list of "Top 101 counties with the most Evangelical Protestant adherents"
#5 on the list of "Top 101 counties with the most Evangelical Protestant congregations"
#7 on the list of "Top 101 counties with the most Mainline Protestant adherents"
#13 on the list of "Top 101 counties with the most Black Protestant congregations"
#28 on the list of "Top 101 counties with the most Black Protestant adherents"
Top Patent Applicants
Kevin Le (14)
Andrew Thomas Carter (8)
Louis Edward Parkman, Iii (6)
Kevin D. Le (4)
Louis E. Parkman, Iii (3)
James M. Brown (3)
Matthew Weinrich (2)
Timothy Mcclellan Mosig (2)
Carl Edward Wells (2)
Michael L. Bowen (2)
Total of 49 patent applications in 2008-2024.
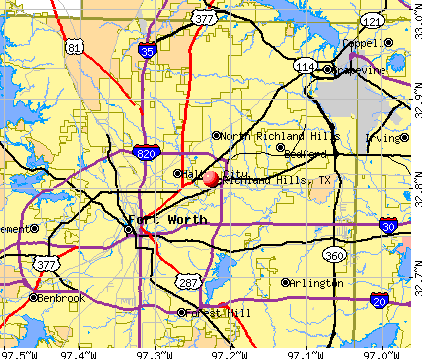


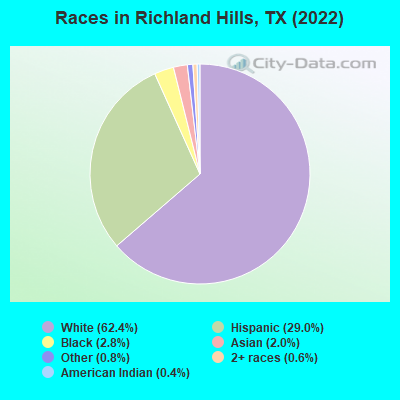
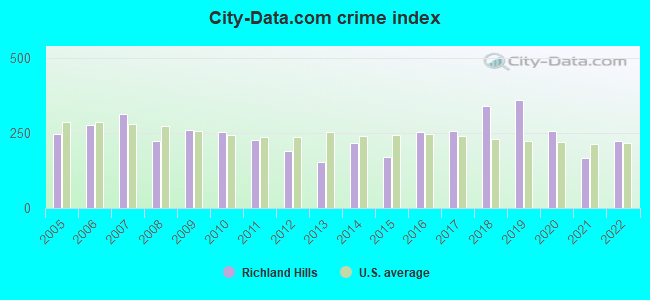
 Recent articles from our blog. Our writers, many of them Ph.D. graduates or candidates, create easy-to-read articles on a wide variety of topics.

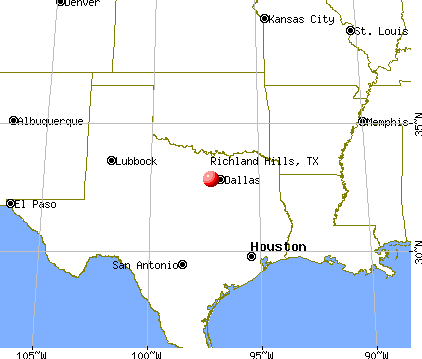
 (3.2 miles
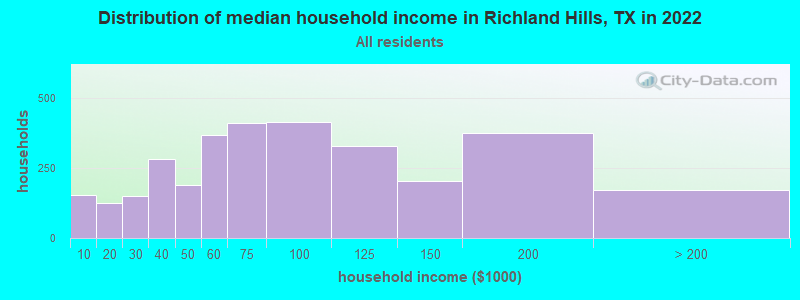
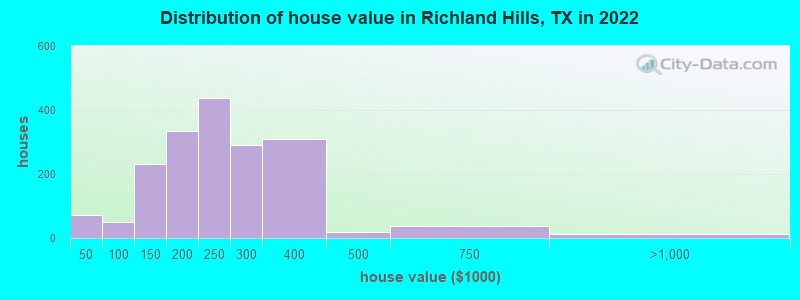
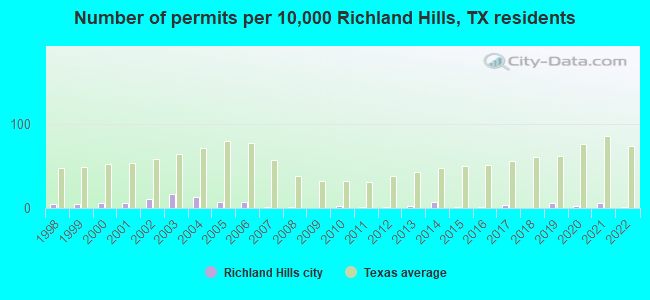
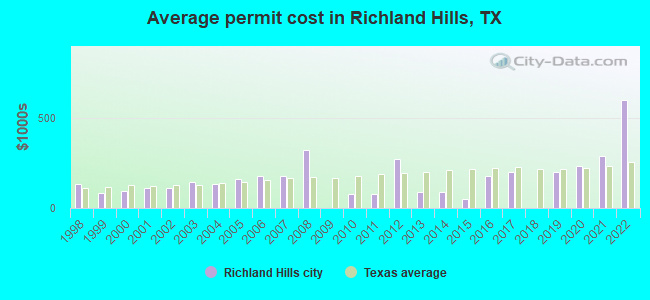
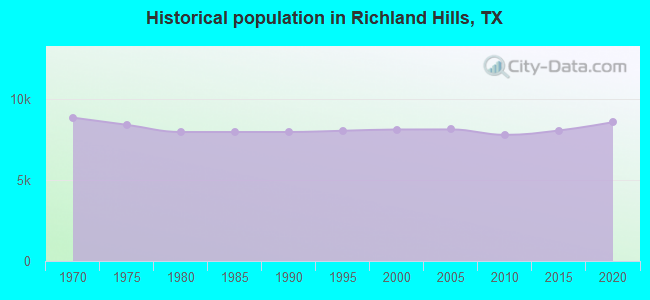
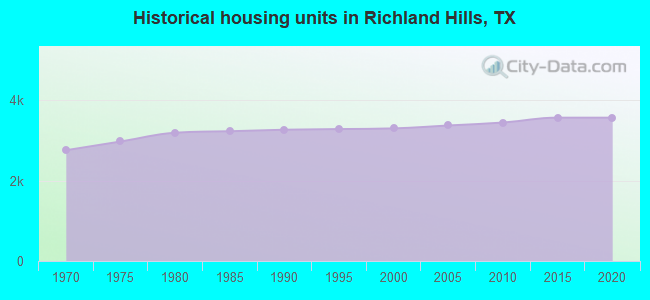
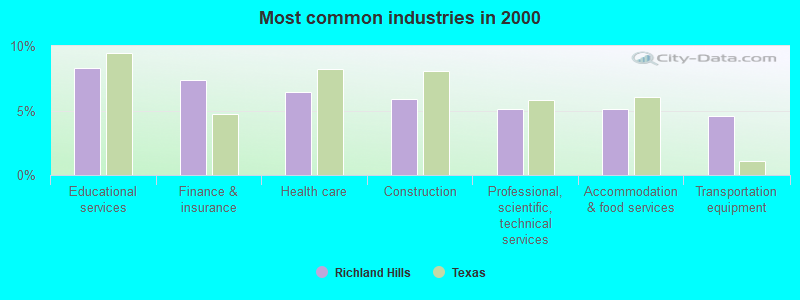
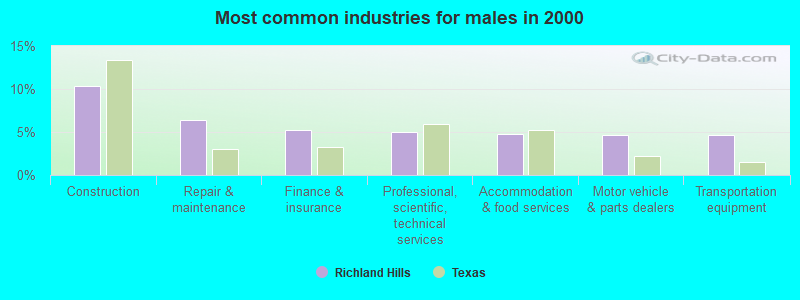
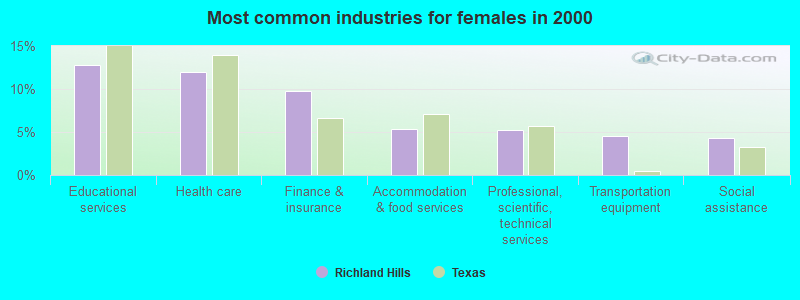
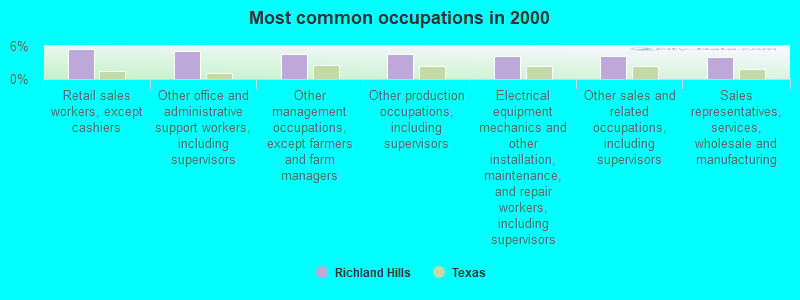
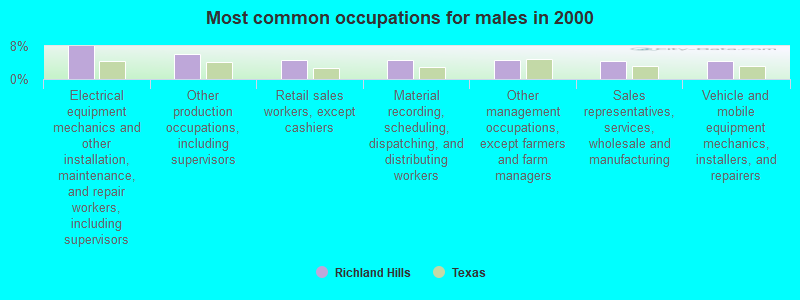
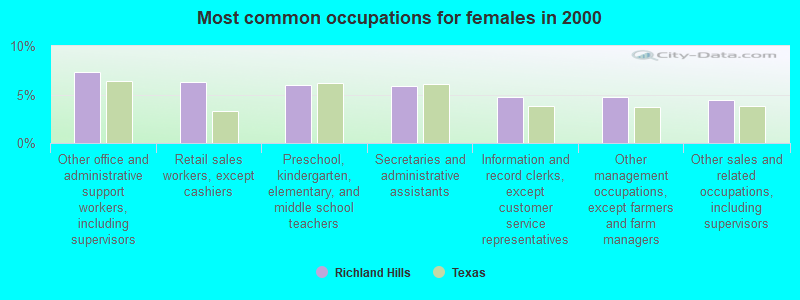
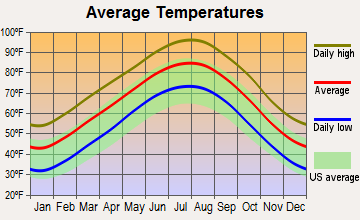
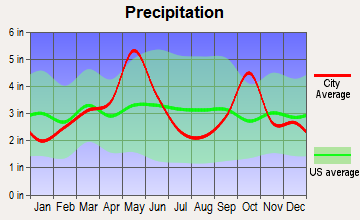
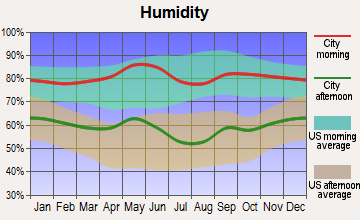
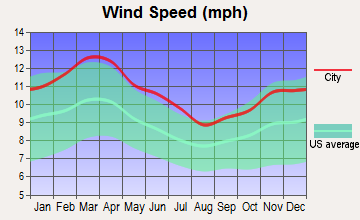
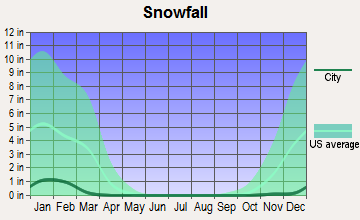
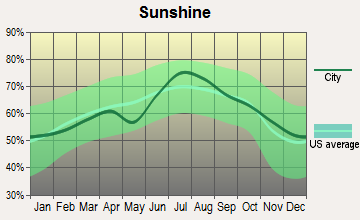
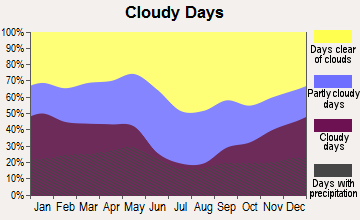
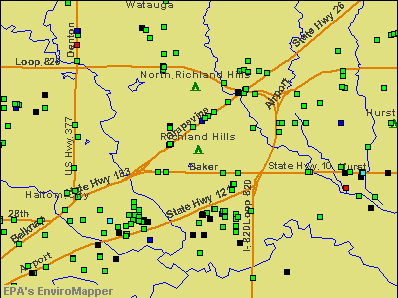

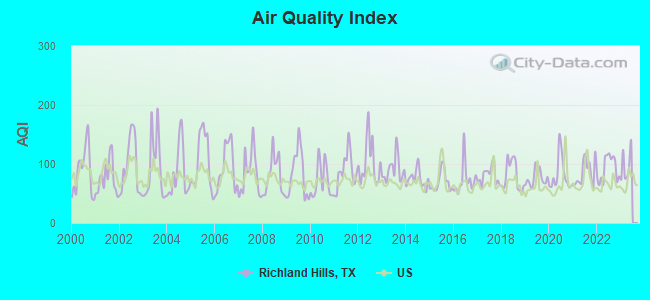
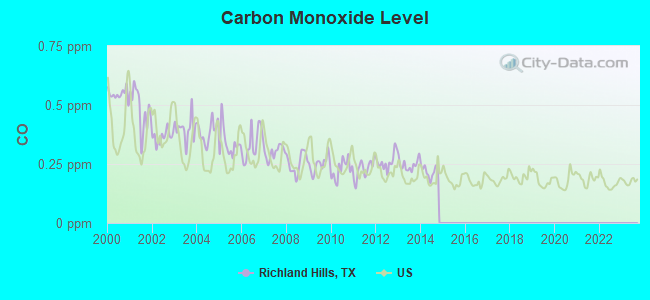
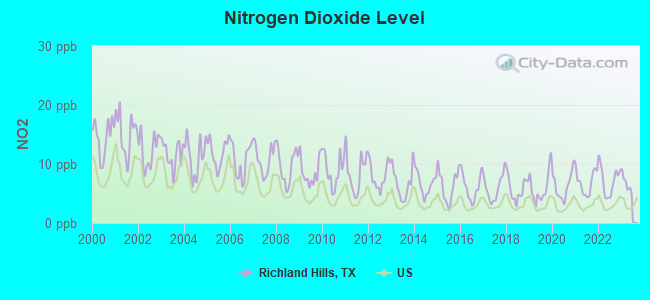
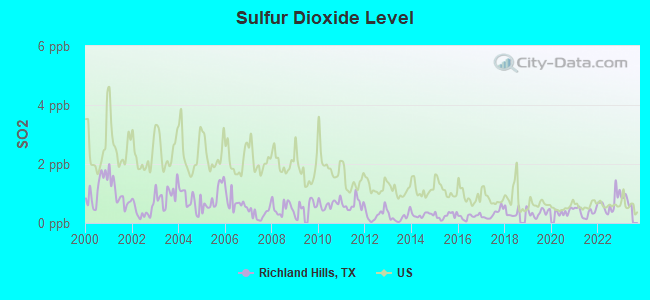
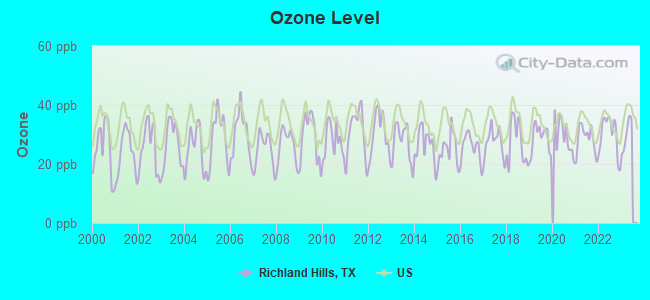
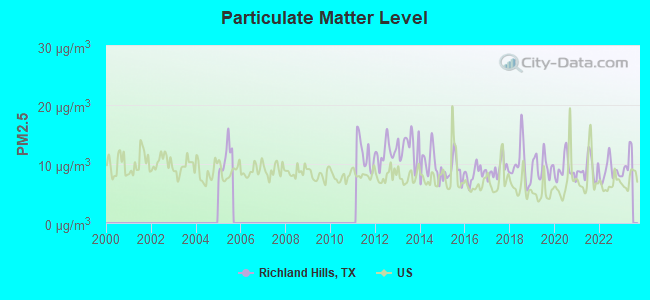
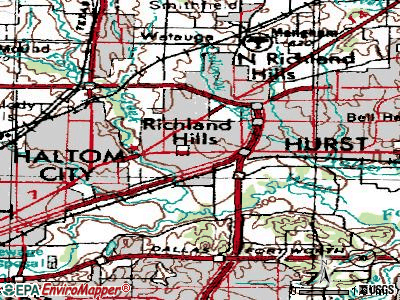
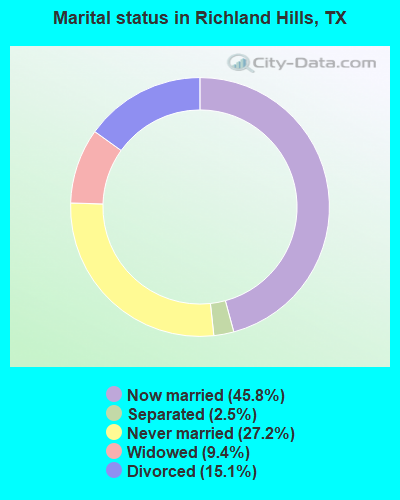
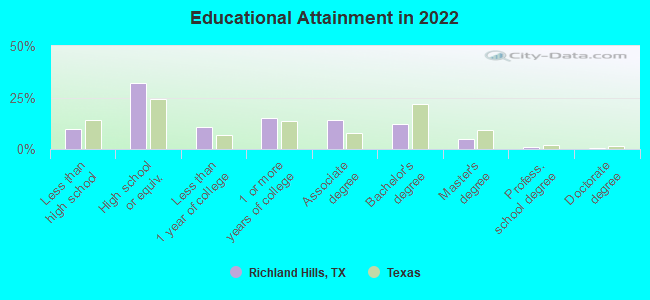
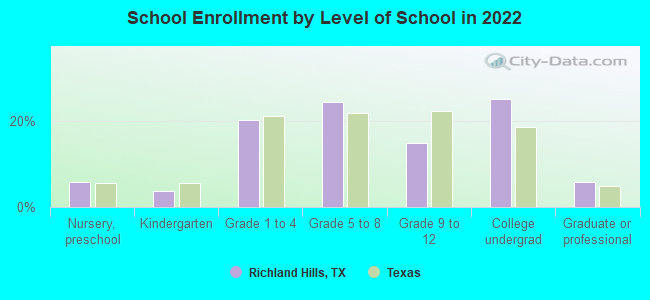
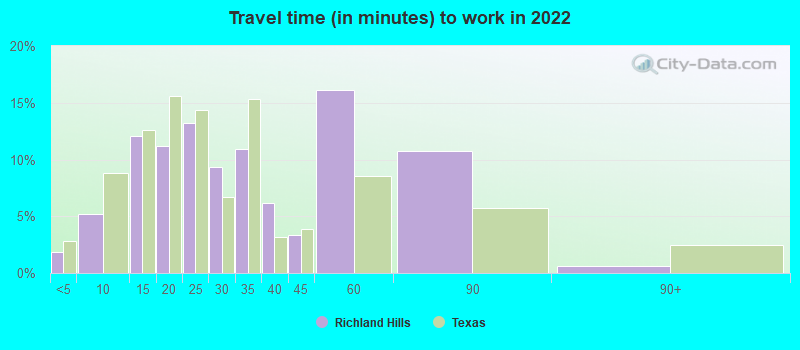
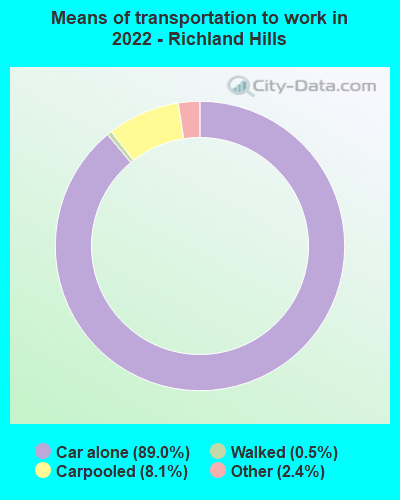
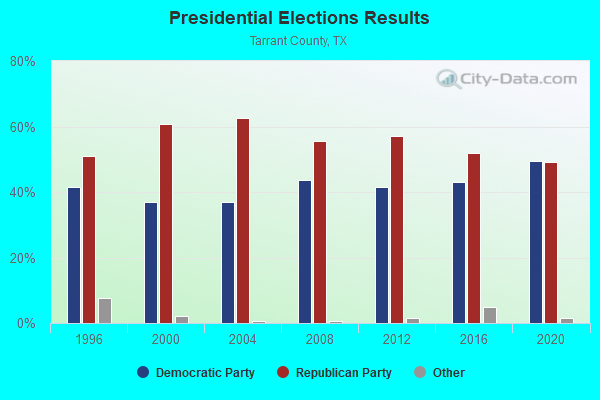
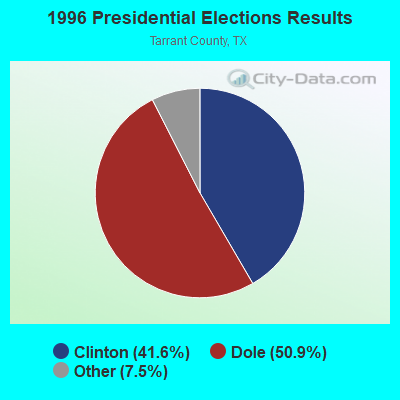
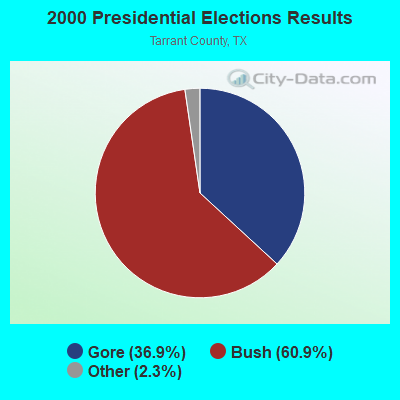
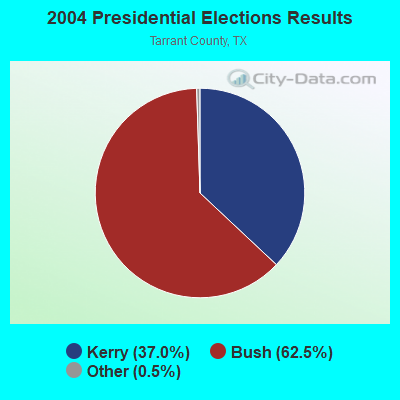
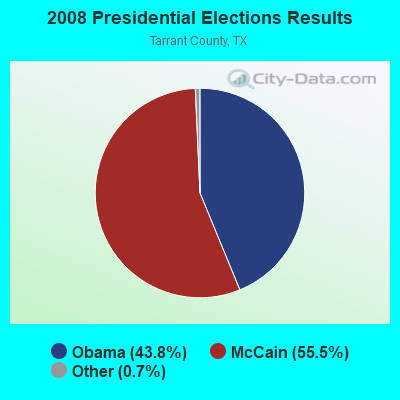
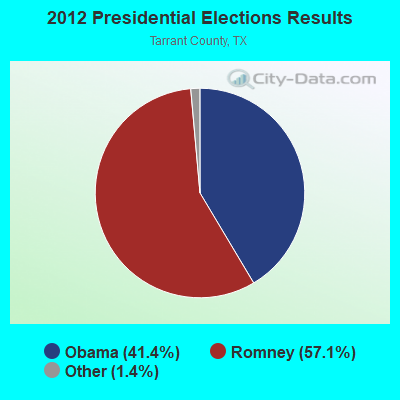
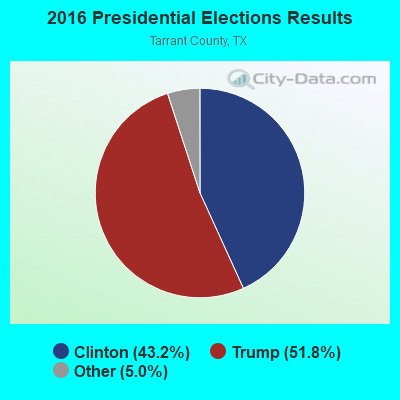
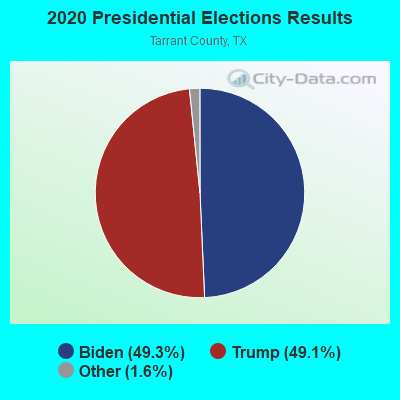
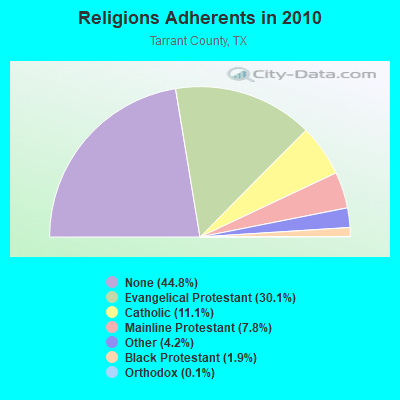
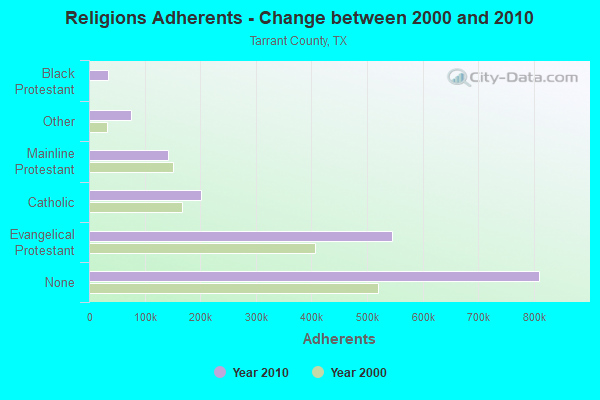
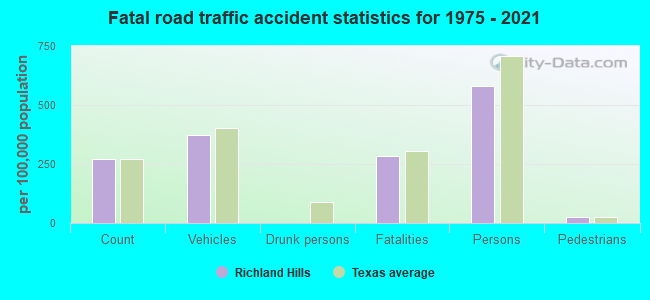
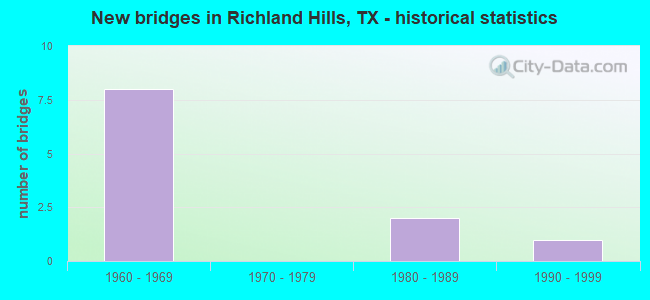
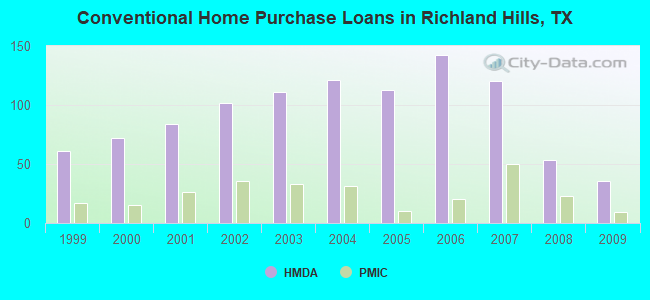
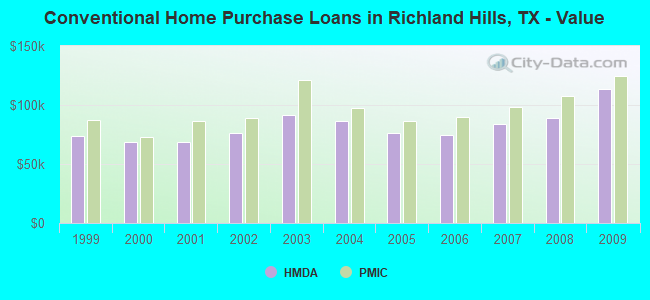
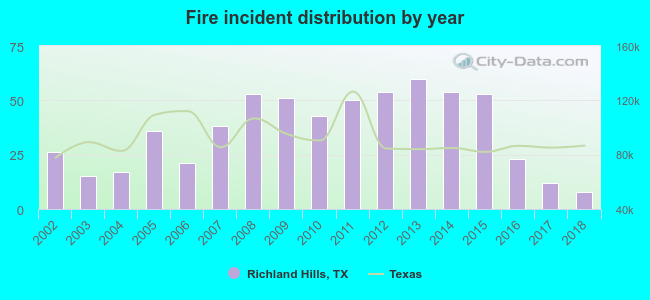 Based on the data from the years 2002 - 2018 the average number of fires per year is 36. The highest number of fires - 60 took place in 2013, and the least - 8 in 2018. The data has a decreasing trend.
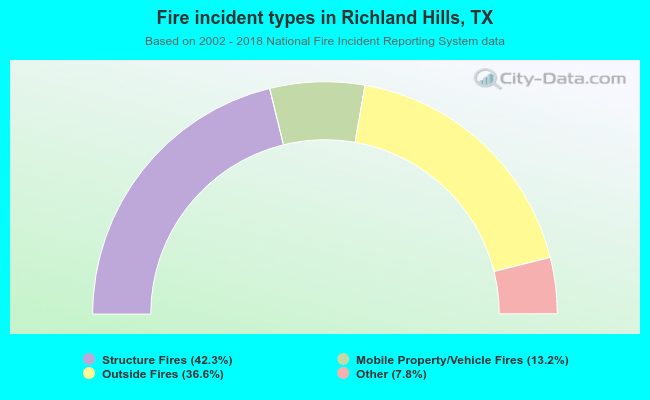 When looking into fire subcategories, the most incidents belonged to: Structure Fires (42.3%), and Outside Fires (36.6%).