Sahuarita, Arizona Submit your own pictures of this town and show them to the world
OSM Map
General Map
Google Map
MSN Map
OSM Map
General Map
Google Map
MSN Map
OSM Map
General Map
Google Map
MSN Map
OSM Map
General Map
Google Map
MSN Map
Please wait while loading the map...
Population in 2022: 35,638 (78% urban, 22% rural). Population change since 2000: +999.3%Males: 17,316 Females: 18,322
March 2022 cost of living index in Sahuarita: 91.3 (less than average, U.S. average is 100) Percentage of residents living in poverty in 2022: 8.1%for White Non-Hispanic residents , 4.4% for Black residents , 11.9% for Hispanic or Latino residents , 60.4% for American Indian residents , 5.0% for other race residents , 4.4% for two or more races residents )
Profiles of local businesses
Business Search - 14 Million verified businesses
Data:
Median household income ($)
Median household income (% change since 2000)
Household income diversity
Ratio of average income to average house value (%)
Ratio of average income to average rent
Median household income ($) - White
Median household income ($) - Black or African American
Median household income ($) - Asian
Median household income ($) - Hispanic or Latino
Median household income ($) - American Indian and Alaska Native
Median household income ($) - Multirace
Median household income ($) - Other Race
Median household income for houses/condos with a mortgage ($)
Median household income for apartments without a mortgage ($)
Races - White alone (%)
Races - White alone (% change since 2000)
Races - Black alone (%)
Races - Black alone (% change since 2000)
Races - American Indian alone (%)
Races - American Indian alone (% change since 2000)
Races - Asian alone (%)
Races - Asian alone (% change since 2000)
Races - Hispanic (%)
Races - Hispanic (% change since 2000)
Races - Native Hawaiian and Other Pacific Islander alone (%)
Races - Native Hawaiian and Other Pacific Islander alone (% change since 2000)
Races - Two or more races (%)
Races - Two or more races (% change since 2000)
Races - Other race alone (%)
Races - Other race alone (% change since 2000)
Racial diversity
Unemployment (%)
Unemployment (% change since 2000)
Unemployment (%) - White
Unemployment (%) - Black or African American
Unemployment (%) - Asian
Unemployment (%) - Hispanic or Latino
Unemployment (%) - American Indian and Alaska Native
Unemployment (%) - Multirace
Unemployment (%) - Other Race
Population density (people per square mile)
Population - Males (%)
Population - Females (%)
Population - Males (%) - White
Population - Males (%) - Black or African American
Population - Males (%) - Asian
Population - Males (%) - Hispanic or Latino
Population - Males (%) - American Indian and Alaska Native
Population - Males (%) - Multirace
Population - Males (%) - Other Race
Population - Females (%) - White
Population - Females (%) - Black or African American
Population - Females (%) - Asian
Population - Females (%) - Hispanic or Latino
Population - Females (%) - American Indian and Alaska Native
Population - Females (%) - Multirace
Population - Females (%) - Other Race
Coronavirus confirmed cases (Apr 27, 2024)
Deaths caused by coronavirus (Apr 27, 2024)
Coronavirus confirmed cases (per 100k population) (Apr 27, 2024)
Deaths caused by coronavirus (per 100k population) (Apr 27, 2024)
Daily increase in number of cases (Apr 27, 2024)
Weekly increase in number of cases (Apr 27, 2024)
Cases doubled (in days) (Apr 27, 2024)
Hospitalized patients (Apr 18, 2022)
Negative test results (Apr 18, 2022)
Total test results (Apr 18, 2022)
COVID Vaccine doses distributed (per 100k population) (Sep 19, 2023)
COVID Vaccine doses administered (per 100k population) (Sep 19, 2023)
COVID Vaccine doses distributed (Sep 19, 2023)
COVID Vaccine doses administered (Sep 19, 2023)
Likely homosexual households (%)
Likely homosexual households (% change since 2000)
Likely homosexual households - Lesbian couples (%)
Likely homosexual households - Lesbian couples (% change since 2000)
Likely homosexual households - Gay men (%)
Likely homosexual households - Gay men (% change since 2000)
Cost of living index
Median gross rent ($)
Median contract rent ($)
Median monthly housing costs ($)
Median house or condo value ($)
Median house or condo value ($ change since 2000)
Mean house or condo value by units in structure - 1, detached ($)
Mean house or condo value by units in structure - 1, attached ($)
Mean house or condo value by units in structure - 2 ($)
Mean house or condo value by units in structure by units in structure - 3 or 4 ($)
Mean house or condo value by units in structure - 5 or more ($)
Mean house or condo value by units in structure - Boat, RV, van, etc. ($)
Mean house or condo value by units in structure - Mobile home ($)
Median house or condo value ($) - White
Median house or condo value ($) - Black or African American
Median house or condo value ($) - Asian
Median house or condo value ($) - Hispanic or Latino
Median house or condo value ($) - American Indian and Alaska Native
Median house or condo value ($) - Multirace
Median house or condo value ($) - Other Race
Median resident age
Resident age diversity
Median resident age - Males
Median resident age - Females
Median resident age - White
Median resident age - Black or African American
Median resident age - Asian
Median resident age - Hispanic or Latino
Median resident age - American Indian and Alaska Native
Median resident age - Multirace
Median resident age - Other Race
Median resident age - Males - White
Median resident age - Males - Black or African American
Median resident age - Males - Asian
Median resident age - Males - Hispanic or Latino
Median resident age - Males - American Indian and Alaska Native
Median resident age - Males - Multirace
Median resident age - Males - Other Race
Median resident age - Females - White
Median resident age - Females - Black or African American
Median resident age - Females - Asian
Median resident age - Females - Hispanic or Latino
Median resident age - Females - American Indian and Alaska Native
Median resident age - Females - Multirace
Median resident age - Females - Other Race
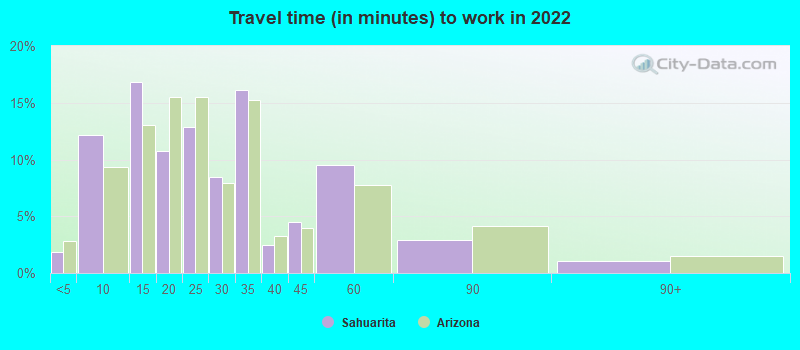
Commute - mean travel time to work (minutes)
Travel time to work - Less than 5 minutes (%)
Travel time to work - Less than 5 minutes (% change since 2000)
Travel time to work - 5 to 9 minutes (%)
Travel time to work - 5 to 9 minutes (% change since 2000)
Travel time to work - 10 to 19 minutes (%)
Travel time to work - 10 to 19 minutes (% change since 2000)
Travel time to work - 20 to 29 minutes (%)
Travel time to work - 20 to 29 minutes (% change since 2000)
Travel time to work - 30 to 39 minutes (%)
Travel time to work - 30 to 39 minutes (% change since 2000)
Travel time to work - 40 to 59 minutes (%)
Travel time to work - 40 to 59 minutes (% change since 2000)
Travel time to work - 60 to 89 minutes (%)
Travel time to work - 60 to 89 minutes (% change since 2000)
Travel time to work - 90 or more minutes (%)
Travel time to work - 90 or more minutes (% change since 2000)
Marital status - Never married (%)
Marital status - Now married (%)
Marital status - Separated (%)
Marital status - Widowed (%)
Marital status - Divorced (%)
Median family income ($)
Median family income (% change since 2000)
Median non-family income ($)
Median non-family income (% change since 2000)
Median per capita income ($)
Median per capita income (% change since 2000)
Median family income ($) - White
Median family income ($) - Black or African American
Median family income ($) - Asian
Median family income ($) - Hispanic or Latino
Median family income ($) - American Indian and Alaska Native
Median family income ($) - Multirace
Median family income ($) - Other Race
Median year house/condo built
Median year apartment built
Year house built - Built 2005 or later (%)
Year house built - Built 2000 to 2004 (%)
Year house built - Built 1990 to 1999 (%)
Year house built - Built 1980 to 1989 (%)
Year house built - Built 1970 to 1979 (%)
Year house built - Built 1960 to 1969 (%)
Year house built - Built 1950 to 1959 (%)
Year house built - Built 1940 to 1949 (%)
Year house built - Built 1939 or earlier (%)
Average household size
Household density (households per square mile)
Average household size - White
Average household size - Black or African American
Average household size - Asian
Average household size - Hispanic or Latino
Average household size - American Indian and Alaska Native
Average household size - Multirace
Average household size - Other Race
Occupied housing units (%)
Vacant housing units (%)
Owner occupied housing units (%)
Renter occupied housing units (%)
Vacancy status - For rent (%)
Vacancy status - For sale only (%)
Vacancy status - Rented or sold, not occupied (%)
Vacancy status - For seasonal, recreational, or occasional use (%)
Vacancy status - For migrant workers (%)
Vacancy status - Other vacant (%)
Residents with income below the poverty level (%)
Residents with income below 50% of the poverty level (%)
Children below poverty level (%)
Poor families by family type - Married-couple family (%)
Poor families by family type - Male, no wife present (%)
Poor families by family type - Female, no husband present (%)
Poverty status for native-born residents (%)
Poverty status for foreign-born residents (%)
Poverty among high school graduates not in families (%)
Poverty among people who did not graduate high school not in families (%)
Residents with income below the poverty level (%) - White
Residents with income below the poverty level (%) - Black or African American
Residents with income below the poverty level (%) - Asian
Residents with income below the poverty level (%) - Hispanic or Latino
Residents with income below the poverty level (%) - American Indian and Alaska Native
Residents with income below the poverty level (%) - Multirace
Residents with income below the poverty level (%) - Other Race
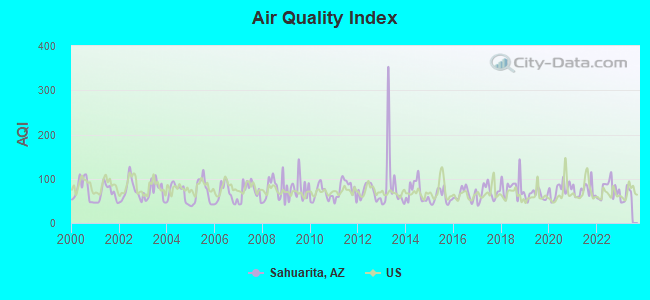
Air pollution - Air Quality Index (AQI)
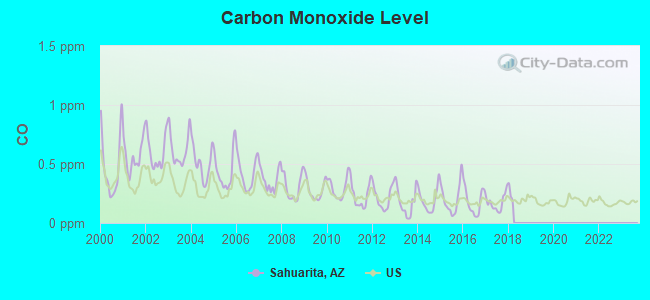
Air pollution - CO
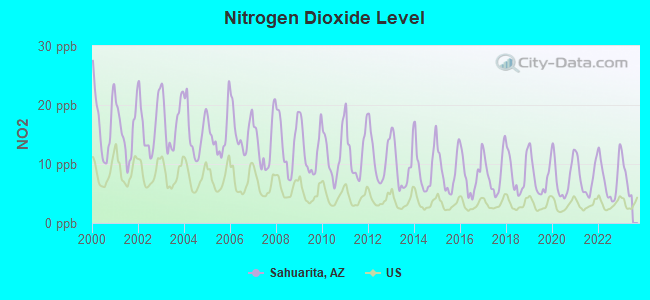
Air pollution - NO2
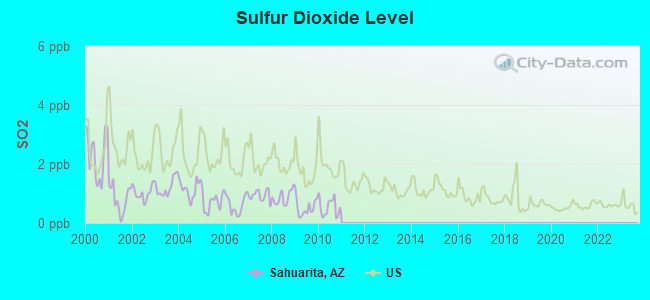
Air pollution - SO2
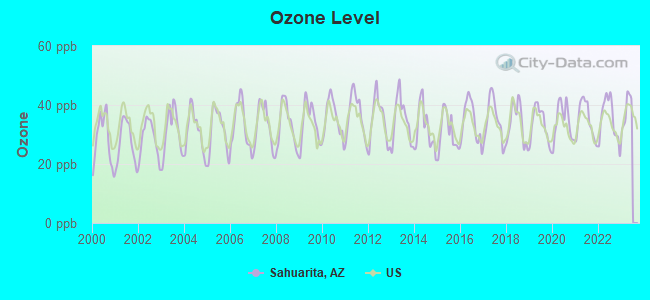
Air pollution - Ozone
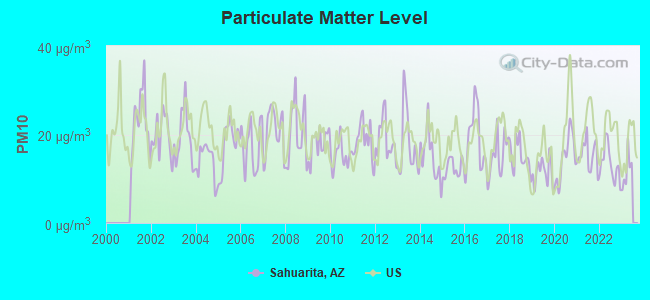
Air pollution - PM10
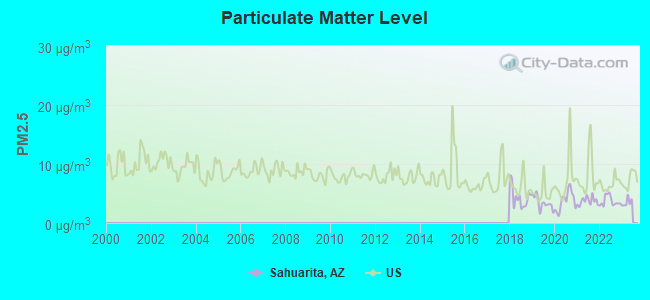
Air pollution - PM25
Air pollution - Pb
Crime - Murders per 100,000 population
Crime - Rapes per 100,000 population
Crime - Robberies per 100,000 population
Crime - Assaults per 100,000 population
Crime - Burglaries per 100,000 population
Crime - Thefts per 100,000 population
Crime - Auto thefts per 100,000 population
Crime - Arson per 100,000 population
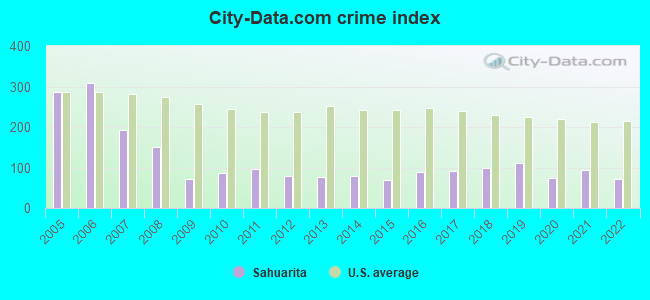
Crime - City-data.com crime index
Crime - Violent crime index
Crime - Property crime index
Crime - Murders per 100,000 population (5 year average)
Crime - Rapes per 100,000 population (5 year average)
Crime - Robberies per 100,000 population (5 year average)
Crime - Assaults per 100,000 population (5 year average)
Crime - Burglaries per 100,000 population (5 year average)
Crime - Thefts per 100,000 population (5 year average)
Crime - Auto thefts per 100,000 population (5 year average)
Crime - Arson per 100,000 population (5 year average)
Crime - City-data.com crime index (5 year average)
Crime - Violent crime index (5 year average)
Crime - Property crime index (5 year average)
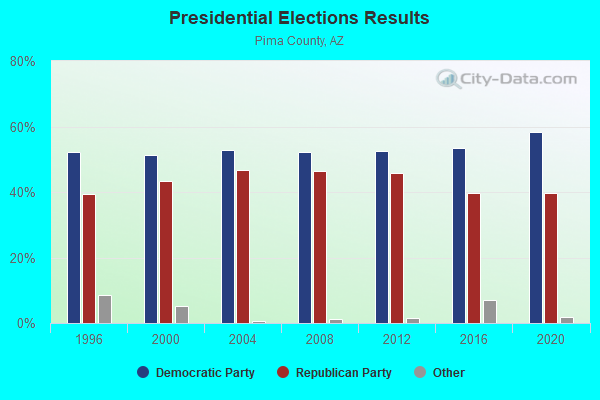
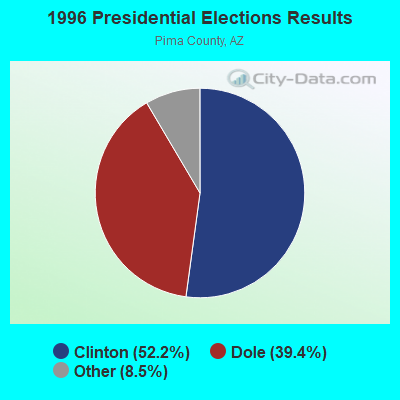
1996 Presidential Elections Results (%) - Democratic Party (Clinton)
1996 Presidential Elections Results (%) - Republican Party (Dole)
1996 Presidential Elections Results (%) - Other
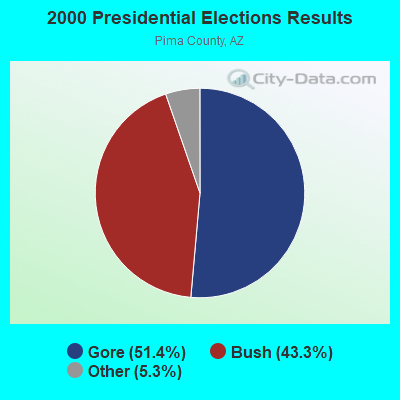
2000 Presidential Elections Results (%) - Democratic Party (Gore)
2000 Presidential Elections Results (%) - Republican Party (Bush)
2000 Presidential Elections Results (%) - Other
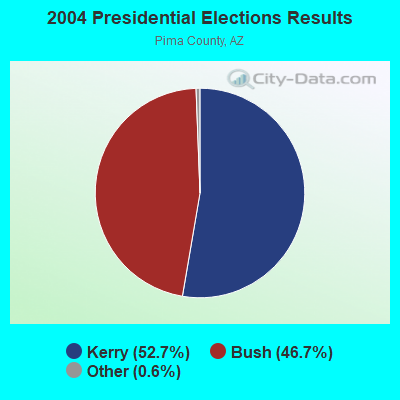
2004 Presidential Elections Results (%) - Democratic Party (Kerry)
2004 Presidential Elections Results (%) - Republican Party (Bush)
2004 Presidential Elections Results (%) - Other
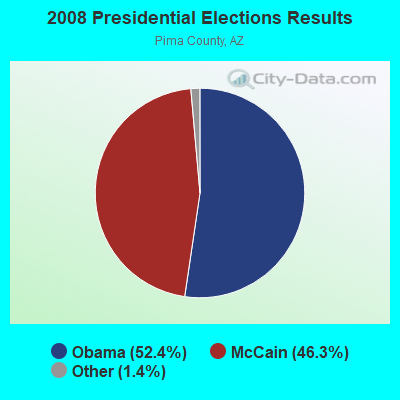
2008 Presidential Elections Results (%) - Democratic Party (Obama)
2008 Presidential Elections Results (%) - Republican Party (McCain)
2008 Presidential Elections Results (%) - Other
2012 Presidential Elections Results (%) - Democratic Party (Obama)
2012 Presidential Elections Results (%) - Republican Party (Romney)
2012 Presidential Elections Results (%) - Other
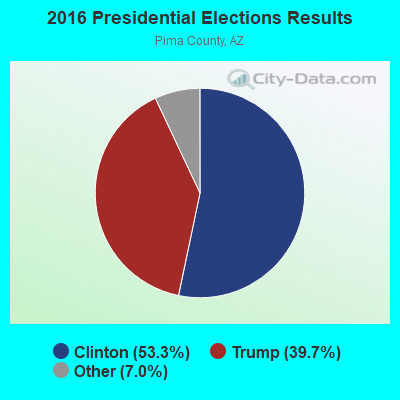
2016 Presidential Elections Results (%) - Democratic Party (Clinton)
2016 Presidential Elections Results (%) - Republican Party (Trump)
2016 Presidential Elections Results (%) - Other
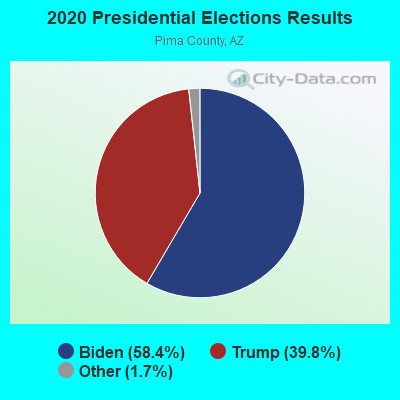
2020 Presidential Elections Results (%) - Democratic Party (Biden)
2020 Presidential Elections Results (%) - Republican Party (Trump)
2020 Presidential Elections Results (%) - Other
Ancestries Reported - Arab (%)
Ancestries Reported - Czech (%)
Ancestries Reported - Danish (%)
Ancestries Reported - Dutch (%)
Ancestries Reported - English (%)
Ancestries Reported - French (%)
Ancestries Reported - French Canadian (%)
Ancestries Reported - German (%)
Ancestries Reported - Greek (%)
Ancestries Reported - Hungarian (%)
Ancestries Reported - Irish (%)
Ancestries Reported - Italian (%)
Ancestries Reported - Lithuanian (%)
Ancestries Reported - Norwegian (%)
Ancestries Reported - Polish (%)
Ancestries Reported - Portuguese (%)
Ancestries Reported - Russian (%)
Ancestries Reported - Scotch-Irish (%)
Ancestries Reported - Scottish (%)
Ancestries Reported - Slovak (%)
Ancestries Reported - Subsaharan African (%)
Ancestries Reported - Swedish (%)
Ancestries Reported - Swiss (%)
Ancestries Reported - Ukrainian (%)
Ancestries Reported - United States (%)
Ancestries Reported - Welsh (%)
Ancestries Reported - West Indian (%)
Ancestries Reported - Other (%)
Educational Attainment - No schooling completed (%)
Educational Attainment - Less than high school (%)
Educational Attainment - High school or equivalent (%)
Educational Attainment - Less than 1 year of college (%)
Educational Attainment - 1 or more years of college (%)
Educational Attainment - Associate degree (%)
Educational Attainment - Bachelor's degree (%)
Educational Attainment - Master's degree (%)
Educational Attainment - Professional school degree (%)
Educational Attainment - Doctorate degree (%)
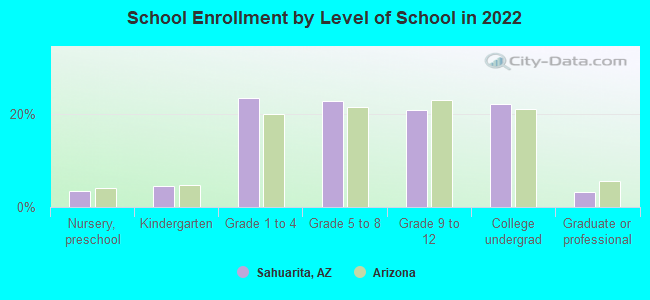
School Enrollment - Nursery, preschool (%)
School Enrollment - Kindergarten (%)
School Enrollment - Grade 1 to 4 (%)
School Enrollment - Grade 5 to 8 (%)
School Enrollment - Grade 9 to 12 (%)
School Enrollment - College undergrad (%)
School Enrollment - Graduate or professional (%)
School Enrollment - Not enrolled in school (%)
School enrollment - Public schools (%)
School enrollment - Private schools (%)
School enrollment - Not enrolled (%)
Median number of rooms in houses and condos
Median number of rooms in apartments
Housing units lacking complete plumbing facilities (%)
Housing units lacking complete kitchen facilities (%)
Density of houses
Urban houses (%)
Rural houses (%)
Households with people 60 years and over (%)
Households with people 65 years and over (%)
Households with people 75 years and over (%)
Households with one or more nonrelatives (%)
Households with no nonrelatives (%)
Population in households (%)
Family households (%)
Nonfamily households (%)
Population in families (%)
Family households with own children (%)
Median number of bedrooms in owner occupied houses
Mean number of bedrooms in owner occupied houses
Median number of bedrooms in renter occupied houses
Mean number of bedrooms in renter occupied houses
Median number of vehichles in owner occupied houses
Mean number of vehichles in owner occupied houses
Median number of vehichles in renter occupied houses
Mean number of vehichles in renter occupied houses
Mortgage status - with mortgage (%)
Mortgage status - with second mortgage (%)
Mortgage status - with home equity loan (%)
Mortgage status - with both second mortgage and home equity loan (%)
Mortgage status - without a mortgage (%)
Average family size
Average family size - White
Average family size - Black or African American
Average family size - Asian
Average family size - Hispanic or Latino
Average family size - American Indian and Alaska Native
Average family size - Multirace
Average family size - Other Race
Geographical mobility - Same house 1 year ago (%)
Geographical mobility - Moved within same county (%)
Geographical mobility - Moved from different county within same state (%)
Geographical mobility - Moved from different state (%)
Geographical mobility - Moved from abroad (%)
Place of birth - Born in state of residence (%)
Place of birth - Born in other state (%)
Place of birth - Native, outside of US (%)
Place of birth - Foreign born (%)
Housing units in structures - 1, detached (%)
Housing units in structures - 1, attached (%)
Housing units in structures - 2 (%)
Housing units in structures - 3 or 4 (%)
Housing units in structures - 5 to 9 (%)
Housing units in structures - 10 to 19 (%)
Housing units in structures - 20 to 49 (%)
Housing units in structures - 50 or more (%)
Housing units in structures - Mobile home (%)
Housing units in structures - Boat, RV, van, etc. (%)
House/condo owner moved in on average (years ago)
Renter moved in on average (years ago)
Year householder moved into unit - Moved in 1999 to March 2000 (%)
Year householder moved into unit - Moved in 1995 to 1998 (%)
Year householder moved into unit - Moved in 1990 to 1994 (%)
Year householder moved into unit - Moved in 1980 to 1989 (%)
Year householder moved into unit - Moved in 1970 to 1979 (%)
Year householder moved into unit - Moved in 1969 or earlier (%)
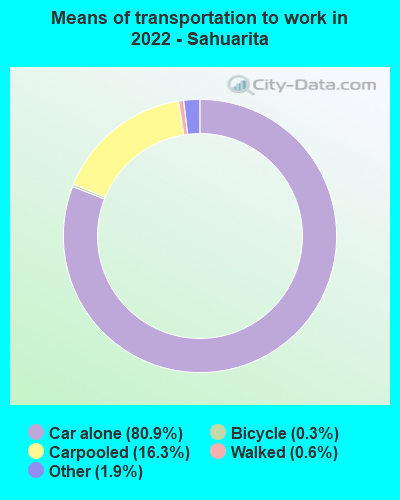
Means of transportation to work - Drove car alone (%)
Means of transportation to work - Carpooled (%)
Means of transportation to work - Public transportation (%)
Means of transportation to work - Bus or trolley bus (%)
Means of transportation to work - Streetcar or trolley car (%)
Means of transportation to work - Subway or elevated (%)
Means of transportation to work - Railroad (%)
Means of transportation to work - Ferryboat (%)
Means of transportation to work - Taxicab (%)
Means of transportation to work - Motorcycle (%)
Means of transportation to work - Bicycle (%)
Means of transportation to work - Walked (%)
Means of transportation to work - Other means (%)
Working at home (%)
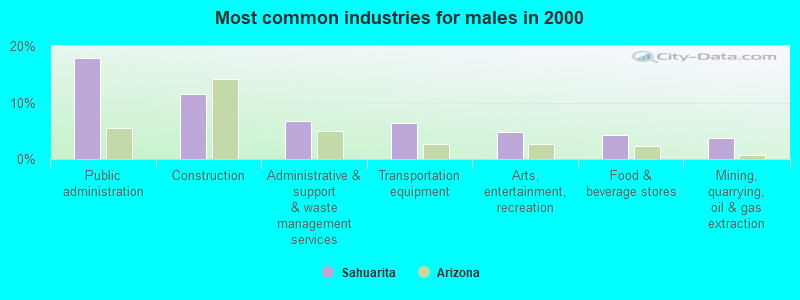
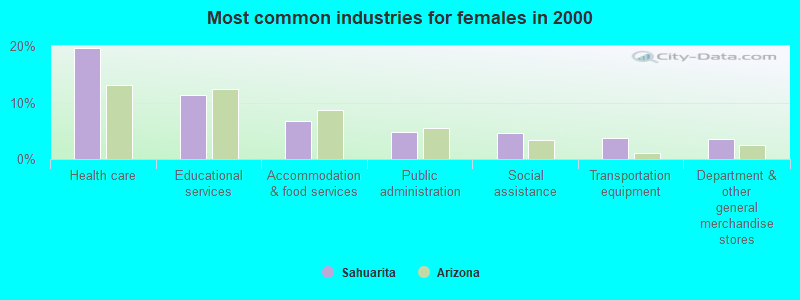
Industry diversity
Most Common Industries - Agriculture, forestry, fishing and hunting, and mining (%)
Most Common Industries - Agriculture, forestry, fishing and hunting (%)
Most Common Industries - Mining, quarrying, and oil and gas extraction (%)
Most Common Industries - Construction (%)
Most Common Industries - Manufacturing (%)
Most Common Industries - Wholesale trade (%)
Most Common Industries - Retail trade (%)
Most Common Industries - Transportation and warehousing, and utilities (%)
Most Common Industries - Transportation and warehousing (%)
Most Common Industries - Utilities (%)
Most Common Industries - Information (%)
Most Common Industries - Finance and insurance, and real estate and rental and leasing (%)
Most Common Industries - Finance and insurance (%)
Most Common Industries - Real estate and rental and leasing (%)
Most Common Industries - Professional, scientific, and management, and administrative and waste management services (%)
Most Common Industries - Professional, scientific, and technical services (%)
Most Common Industries - Management of companies and enterprises (%)
Most Common Industries - Administrative and support and waste management services (%)
Most Common Industries - Educational services, and health care and social assistance (%)
Most Common Industries - Educational services (%)
Most Common Industries - Health care and social assistance (%)
Most Common Industries - Arts, entertainment, and recreation, and accommodation and food services (%)
Most Common Industries - Arts, entertainment, and recreation (%)
Most Common Industries - Accommodation and food services (%)
Most Common Industries - Other services, except public administration (%)
Most Common Industries - Public administration (%)
Occupation diversity
Most Common Occupations - Management, business, science, and arts occupations (%)
Most Common Occupations - Management, business, and financial occupations (%)
Most Common Occupations - Management occupations (%)
Most Common Occupations - Business and financial operations occupations (%)
Most Common Occupations - Computer, engineering, and science occupations (%)
Most Common Occupations - Computer and mathematical occupations (%)
Most Common Occupations - Architecture and engineering occupations (%)
Most Common Occupations - Life, physical, and social science occupations (%)
Most Common Occupations - Education, legal, community service, arts, and media occupations (%)
Most Common Occupations - Community and social service occupations (%)
Most Common Occupations - Legal occupations (%)
Most Common Occupations - Education, training, and library occupations (%)
Most Common Occupations - Arts, design, entertainment, sports, and media occupations (%)
Most Common Occupations - Healthcare practitioners and technical occupations (%)
Most Common Occupations - Health diagnosing and treating practitioners and other technical occupations (%)
Most Common Occupations - Health technologists and technicians (%)
Most Common Occupations - Service occupations (%)
Most Common Occupations - Healthcare support occupations (%)
Most Common Occupations - Protective service occupations (%)
Most Common Occupations - Fire fighting and prevention, and other protective service workers including supervisors (%)
Most Common Occupations - Law enforcement workers including supervisors (%)
Most Common Occupations - Food preparation and serving related occupations (%)
Most Common Occupations - Building and grounds cleaning and maintenance occupations (%)
Most Common Occupations - Personal care and service occupations (%)
Most Common Occupations - Sales and office occupations (%)
Most Common Occupations - Sales and related occupations (%)
Most Common Occupations - Office and administrative support occupations (%)
Most Common Occupations - Natural resources, construction, and maintenance occupations (%)
Most Common Occupations - Farming, fishing, and forestry occupations (%)
Most Common Occupations - Construction and extraction occupations (%)
Most Common Occupations - Installation, maintenance, and repair occupations (%)
Most Common Occupations - Production, transportation, and material moving occupations (%)
Most Common Occupations - Production occupations (%)
Most Common Occupations - Transportation occupations (%)
Most Common Occupations - Material moving occupations (%)
People in Group quarters - Institutionalized population (%)
People in Group quarters - Correctional institutions (%)
People in Group quarters - Federal prisons and detention centers (%)
People in Group quarters - Halfway houses (%)
People in Group quarters - Local jails and other confinement facilities (including police lockups) (%)
People in Group quarters - Military disciplinary barracks (%)
People in Group quarters - State prisons (%)
People in Group quarters - Other types of correctional institutions (%)
People in Group quarters - Nursing homes (%)
People in Group quarters - Hospitals/wards, hospices, and schools for the handicapped (%)
People in Group quarters - Hospitals/wards and hospices for chronically ill (%)
People in Group quarters - Hospices or homes for chronically ill (%)
People in Group quarters - Military hospitals or wards for chronically ill (%)
People in Group quarters - Other hospitals or wards for chronically ill (%)
People in Group quarters - Hospitals or wards for drug/alcohol abuse (%)
People in Group quarters - Mental (Psychiatric) hospitals or wards (%)
People in Group quarters - Schools, hospitals, or wards for the mentally retarded (%)
People in Group quarters - Schools, hospitals, or wards for the physically handicapped (%)
People in Group quarters - Institutions for the deaf (%)
People in Group quarters - Institutions for the blind (%)
People in Group quarters - Orthopedic wards and institutions for the physically handicapped (%)
People in Group quarters - Wards in general hospitals for patients who have no usual home elsewhere (%)
People in Group quarters - Wards in military hospitals for patients who have no usual home elsewhere (%)
People in Group quarters - Juvenile institutions (%)
People in Group quarters - Long-term care (%)
People in Group quarters - Homes for abused, dependent, and neglected children (%)
People in Group quarters - Residential treatment centers for emotionally disturbed children (%)
People in Group quarters - Training schools for juvenile delinquents (%)
People in Group quarters - Short-term care, detention or diagnostic centers for delinquent children (%)
People in Group quarters - Type of juvenile institution unknown (%)
People in Group quarters - Noninstitutionalized population (%)
People in Group quarters - College dormitories (includes college quarters off campus) (%)
People in Group quarters - Military quarters (%)
People in Group quarters - On base (%)
People in Group quarters - Barracks, unaccompanied personnel housing (UPH), (Enlisted/Officer), ;and similar group living quarters for military personnel (%)
People in Group quarters - Transient quarters for temporary residents (%)
People in Group quarters - Military ships (%)
People in Group quarters - Group homes (%)
People in Group quarters - Homes or halfway houses for drug/alcohol abuse (%)
People in Group quarters - Homes for the mentally ill (%)
People in Group quarters - Homes for the mentally retarded (%)
People in Group quarters - Homes for the physically handicapped (%)
People in Group quarters - Other group homes (%)
People in Group quarters - Religious group quarters (%)
People in Group quarters - Dormitories (%)
People in Group quarters - Agriculture workers' dormitories on farms (%)
People in Group quarters - Job Corps and vocational training facilities (%)
People in Group quarters - Other workers' dormitories (%)
People in Group quarters - Crews of maritime vessels (%)
People in Group quarters - Other nonhousehold living situations (%)
People in Group quarters - Other noninstitutional group quarters (%)
Residents speaking English at home (%)
Residents speaking English at home - Born in the United States (%)
Residents speaking English at home - Native, born elsewhere (%)
Residents speaking English at home - Foreign born (%)
Residents speaking Spanish at home (%)
Residents speaking Spanish at home - Born in the United States (%)
Residents speaking Spanish at home - Native, born elsewhere (%)
Residents speaking Spanish at home - Foreign born (%)
Residents speaking other language at home (%)
Residents speaking other language at home - Born in the United States (%)
Residents speaking other language at home - Native, born elsewhere (%)
Residents speaking other language at home - Foreign born (%)
Class of Workers - Employee of private company (%)
Class of Workers - Self-employed in own incorporated business (%)
Class of Workers - Private not-for-profit wage and salary workers (%)
Class of Workers - Local government workers (%)
Class of Workers - State government workers (%)
Class of Workers - Federal government workers (%)
Class of Workers - Self-employed workers in own not incorporated business and Unpaid family workers (%)
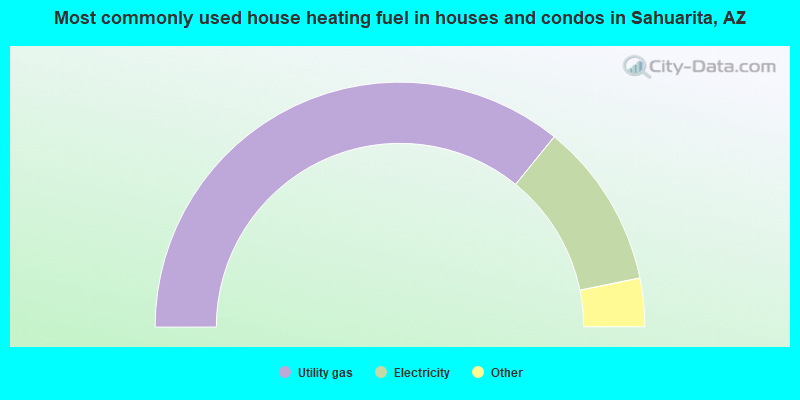
House heating fuel used in houses and condos - Utility gas (%)
House heating fuel used in houses and condos - Bottled, tank, or LP gas (%)
House heating fuel used in houses and condos - Electricity (%)
House heating fuel used in houses and condos - Fuel oil, kerosene, etc. (%)
House heating fuel used in houses and condos - Coal or coke (%)
House heating fuel used in houses and condos - Wood (%)
House heating fuel used in houses and condos - Solar energy (%)
House heating fuel used in houses and condos - Other fuel (%)
House heating fuel used in houses and condos - No fuel used (%)
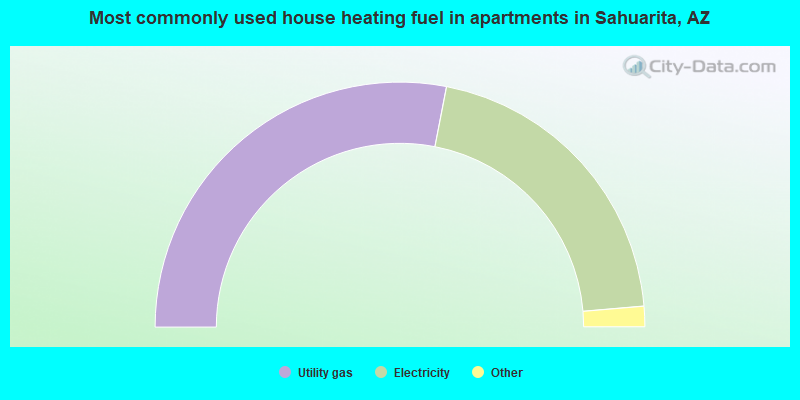
House heating fuel used in apartments - Utility gas (%)
House heating fuel used in apartments - Bottled, tank, or LP gas (%)
House heating fuel used in apartments - Electricity (%)
House heating fuel used in apartments - Fuel oil, kerosene, etc. (%)
House heating fuel used in apartments - Coal or coke (%)
House heating fuel used in apartments - Wood (%)
House heating fuel used in apartments - Solar energy (%)
House heating fuel used in apartments - Other fuel (%)
House heating fuel used in apartments - No fuel used (%)
Armed forces status - In Armed Forces (%)
Armed forces status - Civilian (%)
Armed forces status - Civilian - Veteran (%)
Armed forces status - Civilian - Nonveteran (%)
Fatal accidents locations in years 2005-2021
Fatal accidents locations in 2005
Fatal accidents locations in 2006
Fatal accidents locations in 2007
Fatal accidents locations in 2008
Fatal accidents locations in 2009
Fatal accidents locations in 2010
Fatal accidents locations in 2011
Fatal accidents locations in 2012
Fatal accidents locations in 2013
Fatal accidents locations in 2014
Fatal accidents locations in 2015
Fatal accidents locations in 2016
Fatal accidents locations in 2017
Fatal accidents locations in 2018
Fatal accidents locations in 2019
Fatal accidents locations in 2020
Fatal accidents locations in 2021
Alcohol use - People drinking some alcohol every month (%)
Alcohol use - People not drinking at all (%)
Alcohol use - Average days/month drinking alcohol
Alcohol use - Average drinks/week
Alcohol use - Average days/year people drink much
Audiometry - Average condition of hearing (%)
Audiometry - People that can hear a whisper from across a quiet room (%)
Audiometry - People that can hear normal voice from across a quiet room (%)
Audiometry - Ears ringing, roaring, buzzing (%)
Audiometry - Had a job exposure to loud noise (%)
Audiometry - Had off-work exposure to loud noise (%)
Blood Pressure & Cholesterol - Has high blood pressure (%)
Blood Pressure & Cholesterol - Checking blood pressure at home (%)
Blood Pressure & Cholesterol - Frequently checking blood cholesterol (%)
Blood Pressure & Cholesterol - Has high cholesterol level (%)
Consumer Behavior - Money monthly spent on food at supermarket/grocery store
Consumer Behavior - Money monthly spent on food at other stores
Consumer Behavior - Money monthly spent on eating out
Consumer Behavior - Money monthly spent on carryout/delivered foods
Consumer Behavior - Income spent on food at supermarket/grocery store (%)
Consumer Behavior - Income spent on food at other stores (%)
Consumer Behavior - Income spent on eating out (%)
Consumer Behavior - Income spent on carryout/delivered foods (%)
Current Health Status - General health condition (%)
Current Health Status - Blood donors (%)
Current Health Status - Has blood ever tested for HIV virus (%)
Current Health Status - Left-handed people (%)
Dermatology - People using sunscreen (%)
Diabetes - Diabetics (%)
Diabetes - Had a blood test for high blood sugar (%)
Diabetes - People taking insulin (%)
Diet Behavior & Nutrition - Diet health (%)
Diet Behavior & Nutrition - Milk product consumption (# of products/month)
Diet Behavior & Nutrition - Meals not home prepared (#/week)
Diet Behavior & Nutrition - Meals from fast food or pizza place (#/week)
Diet Behavior & Nutrition - Ready-to-eat foods (#/month)
Diet Behavior & Nutrition - Frozen meals/pizza (#/month)
Drug Use - People that ever used marijuana or hashish (%)
Drug Use - Ever used hard drugs (%)
Drug Use - Ever used any form of cocaine (%)
Drug Use - Ever used heroin (%)
Drug Use - Ever used methamphetamine (%)
Health Insurance - People covered by health insurance (%)
Kidney Conditions-Urology - Avg. # of times urinating at night
Medical Conditions - People with asthma (%)
Medical Conditions - People with anemia (%)
Medical Conditions - People with psoriasis (%)
Medical Conditions - People with overweight (%)
Medical Conditions - Elderly people having difficulties in thinking or remembering (%)
Medical Conditions - People who ever received blood transfusion (%)
Medical Conditions - People having trouble seeing even with glass/contacts (%)
Medical Conditions - People with arthritis (%)
Medical Conditions - People with gout (%)
Medical Conditions - People with congestive heart failure (%)
Medical Conditions - People with coronary heart disease (%)
Medical Conditions - People with angina pectoris (%)
Medical Conditions - People who ever had heart attack (%)
Medical Conditions - People who ever had stroke (%)
Medical Conditions - People with emphysema (%)
Medical Conditions - People with thyroid problem (%)
Medical Conditions - People with chronic bronchitis (%)
Medical Conditions - People with any liver condition (%)
Medical Conditions - People who ever had cancer or malignancy (%)
Mental Health - People who have little interest in doing things (%)
Mental Health - People feeling down, depressed, or hopeless (%)
Mental Health - People who have trouble sleeping or sleeping too much (%)
Mental Health - People feeling tired or having little energy (%)
Mental Health - People with poor appetite or overeating (%)
Mental Health - People feeling bad about themself (%)
Mental Health - People who have trouble concentrating on things (%)
Mental Health - People moving or speaking slowly or too fast (%)
Mental Health - People having thoughts they would be better off dead (%)
Oral Health - Average years since last visit a dentist
Oral Health - People embarrassed because of mouth (%)
Oral Health - People with gum disease (%)
Oral Health - General health of teeth and gums (%)
Oral Health - Average days a week using dental floss/device
Oral Health - Average days a week using mouthwash for dental problem
Oral Health - Average number of teeth
Pesticide Use - Households using pesticides to control insects (%)
Pesticide Use - Households using pesticides to kill weeds (%)
Physical Activity - People doing vigorous-intensity work activities (%)
Physical Activity - People doing moderate-intensity work activities (%)
Physical Activity - People walking or bicycling (%)
Physical Activity - People doing vigorous-intensity recreational activities (%)
Physical Activity - People doing moderate-intensity recreational activities (%)
Physical Activity - Average hours a day doing sedentary activities
Physical Activity - Average hours a day watching TV or videos
Physical Activity - Average hours a day using computer
Physical Functioning - People having limitations keeping them from working (%)
Physical Functioning - People limited in amount of work they can do (%)
Physical Functioning - People that need special equipment to walk (%)
Physical Functioning - People experiencing confusion/memory problems (%)
Physical Functioning - People requiring special healthcare equipment (%)
Prescription Medications - Average number of prescription medicines taking
Preventive Aspirin Use - Adults 40+ taking low-dose aspirin (%)
Reproductive Health - Vaginal deliveries (%)
Reproductive Health - Cesarean deliveries (%)
Reproductive Health - Deliveries resulted in a live birth (%)
Reproductive Health - Pregnancies resulted in a delivery (%)
Reproductive Health - Women breastfeeding newborns (%)
Reproductive Health - Women that had a hysterectomy (%)
Reproductive Health - Women that had both ovaries removed (%)
Reproductive Health - Women that have ever taken birth control pills (%)
Reproductive Health - Women taking birth control pills (%)
Reproductive Health - Women that have ever used Depo-Provera or injectables (%)
Reproductive Health - Women that have ever used female hormones (%)
Sexual Behavior - People 18+ that ever had sex (vaginal, anal, or oral) (%)
Sexual Behavior - Males 18+ that ever had vaginal sex with a woman (%)
Sexual Behavior - Males 18+ that ever performed oral sex on a woman (%)
Sexual Behavior - Males 18+ that ever had anal sex with a woman (%)
Sexual Behavior - Males 18+ that ever had any sex with a man (%)
Sexual Behavior - Females 18+ that ever had vaginal sex with a man (%)
Sexual Behavior - Females 18+ that ever performed oral sex on a man (%)
Sexual Behavior - Females 18+ that ever had anal sex with a man (%)
Sexual Behavior - Females 18+ that ever had any kind of sex with a woman (%)
Sexual Behavior - Average age people first had sex
Sexual Behavior - Average number of female sex partners in lifetime (males 18+)
Sexual Behavior - Average number of female vaginal sex partners in lifetime (males 18+)
Sexual Behavior - Average age people first performed oral sex on a woman (18+)
Sexual Behavior - Average number of woman performed oral sex on in lifetime (18+)
Sexual Behavior - Average number of male sex partners in lifetime (males 18+)
Sexual Behavior - Average number of male anal sex partners in lifetime (males 18+)
Sexual Behavior - Average age people first performed oral sex on a man (18+)
Sexual Behavior - Average number of male oral sex partners in lifetime (18+)
Sexual Behavior - People using protection when performing oral sex (%)
Sexual Behavior - Average number of times people have vaginal or anal sex a year
Sexual Behavior - People having sex without condom (%)
Sexual Behavior - Average number of male sex partners in lifetime (females 18+)
Sexual Behavior - Average number of male vaginal sex partners in lifetime (females 18+)
Sexual Behavior - Average number of female sex partners in lifetime (females 18+)
Sexual Behavior - Circumcised males 18+ (%)
Sleep Disorders - Average hours sleeping at night
Sleep Disorders - People that has trouble sleeping (%)
Smoking-Cigarette Use - People smoking cigarettes (%)
Taste & Smell - People 40+ having problems with smell (%)
Taste & Smell - People 40+ having problems with taste (%)
Taste & Smell - People 40+ that ever had wisdom teeth removed (%)
Taste & Smell - People 40+ that ever had tonsils teeth removed (%)
Taste & Smell - People 40+ that ever had a loss of consciousness because of a head injury (%)
Taste & Smell - People 40+ that ever had a broken nose or other serious injury to face or skull (%)
Taste & Smell - People 40+ that ever had two or more sinus infections (%)
Weight - Average height (inches)
Weight - Average weight (pounds)
Weight - Average BMI
Weight - People that are obese (%)
Weight - People that ever were obese (%)
Weight - People trying to lose weight (%)
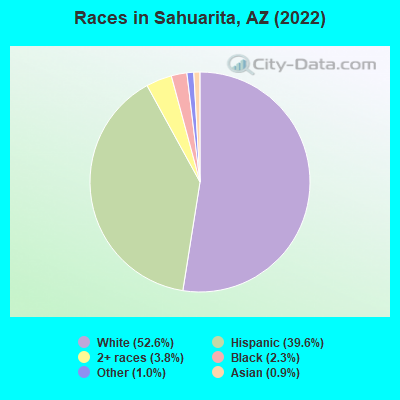
18,255 52.6% White alone 13,762 39.6% Hispanic 1,322 3.8% Two or more races 786 2.3% Black alone 351 1.0% Other race alone 298 0.9% Asian alone 27 0.08% American Indian alone
According to our research of Arizona and other state lists, there were 21 registered sex offenders living in Sahuarita, Arizona as of April 27, 2024 . The ratio of all residents to sex offenders in Sahuarita is 1,340 to 1.The ratio of registered sex offenders to all residents in this city is lower than the state average.
Officers per 1,000 residents here:
1.55Arizona average:
1.75
Latest news from Sahuarita, AZ collected exclusively by city-data.com from local newspapers, TV, and radio stations
Sahuarita, AZ City Guides: Ancestries: German (9.7%), English (6.8%), Italian (5.4%), American (3.9%), Irish (3.8%), European (2.3%).
Current Local Time:
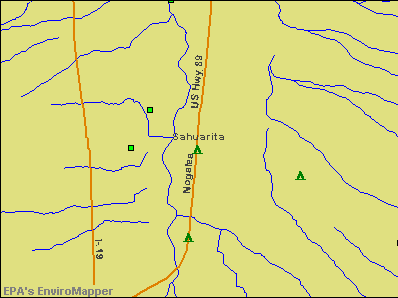
Land area: 15.2 square miles.
Population density: 2,343 people per square mile (low).
3,412 residents are foreign born (7.3% Latin America , 1.0% Europe ).
This town:
9.8%Arizona:
13.0%
Median real estate property taxes paid for housing units with mortgages in 2022: $2,553 (0.7%)Median real estate property taxes paid for housing units with no mortgage in 2022: $2,422 (0.7%)
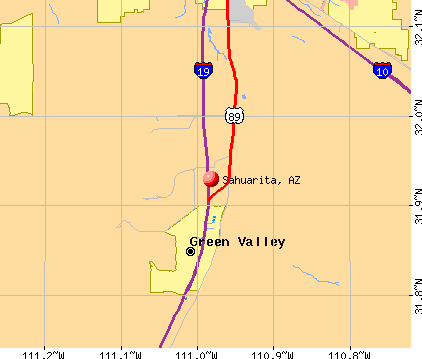
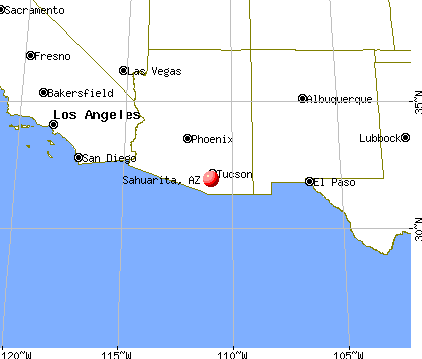
Nearest city with pop. 50,000+: Arivaca, AZ
Nearest city with pop. 200,000+: Tucson, AZ
Nearest city with pop. 1,000,000+: Phoenix, AZ
Nearest cities:
Latitude: 31.93 N, Longitude: 110.98 W
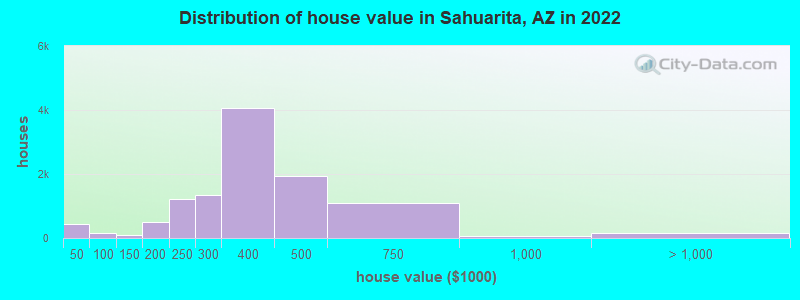
Property values in Sahuarita, AZ
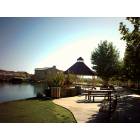
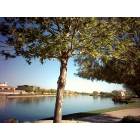
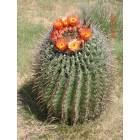
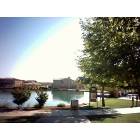
Sahuarita tourist attractions:
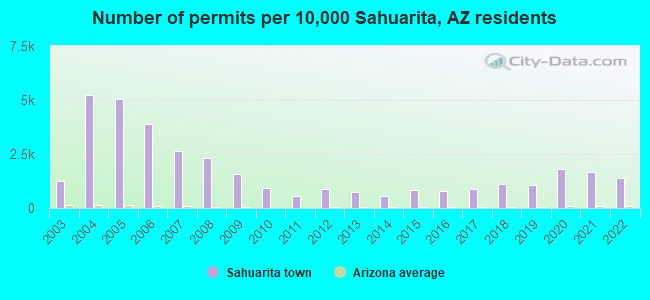
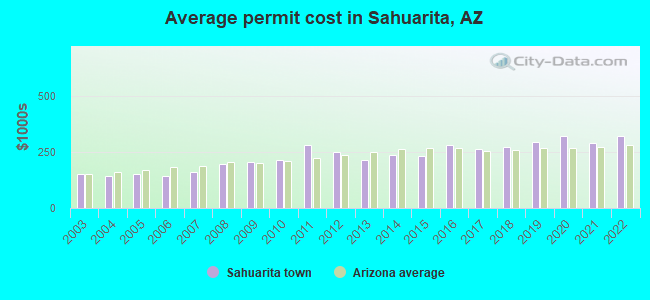
Single-family new house construction building permits:
2022: 452 buildings , average cost: $320,0002021: 533 buildings , average cost: $286,5002020: 578 buildings , average cost: $320,4002019: 342 buildings , average cost: $294,4002018: 366 buildings , average cost: $271,3002017: 287 buildings , average cost: $263,3002016: 250 buildings , average cost: $280,3002015: 271 buildings , average cost: $231,6002014: 183 buildings , average cost: $235,7002013: 240 buildings , average cost: $214,0002012: 283 buildings , average cost: $246,5002011: 187 buildings , average cost: $280,7002010: 306 buildings , average cost: $215,0002009: 517 buildings , average cost: $206,4002008: 749 buildings , average cost: $194,1002007: 848 buildings , average cost: $158,0002006: 1263 buildings , average cost: $142,8002005: 1634 buildings , average cost: $151,6002004: 1697 buildings , average cost: $141,0002003: 411 buildings , average cost: $151,000Unemployment in December 2023:
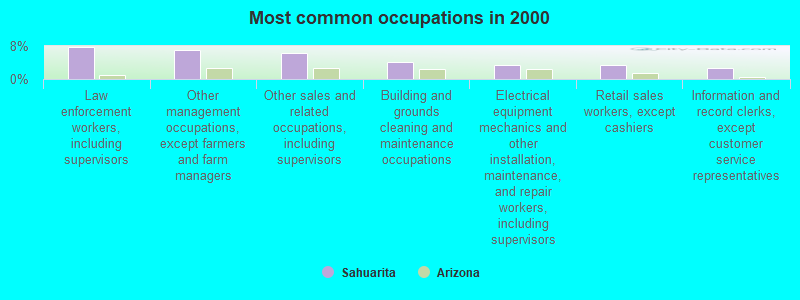
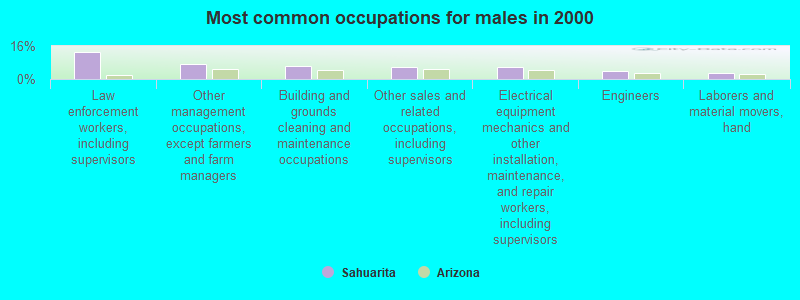
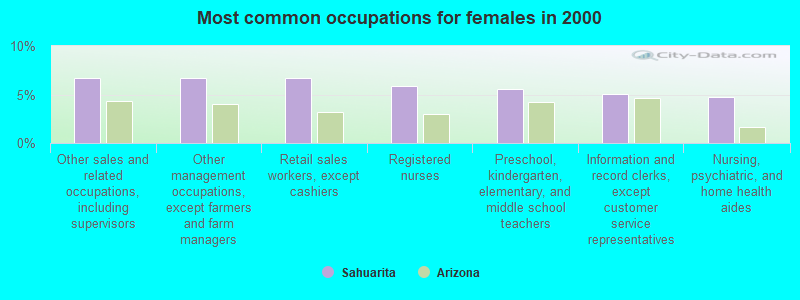
Most common occupations in Sahuarita, AZ (%)
Both Males Females
Law enforcement workers, including supervisors (7.9%)
Other management occupations, except farmers and farm managers (7.0%)
Other sales and related occupations, including supervisors (6.2%)
Building and grounds cleaning and maintenance occupations (4.2%)
Electrical equipment mechanics and other installation, maintenance, and repair workers, including supervisors (3.3%)
Retail sales workers, except cashiers (3.3%)
Information and record clerks, except customer service representatives (2.6%)
Law enforcement workers, including supervisors (12.9%)
Other management occupations, except farmers and farm managers (7.3%)
Building and grounds cleaning and maintenance occupations (6.3%)
Other sales and related occupations, including supervisors (5.8%)
Electrical equipment mechanics and other installation, maintenance, and repair workers, including supervisors (5.7%)
Engineers (4.1%)
Laborers and material movers, hand (3.0%)
Other sales and related occupations, including supervisors (6.7%)
Other management occupations, except farmers and farm managers (6.7%)
Retail sales workers, except cashiers (6.7%)
Registered nurses (5.9%)
Preschool, kindergarten, elementary, and middle school teachers (5.5%)
Information and record clerks, except customer service representatives (5.1%)
Nursing, psychiatric, and home health aides (4.8%)
Earthquake activity:
Sahuarita-area historical earthquake activity is significantly above Arizona state average. It is 1431% greater than the overall U.S. average. On 6/28/1992 at 11:57:34, a magnitude 7.6 (6.2 MB, 7.6 MS, 7.3 MW, Depth: 0.7 mi, Class: Major, Intensity: VIII - XII) earthquake occurred 357.5 miles away from Sahuarita center, causing 3 deaths ( 1 shaking deaths, 2 other deaths) and 400 injuries, causing $100,000,000 total damage and $40,000,000 insured lossesOn 5/19/1940 at 04:36:40, a magnitude 7.2 (7.2 UK) earthquake occurred 289.0 miles away from Sahuarita center, causing $33,000,000 total damage On 12/31/1934 at 18:45:56, a magnitude 7.1 (7.1 UK) earthquake occurred 284.2 miles away from the city center On 10/15/1979 at 23:16:54, a magnitude 7.0 (5.7 MB, 6.9 MS, 7.0 ML, 6.4 MW) earthquake occurred 278.8 miles away from the city center On 10/16/1999 at 09:46:44, a magnitude 7.4 (6.3 MB, 7.4 MS, 7.2 MW, 7.3 ML) earthquake occurred 362.6 miles away from Sahuarita center On 1/4/2006 at 08:32:32, a magnitude 6.6 (6.6 MW, Depth: 8.7 mi, Class: Strong, Intensity: VII - IX) earthquake occurred 269.1 miles away from the city center Magnitude types: body-wave magnitude (MB), local magnitude (ML), surface-wave magnitude (MS), moment magnitude (MW) Natural disasters: The number of natural disasters in Pima County (13) is near the US average (15).Major Disasters (Presidential) Declared: 10Emergencies Declared: 1Floods: 9, Storms: 8, Fires: 2, Hurricane: 1, Tornado: 1, Other: 1 (Note: some incidents may be assigned to more than one category). Hospitals and medical centers in Sahuarita: DESERT DIALYSIS SAHUARITA (DCI) (1700 W COMMERCE POINTE PL)
Other hospitals and medical centers near Sahuarita: SANTA RITA NURSING AND REHABILITATION CENTER (Nursing Home, about 4 miles away; GREEN VALLEY, AZ)
LA HACIENDA AT LA POSADA (Nursing Home, about 5 miles away; GREEN VALLEY, AZ)
PASCUA YAQUI DIALYSIS (DVA) (Dialysis Facility, about 14 miles away; TUCSON, AZ)
MIDVALE PARK DIALYSIS (FMC) (Dialysis Facility, about 15 miles away; TUCSON, AZ)
Colleges/universities with over 2000 students nearest to Sahuarita:
Pima Community College (about 21 miles; Tucson, AZ ; Full-time enrollment: 18,794)
University of Arizona (about 22 miles; Tucson, AZ ; FT enrollment: 36,324)
Pima Medical Institute-Tucson (about 23 miles; Tucson, AZ ; FT enrollment: 2,357)
Central Arizona College (about 82 miles; Coolidge, AZ ; FT enrollment: 4,893)
Cochise College (about 86 miles; Douglas, AZ ; FT enrollment: 8,597)
Eastern Arizona College (about 96 miles; Thatcher, AZ ; FT enrollment: 3,810)
Arizona State University-Polytechnic (about 104 miles; Mesa, AZ ; FT enrollment: 3,311)
Private high school in Sahuarita: ALFARERO BAPTIST SCHOOLS Students: 27, Location: 16241 S DELGADO RD, Grades: 1-12)
See full list of schools located in Sahuarita
Notable locations in Sahuarita: (A) , Duval Commerce Park (B) , Rural / Metro Fire Department Station 79 (C) , Sahuarita Town Hall (D) , Sahuarita Police Department (E) . Display/hide their locations on the map
Shopping Center: (1) . Display/hide its location on the map
Churches in Sahuarita include: (A) , Good Shepherd United Church of Christ (B) , First Assembly of God (C) , Cornerstone Baptist Church (D) , Unity Church in Green Valley (E) , The Church of Jesus Christ of Latter Day Saints (F) , Seventh Day Adventist Church of Green Valley (G) . Display/hide their locations on the map
Cemetery: (1) . Display/hide its location on the map
Park in Sahuarita: (1) . Display/hide its location on the map
Tourist attraction: (1) . Display/hide its approximate location on the map
Pima County has a predicted average indoor radon screening level between 2 and 4 pCi/L (pico curies per liter) - Moderate Potential Drinking water stations with addresses in Sahuarita and their reported violations in the past:
COMMUNITY WC OF GREEN VALLEY (Population served: 20,000, Groundwater):
Past monitoring violations:
Monitoring and Reporting (DBP) - Between JUL-2009 and SEP-2009, Contaminant: Total Haloacetic Acids (HAA5). Follow-up actions: St Compliance achieved (DEC-16-2011)
Monitoring and Reporting (DBP) - Between JUL-2009 and SEP-2009, Contaminant: TTHM. Follow-up actions: St Compliance achieved (DEC-16-2011)
Monitoring and Reporting (DBP) - Between JUL-2007 and SEP-2007, Contaminant: Chlorine. Follow-up actions: St Compliance achieved (MAR-29-2008)
Follow-up Or Routine LCR Tap M/R - In OCT-01-2006, Contaminant: Lead and Copper Rule. Follow-up actions: St Compliance achieved (OCT-16-2008)
Monitoring and Reporting (DBP) - Between APR-2005 and JUN-2005, Contaminant: Chlorine. Follow-up actions: St Compliance achieved (2 times from SEP-19-2005 to DEC-06-2006)
6 routine major monitoring violations
122 regular monitoring violations
3 other older monitoring violations
Population served: 3,613, Groundwater):
Past monitoring violations:
Monitoring and Reporting (DBP) - Between JUL-2006 and SEP-2006, Contaminant: Chlorine
Monitoring and Reporting (DBP) - Between JAN-2006 and MAR-2006, Contaminant: Chlorine. Follow-up actions: St Compliance achieved (2 times from MAY-23-2006 to DEC-06-2006)
Monitoring and Reporting (DBP) - Between OCT-2005 and DEC-2005, Contaminant: Chlorine. Follow-up actions: St Compliance achieved (FEB-28-2006)
Monitoring and Reporting (DBP) - Between JUL-2005 and SEP-2005, Contaminant: Chlorine. Follow-up actions: St Compliance achieved (DEC-06-2006)
Monitoring and Reporting (DBP) - Between APR-2005 and JUN-2005, Contaminant: Chlorine. Follow-up actions: St Compliance achieved (2 times from AUG-04-2005 to DEC-06-2006)
5 routine major monitoring violations
7 minor monitoring violations
2 regular monitoring violations
One other older monitoring violation
Population served: 3,272, Groundwater):
Past monitoring violations:
Monitoring and Reporting (DBP) - Between JAN-2007 and DEC-2007, Contaminant: TTHM. Follow-up actions: St Compliance achieved (NOV-13-2009)
Monitoring and Reporting (DBP) - Between JAN-2007 and DEC-2007, Contaminant: Total Haloacetic Acids (HAA5). Follow-up actions: St Compliance achieved (NOV-13-2009)
Monitoring and Reporting (DBP) - Between JUL-2006 and SEP-2006, Contaminant: Chlorine
Monitoring and Reporting (DBP) - Between JAN-2006 and MAR-2006, Contaminant: Chlorine. Follow-up actions: St Compliance achieved (2 times from MAY-23-2006 to DEC-06-2006)
Monitoring and Reporting (DBP) - Between OCT-2005 and DEC-2005, Contaminant: Chlorine. Follow-up actions: St Compliance achieved (FEB-28-2006)
5 routine major monitoring violations
5 minor monitoring violations
49 regular monitoring violations
3 other older monitoring violations
Population served: 3,042, Groundwater):
Past monitoring violations:
Monitoring and Reporting (DBP) - Between JAN-2011 and DEC-2011, Contaminant: TTHM. Follow-up actions: St Compliance achieved (JUL-11-2012)
Monitoring and Reporting (DBP) - Between JAN-2011 and DEC-2011, Contaminant: Total Haloacetic Acids (HAA5). Follow-up actions: St Compliance achieved (JUL-11-2012)
Monitoring and Reporting (DBP) - Between JAN-2010 and DEC-2010, Contaminant: Total Haloacetic Acids (HAA5). Follow-up actions: St Compliance achieved (JUL-11-2012)
Monitoring and Reporting (DBP) - Between JAN-2010 and DEC-2010, Contaminant: TTHM. Follow-up actions: St Compliance achieved (JUL-11-2012)
Monitoring and Reporting (DBP) - Between JAN-2010 and MAR-2010, Contaminant: Chlorine. Follow-up actions: St Compliance achieved (MAY-18-2010)
One routine major monitoring violation
5 minor monitoring violations
79 regular monitoring violations
7 other older monitoring violations
Population served: 291, Groundwater):
Past monitoring violations:
Monitoring and Reporting (DBP) - Between JAN-2008 and MAR-2008, Contaminant: Chlorine. Follow-up actions: St Compliance achieved (JUL-14-2008)
Initial Tap Sampling for Pb and Cu - In JUL-01-2007, Contaminant: Lead and Copper Rule. Follow-up actions: St Violation/Reminder Notice (MAY-19-2008), State No Longer Subject to Rule (SEP-11-2008)
Monitoring and Reporting (DBP) - Between JAN-2007 and MAR-2007, Contaminant: Chlorine. Follow-up actions: St Compliance achieved (JUL-17-2007)
Monitoring and Reporting (DBP) - Between OCT-2006 and DEC-2006, Contaminant: Chlorine. Follow-up actions: St Compliance achieved (APR-05-2007)
5 routine major monitoring violations
Population served: 240, Groundwater):
Past monitoring violations:
Monitoring and Reporting (DBP) - Between JUL-2006 and SEP-2006, Contaminant: Chlorine
Monitoring and Reporting (DBP) - Between JAN-2006 and MAR-2006, Contaminant: Chlorine. Follow-up actions: St Compliance achieved (2 times from MAY-23-2006 to DEC-06-2006)
Monitoring and Reporting (DBP) - Between OCT-2005 and DEC-2005, Contaminant: Chlorine. Follow-up actions: St Compliance achieved (FEB-28-2006)
Follow-up Or Routine LCR Tap M/R - In OCT-01-2005, Contaminant: Lead and Copper Rule. Follow-up actions: St Compliance achieved (DEC-06-2006)
Monitoring and Reporting (DBP) - Between JUL-2005 and SEP-2005, Contaminant: Chlorine. Follow-up actions: St Compliance achieved (DEC-06-2006)
5 routine major monitoring violations
154 regular monitoring violations
5 other older monitoring violations
Population served: 60, Groundwater):
Past monitoring violations:
Initial Tap Sampling for Pb and Cu - In JUL-01-2014, Contaminant: Lead and Copper Rule. Follow-up actions: St Violation/Reminder Notice (AUG-01-2014)
Initial Tap Sampling for Pb and Cu - In JUL-01-2009, Contaminant: Lead and Copper Rule. Follow-up actions: St Violation/Reminder Notice (2 times from JUL-29-2009 to FEB-12-2010)
12 routine major monitoring violations
9 regular monitoring violations
Average household size: This town:
2.8 peopleArizona:
2.6 people
Percentage of family households: This town:
78.9%Whole state:
66.2%
Percentage of households with unmarried partners: This town:
6.4%Whole state:
7.8%
Likely homosexual households (counted as self-reported same-sex unmarried-partner households)
Lesbian couples: 0.4% of all households Gay men: 0.3% of all households
44 people in nursing facilities/skilled-nursing facilities in 2010people in group homes intended for adults in 2010people in other noninstitutional group quarters in 2000people in nursing homes in 2000
Banks with branches in Sahuarita (2011 data):
JPMorgan Chase Bank, National Association: Rancho Sahuarita Banking Ctr at 15960 South Rancho Sahuarita Blvd., branch established on 2007/12/04. Info updated 2011/11/10: Bank assets: $1,811,678.0 mil, Deposits: $1,190,738.0 mil, headquarters in Columbus, OH, positive income , International Specialization, 5577 total offices , Holding Company: Jpmorgan Chase & Co.
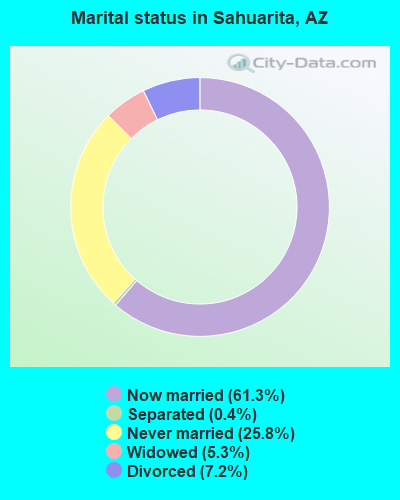
For population 15 years and over in Sahuarita:
Never married: 25.8%Now married: 61.3%Separated: 0.4%Widowed: 5.3%Divorced: 7.2% For population 25 years and over in Sahuarita:
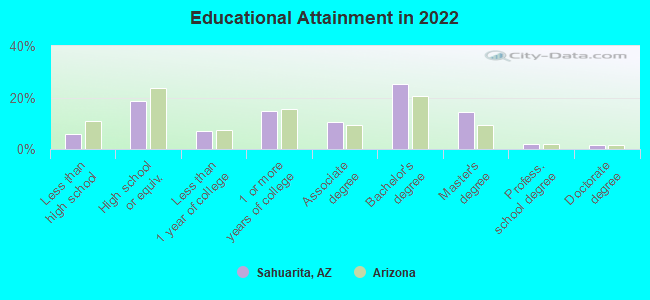
High school or higher: 94.2%Bachelor's degree or higher: 41.4%Graduate or professional degree: 17.6%Unemployed: 4.6%Mean travel time to work (commute): 25.2 minutes
Education Gini index (Inequality in education) Here:
9.5Arizona average:
12.2
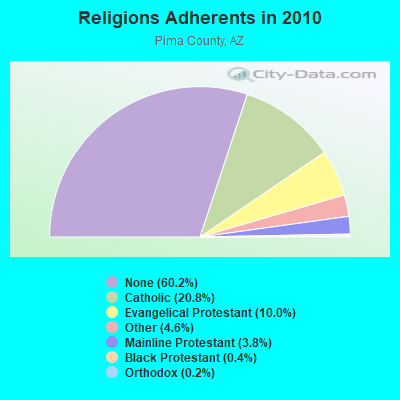
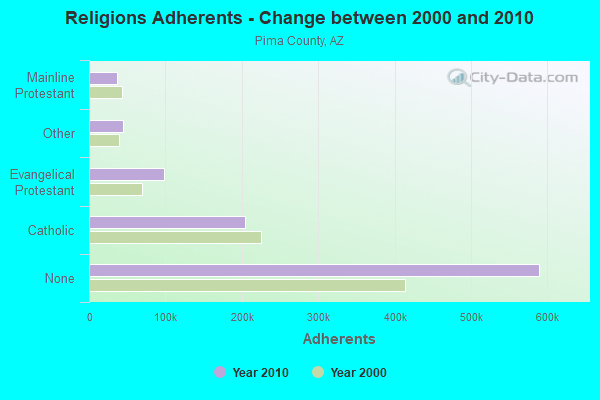
Religion statistics for Sahuarita, AZ (based on Pima County data)
Religion Adherents Congregations Catholic 203,770 50 Evangelical Protestant 98,278 362 Other 45,011 128 Mainline Protestant 37,037 77 Black Protestant 4,190 14 Orthodox 2,260 5 None 589,717 -
Source: Clifford Grammich, Kirk Hadaway, Richard Houseal, Dale E.Jones, Alexei Krindatch, Richie Stanley and Richard H.Taylor. 2012. 2010 U.S.Religion Census: Religious Congregations & Membership Study. Association of Statisticians of American Religious Bodies. Jones, Dale E., et al. 2002. Congregations and Membership in the United States 2000. Nashville, TN: Glenmary Research Center. Graphs represent county-level data
Food Environment Statistics: Number of grocery stores : 122Here :
1.22 / 10,000 pop.Arizona :
1.36 / 10,000 pop.
Number of supercenters and club stores : 9Here :
0.09 / 10,000 pop.Arizona :
0.14 / 10,000 pop.
Number of convenience stores (no gas) : 52Pima County :
0.52 / 10,000 pop.Arizona :
0.55 / 10,000 pop.
Number of convenience stores (with gas) : 226This county :
2.27 / 10,000 pop.Arizona :
2.47 / 10,000 pop.
Number of full-service restaurants : 615This county :
6.17 / 10,000 pop.Arizona :
6.21 / 10,000 pop.
Adult diabetes rate : This county :
7.8%Arizona :
8.0%
Adult obesity rate : This county :
21.2%Arizona :
22.8%
Low-income preschool obesity rate : Pima County :
15.2%Arizona :
14.2%
Health and Nutrition: Healthy diet rate : Sahuarita:
52.2%Arizona:
49.0%
Average overall health of teeth and gums : Sahuarita:
51.1%Arizona:
47.3%
People feeling badly about themselves : People not drinking alcohol at all : This city:
9.4%State:
10.2%
Average hours sleeping at night : Overweight people : Sahuarita:
35.6%Arizona:
33.5%
General health condition : This city:
58.4%State:
56.1%
Average condition of hearing : This city:
79.2%State:
79.4%
More about Health and Nutrition of Sahuarita, AZ Residents
Local government employment and payroll (March 2022)
Function
Full-time employees
Monthly full-time payroll
Average yearly full-time wage
Part-time employees
Monthly part-time payroll
Police Protection - Officers
50 $374,230 $89,815 0 $0 Judicial and Legal
31 $189,248 $73,257 0 $0 Parks and Recreation
15 $50,102 $40,082 7 $3,856 Police - Other
11 $43,165 $47,089 0 $0 Streets and Highways
11 $48,921 $53,368 0 $0 Financial Administration
10 $62,062 $74,474 0 $0 Other Government Administration
10 $71,068 $85,282 15 $7,119 Sewerage
5 $27,875 $66,900 0 $0 Airports
0 $0 3 $3,838
Totals for Government
143 $866,671 $72,728 25 $14,814
Sahuarita government finances - Expenditure in 2021 (per resident):
Current Operations - Central Staff Services: $1,898,000 ($53.26)
Financial Administration: $1,821,000 ($51.10)Judicial and Legal Services: $1,454,000 ($40.80)General Public Buildings: $618,000 ($17.34)General - Interest on Debt: $1,729,000 ($48.52)
Sahuarita government finances - Revenue in 2021 (per resident):
Charges - Sewerage: $4,090,000 ($114.77)
Other: $279,000 ($7.83)Miscellaneous - Fines and Forfeits: $254,000 ($7.13)
General Revenue - Other: $240,000 ($6.73)Interest Earnings: $79,000 ($2.22)Tax - Other License: $3,274,000 ($91.87)
Sahuarita government finances - Debt in 2021 (per resident):
Long Term Debt - Beginning Outstanding - Unspecified Public Purpose: $43,228,000 ($1212.97)
Outstanding Unspecified Public Purpose: $23,544,000 ($660.64)Retired Unspecified Public Purpose: $19,684,000 ($552.33)
Sahuarita government finances - Cash and Securities in 2021 (per resident):
Other Funds - Cash and Securities: $32,224,000 ($904.20)
5.84% of this county's 2021 resident taxpayers lived in other counties in 2020 ($71,876 average adjusted gross income )
Here:
5.84%Arizona average:
6.85%
0.07% of residents moved from foreign countries ($644 average AGI )Pima County:
0.07%Arizona average:
0.03%
Top counties from which taxpayers relocated into this county between 2020 and 2021:
5.17% of this county's 2020 resident taxpayers moved to other counties in 2021 ($65,979 average adjusted gross income )
Here:
5.17%Arizona average:
5.72%
0.06% of residents moved to foreign countries ($677 average AGI )Pima County:
0.06%Arizona average:
0.03%
Top counties to which taxpayers relocated from this county between 2020 and 2021:
Businesses in Sahuarita, AZ
Name Count Name Count
99 Cents Only Stores 1 Starbucks 2 Carl\s Jr. 1 T-Mobile 1 FedEx 1 UPS 1 Kroger 1 Vons 1 McDonald's 1 Walgreens 1 Penske 1 Walmart 1
Strongest AM radio stations in Sahuarita:
KGVY (1080 AM; daytime; 1 kW; GREEN VALLEY, AZ; Owner: GREEN VALLEY BROADCASTERS, INC.)
KQTL (1210 AM; 10 kW; SAHUARITA, AZ; Owner: RADIO UNICA OF TUCSON LICENSE CORP.)
KFLT (830 AM; 50 kW; TUCSON, AZ; Owner: FAMILY LIFE B/CING SYSTEM, INC.)
KUAZ (1550 AM; daytime; 50 kW; TUCSON, AZ; Owner: ARIZONA BOARD OF REGENTS)
KTKT (990 AM; 10 kW; TUCSON, AZ; Owner: ARIZONA LOTUS CORP.)
KNST (790 AM; 5 kW; TUCSON, AZ)
KEVT (1030 AM; 10 kW; CORTARO, AZ; Owner: ONE MART CORP.)
KSAZ (580 AM; 5 kW; MARANA, AZ; Owner: OWL BROADCASTING & DEVELOPMENT, INC.)
KJLL (1330 AM; 5 kW; SOUTH TUCSON, AZ; Owner: HUDSON COMMUNICATIONS, INC)
KGMS (940 AM; 1 kW; TUCSON, AZ)
KMIA (710 AM; 50 kW; BLACK CANYON CITY, AZ; Owner: ENTRAVISION HOLDINGS, LLC)
KMIK (1580 AM; 50 kW; TEMPE, AZ; Owner: ABC, INC.)
KFNX (1100 AM; 50 kW; CAVE CREEK, AZ; Owner: NORTH AMERICAN BROADCASTING CO., INC.)
Strongest FM radio stations in Sahuarita:
KWFM-FM (97.1 FM; GREEN VALLEY, AZ; Owner: CAPSTAR TX LIMITED PARTNERSHIP)
KXCI (91.3 FM; TUCSON, AZ; Owner: FOUNDATION FOR CREATIVE BROADCASTING, INC.)
KFMA (92.1 FM; GREEN VALLEY, AZ; Owner: ARIZONA LOTUS CORP.)
K261CK (100.1 FM; SAN XAVIER, AZ; Owner: WORLD RADIO NETWORK, INC.)
KZLZ-FM2 (105.3 FM; TUCSON, AZ; Owner: ENTRAVISION HOLDINGS, LLC)
K263AA (100.5 FM; TUCSON, AZ; Owner: EDUCATIONAL MEDIA FOUNDATION)
K255AC (98.9 FM; TUCSON, AZ; Owner: MARICOPA COUNTY COMMUN. COLLEGE DIST)
KIIM-FM (99.5 FM; TUCSON, AZ; Owner: CITADEL BROADCASTING COMPANY)
KOYT (92.9 FM; TUCSON, AZ; Owner: CAPSTAR TX LIMITED PARTNERSHIP)
KHYT (107.5 FM; TUCSON, AZ; Owner: CITADEL BROADCASTING COMPANY)
KRQQ (93.7 FM; TUCSON, AZ; Owner: CAPSTAR TX LIMITED PARTNERSHIP)
KMXZ-FM (94.9 FM; TUCSON, AZ; Owner: JOURNAL BROADCAST CORPORATION)
KUAT-FM (90.5 FM; TUCSON, AZ; Owner: ARIZONA BOARD OF REGENTS)
K292CM (106.3 FM; SUMMERHAVEN, AZ; Owner: ARIZONA LOTUS CORPORATION)
KZLZ-FM1 (105.3 FM; TUCSON, AZ; Owner: ENTRAVISION HOLDINGS, LLC)
KLPX (96.1 FM; TUCSON, AZ; Owner: ARIZONA LOTUS CORPORATION)
KGMG (106.3 FM; ORACLE, AZ; Owner: JOURNAL BROADCAST CORPORATION)
KCDX (103.1 FM; FLORENCE, AZ; Owner: DESERT WEST AIR RANCHERS CORPORATION)
KXKQ (94.1 FM; SAFFORD, AZ; Owner: MCMURRAY COMMUNICATIONS, INC.)
KZNO (98.3 FM; NOGALES, AZ; Owner: DESERT WEST AIR RANCHERS CORPORATION (A WYOMING CORPORATION))
TV broadcast stations around Sahuarita:
KMSB-TV (Channel 11; TUCSON, AZ; Owner: KMSB-TV, INC.)
KWBA (Channel 58; SIERRA VISTA, AZ; Owner: TUCSON COMMUNICATIONS, L.L.C.)
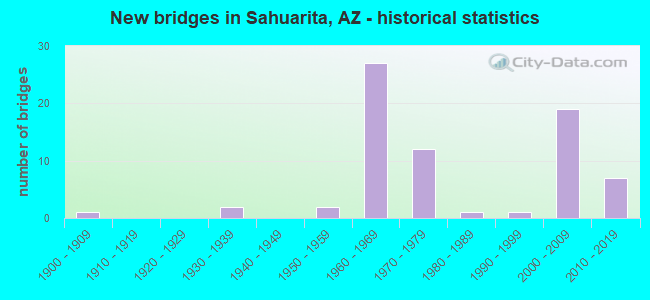
National Bridge Inventory (NBI) Statistics 72 Number of bridges515ft / 157m Total length $36,000 Total costs1,086,043 Total average daily traffic194,035 Total average daily truck traffic
New bridges - historical statistics
1 1900-1909 2 1930-1939 2 1950-1959 27 1960-1969 12 1970-1979 1 1980-1989 1 1990-1999 19 2000-2009 7 2010-2019
See full National Bridge Inventory statistics for Sahuarita, AZ
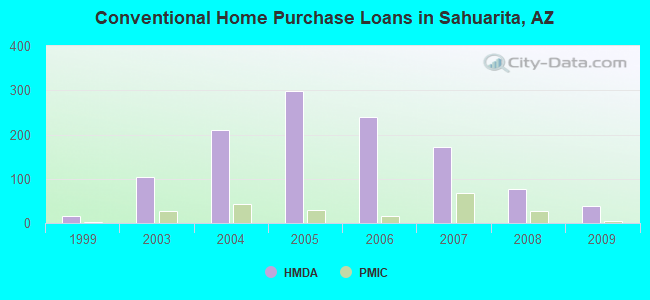
Home Mortgage Disclosure Act Aggregated Statistics For Year 2009(Based on 1 partial tract) A) FHA, FSA/RHS & VA B) Conventional C) Refinancings D) Home Improvement Loans F) Non-occupant Loans on G) Loans On Manufactured Number Average Value Number Average Value Number Average Value Number Average Value Number Average Value Number Average Value
LOANS ORIGINATED 106 $172,230 39 $144,900 108 $181,075 2 $37,985 15 $140,491 3 $112,607 APPLICATIONS APPROVED, NOT ACCEPTED 6 $171,493 4 $163,075 12 $180,157 0 $0 2 $102,280 1 $40,530 APPLICATIONS DENIED 23 $169,954 5 $137,506 42 $183,351 3 $16,197 6 $122,333 2 $96,550 APPLICATIONS WITHDRAWN 11 $172,172 4 $156,232 23 $187,114 0 $0 2 $131,565 1 $39,040 FILES CLOSED FOR INCOMPLETENESS 2 $161,270 1 $168,060 6 $180,547 1 $15,910 1 $91,670 1 $80,850
Aggregated Statistics For Year 2008(Based on 1 partial tract) A) FHA, FSA/RHS & VA B) Conventional C) Refinancings D) Home Improvement Loans F) Non-occupant Loans on G) Loans On Manufactured Number Average Value Number Average Value Number Average Value Number Average Value Number Average Value Number Average Value
LOANS ORIGINATED 108 $188,210 76 $160,619 46 $187,774 2 $160,000 20 $134,376 2 $93,475 APPLICATIONS APPROVED, NOT ACCEPTED 8 $200,344 18 $156,686 9 $177,847 1 $32,890 4 $125,995 1 $60,050 APPLICATIONS DENIED 26 $182,141 13 $192,727 52 $204,508 7 $61,507 5 $164,328 2 $124,985 APPLICATIONS WITHDRAWN 11 $194,028 11 $153,093 17 $210,565 1 $199,470 3 $172,237 0 $0 FILES CLOSED FOR INCOMPLETENESS 3 $157,593 2 $133,900 3 $199,963 0 $0 0 $0 0 $0
Aggregated Statistics For Year 2007(Based on 1 partial tract) A) FHA, FSA/RHS & VA B) Conventional C) Refinancings D) Home Improvement Loans F) Non-occupant Loans on G) Loans On Manufactured Number Average Value Number Average Value Number Average Value Number Average Value Number Average Value Number Average Value
LOANS ORIGINATED 36 $200,063 171 $172,553 69 $183,138 11 $69,930 29 $164,697 4 $142,705 APPLICATIONS APPROVED, NOT ACCEPTED 5 $214,576 29 $174,846 19 $169,861 5 $62,812 4 $200,210 1 $189,920 APPLICATIONS DENIED 6 $201,483 37 $181,242 90 $207,102 17 $86,665 10 $200,423 6 $80,955 APPLICATIONS WITHDRAWN 6 $199,857 33 $162,018 30 $220,837 3 $86,720 5 $155,798 1 $141,540 FILES CLOSED FOR INCOMPLETENESS 0 $0 4 $204,138 15 $220,179 1 $22,280 2 $160,425 0 $0
Aggregated Statistics For Year 2006(Based on 1 partial tract) A) FHA, FSA/RHS & VA B) Conventional C) Refinancings D) Home Improvement Loans F) Non-occupant Loans on G) Loans On Manufactured Number Average Value Number Average Value Number Average Value Number Average Value Number Average Value Number Average Value
LOANS ORIGINATED 14 $211,442 239 $161,648 119 $182,565 17 $89,012 47 $161,399 3 $116,357 APPLICATIONS APPROVED, NOT ACCEPTED 2 $259,200 45 $175,060 20 $193,516 6 $78,055 9 $197,841 2 $66,100 APPLICATIONS DENIED 3 $246,433 30 $172,144 58 $194,646 13 $61,065 10 $181,898 4 $105,092 APPLICATIONS WITHDRAWN 5 $224,168 51 $179,634 49 $196,324 5 $94,938 9 $183,789 3 $109,637 FILES CLOSED FOR INCOMPLETENESS 0 $0 7 $184,401 12 $218,707 1 $29,710 2 $201,800 0 $0
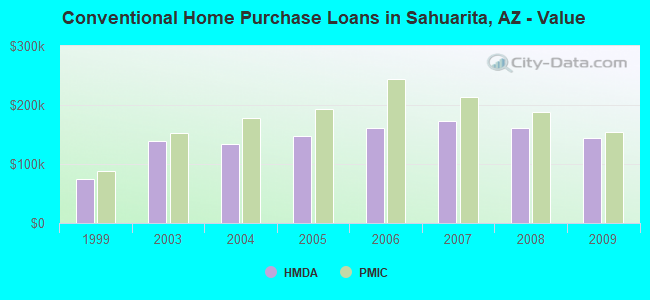
Aggregated Statistics For Year 2005(Based on 1 partial tract) A) FHA, FSA/RHS & VA B) Conventional C) Refinancings D) Home Improvement Loans F) Non-occupant Loans on G) Loans On Manufactured Number Average Value Number Average Value Number Average Value Number Average Value Number Average Value Number Average Value
LOANS ORIGINATED 17 $193,976 298 $147,030 138 $167,564 16 $74,999 95 $138,911 6 $103,802 APPLICATIONS APPROVED, NOT ACCEPTED 1 $276,070 38 $136,646 15 $175,164 5 $62,768 10 $133,134 1 $113,530 APPLICATIONS DENIED 1 $262,070 31 $128,538 48 $171,201 13 $44,660 9 $137,764 4 $95,808 APPLICATIONS WITHDRAWN 4 $135,438 50 $163,772 40 $177,129 7 $179,854 13 $163,998 2 $91,565 FILES CLOSED FOR INCOMPLETENESS 1 $86,790 8 $139,230 18 $195,224 1 $44,560 2 $131,775 1 $68,330
Aggregated Statistics For Year 2004(Based on 1 partial tract) A) FHA, FSA/RHS & VA B) Conventional C) Refinancings D) Home Improvement Loans F) Non-occupant Loans on G) Loans On Manufactured Number Average Value Number Average Value Number Average Value Number Average Value Number Average Value Number Average Value
LOANS ORIGINATED 32 $169,150 211 $134,631 60 $136,597 6 $42,440 48 $125,675 6 $91,565 APPLICATIONS APPROVED, NOT ACCEPTED 2 $128,485 20 $125,527 7 $156,877 2 $30,450 4 $120,212 3 $60,830 APPLICATIONS DENIED 5 $157,580 22 $125,304 31 $130,305 10 $35,310 3 $98,037 6 $66,985 APPLICATIONS WITHDRAWN 9 $157,170 34 $127,332 21 $146,347 3 $55,030 11 $112,215 2 $93,900 FILES CLOSED FOR INCOMPLETENESS 0 $0 3 $116,570 8 $144,588 0 $0 1 $118,410 1 $71,090
Aggregated Statistics For Year 2003(Based on 1 partial tract) A) FHA, FSA/RHS & VA B) Conventional C) Refinancings D) Home Improvement Loans F) Non-occupant Loans on Number Average Value Number Average Value Number Average Value Number Average Value Number Average Value
LOANS ORIGINATED 31 $157,637 105 $139,747 79 $128,617 5 $27,246 18 $124,927 APPLICATIONS APPROVED, NOT ACCEPTED 0 $0 8 $126,604 15 $121,789 1 $29,920 2 $135,385 APPLICATIONS DENIED 2 $164,665 9 $116,027 37 $114,496 3 $27,090 2 $81,910 APPLICATIONS WITHDRAWN 4 $175,330 16 $137,412 21 $128,189 0 $0 2 $98,145 FILES CLOSED FOR INCOMPLETENESS 1 $132,840 3 $125,833 2 $150,025 0 $0 0 $0
Aggregated Statistics For Year 1999(Based on 1 partial tract) A) FHA, FSA/RHS & VA B) Conventional C) Refinancings D) Home Improvement Loans F) Non-occupant Loans on Number Average Value Number Average Value Number Average Value Number Average Value Number Average Value
LOANS ORIGINATED 1 $80,390 15 $75,339 6 $65,583 2 $24,130 4 $74,938 APPLICATIONS APPROVED, NOT ACCEPTED 0 $0 1 $67,540 1 $42,460 0 $0 0 $0 APPLICATIONS DENIED 0 $0 1 $47,000 2 $68,920 0 $0 0 $0 APPLICATIONS WITHDRAWN 0 $0 1 $113,270 2 $51,095 0 $0 0 $0 FILES CLOSED FOR INCOMPLETENESS 0 $0 0 $0 0 $0 0 $0 0 $0
Detailed HMDA statistics for the following Tracts:
0043.14
Private Mortgage Insurance Companies Aggregated Statistics For Year 2009(Based on 1 partial tract) A) Conventional B) Refinancings Number Average Value Number Average Value
LOANS ORIGINATED 5 $154,736 2 $151,725 APPLICATIONS APPROVED, NOT ACCEPTED 3 $200,883 1 $150,030 APPLICATIONS DENIED 1 $134,750 0 $0 APPLICATIONS WITHDRAWN 0 $0 0 $0 FILES CLOSED FOR INCOMPLETENESS 0 $0 0 $0
Aggregated Statistics For Year 2008(Based on 1 partial tract) A) Conventional B) Refinancings C) Non-occupant Loans on Number Average Value Number Average Value Number Average Value
LOANS ORIGINATED 27 $187,561 5 $218,948 3 $140,407 APPLICATIONS APPROVED, NOT ACCEPTED 15 $210,106 3 $276,000 1 $194,380 APPLICATIONS DENIED 1 $154,690 0 $0 1 $122,230 APPLICATIONS WITHDRAWN 1 $250,820 0 $0 0 $0 FILES CLOSED FOR INCOMPLETENESS 1 $136,020 0 $0 0 $0
Aggregated Statistics For Year 2007(Based on 1 partial tract) A) Conventional B) Refinancings C) Non-occupant Loans on Number Average Value Number Average Value Number Average Value
LOANS ORIGINATED 67 $213,441 10 $234,608 6 $187,727 APPLICATIONS APPROVED, NOT ACCEPTED 7 $221,324 3 $297,363 0 $0 APPLICATIONS DENIED 2 $270,660 0 $0 0 $0 APPLICATIONS WITHDRAWN 4 $179,788 1 $340,790 1 $162,330 FILES CLOSED FOR INCOMPLETENESS 0 $0 0 $0 0 $0
Aggregated Statistics For Year 2006(Based on 1 partial tract) A) Conventional B) Refinancings C) Non-occupant Loans on Number Average Value Number Average Value Number Average Value
LOANS ORIGINATED 15 $244,610 5 $250,948 3 $208,167 APPLICATIONS APPROVED, NOT ACCEPTED 3 $297,080 1 $284,350 1 $264,830 APPLICATIONS DENIED 0 $0 1 $317,880 1 $272,460 APPLICATIONS WITHDRAWN 1 $281,380 1 $147,270 0 $0 FILES CLOSED FOR INCOMPLETENESS 0 $0 0 $0 0 $0
Aggregated Statistics For Year 2005(Based on 1 partial tract) A) Conventional B) Refinancings C) Non-occupant Loans on D) Loans On Manufactured Number Average Value Number Average Value Number Average Value Number Average Value
LOANS ORIGINATED 30 $193,894 9 $217,811 10 $189,601 1 $78,510 APPLICATIONS APPROVED, NOT ACCEPTED 7 $198,891 1 $292,620 3 $158,653 0 $0 APPLICATIONS DENIED 0 $0 0 $0 0 $0 0 $0 APPLICATIONS WITHDRAWN 1 $118,620 0 $0 1 $101,010 0 $0 FILES CLOSED FOR INCOMPLETENESS 0 $0 0 $0 0 $0 0 $0
Aggregated Statistics For Year 2004(Based on 1 partial tract) A) Conventional B) Refinancings C) Non-occupant Loans on D) Loans On Manufactured Number Average Value Number Average Value Number Average Value Number Average Value
LOANS ORIGINATED 42 $178,748 7 $151,904 9 $149,978 1 $82,550 APPLICATIONS APPROVED, NOT ACCEPTED 6 $160,883 2 $193,210 1 $206,470 0 $0 APPLICATIONS DENIED 0 $0 0 $0 0 $0 0 $0 APPLICATIONS WITHDRAWN 1 $144,300 0 $0 0 $0 0 $0 FILES CLOSED FOR INCOMPLETENESS 0 $0 0 $0 0 $0 0 $0
Aggregated Statistics For Year 2003(Based on 1 partial tract) A) Conventional B) Refinancings C) Non-occupant Loans on Number Average Value Number Average Value Number Average Value
LOANS ORIGINATED 26 $152,400 11 $142,232 2 $127,110 APPLICATIONS APPROVED, NOT ACCEPTED 3 $139,557 2 $142,280 0 $0 APPLICATIONS DENIED 0 $0 0 $0 0 $0 APPLICATIONS WITHDRAWN 0 $0 0 $0 0 $0 FILES CLOSED FOR INCOMPLETENESS 0 $0 0 $0 0 $0
Aggregated Statistics For Year 1999(Based on 1 partial tract) A) Conventional B) Refinancings Number Average Value Number Average Value
LOANS ORIGINATED 3 $88,703 1 $39,440 APPLICATIONS APPROVED, NOT ACCEPTED 0 $0 0 $0 APPLICATIONS DENIED 0 $0 0 $0 APPLICATIONS WITHDRAWN 0 $0 0 $0 FILES CLOSED FOR INCOMPLETENESS 0 $0 0 $0
Detailed PMIC statistics for the following Tracts:
0043.14
Sahuarita compared to Arizona state average:
Unemployed percentage significantly below state average. Black race population percentage significantly above state average. Hispanic race population percentage significantly above state average. Foreign-born population percentage significantly above state average. Renting percentage below state average. House age significantly below state average. Number of college students significantly above state average. Percentage of population with a bachelor's degree or higher above state average.
#23 on the list of "Top 101 cities with most building permits per 10,000 residents (population 5,000+)"
#28 on the list of "Top 100 fastest growing cities from 2000 to 2014"
#54 on the list of "Top 101 cities with the most residents born in Hong Kong (population 500+)"
#67 on the list of "Top 101 cities with largest percentage of males in occupations: architecture and engineering occupations (population 5,000+)"
#68 on the list of "Top 101 cities with largest percentage of males in occupations: law enforcement workers including supervisors (population 5,000+)"
#68 on the list of "Top 101 cities with the most residents born in Chile (population 500+)"
#11 on the list of "Top 101 counties with the highest Particulate Matter (PM10 ) Annual air pollution readings in 2012 (µg/m3 )"
#14 on the list of "Top 101 counties with the highest ground withdrawal of fresh water for public supply"
#29 on the list of "Top 101 counties with the highest carbon monoxide air pollution readings in 2012 (ppm)"
#35 on the list of "Top 101 counties with the most Other congregations"
#45 on the list of "Top 101 counties with the highest total withdrawal of fresh water for public supply (pop. 50,000+)"
Top Patent Applicants
Shaun E. Harrington (11)
Troy K. Becicka (11)
Karl Garsha (8)
Carl V. Cox (7)
Yakov Epshteyn (7)
Matthew C. Shaw (7)
Carl Cox (6)
Alan G. Mcclure (6)
Kyler A. Anderson (5)
Matthew R. Craig (5)
Total of 213 patent applications in 2008-2024.


 Recent articles from our blog. Our writers, many of them Ph.D. graduates or candidates, create easy-to-read articles on a wide variety of topics.

 (9.8 miles
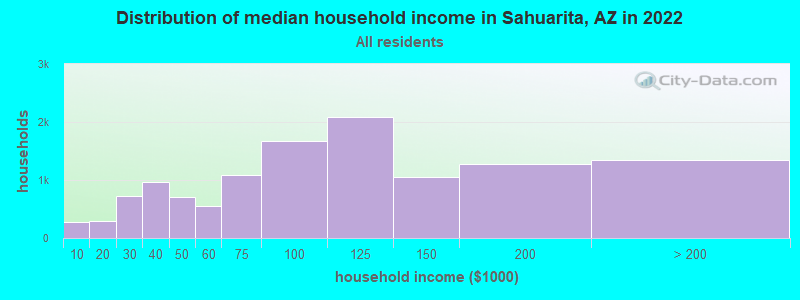


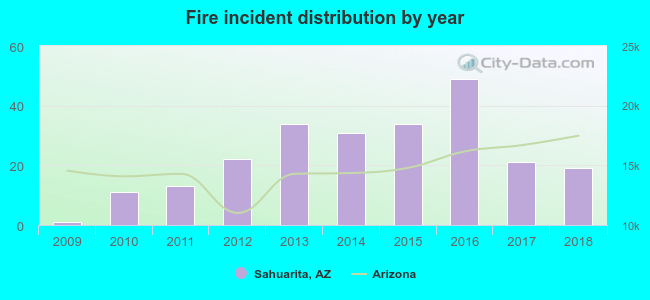 Based on the data from the years 2009 - 2018 the average number of fire incidents per year is 24. The highest number of fire incidents - 49 took place in 2016, and the least - 1 in 2009. The data has an increasing trend.
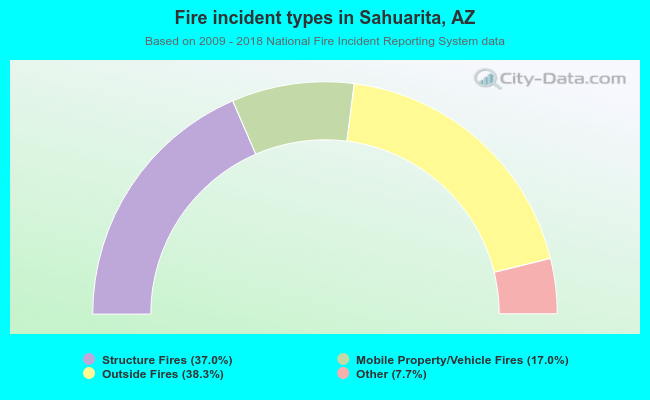 When looking into fire subcategories, the most incidents belonged to: Outside Fires (38.3%), and Structure Fires (37.0%).