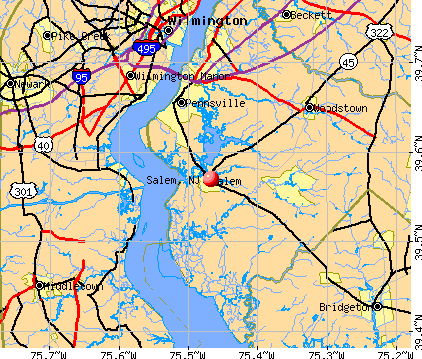
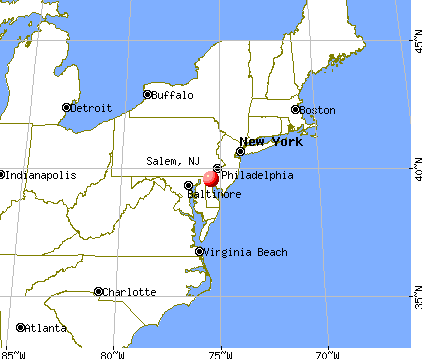
Salem, New Jersey
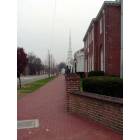
Salem: salem city, nj
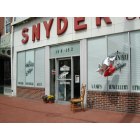
Salem: George's Fault Antiques, West Broadway, Salem, New Jersey
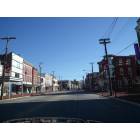
Salem: Looking down Market St.
- add
your
Submit your own pictures of this city and show them to the world
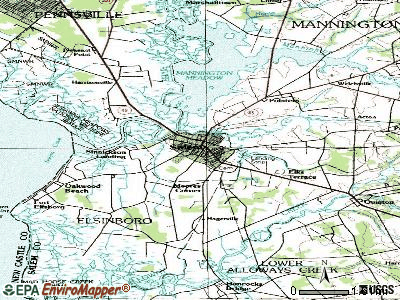
- OSM Map
- General Map
- Google Map
- MSN Map
Population change since 2000: -9.1%
 |
| Males: 2,378 | |
| Females: 2,946 |
| Median resident age: | 34.0 years |
| New Jersey median age: | 40.4 years |
Zip codes: 08079.
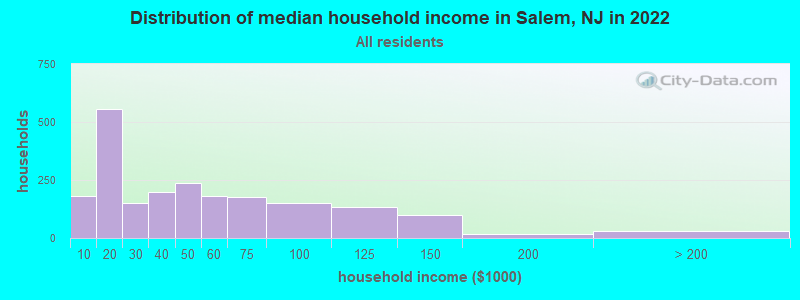
| Salem: | $37,308 |
| NJ: | $96,346 |
Estimated per capita income in 2022: $23,525 (it was $13,559 in 2000)
Salem city income, earnings, and wages data
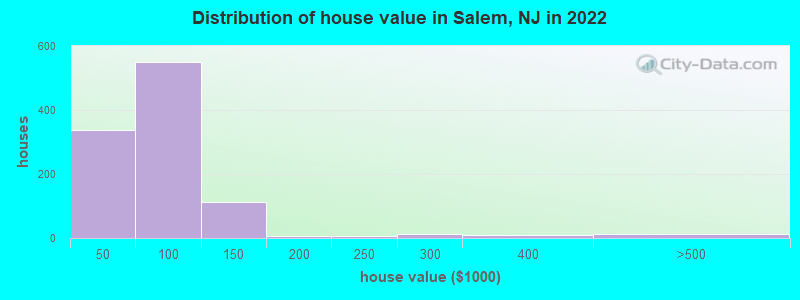
Estimated median house or condo value in 2022: $72,761 (it was $74,100 in 2000)
| Salem: | $72,761 |
| NJ: | $428,900 |
Mean prices in 2022: all housing units: $167,744; detached houses: $169,874; townhouses or other attached units: $143,381
Median gross rent in 2022: $1,049.
(20.0% for White Non-Hispanic residents, 39.1% for Black residents, 20.7% for Hispanic or Latino residents, 36.6% for other race residents, 37.6% for two or more races residents)
Detailed information about poverty and poor residents in Salem, NJ
Compare current foreclosures in Salem, NJ:
| Photo | Address | Area | Beds / Baths | Price | Details |
|---|---|---|---|---|---|

|
#1
W Broadway
Salem, NJ 08079
|
2,869 sq. feet
|
2 baths 3 beds |
$90,900
|
show details |

|
#2
Main St
Salem, NJ 08079
|
1,164 sq. feet
|
1 baths 3 beds |
show details | |

|
#3
Smick Rd
Salem, NJ 08079
|
- sq. feet
|
- baths - beds |
$300,000
|
show details |

|
#4
E Broadway
Salem, NJ 08079
|
- sq. feet
|
- baths - beds |
show details | |

|
#5
7th St
Salem, NJ 08079
|
2,342 sq. feet
|
- baths - beds |
show details | |

|
#6
Eighth St
Salem, NJ 08079
|
928 sq. feet
|
- baths - beds |
show details | |

|
#7
8th St
Salem, NJ 08079
|
928 sq. feet
|
- baths - beds |
show details | |

|
#8
Route 45
Salem, NJ 08079
|
- sq. feet
|
- baths - beds |
show details | |

|
#9
Morrison Ave
Salem, NJ 08079
|
1,786 sq. feet
|
- baths - beds |
show details | |

|
#10
Locust Ave
Salem, NJ 08079
|
- sq. feet
|
- baths - beds |
show details |
| Photo | Address | Area | Beds / Baths | Price | Details |
|---|---|---|---|---|---|

|
#11
Sinnickson St
Salem, NJ 08079
|
1,944 sq. feet
|
- baths - beds |
show details | |

|
#12
E Broadway
Salem, NJ 08079
|
- sq. feet
|
- baths - beds |
show details | |

|
#13
E Broadway # A
Salem, NJ 08079
|
1,749 sq. feet
|
- baths - beds |
show details | |

|
#14
Route 45
Salem, NJ 08079
|
1,433 sq. feet
|
- baths - beds |
show details | |

|
#15
Salem Fort Elfsborg Rd
Salem, NJ 08079
|
- sq. feet
|
- baths - beds |
show details | |

|
#16
Salem Hancocks Bridge Rd
Salem, NJ 08079
|
- sq. feet
|
- baths - beds |
show details | |

|
#17
Johnson St
Salem, NJ 08079
|
1,323 sq. feet
|
- baths - beds |
show details | |

|
#18
7th St
Salem, NJ 08079
|
- sq. feet
|
- baths - beds |
show details | |

|
#19
Main St
Salem, NJ 08079
|
- sq. feet
|
- baths - beds |
show details | |

|
#20
Craven Ave
Salem, NJ 08079
|
1,566 sq. feet
|
- baths - beds |
show details |
| Photo | Address | Area | Beds / Baths | Price | Details |
|---|---|---|---|---|---|

|
#21
Magnolia St
Salem, NJ 08079
|
936 sq. feet
|
- baths - beds |
show details | |

|
#22
Davis Ave
Salem, NJ 08079
|
1,195 sq. feet
|
- baths - beds |
show details | |

|
#23
S 3rd St
Salem, NJ 08079
|
1,286 sq. feet
|
- baths - beds |
show details | |

|
#24
And 374 Magnolia St
Salem, NJ 08079
|
- sq. feet
|
- baths - beds |
show details | |

|
#25
Quinton Marlboro Rd
Salem, NJ 08079
|
652 sq. feet
|
- baths - beds |
show details | |

|
#26
Magnolia St
Salem, NJ 08079
|
- sq. feet
|
- baths - beds |
show details | |

|
#27
Hedge St
Salem, NJ 08079
|
672 sq. feet
|
- baths - beds |
show details | |

|
#28
Waterworks Rd
Salem, NJ 08079
|
- sq. feet
|
- baths - beds |
show details | |

|
#29
E Amwellbury Rd
Salem, NJ 08079
|
3,362 sq. feet
|
- baths - beds |
show details | |

|
#30
8th St
Salem, NJ 08079
|
2,396 sq. feet
|
- baths - beds |
show details |
| Photo | Address | Area | Beds / Baths | Price | Details |
|---|---|---|---|---|---|

|
#31
Walnut St
Salem, NJ 08079
|
- sq. feet
|
- baths - beds |
show details | |

|
#32
E Broadway
Salem, NJ 08079
|
- sq. feet
|
- baths - beds |
show details | |

|
#33
Salem Hancocks Bridge Rd
Salem, NJ 08079
|
1,132 sq. feet
|
- baths - beds |
show details | |

|
#34
Thompson St
Salem, NJ 08079
|
- sq. feet
|
- baths - beds |
show details | |

|
#35
Fenwick Ave
Salem, NJ 08079
|
1,104 sq. feet
|
- baths - beds |
show details | |

|
#36
Harmersville Pecks Cor Rd
Salem, NJ 08079
|
- sq. feet
|
- baths - beds |
show details | |

|
#37
Chestnut St
Salem, NJ 08079
|
2,058 sq. feet
|
- baths - beds |
show details | |

|
#38
Cook Ave
Salem, NJ 08079
|
1,260 sq. feet
|
- baths - beds |
show details | |

|
#39
Hemple Rd
Salem, NJ 08079
|
580 sq. feet
|
- baths - beds |
show details | |

|
#40
New Bridge Rd
Salem, NJ 08079
|
1,788 sq. feet
|
- baths - beds |
show details |
| Photo | Address | Area | Beds / Baths | Price | Details |
|---|---|---|---|---|---|

|
#41
Hedge St
Salem, NJ 08079
|
580 sq. feet
|
- baths - beds |
show details | |

|
#42
Seventh St
Salem, NJ 08079
|
2,342 sq. feet
|
- baths - beds |
show details | |

|
#43
Union St
Salem, NJ 08079
|
- sq. feet
|
- baths - beds |
show details | |

|
#44
E Broadway - 6 Units
Salem, NJ 08079
|
- sq. feet
|
- baths - beds |
show details | |

|
#45
Eighth St
Salem, NJ 08079
|
2,396 sq. feet
|
- baths - beds |
show details | |

|
#46
Seventh St
Salem, NJ Array
|
- sq. feet
|
- baths - beds |
show details | |

|
#47
New Bridge Rd
Salem, NJ 08079
|
- sq. feet
|
- baths - beds |
show details | |

|
#48
Chestnut St
Salem, NJ 08079
|
1,564 sq. feet
|
- baths - beds |
show details | |

|
#49
Hillcrest Ter
Salem, NJ 08079
|
- sq. feet
|
- baths - beds |
show details | |

|
Check over 1 million property listings on Foreclosure.com!
|
browse all offers | |||


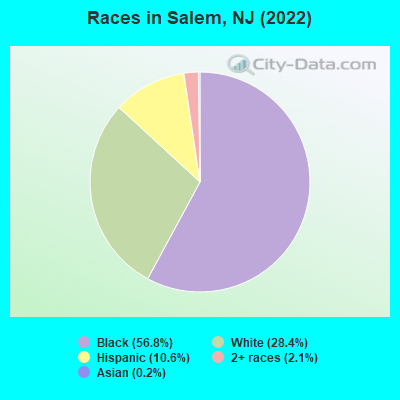
- 3,00456.8%Black alone
- 1,50128.4%White alone
- 55910.6%Hispanic
- 1122.1%Two or more races
- 90.2%Asian alone
Races in Salem detailed stats: ancestries, foreign born residents, place of birth
According to our research of New Jersey and other state lists, there were 27 registered sex offenders living in Salem, New Jersey as of April 27, 2024.
The ratio of all residents to sex offenders in Salem is 183 to 1.
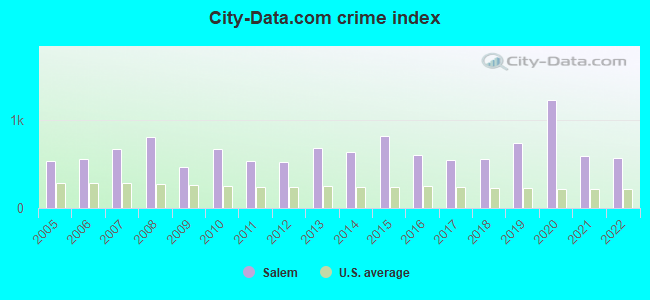
Type |
2009 |
2010 |
2011 |
2012 |
2013 |
2014 |
2015 |
2016 |
2017 |
2018 |
2019 |
2020 |
2021 |
2022 |
|---|---|---|---|---|---|---|---|---|---|---|---|---|---|---|
| Murders (per 100,000) | 0 (0.0) | 3 (58.3) | 0 (0.0) | 0 (0.0) | 3 (58.0) | 1 (20.0) | 1 (20.3) | 3 (61.9) | 1 (20.9) | 2 (42.3) | 2 (42.5) | 11 (236.0) | 4 (85.6) | 3 (56.4) |
| Rapes (per 100,000) | 3 (53.2) | 5 (97.2) | 3 (58.1) | 4 (77.5) | 3 (58.0) | 2 (40.0) | 6 (121.6) | 3 (61.9) | 2 (41.9) | 2 (42.3) | 3 (63.8) | 11 (236.0) | 2 (42.8) | 5 (94.0) |
| Robberies (per 100,000) | 18 (319.1) | 20 (388.7) | 22 (426.1) | 17 (329.6) | 15 (289.9) | 18 (360.3) | 29 (587.9) | 16 (330.0) | 12 (251.3) | 9 (190.4) | 19 (404.1) | 27 (579.3) | 5 (107.0) | 8 (150.4) |
| Assaults (per 100,000) | 29 (514.1) | 33 (641.3) | 39 (755.4) | 28 (542.8) | 33 (637.7) | 46 (920.7) | 42 (851.4) | 31 (639.3) | 39 (816.6) | 30 (634.8) | 49 (1,042) | 47 (1,008) | 51 (1,091) | 63 (1,184) |
| Burglaries (per 100,000) | 76 (1,347) | 74 (1,438) | 66 (1,278) | 78 (1,512) | 89 (1,720) | 79 (1,581) | 117 (2,372) | 74 (1,526) | 74 (1,549) | 75 (1,587) | 77 (1,638) | 53 (1,137) | 29 (620.6) | 18 (338.4) |
| Thefts (per 100,000) | 151 (2,677) | 160 (3,109) | 138 (2,673) | 180 (3,490) | 219 (4,232) | 193 (3,863) | 176 (3,568) | 95 (1,959) | 120 (2,513) | 129 (2,730) | 124 (2,637) | 87 (1,867) | 72 (1,541) | 55 (1,034) |
| Auto thefts (per 100,000) | 17 (301.4) | 5 (97.2) | 4 (77.5) | 6 (116.3) | 5 (96.6) | 5 (100.1) | 13 (263.5) | 9 (185.6) | 12 (251.3) | 17 (359.7) | 26 (553.0) | 18 (386.2) | 18 (385.2) | 18 (338.4) |
| Arson (per 100,000) | 1 (17.7) | 7 (136.0) | 3 (58.1) | 1 (19.4) | 2 (38.6) | 5 (100.1) | 1 (20.3) | 2 (41.2) | 0 (0.0) | 11 (232.8) | 12 (255.2) | 1 (21.5) | 2 (42.8) | 1 (18.8) |
| City-Data.com crime index | 466.6 | 672.0 | 528.0 | 524.2 | 674.2 | 637.5 | 814.3 | 600.1 | 543.1 | 551.6 | 730.1 | 1221.4 | 591.7 | 562.1 |
The City-Data.com crime index weighs serious crimes and violent crimes more heavily. Higher means more crime, U.S. average is 246.1. It adjusts for the number of visitors and daily workers commuting into cities.
Crime rate in Salem detailed stats: murders, rapes, robberies, assaults, burglaries, thefts, arson
Full-time law enforcement employees in 2021, including police officers: 18 (17 officers - 15 male; 2 female).
| Officers per 1,000 residents here: | 3.64 |
| New Jersey average: | 5.53 |
 Recent articles from our blog. Our writers, many of them Ph.D. graduates or candidates, create easy-to-read articles on a wide variety of topics.

 | Why Is South/Central Jersey So Relatively Undeveloped? (83 replies) |
| President Trump is Coming to Wildwood, NJ (85 replies) |
| What’s the story with Camden? (82 replies) |
| Looking for a park / wildlife refuge in Salem County (3 replies) |
| Going home (15 replies) |
| CALLING all soliders that served at Fort Dix in 1989 (78 replies) |
Latest news from Salem, NJ collected exclusively by city-data.com from local newspapers, TV, and radio stations
Ancestries: English (5.2%), Irish (3.2%), Italian (2.9%), German (2.8%), American (1.2%).
Current Local Time: EST time zone
Elevation: 19 feet
Land area: 2.61 square miles.
Population density: 2,040 people per square mile (low).
122 residents are foreign born (1.6% Latin America, 0.4% Europe).
| This city: | 2.3% |
| New Jersey: | 23.2% |
Median real estate property taxes paid for housing units with mortgages in 2022: $3,640 (4.9%)
Median real estate property taxes paid for housing units with no mortgage in 2022: $2,978 (4.0%)
Nearest city with pop. 50,000+: Wilmington, DE  (13.2 miles , pop. 72,664).
Nearest city with pop. 200,000+: Philadelphia, PA (34.2 miles , pop. 1,517,550).
Nearest cities:
), ), ), ), )Latitude: 39.57 N, Longitude: 75.47 W
Daytime population change due to commuting: +484 (+9.1%)
Workers who live and work in this city: 505 (26.1%)
Area codes: 856, 609
Salem, New Jersey accommodation & food services, waste management - Economy and Business Data
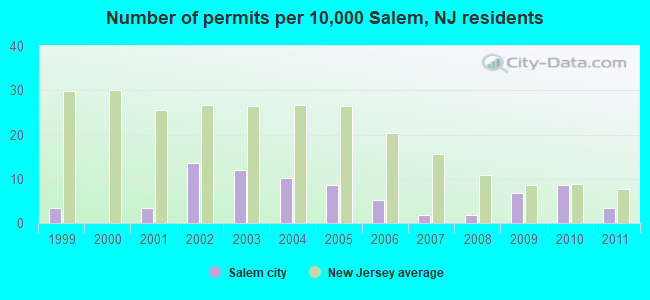
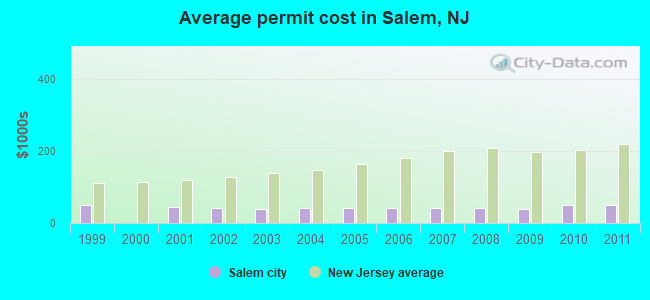
Single-family new house construction building permits:
- 2011: 2 buildings, average cost: $51,300
- 2010: 5 buildings, average cost: $51,300
- 2009: 4 buildings, average cost: $38,400
- 2008: 1 building, cost: $40,900
- 2007: 1 building, cost: $40,900
- 2006: 3 buildings, average cost: $40,900
- 2005: 5 buildings, average cost: $40,900
- 2004: 6 buildings, average cost: $41,000
- 2003: 7 buildings, average cost: $40,200
- 2002: 8 buildings, average cost: $41,500
- 2001: 2 buildings, average cost: $43,900
- 1999: 2 buildings, average cost: $50,500
| Here: | 5.9% |
| New Jersey: | 4.5% |
- Health care (11.7%)
- Construction (8.6%)
- Public administration (7.1%)
- Educational services (6.5%)
- Accommodation & food services (5.3%)
- Administrative & support & waste management services (4.7%)
- Plastics & rubber products (3.4%)
- Construction (19.6%)
- Administrative & support & waste management services (6.2%)
- Plastics & rubber products (5.6%)
- Food (4.4%)
- Accommodation & food services (3.9%)
- Nonmetallic mineral products (3.7%)
- Repair & maintenance (3.6%)
- Health care (19.3%)
- Public administration (10.1%)
- Educational services (9.1%)
- Accommodation & food services (6.4%)
- Social assistance (4.9%)
- Finance & insurance (4.1%)
- Administrative & support & waste management services (3.5%)
- Other production occupations, including supervisors (6.7%)
- Laborers and material movers, hand (5.0%)
- Nursing, psychiatric, and home health aides (4.3%)
- Other office and administrative support workers, including supervisors (3.5%)
- Information and record clerks, except customer service representatives (3.4%)
- Material recording, scheduling, dispatching, and distributing workers (3.4%)
- Counselors, social workers, and other community and social service specialists (3.2%)
- Other production occupations, including supervisors (9.9%)
- Laborers and material movers, hand (8.6%)
- Driver/sales workers and truck drivers (5.5%)
- Electrical equipment mechanics and other installation, maintenance, and repair workers, including supervisors (5.5%)
- Other material moving workers, except laborers (4.5%)
- Metal workers and plastic workers (4.3%)
- Other transportation occupations (3.2%)
- Nursing, psychiatric, and home health aides (7.3%)
- Other office and administrative support workers, including supervisors (6.3%)
- Information and record clerks, except customer service representatives (6.1%)
- Counselors, social workers, and other community and social service specialists (4.5%)
- Other production occupations, including supervisors (4.2%)
- Material recording, scheduling, dispatching, and distributing workers (3.9%)
- Cooks and food preparation workers (3.8%)
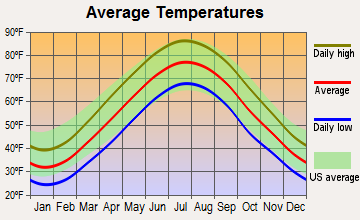
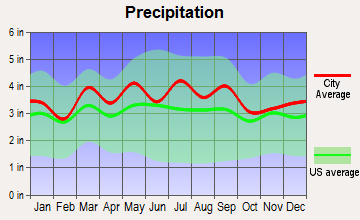
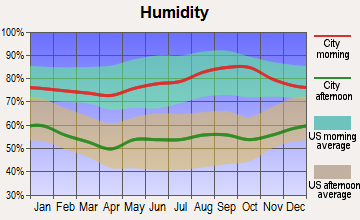
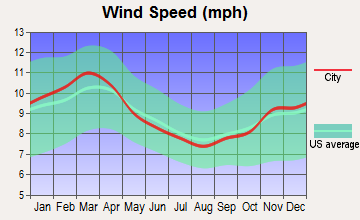
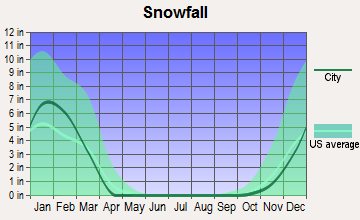
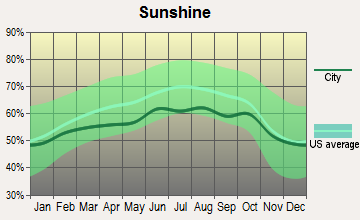
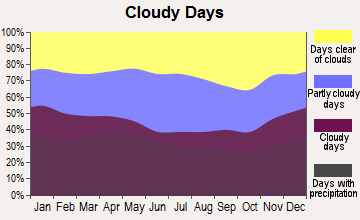
Average climate in Salem, New Jersey
Based on data reported by over 4,000 weather stations
|
|

(lower is better)
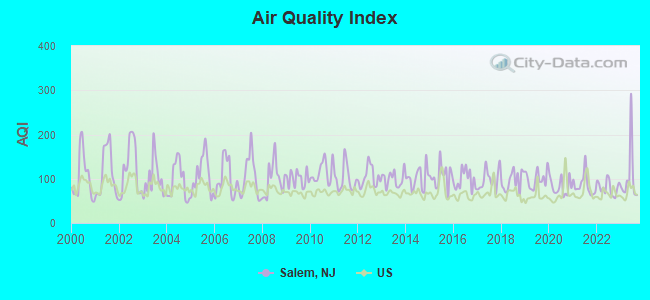
Air Quality Index (AQI) level in 2023 was 103. This is significantly worse than average.
| City: | 103 |
| U.S.: | 73 |
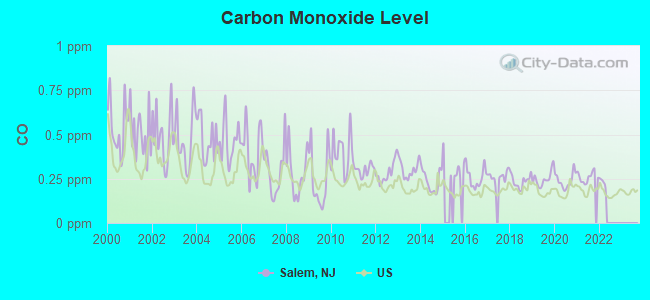
Carbon Monoxide (CO) [ppm] level in 2021 was 0.259. This is about average. Closest monitor was 7.3 miles away from the city center.
| City: | 0.259 |
| U.S.: | 0.251 |
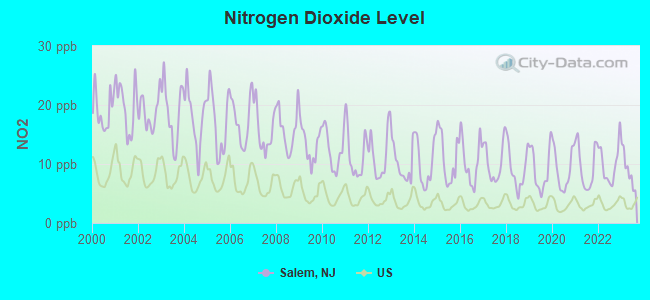
Nitrogen Dioxide (NO2) [ppb] level in 2023 was 8.99. This is significantly worse than average. Closest monitor was 7.8 miles away from the city center.
| City: | 8.99 |
| U.S.: | 5.11 |
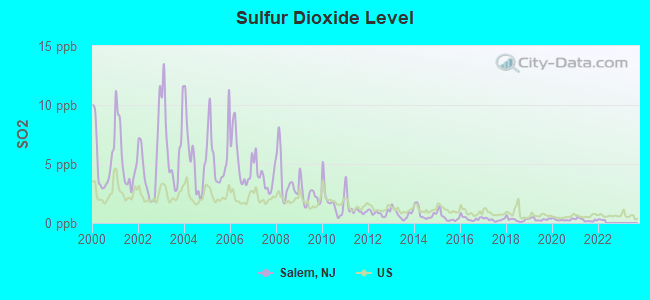
Sulfur Dioxide (SO2) [ppb] level in 2021 was 0.256. This is significantly better than average. Closest monitor was 7.3 miles away from the city center.
| City: | 0.256 |
| U.S.: | 1.515 |
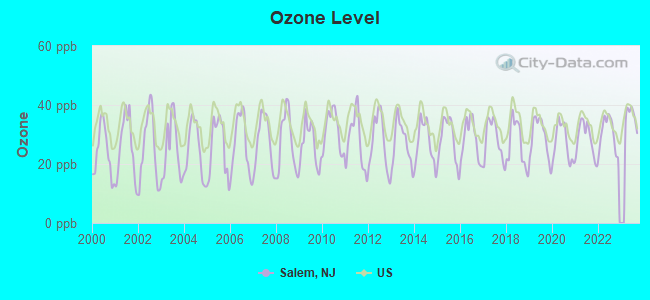
Ozone [ppb] level in 2023 was 36.2. This is about average. Closest monitor was 7.8 miles away from the city center.
| City: | 36.2 |
| U.S.: | 33.3 |
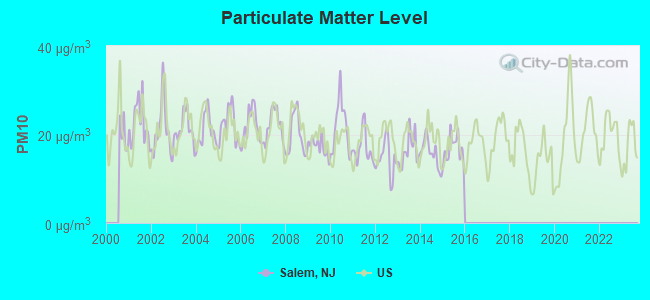
Particulate Matter (PM10) [µg/m3] level in 2015 was 16.7. This is about average. Closest monitor was 11.6 miles away from the city center.
| City: | 16.7 |
| U.S.: | 19.2 |
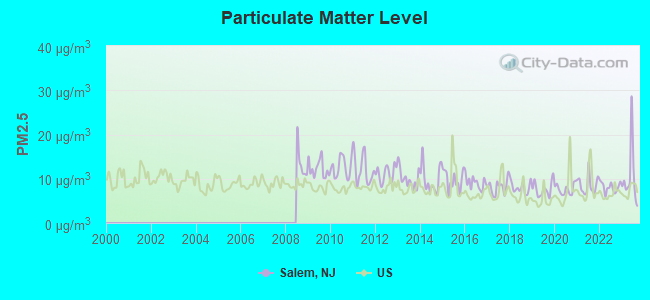
Particulate Matter (PM2.5) [µg/m3] level in 2023 was 10.4. This is worse than average. Closest monitor was 7.3 miles away from the city center.
| City: | 10.4 |
| U.S.: | 8.1 |
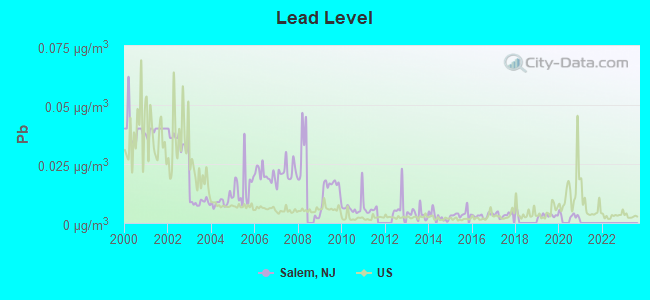
Lead (Pb) [µg/m3] level in 2020 was 0.00328. This is significantly better than average. Closest monitor was 0.8 miles away from the city center.
| City: | 0.00328 |
| U.S.: | 0.00931 |
Tornado activity:
Salem-area historical tornado activity is slightly above New Jersey state average. It is 4% smaller than the overall U.S. average.
On 4/28/1961, a category F3 (max. wind speeds 158-206 mph) tornado 8.8 miles away from the Salem city center caused between $5000 and $50,000 in damages.
On 7/27/1994, a category F3 tornado 20.0 miles away from the city center injured 11 people and caused between $500,000 and $5,000,000 in damages.
Earthquake activity:
Salem-area historical earthquake activity is significantly above New Jersey state average. It is 65% smaller than the overall U.S. average.On 8/23/2011 at 17:51:04, a magnitude 5.8 (5.8 MW, Depth: 3.7 mi, Class: Moderate, Intensity: VI - VII) earthquake occurred 175.8 miles away from the city center
On 1/16/1994 at 01:49:16, a magnitude 4.6 (4.6 MB, 4.6 LG, Depth: 3.1 mi, Class: Light, Intensity: IV - V) earthquake occurred 60.6 miles away from Salem center
On 11/30/2017 at 21:47:31, a magnitude 4.1 (4.1 MW, Depth: 6.1 mi) earthquake occurred 25.8 miles away from Salem center
On 1/16/1994 at 00:42:43, a magnitude 4.2 (4.2 MB, 4.0 LG, Depth: 3.1 mi) earthquake occurred 59.7 miles away from the city center
On 10/7/1983 at 10:18:46, a magnitude 5.3 (5.1 MB, 5.3 LG, 5.1 ML) earthquake occurred 308.7 miles away from the city center
On 9/25/1998 at 19:52:52, a magnitude 5.2 (4.8 MB, 4.3 MS, 5.2 LG, 4.5 MW, Depth: 3.1 mi) earthquake occurred 291.1 miles away from Salem center
Magnitude types: regional Lg-wave magnitude (LG), body-wave magnitude (MB), local magnitude (ML), surface-wave magnitude (MS), moment magnitude (MW)
Natural disasters:
The number of natural disasters in Salem County (22) is greater than the US average (15).Major Disasters (Presidential) Declared: 13
Emergencies Declared: 9
Causes of natural disasters: Hurricanes: 6, Floods: 3, Heavy Rains: 3, Snowstorms: 3, Storms: 3, Blizzards: 2, Water Shortages: 2, Winds: 2, Tornado: 1, Tropical Storm: 1, Winter Storm: 1, Other: 3 (Note: some incidents may be assigned to more than one category).
Hospitals and medical centers in Salem:
- MEMORIAL HOSPITAL OF SALEM COUNTY (Voluntary non-profit - Private, 310 WOODSTOWN ROAD)
- GOLDEN REHABILITATION AND NURSING CENTER (438 SALEM-WOODSTOWN ROAD)
- SALEM NH IND (438 WOODSTOWN RD)
- RCG SALEM DIALYSIS CTR (310 WOODSTOWN ROAD)
- HOMECARE AND HOSPICECARE OF SOUTH JERSEY (FENWICK PLAZA BROADWAY AND WALNUT)
Airports and heliports located in Salem:
- Rainbow's End Airport (JY39) (Runways: 1)
- Salem Airfield Airport (NJ74) (Runways: 1)
- Taildragger Acres Airport (24NJ) (Runways: 1)
- Seabrook Heliport (4NJ3)
- Southern Training Center Heliport (48NJ)
Amtrak stations near Salem:
- 13 miles: WILMINGTON (M. L. KING BLVD, & FRENCH ST.) . Services: ticket office, partially wheelchair accessible, enclosed waiting area, public restrooms, public payphones, snack bar, ATM, paid short-term parking, paid long-term parking, car rental agency, taxi stand, intercity bus service, public transit connection.
- 17 miles: NEWARK (429 S. COLLEGE AVE.) . Services: public payphones, free short-term parking, call for car rental service, call for taxi service, public transit connection.
Nuclear power plants:
- Salem 2. General Electric Co.Public Service Electric & Gas Co.Westinghouse Electric Corp.Public Service Electric & Gas Co.Pressurized Water Reactor (PWR). Net Output: 1106 MWe. Operable. Initial criticality: 08/1980. Commercial start: 10/1981..
- Hope Creek . General Electric Co.Bechtel Corp.General Electric Co.Public Service Electric & Gas Co.Boiling Water Reactor (BWR). Net Output: 1031 MWe. Operable. Initial criticality: 06/1986. Commercial start: 12/1986..
- Salem 1. Westinghouse Electric Corp.Public Service Electric & Gas Co.Westinghouse Electric Corp.Public Service Electric & Gas Co.Pressurized Water Reactor (PWR). Net Output: 1106 MWe. Operable. Initial criticality: 12/1976. Commercial start: 06/1977..
Colleges/universities with over 2000 students nearest to Salem:
- Wilmington University (about 11 miles; New Castle, DE; Full-time enrollment: 10,072)
- Delaware Technical Community College-Stanton/Wilmington (about 13 miles; Wilmington, DE; FT enrollment: 4,972)
- University of Delaware (about 18 miles; Newark, DE; FT enrollment: 20,078)
- Rowan University (about 21 miles; Glassboro, NJ; FT enrollment: 10,632)
- Widener University-Main Campus (about 22 miles; Chester, PA; FT enrollment: 4,051)
- Neumann University (about 22 miles; Aston, PA; FT enrollment: 2,622)
- Gloucester County College (about 24 miles; Sewell, NJ; FT enrollment: 5,490)
Public high schools in Salem:
- SALEM HIGH SCHOOL (Students: 566, Location: 219 WALNUT ST, Grades: 9-12)
- ALTERNATIVE MS/HS (Students: 31, Location: 118 WALNUT STREET, Grades: 6-12)
Public elementary/middle schools in Salem:
- SALEM MIDDLE SCHOOL (Students: 512, Location: 51 NEW MARKET STREET, Grades: 3-8)
- JOHN FENWICK ACADEMY (Students: 419, Location: 183 SMITH STREET, Grades: PK-2)
- LOWER ALLOWAYS CREEK ELEMENTARY SCHOOL (Students: 236, Location: 967 MAIN ST CANTON, Grades: PK-8)
- MANNINGTON TOWNSHIP ELEMENTARY SCHOOL (Students: 154, Location: 495 ROUTE 45, Grades: PK-8)
- ELSINBORO TOWNSHIP SCHOOL (Students: 108, Location: 631 SALEM FORT ELFSBORG ROAD, Grades: KG-8)
Points of interest:
Notable locations in Salem: Majors Wharf (A), Fenwick Community Ambulance (B), North Bend Hose Company (C), Washington Fire Company 3 (D), Union Fire Company 1 (E), Liberty Fire Company 2 (F). Display/hide their locations on the map
Creek: Fenwick Creek (A). Display/hide its location on the map
Park in Salem: Market Street Historic District (1). Display/hide its location on the map
Tourist attraction: Salem County Historical Society (Cultural Attractions- Events- & Facilities; 83 Market Street).
Birthplace of: William J. Hughes - Member of the House of Representatives, Goose Goslin - Baseball player, John Chowning - Composer, Lydell Mitchell - Football player, A. B. Brown - Football player, Alexander G. Cattell - Politician, Clement Hall Sinnickson - New Jersey politician, Corey Smith - College football player (Cincinnati Bearcats), Duke Esper - Baseball player, Meg Burton Cahill - Politician.
Drinking water stations with addresses in Salem and their reported violations in the past:
LEISURE ARMS COMPLEX (Population served: 60, Groundwater):Past health violations:VFW POST 253 (Population served: 50, Groundwater):Past monitoring violations:
- MCL, Monthly (TCR) - In AUG-2012, Contaminant: Coliform. Follow-up actions: St Public Notif requested (AUG-21-2012), St Formal NOV issued (AUG-21-2012), St Compliance achieved (SEP-28-2012)
- MCL, Monthly (TCR) - In JUN-2012, Contaminant: Coliform. Follow-up actions: St Public Notif received (JUN-21-2012), St Public Notif requested (JUN-25-2012), St Formal NOV issued (JUN-25-2012), St Compliance achieved (JUL-31-2012)
- MCL, Monthly (TCR) - In MAY-2012, Contaminant: Coliform. Follow-up actions: St Public Notif requested (MAY-25-2012), St Formal NOV issued (MAY-25-2012), St Public Notif received (MAY-29-2012), St Compliance achieved (JUL-31-2012)
- MCL, Acute (TCR) - In JUN-2010, Contaminant: Coliform. Follow-up actions: St Public Notif received (JUN-02-2010), St Compliance achieved (DEC-16-2010)
- MCL, Acute (TCR) - In MAY-2010, Contaminant: Coliform. Follow-up actions: St Public Notif received (JUN-02-2010), St Public Notif requested (JUN-03-2010), St Formal NOV issued (JUN-03-2010), St Compliance achieved (DEC-16-2010)
- Monitoring, Source Water (GWR) - Between AUG-22-2012 and AUG-31-2012, Contaminant: E. COLI. Follow-up actions: St Public Notif requested (SEP-13-2012), St Formal NOV issued (SEP-13-2012), St Compliance achieved (DEC-31-2012)
- Monitoring, Source Water (GWR) - Between JUL-04-2012 and AUG-16-2012, Contaminant: E. COLI. Follow-up actions: St Compliance achieved (2 times from JUN-28-2012 to AUG-16-2012), St Public Notif requested (AUG-31-2012), St Formal NOV issued (AUG-31-2012)
- Monitoring, Source Water (GWR) - Between MAY-24-2012 and JUN-28-2012, Contaminant: E. COLI. Follow-up actions: St Compliance achieved (2 times from JUN-28-2012 to JUN-28-2012), St Public Notif requested (AUG-28-2012), St Formal NOV issued (AUG-28-2012), St Compliance achieved (DEC-31-2012)
- Monitoring, Source Water (GWR) - Between JUN-30-2011 and JUL-01-2011, Contaminant: E. COLI. Follow-up actions: St Compliance achieved (JUN-24-2011), St Public Notif requested (JAN-11-2012), St Formal NOV issued (JAN-11-2012)
- Monitoring, Repeat Major (TCR) - In JUN-2010, Contaminant: Coliform (TCR). Follow-up actions: St Compliance achieved (SEP-29-2010)
- One routine major monitoring violation
Past monitoring violations:
- One routine major monitoring violation
Drinking water stations with addresses in Salem that have no violations reported:
- SALEM WATER DEPARTMENT (Population served: 6,199, Primary Water Source Type: Surface water)
- SUGAR & SPICE PRESCHOOL/DAYCARE (Population served: 25, Primary Water Source Type: Groundwater)
| This city: | 2.4 people |
| New Jersey: | 2.7 people |
| This city: | 58.6% |
| Whole state: | 69.3% |
| This city: | 8.9% |
| Whole state: | 5.9% |
Likely homosexual households (counted as self-reported same-sex unmarried-partner households)
- Lesbian couples: 0.4% of all households
- Gay men: 0.1% of all households
People in group quarters in Salem in 2010:
- 33 people in other noninstitutional facilities
- 21 people in group homes intended for adults
- 4 people in emergency and transitional shelters (with sleeping facilities) for people experiencing homelessness
Banks with branches in Salem (2011 data):
- TD Bank, National Association: Salem Branch at 443 East Broadway, branch established on 1983/11/09. Info updated 2010/10/04: Bank assets: $188,912.6 mil, Deposits: $153,149.8 mil, headquarters in Wilmington, DE, positive income, 1314 total offices, Holding Company: Toronto-Dominion Bank, The
- Fulton Bank of New Jersey: Mannington Branch at 125 Salem-Woodstown Road, branch established on 1993/12/15. Info updated 2012/02/08: Bank assets: $3,408.9 mil, Deposits: $2,816.1 mil, headquarters in Mount Laurel, NJ, negative income in the last year, Commercial Lending Specialization, 74 total offices, Holding Company: Fulton Financial Corporation
- Franklin Bank: Salem Branch at 137 West Broadway, branch established on 1861/01/01. Info updated 2011/07/21: Bank assets: $259.6 mil, Deposits: $208.7 mil, headquarters in Pilesgrove, NJ, positive income, Mortgage Lending Specialization, 6 total offices
- Harvest Community Bank: Salem City Branch at 473 E. Broadway, branch established on 2006/07/26. Info updated 2006/11/03: Bank assets: $191.3 mil, Deposits: $175.7 mil, headquarters in Pennsville, NJ, negative income in the last year, Commercial Lending Specialization, 5 total offices
For population 15 years and over in Salem:
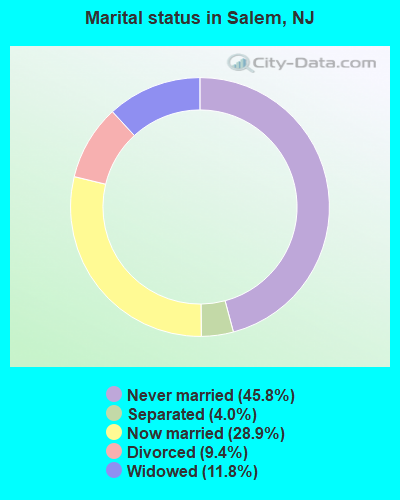
- Never married: 45.8%
- Now married: 28.9%
- Separated: 4.0%
- Widowed: 11.8%
- Divorced: 9.4%
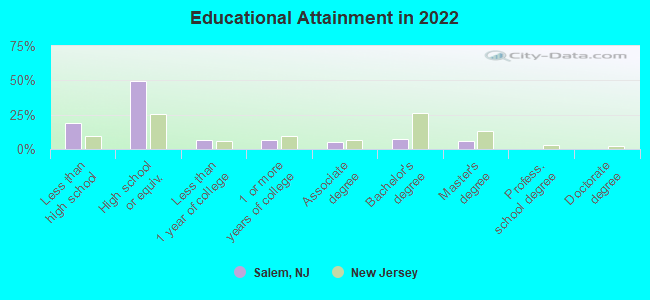
For population 25 years and over in Salem:
- High school or higher: 80.6%
- Bachelor's degree or higher: 11.3%
- Graduate or professional degree: 4.2%
- Unemployed: 10.3%
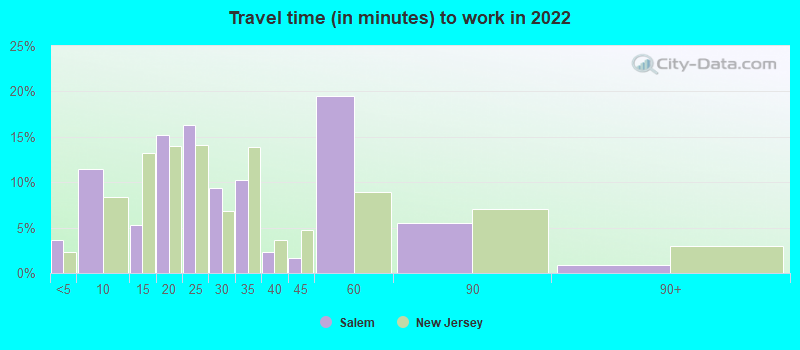
- Mean travel time to work (commute): 23.9 minutes
| Here: | 12.7 |
| New Jersey average: | 12.8 |
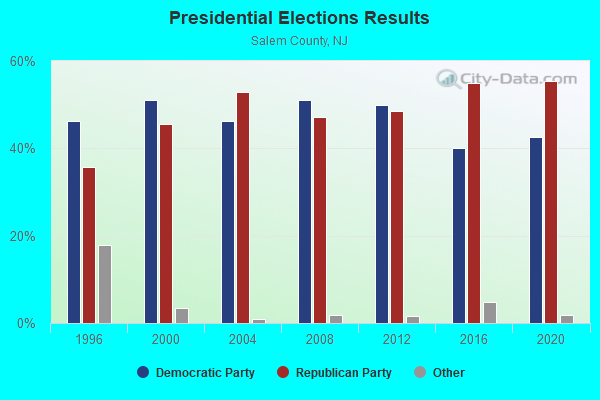
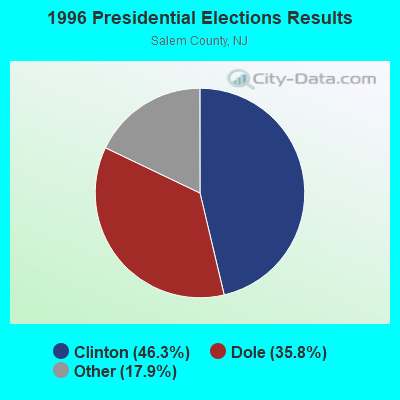
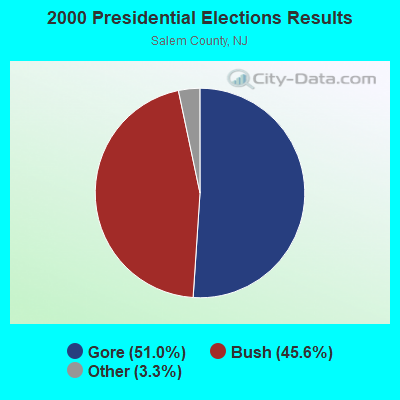
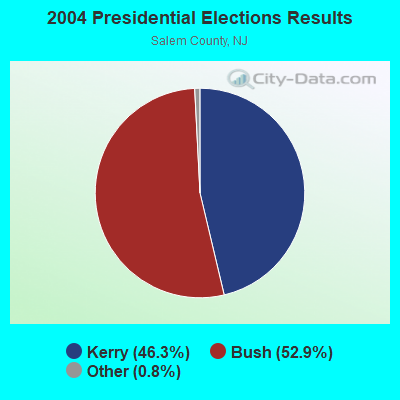
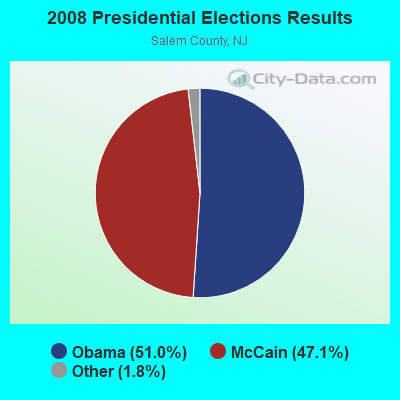
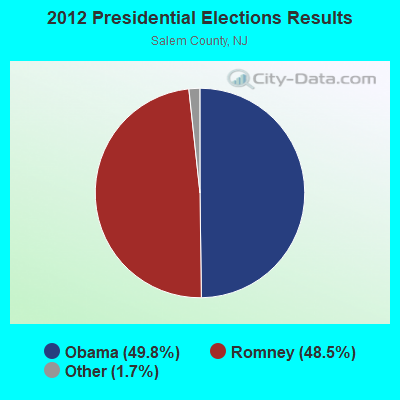
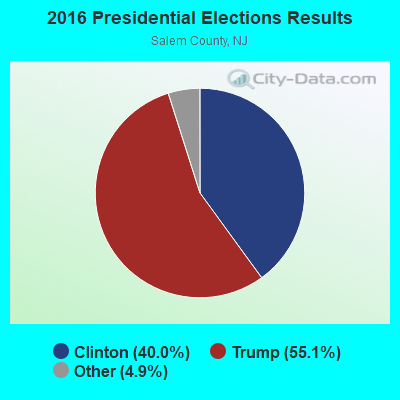
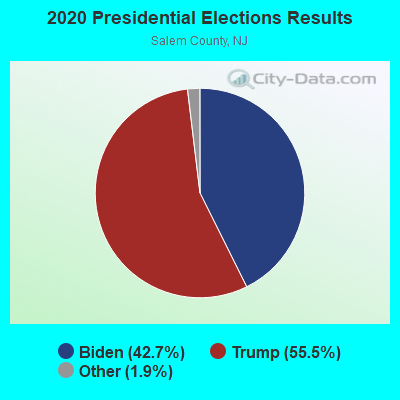
Graphs represent county-level data. Detailed 2008 Election Results
Religion statistics for Salem, NJ (based on Salem County data)
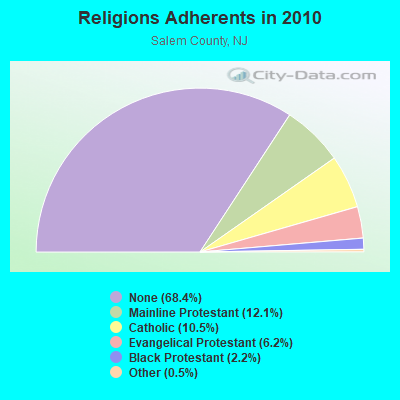
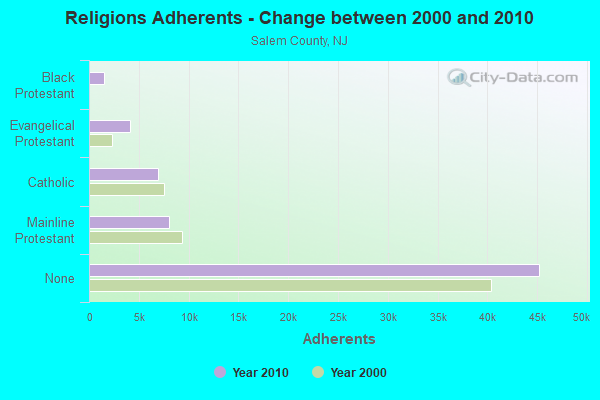
| Religion | Adherents | Congregations |
|---|---|---|
| Mainline Protestant | 7,993 | 42 |
| Catholic | 6,959 | 6 |
| Evangelical Protestant | 4,109 | 35 |
| Black Protestant | 1,467 | 10 |
| Other | 327 | 3 |
| None | 45,228 | - |
Food Environment Statistics:
| This county: | 2.43 / 10,000 pop. |
| New Jersey: | 2.90 / 10,000 pop. |
| Salem County: | 1.82 / 10,000 pop. |
| New Jersey: | 1.76 / 10,000 pop. |
| This county: | 1.67 / 10,000 pop. |
| New Jersey: | 0.81 / 10,000 pop. |
| Salem County: | 4.25 / 10,000 pop. |
| New Jersey: | 7.15 / 10,000 pop. |
| Salem County: | 9.0% |
| New Jersey: | 8.3% |
| Here: | 28.7% |
| New Jersey: | 23.3% |
| Salem County: | 18.8% |
| State: | 18.0% |
Health and Nutrition:
| Salem: | 47.8% |
| New Jersey: | 50.6% |
| Salem: | 43.8% |
| State: | 48.5% |
| Salem: | 29.7 |
| New Jersey: | 28.5 |
| Here: | 19.6% |
| New Jersey: | 20.0% |
| This city: | 13.5% |
| New Jersey: | 11.1% |
| Here: | 6.7 |
| New Jersey: | 6.8 |
| Here: | 35.3% |
| New Jersey: | 33.6% |
| Salem: | 52.6% |
| New Jersey: | 56.9% |
| This city: | 80.1% |
| New Jersey: | 80.0% |
More about Health and Nutrition of Salem, NJ Residents
| Local government employment and payroll (March 2022) | |||||
| Function | Full-time employees | Monthly full-time payroll | Average yearly full-time wage | Part-time employees | Monthly part-time payroll |
|---|---|---|---|---|---|
| Police Protection - Officers | 18 | $108,469 | $72,313 | 2 | $7,460 |
| Streets and Highways | 8 | $38,412 | $57,618 | 0 | $0 |
| Financial Administration | 5 | $17,592 | $42,221 | 3 | $5,671 |
| Housing and Community Development (Local) | 4 | $13,290 | $39,870 | 0 | $0 |
| Sewerage | 3 | $12,884 | $51,536 | 0 | $0 |
| Water Supply | 3 | $15,141 | $60,564 | 0 | $0 |
| Other Government Administration | 3 | $10,337 | $41,348 | 9 | $5,129 |
| Judicial and Legal | 2 | $7,824 | $46,944 | 1 | $1,751 |
| Police - Other | 1 | $3,706 | $44,472 | 11 | $8,415 |
| Water Transport and Terminals | 1 | $2,570 | $30,840 | 0 | $0 |
| Local Libraries | 0 | $0 | 3 | $2,798 | |
| Firefighters | 0 | $0 | 2 | $683 | |
| Totals for Government | 48 | $230,224 | $57,556 | 31 | $31,907 |
Salem government finances - Expenditure in 2021 (per resident):
- Current Operations - Water Utilities: $2,300,000 ($432.01)
Police Protection: $1,920,000 ($360.63)
General - Other: $1,096,000 ($205.86)
Regular Highways: $373,000 ($70.06)
Central Staff Services: $287,000 ($53.91)
Judicial and Legal Services: $256,000 ($48.08)
Financial Administration: $237,000 ($44.52)
Solid Waste Management: $182,000 ($34.18)
Housing and Community Development: $104,000 ($19.53)
General Public Buildings: $74,000 ($13.90)
Libraries: $39,000 ($7.33)
Health - Other: $24,000 ($4.51)
Local Fire Protection: $22,000 ($4.13)
Protective Inspection and Regulation - Other: $22,000 ($4.13)
Parks and Recreation: $17,000 ($3.19)
Parking Facilities: $9,000 ($1.69)
- General - Interest on Debt: $68,000 ($12.77)
- Water Utilities - Interest on Debt: $256,000 ($48.08)
Salem government finances - Revenue in 2021 (per resident):
- Charges - Solid Waste Management: $60,000 ($11.27)
- Miscellaneous - Interest Earnings: $189,000 ($35.50)
General Revenue - Other: $150,000 ($28.17)
Fines and Forfeits: $31,000 ($5.82)
- Revenue - Water Utilities: $2,209,000 ($414.91)
- State Intergovernmental - Other: $1,766,000 ($331.71)
General Local Government Support: $1,183,000 ($222.20)
Highways: $363,000 ($68.18)
- Tax - Property: $4,584,000 ($861.01)
Public Utilities Sales: $53,000 ($9.95)
Other License: $6,000 ($1.13)
Salem government finances - Debt in 2021 (per resident):
- Long Term Debt - Beginning Outstanding - Unspecified Public Purpose: $10,742,000 ($2017.66)
Outstanding Unspecified Public Purpose: $9,881,000 ($1855.94)
Retired Unspecified Public Purpose: $861,000 ($161.72)
Salem government finances - Cash and Securities in 2021 (per resident):
- Bond Funds - Cash and Securities: $14,000 ($2.63)
- Other Funds - Cash and Securities: $3,378,000 ($634.49)
| Businesses in Salem, NJ | ||||
| Name | Count | Name | Count | |
|---|---|---|---|---|
| Advance Auto Parts | 1 | Lane Furniture | 1 | |
| Cricket Wireless | 1 | McDonald's | 1 | |
| FedEx | 1 | Rite Aid | 1 | |
| GNC | 1 | U-Haul | 2 | |
| H&R Block | 1 | UPS | 1 | |
| La-Z-Boy | 1 | |||
Strongest AM radio stations in Salem:
- WFAI (1510 AM; daytime; 2 kW; SALEM, NJ; Owner: QC COMMUNICATIONS,INC.)
- WVCH (740 AM; 50 kW; CHESTER, PA; Owner: WVCH COMMUNICATIONS, INC.)
- WPEN (950 AM; 50 kW; PHILADELPHIA, PA; Owner: GREATER PHILADELPHIA RADIO, INC.)
- WZZD (990 AM; 50 kW; PHILADELPHIA, PA; Owner: PENNSYLVANIA MEDIA ASSOCIATES, INC.)
- KYW (1060 AM; 50 kW; PHILADELPHIA, PA; Owner: INFINITY BROADCASTING OPERATIONS, INC.)
- WPHT (1210 AM; 50 kW; PHILADELPHIA, PA; Owner: INFINITY BROADCASTING OPERATIONS, INC.)
- WNWR (1540 AM; 50 kW; PHILADELPHIA, PA)
- WTMC (1380 AM; 5 kW; WILMINGTON, DE; Owner: STATE OF DELAWARE DEPARTMENT OF TRAN)
- WWJZ (640 AM; 50 kW; MOUNT HOLLY, NJ; Owner: ABC, INC.)
- WDEL (1150 AM; 5 kW; WILMINGTON, DE; Owner: DELMARVA BROADCASTING COMPANY)
- WJBR (1290 AM; 2 kW; WILMINGTON, DE; Owner: CAPSTAR TX LIMITED PARTNERSHIP)
- WCBM (680 AM; 50 kW; BALTIMORE, MD; Owner: WCBM MARYLAND, INC.)
- WWLG (1370 AM; 50 kW; BALTIMORE, MD; Owner: M-10 BROADCASTING, INC.)
Strongest FM radio stations in Salem:
- WPLY (100.3 FM; MEDIA, PA; Owner: RADIO ONE LICENSES, LLC)
- WSNJ-FM (107.7 FM; BRIDGETON, NJ; Owner: COHANZICK BROADCASTING CORPORATION)
- WSTW (93.7 FM; WILMINGTON, DE; Owner: DELMARVA BROADCASTING COMPANY)
- WJKS (101.7 FM; CANTON, NJ; Owner: QC COMMUNICATIONS, INC)
- WJBR-FM (99.5 FM; WILMINGTON, DE; Owner: NM LICENSING, LLC)
- WMGK (102.9 FM; PHILADELPHIA, PA; Owner: GREATER PHILADELPHIA RADIO, INC.)
- WMWX (95.7 FM; PHILADELPHIA, PA; Owner: GREATER PHILADELPHIA RADIO, INC.)
- WOGL (98.1 FM; PHILADELPHIA, PA; Owner: INFINITY BROADCASTING OPERATIONS, INC.)
- WMMR (93.3 FM; PHILADELPHIA, PA; Owner: GREATER BOSTON RADIO, INC.)
- WBEB (101.1 FM; PHILADELPHIA, PA; Owner: WEAZ-FM RADIO, INC.)
- WRTI (90.1 FM; PHILADELPHIA, PA; Owner: TEMPLE UNIV. OF THE COMMONWEALTH, ET)
- WSNI-FM (104.5 FM; PHILADELPHIA, PA; Owner: AMFM RADIO LICENSES, L.L.C.)
- WPHI-FM (103.9 FM; JENKINTOWN, PA; Owner: RADIO ONE LICENSES, LLC)
- WGLS-FM (89.7 FM; GLASSBORO, NJ; Owner: ROWAN UNIVERSITY)
- WHYY-FM (90.9 FM; PHILADELPHIA, PA; Owner: WHYY, INC.)
- WXPN (88.5 FM; PHILADELPHIA, PA; Owner: TRUSTEES OF THE UNIVERSITY OF PENNA.)
- WXTU (92.5 FM; PHILADELPHIA, PA; Owner: WXTU LICENSE LIMITED PARTNERSHIP)
- WDAS-FM (105.3 FM; PHILADELPHIA, PA; Owner: AMFM RADIO LICENSES, L.L.C.)
- WPTP (96.5 FM; PHILADELPHIA, PA; Owner: WDAS LICENSE LIMITED PARTNERSHIP)
- WYSP (94.1 FM; PHILADELPHIA, PA; Owner: INFINITY BROADCASTING OPERATIONS, INC.)
TV broadcast stations around Salem:
- WTSD-CA (Channel 14; WILMINGTON, DE; Owner: PRIORITY COMMUNICATIONS MINISTRIES, INC.)
- WMCN-TV (Channel 53; ATLANTIC CITY, NJ; Owner: LENFEST BROADCASTING, LLC)
- KYW-TV (Channel 3; PHILADELPHIA, PA; Owner: CBS BROADCASTING INC.)
- WPHL-TV (Channel 17; PHILADELPHIA, PA; Owner: TRIBUNE TELEVISION COMPANY)
- WPVI-TV (Channel 6; PHILADELPHIA, PA; Owner: ABC, INC.)
- WPPX (Channel 61; WILMINGTON, DE; Owner: PAXSON PHILADELPHIA LICENSE, INC.)
- WPSG (Channel 57; PHILADELPHIA, PA; Owner: VIACOM STATIONS GROUP OF PHILADELPHIA INC.)
- WUVP (Channel 65; VINELAND, NJ; Owner: UNIVISION PHILADELPHIA LLC)
- WWJT-LP (Channel 7; PHILADELPHIA, PA; Owner: PHILADELPHIA TELEVISION NETWORK, INC)
- WCAU (Channel 10; PHILADELPHIA, PA; Owner: NBC SUBSIDIARY (WCAU-TV), L.P.)
- WGTW (Channel 48; BURLINGTON, NJ; Owner: BRUNSON COMMUNICATIONS, INC.)
- WYBE (Channel 35; PHILADELPHIA, PA; Owner: INDEPENDENCE PUBLIC MEDIA OF PHILADELPHIA, INC.)
- WHYY-TV (Channel 12; WILMINGTON, DE; Owner: WHYY, INC.)
- WNJS (Channel 23; CAMDEN, NJ; Owner: NEW JERSEY PUBLIC BROADCASTING AUTHORITY)
- WTXF-TV (Channel 29; PHILADELPHIA, PA; Owner: FOX TV STATIONS OF PHILADELPHIA)
- WELL-LP (Channel 8; WILLOW GROVE, ETC., PA; Owner: WORD OF GOD FELLOWSHIP, INC.)
- WPSJ-LP (Channel 8; HAMMONTON, ETC., NJ; Owner: ENGLE BROADCASTING)
- W40AZ (Channel 40; WILMINGTON, DE; Owner: NATIONAL MINORITY T.V., INC.)
- W55BT (Channel 55; TALLEYVILLE, DE; Owner: MEDIACASTING LLC)
Medal of Honor Recipients
Medal of Honor Recipient born in Salem: George W. Stewart.
- National Bridge Inventory (NBI) Statistics
- 5Number of bridges
- 66ft / 20.2mTotal length
- $646,000Total costs
- 30,447Total average daily traffic
- 1,132Total average daily truck traffic
- 36,783Total future (year 2040) average daily traffic
FCC Registered Broadcast Land Mobile Towers: 12 (See the full list of FCC Registered Broadcast Land Mobile Towers in Salem, NJ)
FCC Registered Microwave Towers: 8 (See the full list of FCC Registered Microwave Towers in this town)
FCC Registered Paging Towers: 7 (See the full list of FCC Registered Paging Towers)
FCC Registered Maritime Coast & Aviation Ground Towers: 2 (See the full list of FCC Registered Maritime Coast & Aviation Ground Towers)
FCC Registered Amateur Radio Licenses: 39 (See the full list of FCC Registered Amateur Radio Licenses in Salem)
FAA Registered Aircraft: 13 (See the full list of FAA Registered Aircraft in Salem)
| Home Mortgage Disclosure Act Aggregated Statistics For Year 2009 (Based on 3 full tracts) | ||||||||||||
| A) FHA, FSA/RHS & VA Home Purchase Loans | B) Conventional Home Purchase Loans | C) Refinancings | D) Home Improvement Loans | E) Loans on Dwellings For 5+ Families | F) Non-occupant Loans on < 5 Family Dwellings (A B C & D) | |||||||
|---|---|---|---|---|---|---|---|---|---|---|---|---|
| Number | Average Value | Number | Average Value | Number | Average Value | Number | Average Value | Number | Average Value | Number | Average Value | |
| LOANS ORIGINATED | 8 | $101,125 | 11 | $60,182 | 32 | $102,062 | 6 | $39,000 | 1 | $155,000 | 17 | $62,471 |
| APPLICATIONS APPROVED, NOT ACCEPTED | 1 | $83,000 | 0 | $0 | 5 | $79,000 | 2 | $71,500 | 0 | $0 | 1 | $82,000 |
| APPLICATIONS DENIED | 4 | $90,000 | 7 | $65,286 | 39 | $106,974 | 17 | $34,412 | 1 | $175,000 | 9 | $63,222 |
| APPLICATIONS WITHDRAWN | 1 | $185,000 | 2 | $125,500 | 21 | $99,048 | 0 | $0 | 0 | $0 | 4 | $85,000 |
| FILES CLOSED FOR INCOMPLETENESS | 0 | $0 | 1 | $50,000 | 5 | $142,200 | 1 | $128,000 | 0 | $0 | 1 | $50,000 |
Detailed HMDA statistics for the following Tracts: 0219.00 , 0220.00, 0221.00
| Private Mortgage Insurance Companies Aggregated Statistics For Year 2009 (Based on 1 full tract) | ||
| B) Refinancings | ||
|---|---|---|
| Number | Average Value | |
| LOANS ORIGINATED | 1 | $133,000 |
| APPLICATIONS APPROVED, NOT ACCEPTED | 0 | $0 |
| APPLICATIONS DENIED | 0 | $0 |
| APPLICATIONS WITHDRAWN | 0 | $0 |
| FILES CLOSED FOR INCOMPLETENESS | 0 | $0 |
Detailed PMIC statistics for the following Tracts: 0219.00 , 0220.00, 0221.00
2003 - 2018 National Fire Incident Reporting System (NFIRS) incidents
- Fire incident types reported to NFIRS in Salem, NJ
- 57468.8%Structure Fires
- 17721.2%Outside Fires
- 607.2%Mobile Property/Vehicle Fires
- 232.8%Other
 According to the data from the years 2003 - 2018 the average number of fires per year is 52. The highest number of fire incidents - 95 took place in 2008, and the least - 12 in 2013. The data has a dropping trend.
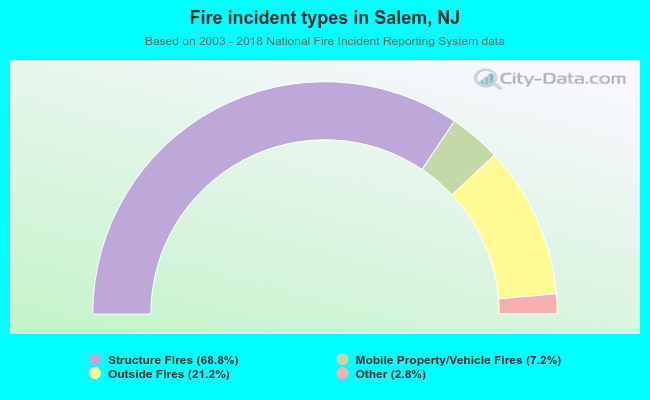 When looking into fire subcategories, the most incidents belonged to: Structure Fires (68.8%), and Outside Fires (21.2%).
- 51.0%Fuel oil, kerosene, etc.
- 43.5%Utility gas
- 5.2%Electricity
- 0.4%Wood
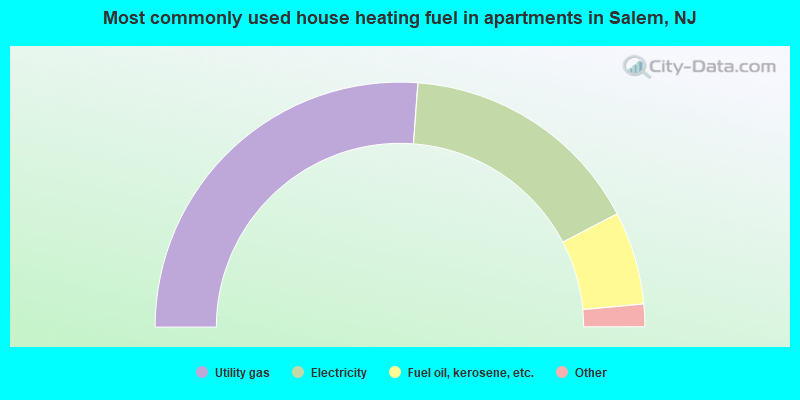
- 52.4%Utility gas
- 32.4%Electricity
- 12.3%Fuel oil, kerosene, etc.
- 2.1%Bottled, tank, or LP gas
- 0.8%No fuel used
Salem compared to New Jersey state average:
- Median household income significantly below state average.
- Median house value significantly below state average.
- Black race population percentage significantly above state average.
- Hispanic race population percentage below state average.
- Median age below state average.
- Foreign-born population percentage significantly below state average.
- Renting percentage above state average.
- Length of stay since moving in significantly above state average.
- Number of college students below state average.
- Percentage of population with a bachelor's degree or higher significantly below state average.
Salem on our top lists:
- #12 on the list of "Top 101 cities with the highest percentage of single-parent households, population 5,000+"
- #25 on the list of "Top 101 cities with the most people below the poverty level, excluding cities with 15% or more of residents in college and with the median age below 28 (population 5,000+)"
- #35 on the list of "Top 101 cities with the least cars per house, population 5,000+"
- #62 on the list of "Top 101 cities with the most people below 50% of the poverty level, excluding cities with 15% or more of residents in college and with the median age below 28 (population 5,000+)"
- #69 on the list of "Top 101 cities with the highest number of police officers per 1000 residents (population 5,000+)"
- #74 on the list of "Top 101 cities with the lowest cost per building permit(population 5,000+)"
- #90 on the list of "Top 101 cities with the largest percentage population decrease from 2000 (population 5,000+)"
- #52 on the list of "Top 101 counties with the lowest surface withdrawal of fresh water for public supply (pop. 50,000+)"
- #97 on the list of "Top 101 counties with the lowest total withdrawal of fresh water for public supply (pop. 50,000+)"

|
|
Total of 21 patent applications in 2008-2024.