New Castle, Delaware

New Castle: Bug life in New Castle De
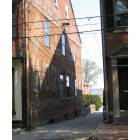
New Castle: Looking down an alley toward the Delaware River
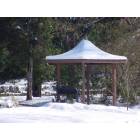
New Castle: SNOW IN NEW CASTLE
- add
your
Submit your own pictures of this city and show them to the world
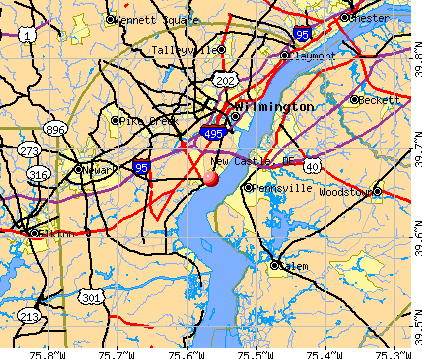
- OSM Map
- General Map
- Google Map
- MSN Map
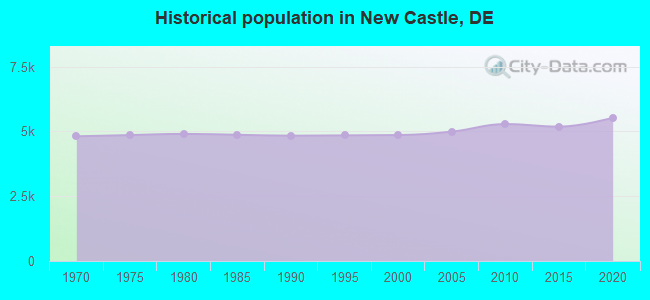
Population change since 2000: +13.8%
 |
| Males: 2,716 | |
| Females: 2,817 |
| Median resident age: | 50.2 years |
| Delaware median age: | 41.5 years |
Zip codes: 19720.
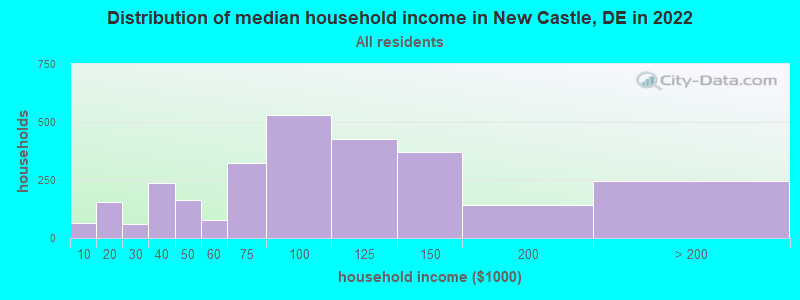
| New Castle: | $96,683 |
| DE: | $82,174 |
Estimated per capita income in 2022: $52,909 (it was $24,052 in 2000)
New Castle city income, earnings, and wages data
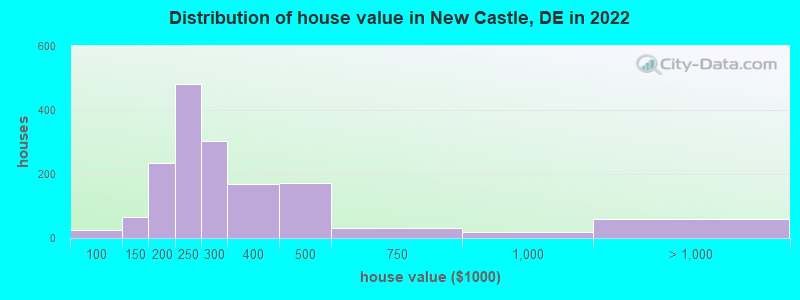
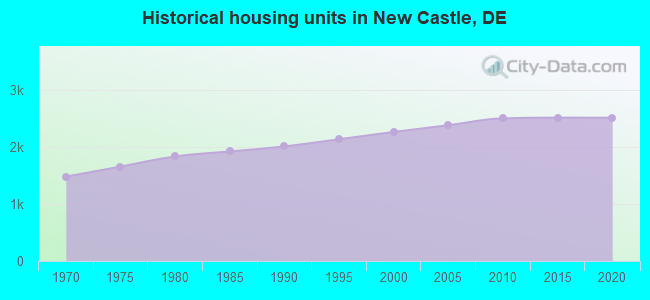
Estimated median house or condo value in 2022: $255,387 (it was $121,600 in 2000)
| New Castle: | $255,387 |
| DE: | $337,200 |
Mean prices in 2022: all housing units: $280,509; detached houses: $286,562; townhouses or other attached units: $281,065; in 5-or-more-unit structures: $138,018; mobile homes: $97,424
Median gross rent in 2022: $1,512.
(3.9% for White Non-Hispanic residents, 5.0% for Black residents, 2.4% for Hispanic or Latino residents, 33.9% for two or more races residents)
Detailed information about poverty and poor residents in New Castle, DE

Compare current foreclosures in New Castle, DE:
| Photo | Address | Area | Beds / Baths | Price | Details |
|---|---|---|---|---|---|

|
#1
Jefferson Ave
New Castle, DE 19720
|
1,152 sq. feet
|
1 baths 3 beds |
show details | |

|
#2
Lea Rd
New Castle, DE 19720
|
1,000 sq. feet
|
1 baths 3 beds |
show details | |

|
#3
Stockton Dr
New Castle, DE 19720
|
- sq. feet
|
1 baths 4 beds |
show details | |

|
#4
Cornwall Rd
New Castle, DE 19720
|
- sq. feet
|
1 baths 3 beds |
show details | |

|
#5
Betel Dr
New Castle, DE 19720
|
- sq. feet
|
2 baths 4 beds |
show details | |

|
#6
W Van Buren Ave
New Castle, DE 19720
|
- sq. feet
|
1 baths 4 beds |
show details | |

|
#7
Onaway Pl
New Castle, DE 19720
|
- sq. feet
|
1 baths 3 beds |
show details | |

|
#8
S Booth Dr
New Castle, DE 19720
|
- sq. feet
|
1 baths 4 beds |
show details | |

|
#9
Lambson Ln
New Castle, DE 19720
|
- sq. feet
|
1 baths 3 beds |
show details | |

|
#10
W 9th St
New Castle, DE 19720
|
- sq. feet
|
1 baths 3 beds |
show details |
| Photo | Address | Area | Beds / Baths | Price | Details |
|---|---|---|---|---|---|

|
#11
Halcyon Dr
New Castle, DE 19720
|
- sq. feet
|
1 baths 4 beds |
show details | |

|
#12
Martin Dr
New Castle, DE 19720
|
- sq. feet
|
1 baths 3 beds |
show details | |

|
#13
Lambson Ln
New Castle, DE 19720
|
- sq. feet
|
1 baths 3 beds |
show details | |

|
#14
Staghorn Dr
New Castle, DE 19720
|
- sq. feet
|
2 baths 3 beds |
show details | |

|
#15
Casimir Dr
New Castle, DE 19720
|
- sq. feet
|
1 baths 3 beds |
show details | |

|
#16
W 10th St
New Castle, DE 19720
|
- sq. feet
|
2 baths 3 beds |
show details | |

|
#17
Ermine Dr
New Castle, DE 19720
|
- sq. feet
|
2 baths 4 beds |
show details | |

|
#18
Russell Rd
New Castle, DE 19720
|
- sq. feet
|
1 baths 3 beds |
show details | |

|
#19
Stonebridge Blvd
New Castle, DE 19720
|
- sq. feet
|
2 baths 2 beds |
show details | |

|
#20
Berkely Way
New Castle, DE 19720
|
- sq. feet
|
1 baths 3 beds |
show details |
| Photo | Address | Area | Beds / Baths | Price | Details |
|---|---|---|---|---|---|

|
#21
Dillon Dr
New Castle, DE 19720
|
- sq. feet
|
1 baths 2 beds |
show details | |

|
#22
Hardy Rd
New Castle, DE 19720
|
- sq. feet
|
1 baths 3 beds |
show details | |

|
#23
Oakmont Dr
New Castle, DE 19720
|
- sq. feet
|
1 baths 3 beds |
show details | |

|
#24
Garden Ln
New Castle, DE 19720
|
- sq. feet
|
1 baths 2 beds |
show details | |

|
#25
Lea Rd
New Castle, DE 19720
|
- sq. feet
|
1 baths 3 beds |
show details | |

|
#26
Freedom Trl
New Castle, DE 19720
|
- sq. feet
|
1 baths 3 beds |
show details | |

|
#27
Dunsinane Dr
New Castle, DE 19720
|
- sq. feet
|
1 baths 3 beds |
show details | |

|
#28
Single Ave
New Castle, DE 19720
|
- sq. feet
|
2 baths 4 beds |
show details | |

|
#29
Sugarberry Dr
New Castle, DE 19720
|
- sq. feet
|
1 baths 3 beds |
show details | |

|
#30
Parma Ave
New Castle, DE 19720
|
- sq. feet
|
1 baths 3 beds |
show details |
| Photo | Address | Area | Beds / Baths | Price | Details |
|---|---|---|---|---|---|

|
#31
Halcyon Dr
New Castle, DE 19720
|
- sq. feet
|
1 baths 3 beds |
show details | |

|
#32
Morrison Rd
New Castle, DE 19720
|
- sq. feet
|
2 baths 3 beds |
show details | |

|
#33
Karlyn Dr
New Castle, DE 19720
|
- sq. feet
|
1 baths 3 beds |
show details | |

|
#34
Booker Cir
New Castle, DE 19720
|
- sq. feet
|
1 baths 3 beds |
show details | |

|
#35
W Edinburgh Dr
New Castle, DE 19720
|
- sq. feet
|
1 baths 3 beds |
show details | |

|
#36
Luray Rd
New Castle, DE 19720
|
- sq. feet
|
1 baths 4 beds |
show details | |

|
#37
Moores Ln
New Castle, DE 19720
|
- sq. feet
|
1 baths 3 beds |
show details | |

|
#38
Cornwall Rd
New Castle, DE 19720
|
- sq. feet
|
1 baths 3 beds |
show details | |

|
#39
Commonwealth Blvd
New Castle, DE 19720
|
- sq. feet
|
1 baths 3 beds |
show details | |

|
#40
Bristol Way
New Castle, DE 19720
|
- sq. feet
|
2 baths 3 beds |
show details |
| Photo | Address | Area | Beds / Baths | Price | Details |
|---|---|---|---|---|---|

|
#41
Gray St
New Castle, DE 19720
|
- sq. feet
|
1 baths 2 beds |
show details | |

|
#42
Harrisburg Ave
New Castle, DE 19720
|
- sq. feet
|
1 baths 2 beds |
show details | |

|
#43
South St
New Castle, DE 19720
|
- sq. feet
|
2 baths 5 beds |
show details | |

|
#44
Albany Ave
New Castle, DE 19720
|
- sq. feet
|
1 baths 3 beds |
show details | |

|
#45
Castle Hill Dr
New Castle, DE 19720
|
- sq. feet
|
1 baths 3 beds |
show details | |

|
#46
New Castle Ave
New Castle, DE 19720
|
- sq. feet
|
1 baths 3 beds |
show details | |

|
#47
Single Ave
New Castle, DE 19720
|
- sq. feet
|
2 baths 4 beds |
show details | |

|
#48
Briarcliff Dr
New Castle, DE 19720
|
- sq. feet
|
1 baths 3 beds |
show details | |

|
#49
Holly Dr
New Castle, DE 19720
|
- sq. feet
|
1 baths 3 beds |
show details | |

|
Check over 1 million property listings on Foreclosure.com!
|
browse all offers | |||


- 3,49962.8%White alone
- 1,58728.5%Black alone
- 3105.6%Hispanic
- 591.1%Other race alone
- 480.9%Two or more races
- 170.3%Asian alone
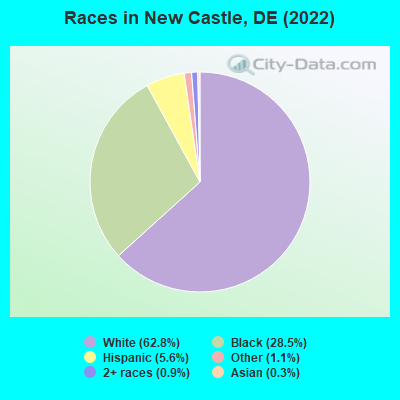
Races in New Castle detailed stats: ancestries, foreign born residents, place of birth
According to our research of Delaware and other state lists, there were 169 registered sex offenders living in New Castle, Delaware as of April 27, 2024.
The ratio of all residents to sex offenders in New Castle is 32 to 1.
Type |
2009 |
2010 |
2011 |
2012 |
2013 |
2014 |
2015 |
2016 |
2017 |
2018 |
2019 |
2020 |
2021 |
2022 |
|---|---|---|---|---|---|---|---|---|---|---|---|---|---|---|
| Murders (per 100,000) | 0 (0.0) | 0 (0.0) | 0 (0.0) | 0 (0.0) | 0 (0.0) | 1 (18.5) | 0 (0.0) | 1 (18.5) | 0 (0.0) | 0 (0.0) | 0 (0.0) | 0 (0.0) | 1 (18.5) | 0 (0.0) |
| Rapes (per 100,000) | 3 (60.3) | 2 (37.8) | 1 (18.7) | 0 (0.0) | 1 (18.6) | 0 (0.0) | 4 (74.2) | 3 (55.6) | 0 (0.0) | 1 (18.7) | 0 (0.0) | 0 (0.0) | 1 (18.5) | 0 (0.0) |
| Robberies (per 100,000) | 5 (100.5) | 7 (132.5) | 10 (187.3) | 6 (111.6) | 4 (74.2) | 5 (92.6) | 6 (111.3) | 11 (204.0) | 7 (130.5) | 6 (112.1) | 5 (90.0) | 4 (73.8) | 6 (110.7) | 4 (73.2) |
| Assaults (per 100,000) | 16 (321.5) | 15 (283.8) | 8 (149.8) | 12 (223.1) | 14 (259.8) | 5 (92.6) | 10 (185.5) | 17 (315.3) | 11 (205.1) | 10 (186.9) | 16 (287.9) | 9 (166.1) | 10 (184.5) | 23 (420.9) |
| Burglaries (per 100,000) | 34 (683.3) | 35 (662.3) | 35 (655.6) | 39 (725.2) | 51 (946.5) | 20 (370.4) | 20 (370.9) | 16 (296.7) | 20 (373.0) | 25 (467.2) | 18 (323.9) | 4 (73.8) | 10 (184.5) | 13 (237.9) |
| Thefts (per 100,000) | 181 (3,637) | 214 (4,049) | 252 (4,720) | 249 (4,630) | 237 (4,399) | 224 (4,149) | 178 (3,301) | 166 (3,079) | 195 (3,637) | 191 (3,569) | 195 (3,508) | 168 (3,100) | 146 (2,694) | 168 (3,074) |
| Auto thefts (per 100,000) | 11 (221.1) | 6 (113.5) | 20 (374.6) | 7 (130.2) | 5 (92.8) | 15 (277.8) | 5 (92.7) | 9 (166.9) | 13 (242.4) | 17 (317.7) | 10 (179.9) | 11 (203.0) | 13 (239.9) | 14 (256.2) |
| Arson (per 100,000) | 0 (0.0) | 0 (0.0) | 0 (0.0) | 0 (0.0) | 0 (0.0) | 0 (0.0) | 0 (0.0) | 0 (0.0) | 0 (0.0) | 0 (0.0) | 0 (0.0) | 0 (0.0) | 0 (0.0) | 0 (0.0) |
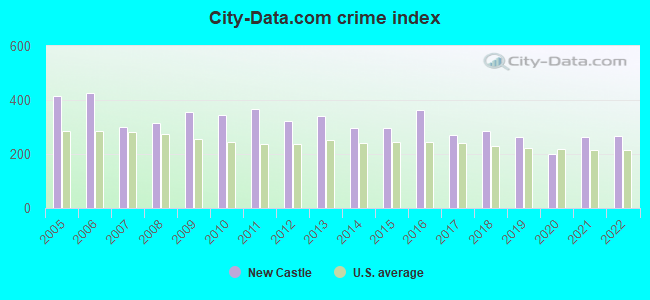
| City-Data.com crime index | 353.7 | 344.2 | 365.8 | 324.5 | 338.7 | 297.5 | 295.3 | 363.1 | 271.2 | 286.9 | 262.0 | 200.7 | 261.7 | 266.2 |
The City-Data.com crime index weighs serious crimes and violent crimes more heavily. Higher means more crime, U.S. average is 246.1. It adjusts for the number of visitors and daily workers commuting into cities.
Crime rate in New Castle detailed stats: murders, rapes, robberies, assaults, burglaries, thefts, arson
Full-time law enforcement employees in 2021, including police officers: 17 (16 officers - 14 male; 2 female).
| Officers per 1,000 residents here: | 2.95 |
| Delaware average: | 2.33 |
 Recent articles from our blog. Our writers, many of them Ph.D. graduates or candidates, create easy-to-read articles on a wide variety of topics.

 | Relocation New Castle, Pa (2 replies) |
| Nice places around New Castle DE (3 replies) |
| Planned Communities in New Castle County (6 replies) |
| Looking to purchase in New Castle County (2 replies) |
| New castle Delaware (3 replies) |
| Looks Like New Castle County sewer rates will be going up (0 replies) |
Latest news from New Castle, DE collected exclusively by city-data.com from local newspapers, TV, and radio stations
Ancestries: English (13.9%), Irish (12.7%), Italian (6.7%), American (5.4%), German (4.1%), Polish (2.4%).
Current Local Time: EST time zone
Incorporated in 1875
Elevation: 19 feet
Land area: 3.05 square miles.
Population density: 1,815 people per square mile (low).
354 residents are foreign born (2.9% Europe, 2.4% Latin America).
| This city: | 6.4% |
| Delaware: | 9.8% |
Median real estate property taxes paid for housing units with mortgages in 2022: $1,713 (0.6%)
Median real estate property taxes paid for housing units with no mortgage in 2022: $1,199 (0.5%)
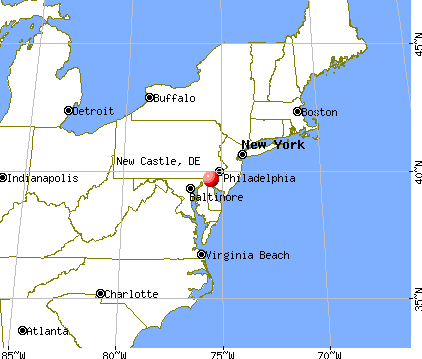
Nearest city with pop. 50,000+: Wilmington, DE  (5.8 miles , pop. 72,664).
Nearest city with pop. 200,000+: Philadelphia, PA (32.1 miles , pop. 1,517,550).
Nearest cities:
), ), ), ), )Latitude: 39.66 N, Longitude: 75.57 W
Daytime population change due to commuting: +4,391 (+78.8%)
Workers who live and work in this city: 896 (26.7%)
Area code: 302
New Castle, Delaware accommodation & food services, waste management - Economy and Business Data
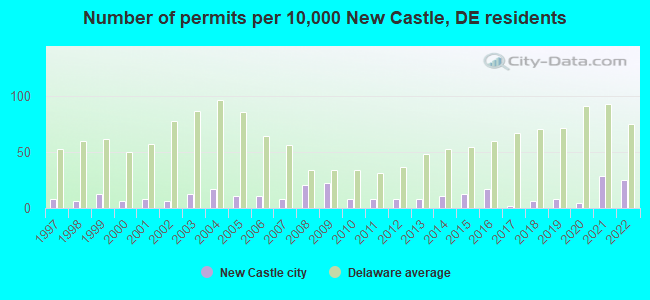
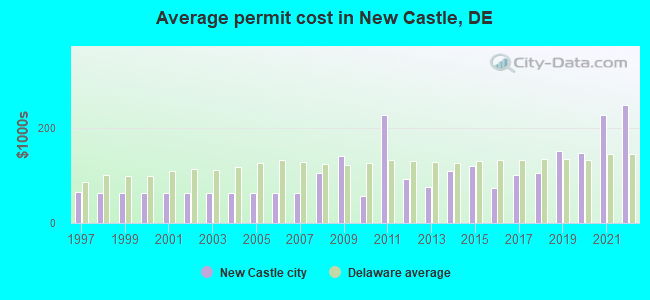
Single-family new house construction building permits:
- 2022: 12 buildings, average cost: $248,400
- 2021: 14 buildings, average cost: $228,400
- 2020: 2 buildings, average cost: $147,800
- 2019: 4 buildings, average cost: $151,300
- 2018: 3 buildings, average cost: $105,000
- 2017: 1 building, cost: $100,000
- 2016: 8 buildings, average cost: $73,400
- 2015: 6 buildings, average cost: $119,100
- 2014: 5 buildings, average cost: $110,400
- 2013: 4 buildings, average cost: $75,000
- 2012: 4 buildings, average cost: $91,800
- 2011: 4 buildings, average cost: $227,300
- 2010: 4 buildings, average cost: $57,000
- 2009: 11 buildings, average cost: $141,300
- 2008: 10 buildings, average cost: $106,000
- 2007: 4 buildings, average cost: $63,600
- 2006: 5 buildings, average cost: $63,600
- 2005: 5 buildings, average cost: $63,600
- 2004: 8 buildings, average cost: $63,600
- 2003: 6 buildings, average cost: $63,600
- 2002: 3 buildings, average cost: $63,600
- 2001: 4 buildings, average cost: $63,600
- 2000: 3 buildings, average cost: $63,600
- 1999: 6 buildings, average cost: $63,600
- 1998: 3 buildings, average cost: $63,000
- 1997: 4 buildings, average cost: $64,900
| Here: | 3.5% |
| Delaware: | 3.7% |
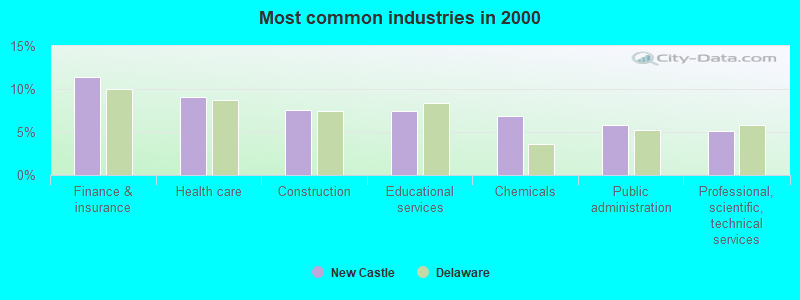
- Finance & insurance (11.4%)
- Health care (9.1%)
- Construction (7.5%)
- Educational services (7.5%)
- Chemicals (6.8%)
- Public administration (5.8%)
- Professional, scientific, technical services (5.2%)
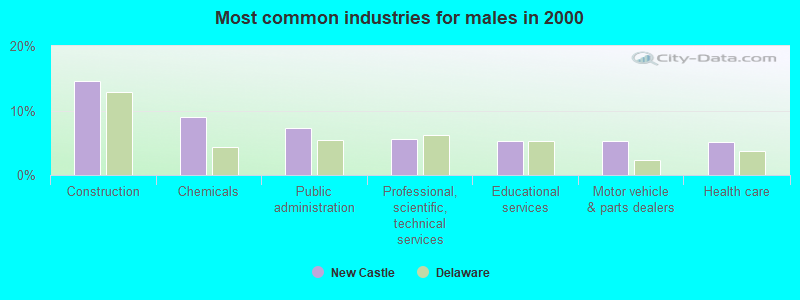
- Construction (14.6%)
- Chemicals (8.9%)
- Public administration (7.2%)
- Professional, scientific, technical services (5.6%)
- Educational services (5.3%)
- Motor vehicle & parts dealers (5.2%)
- Health care (5.1%)
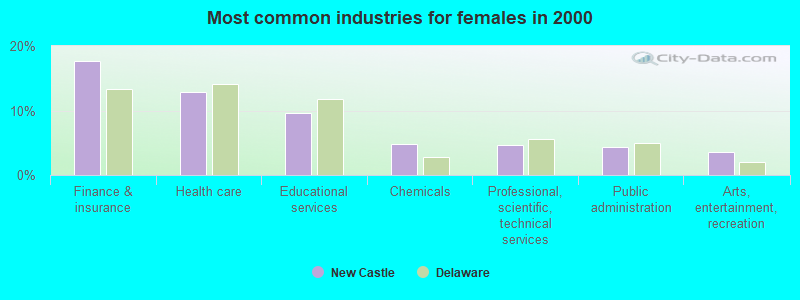
- Finance & insurance (17.6%)
- Health care (12.8%)
- Educational services (9.6%)
- Chemicals (4.8%)
- Professional, scientific, technical services (4.7%)
- Public administration (4.3%)
- Arts, entertainment, recreation (3.6%)

- Secretaries and administrative assistants (5.9%)
- Other production occupations, including supervisors (5.0%)
- Other office and administrative support workers, including supervisors (4.3%)
- Other management occupations, except farmers and farm managers (3.4%)
- Preschool, kindergarten, elementary, and middle school teachers (3.4%)
- Material recording, scheduling, dispatching, and distributing workers (3.1%)
- Customer service representatives (2.8%)
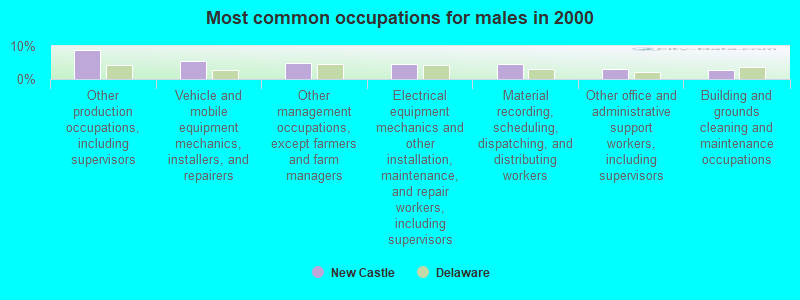
- Other production occupations, including supervisors (8.9%)
- Vehicle and mobile equipment mechanics, installers, and repairers (5.4%)
- Other management occupations, except farmers and farm managers (4.9%)
- Electrical equipment mechanics and other installation, maintenance, and repair workers, including supervisors (4.5%)
- Material recording, scheduling, dispatching, and distributing workers (4.4%)
- Other office and administrative support workers, including supervisors (3.1%)
- Building and grounds cleaning and maintenance occupations (2.7%)

- Secretaries and administrative assistants (11.5%)
- Other office and administrative support workers, including supervisors (5.6%)
- Preschool, kindergarten, elementary, and middle school teachers (5.4%)
- Customer service representatives (5.1%)
- Information and record clerks, except customer service representatives (3.8%)
- Health technologists and technicians (3.2%)
- Computer specialists (3.1%)
Average climate in New Castle, Delaware
Based on data reported by over 4,000 weather stations


|
|


(lower is better)
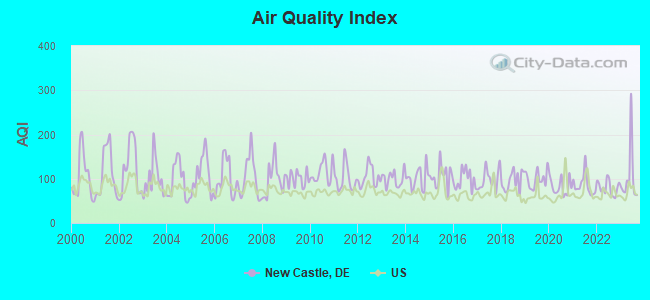
Air Quality Index (AQI) level in 2023 was 103. This is significantly worse than average.
| City: | 103 |
| U.S.: | 73 |
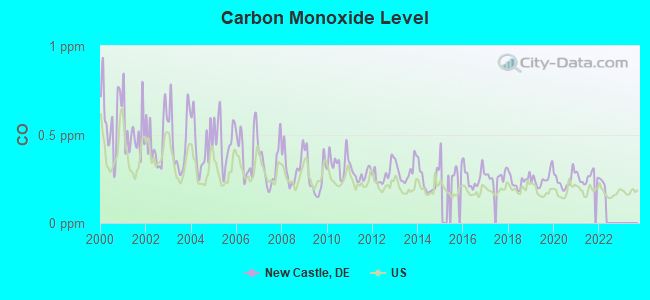
Carbon Monoxide (CO) [ppm] level in 2021 was 0.259. This is about average. Closest monitor was 3.5 miles away from the city center.
| City: | 0.259 |
| U.S.: | 0.251 |
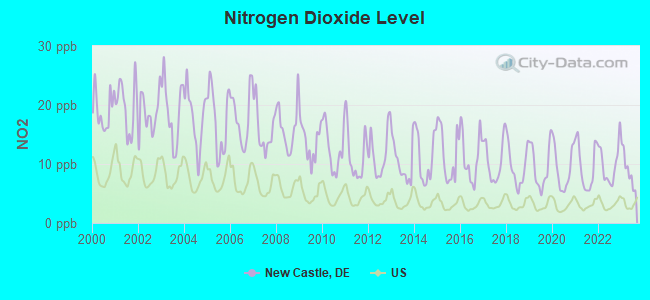
Nitrogen Dioxide (NO2) [ppb] level in 2023 was 8.99. This is significantly worse than average. Closest monitor was 4.8 miles away from the city center.
| City: | 8.99 |
| U.S.: | 5.11 |
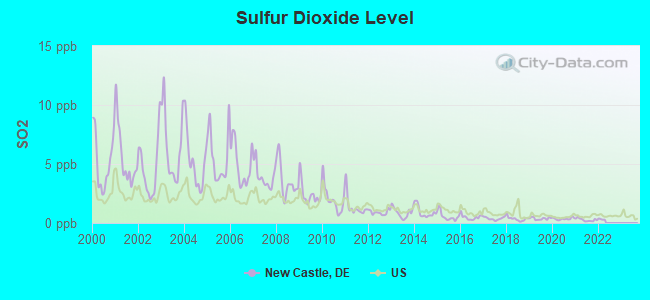
Sulfur Dioxide (SO2) [ppb] level in 2021 was 0.267. This is significantly better than average. Closest monitor was 2.9 miles away from the city center.
| City: | 0.267 |
| U.S.: | 1.515 |
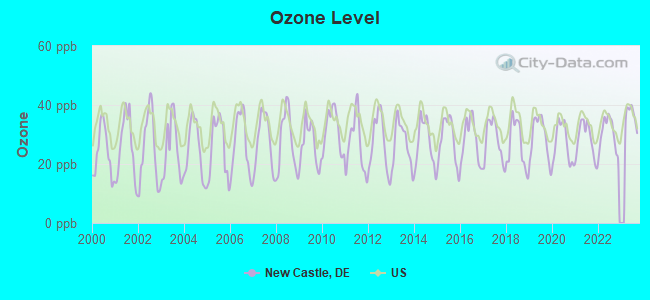
Ozone [ppb] level in 2023 was 36.4. This is about average. Closest monitor was 5.2 miles away from the city center.
| City: | 36.4 |
| U.S.: | 33.3 |
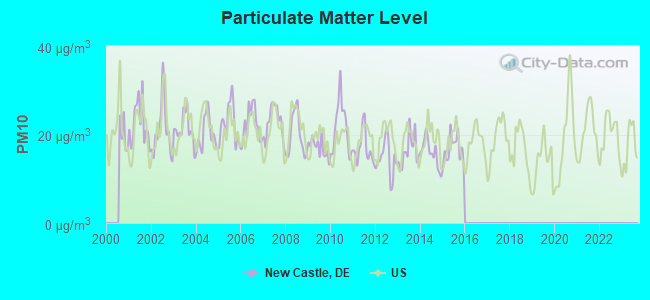
Particulate Matter (PM10) [µg/m3] level in 2015 was 16.7. This is about average. Closest monitor was 3.2 miles away from the city center.
| City: | 16.7 |
| U.S.: | 19.2 |
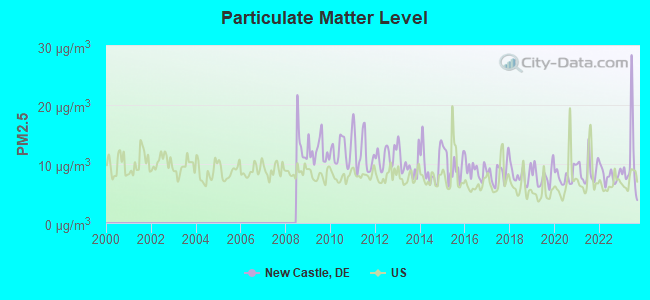
Particulate Matter (PM2.5) [µg/m3] level in 2023 was 10.3. This is worse than average. Closest monitor was 5.2 miles away from the city center.
| City: | 10.3 |
| U.S.: | 8.1 |
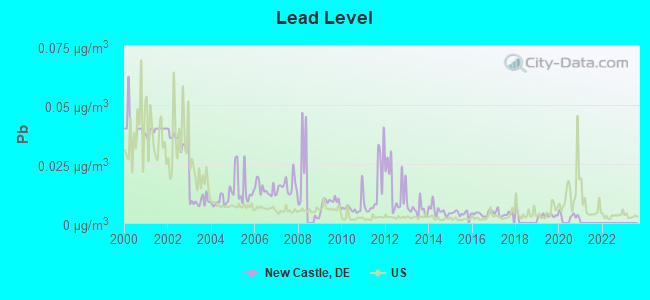
Lead (Pb) [µg/m3] level in 2020 was 0.00328. This is significantly better than average. Closest monitor was 4.1 miles away from the city center.
| City: | 0.00328 |
| U.S.: | 0.00931 |
Tornado activity:
New Castle-area historical tornado activity is slightly above Delaware state average. It is 5% greater than the overall U.S. average.
On 4/28/1961, a category F3 (max. wind speeds 158-206 mph) tornado 0.4 miles away from the New Castle city center caused between $5000 and $50,000 in damages.
On 7/27/1994, a category F3 tornado 12.3 miles away from the city center injured 11 people and caused between $500,000 and $5,000,000 in damages.
Earthquake activity:
New Castle-area historical earthquake activity is significantly above Delaware state average. It is 64% smaller than the overall U.S. average.On 8/23/2011 at 17:51:04, a magnitude 5.8 (5.8 MW, Depth: 3.7 mi, Class: Moderate, Intensity: VI - VII) earthquake occurred 176.3 miles away from New Castle center
On 1/16/1994 at 01:49:16, a magnitude 4.6 (4.6 MB, 4.6 LG, Depth: 3.1 mi, Class: Light, Intensity: IV - V) earthquake occurred 52.4 miles away from New Castle center
On 1/16/1994 at 00:42:43, a magnitude 4.2 (4.2 MB, 4.0 LG, Depth: 3.1 mi) earthquake occurred 51.4 miles away from the city center
On 11/30/2017 at 21:47:31, a magnitude 4.1 (4.1 MW, Depth: 6.1 mi) earthquake occurred 33.1 miles away from New Castle center
On 9/25/1998 at 19:52:52, a magnitude 5.2 (4.8 MB, 4.3 MS, 5.2 LG, 4.5 MW, Depth: 3.1 mi) earthquake occurred 283.4 miles away from New Castle center
On 10/7/1983 at 10:18:46, a magnitude 5.3 (5.1 MB, 5.3 LG, 5.1 ML) earthquake occurred 303.2 miles away from New Castle center
Magnitude types: regional Lg-wave magnitude (LG), body-wave magnitude (MB), local magnitude (ML), surface-wave magnitude (MS), moment magnitude (MW)
Natural disasters:
The number of natural disasters in New Castle County (15) is near the US average (15).Major Disasters (Presidential) Declared: 9
Emergencies Declared: 5
Causes of natural disasters: Hurricanes: 7, Snowstorms: 2, Tropical Storms: 2, Winter Storms: 2, Blizzard: 1, Flood: 1, Snowfall: 1, Storm: 1, Tornado: 1, Water Shortage: 1, Other: 1 (Note: some incidents may be assigned to more than one category).

Main business address for: APPLIED EXTRUSION TECHNOLOGIES INC /DE (UNSUPPORTED PLASTICS FILM & SHEET).
Hospitals and medical centers in New Castle:
- DELAWARE PSYCHIATRIC CENTER (1901 N DUPONT HIGHWAY)
- MEADOWWOOD BEHAVIORAL HEALTH SYSTEM (575 SOUTH DUPONT HIGHWAY)
- ARBORS AT NEW CASTLE (32 BUENA VISTA DRIVE)
- CARVEL BLDG/DE PSYCHIATRIC CTR (1901 N. DUPONT HIGHWAY)
- FRESENIUS MEDICAL CARE FIRST STATE (608 FERRY CUTOFF)
- CHRISTIANA CARE VNA/NEW CASTLE (ONE READ'S WAY, SUITE 100)
- INTERIM HEALTHCARE (2 READS WAY SUITE 123)
Amtrak stations near New Castle:
- 6 miles: WILMINGTON (M. L. KING BLVD, & FRENCH ST.) . Services: ticket office, partially wheelchair accessible, enclosed waiting area, public restrooms, public payphones, snack bar, ATM, paid short-term parking, paid long-term parking, car rental agency, taxi stand, intercity bus service, public transit connection.
- 11 miles: NEWARK (429 S. COLLEGE AVE.) . Services: public payphones, free short-term parking, call for car rental service, call for taxi service, public transit connection.
Operable nuclear power plants near New Castle:
- 9 miles: Salem 2 in Salem, NJ.
- 9 miles: Hope Creek in Salem, NJ.
- 9 miles: Salem 1 in Salem, NJ.
College/University in New Castle:
Other colleges/universities with over 2000 students near New Castle:
- Delaware Technical Community College-Stanton/Wilmington (about 6 miles; Wilmington, DE; Full-time enrollment: 4,972)
- University of Delaware (about 11 miles; Newark, DE; FT enrollment: 20,078)
- Neumann University (about 17 miles; Aston, PA; FT enrollment: 2,622)
- Widener University-Main Campus (about 18 miles; Chester, PA; FT enrollment: 4,051)
- West Chester University of Pennsylvania (about 20 miles; West Chester, PA; FT enrollment: 14,492)
- Lincoln University of Pennsylvania (about 22 miles; Lincoln University, PA; FT enrollment: 2,042)
- Delaware County Community College (about 23 miles; Media, PA; FT enrollment: 8,419)
Public high schools in New Castle:
- PENN (WILLIAM) HIGH SCHOOL (Students: 2,330, Location: 713 EAST BASIN ROAD, Grades: 9-12)
- LEACH (JOHN G.) SCHOOL (Students: 108, Location: 10 LANDERS LANE, Grades: PK-12)
- DELAWARE ACADEMY OF PUBLIC SAFETY AND SECURITY (Location: 801 N. DUPONT HIGHWAY, Grades: 9-12, Charter school)
Private high schools in New Castle:
Biggest public elementary/middle schools in New Castle:
- BEDFORD (GUNNING) MIDDLE SCHOOL (Students: 1,235, Location: 801 COX NECK ROAD, Grades: 6-8)
- SOUTHERN ELEMENTARY SCHOOL (Students: 1,117, Location: 795 COX NECK ROAD, Grades: KG-5)
- READ (GEORGE) MIDDLE SCHOOL (Students: 1,064, Location: 314 EAST BASIN ROAD, Grades: 6-8)
- MCCULLOUGH (CALVIN R. ) MIDDLE SCHOOL (Students: 862, Location: 20 CHASE AVENUE, Grades: 6-8)
- CASTLE HILLS ELEMENTARY SCHOOL (Students: 713, Location: 502 MOORES LANE, Grades: KG-5)
- PLEASANTVILLE ELEMENTARY SCHOOL (Students: 568, Location: 16 PLEASANT STREET, Grades: KG-5)
- NEW CASTLE ELEMENTARY SCHOOL (Students: 548, Location: 903 DELAWARE STREET, Grades: KG-5)
- EISENBERG (HARRY O.) ELEMENTARY SCHOOL (Students: 468, Location: 27 LANDERS LANE, Grades: KG-5)
- DOWNIE (CARRIE) ELEMENTARY SCHOOL (Students: 442, Location: 1201 DELAWARE STREET, Grades: KG-5)
- WILMINGTON MANOR ELEMENTARY SCHOOL (Students: 407, Location: 200 EAST ROOSEVELT AVENUE, Grades: KG-5)
Private elementary/middle schools in New Castle:
Libraries in New Castle:
- DEPARTMENT OF COMMUNITY SERVICES (Operating income: $12,178,125; Location: 87 READS WAY; 685,640 books; 56,897 audio materials; 57,428 video materials; 29 local licensed databases; 20 state licensed databases; 2 other licensed databases; 1,894 print serial subscriptions)
- NEW CASTLE PUBLIC LIBRARY (Operating income: $606,653; Location: 424 DELAWARE STREET; 33,304 books; 2,267 audio materials; 1,627 video materials; 3 local licensed databases; 42 state licensed databases; 4 other licensed databases; 95 print serial subscriptions; 2 electronic serial subscriptions)
Points of interest:
Notable locations in New Castle: Good Will Fire Company (A), New Castle City Police Department (B), New Castle Public Library (C), New Castle City Hall (D), New Castle Senior Center (E), New Castle Court House Museum (F). Display/hide their locations on the map
Churches in New Castle include: Buttonwood United Methodist Church (A), Buttonwood Church (B), Berean Baptist Church (C), Immanuel Episcopal Church (D), Free Will Baptist Church (E), Bethany United African Methodist Episcopal Church (F), Mount Salem Methodist Church (G), New Castle Methodist Church (H), Immanuel Church on the Green (I). Display/hide their locations on the map
Cemeteries: Glebe Cemetery (1), Mount Salem Cemetery (2). Display/hide their locations on the map
Parks in New Castle include: Old Town Hall (1), Battery Park (2), New Castle Historic District (3), The Green (4). Display/hide their locations on the map
Tourist attractions: Fort Delaware Society (Museums; 122 Washington St), George Read II House (Museums; 42 The Strand), Museum of the American Road (2160 New Castle Avenue), New Castle Historical Society - Dutch House (Museums; 32 West 3rd Street), New Castle Historical Society - Office (Museums; 2 East 4th Street), Superior Play Systems (Amusement & Theme Parks; 263 Quigley Boulevard), Zion Cruise Agency (Recreational Trips & Guides; 315 Sheridan Drive).
Hotels: Coachman's Manor (401 Carriage Way), Bridgeview Inn (Rts 13 & I295), Econo Lodge Airport (232 South Dupont Highway), Motel 6 (1200 West Avenue), Delaware Motel & RV Park (235 South Dupont Highway), Red Rose Inn (1515 North Dupont Highway), Dutch Inn (111 S Dupont Hwy), New Castle-Wilmington (1612 North Dupont Highway), Crown Motel Reservations (152 North Dupont Highway).
Courts: Delaware River & Bay Authority Airports (New Castle Avenue), Delaware Auto Court (North Dupont Highway), Delaware State - Justice Of The Peace Court- Criminal Courts- Court N (61 Christiana Road).
Birthplace of: Ryan Phillippe - Actor, C. Douglass Buck - Politician, Nicholas Van Dyke (senator) - Politician, Thomas Holcomb - Commandant of the Marine Corps, Anthony Higgins - Politician, George Gray (senator) - Politician, George R. Riddle - Politician, John B. Penington - Politician, John Walter Bratton - Musical theatre composer, Kensey Johns, Jr. - Politician.
Drinking water stations with addresses in New Castle and their reported violations in the past:
WHISPERING PINES MOBILE HOME PARK (Address: 761 GRANTHAM LANE , Serves MD, Population served: 325, Groundwater):Past health violations:BLUE DIAMOND MX (Population served: 100, Groundwater):Past monitoring violations:
- OCCT/SOWT Study/Recommendation - In APR-01-2013, Contaminant: Lead and Copper Rule. Follow-up actions: St Violation/Reminder Notice (MAR-19-2013), St Compliance achieved (AUG-08-2014)
- MCL, Monthly (TCR) - In AUG-2011, Contaminant: Coliform. Follow-up actions: St Public Notif requested (AUG-18-2011), St Violation/Reminder Notice (AUG-18-2011), St Public Notif received (AUG-22-2011), St Compliance achieved (OCT-10-2011)
- OCCT/SOWT Study/Recommendation - In JAN-01-2009, Contaminant: Lead and Copper Rule. Follow-up actions: St Violation/Reminder Notice (2 times from MAR-23-2009 to AUG-26-2009), St Compliance achieved (DEC-14-2009)
- Public Education - In AUG-30-2008, Contaminant: Lead and Copper Rule. Follow-up actions: St Violation/Reminder Notice (2 times from MAR-23-2009 to AUG-26-2009), St Compliance achieved (AUG-28-2009)
- Lead Consumer Notice - In JAN-01-2013, Contaminant: Lead and Copper Rule. Follow-up actions: St Violation/Reminder Notice (2 times from JUL-13-2012 to MAR-19-2013)
- Initial, Follow-up, or Routine Source Water M/R - In JUL-01-2008, Contaminant: Lead and Copper Rule. Follow-up actions: St Violation/Reminder Notice (2 times from MAR-23-2009 to AUG-26-2009), St Compliance achieved (SEP-09-2009)
- Water Quality Parameter M/R - Between JAN-2008 and JUN-2008, Contaminant: Lead and Copper Rule. Follow-up actions: St Violation/Reminder Notice (3 times from MAR-24-2008 to AUG-26-2009), St Compliance achieved (SEP-21-2009)
- One routine major monitoring violation
Past health violations:PANDA EARLY EDUCATION CENTER (Population served: 82, Groundwater):
- MCL, Monthly (TCR) - Between APR-2011 and JUN-2011, Contaminant: Coliform. Follow-up actions: St Public Notif requested (MAY-23-2011), St Formal NOV issued (MAY-23-2011), St Public Notif received (JUL-17-2011), St Compliance achieved (AUG-18-2011)
Past health violations:WOODSIDE CENTER (Population served: 25, Groundwater):Past monitoring violations:
- MCL, Monthly (TCR) - Between APR-2011 and JUN-2011, Contaminant: Coliform. Follow-up actions: St Public Notif requested (MAY-02-2011), St Formal NOV issued (MAY-02-2011), St Public Notif received (MAY-25-2011), St Compliance achieved (JUL-18-2011)
- MCL, Monthly (TCR) - Between JAN-2011 and MAR-2011, Contaminant: Coliform. Follow-up actions: St Formal NOV issued (MAR-14-2011), St Compliance achieved (MAR-31-2011)
- MCL, Average - Between JAN-2010 and MAR-2010, Contaminant: Nitrate. Follow-up actions: St Public Notif requested (JAN-15-2010), St Formal NOV issued (JAN-15-2010), St Public Notif received (MAY-05-2010), St Compliance achieved (JUL-14-2010)
- MCL, Average - Between OCT-2009 and DEC-2009, Contaminant: Nitrate. Follow-up actions: St Public Notif requested (JAN-14-2010), St Formal NOV issued (JAN-14-2010), St Public Notif received (JAN-28-2010), St Compliance achieved (JUL-14-2010)
- MCL, Average - Between JUL-2009 and SEP-2009, Contaminant: Nitrate. Follow-up actions: St Public Notif requested (SEP-29-2009), St Formal NOV issued (SEP-29-2009), St Compliance achieved (JUL-14-2010)
- MCL, Monthly (TCR) - Between JUL-2009 and SEP-2009, Contaminant: Coliform. Follow-up actions: St Public Notif requested (SEP-29-2009), St Formal NOV issued (SEP-29-2009), St Public Notif received (OCT-14-2009), St Compliance achieved (JAN-11-2010)
- One minor monitoring violation
Past health violations:
- MCL, Monthly (TCR) - Between JUL-2007 and SEP-2007, Contaminant: Coliform. Follow-up actions: St Formal NOV issued (JUL-23-2007), St Public Notif issued (JUL-23-2007), St Compliance achieved (AUG-10-2007)
Drinking water stations with addresses in New Castle that have no violations reported:
- NEW CASTLE WATER DEPARTMENT (Population served: 6,000, Primary Water Source Type: Groundwater)
| This city: | 2.3 people |
| Delaware: | 2.5 people |
| This city: | 59.0% |
| Whole state: | 67.4% |
| This city: | 6.8% |
| Whole state: | 7.3% |
Likely homosexual households (counted as self-reported same-sex unmarried-partner households)
- Lesbian couples: 0.5% of all households
- Gay men: 0.5% of all households
Banks with most branches in New Castle (2011 data):
- Manufacturers and Traders Trust Company: Community Plaza Branch, New Castle Drive-In Branch, New Castle Branch. Info updated 2011/08/08: Bank assets: $76,887.1 mil, Deposits: $60,064.2 mil, headquarters in Buffalo, NY, positive income, Commercial Lending Specialization, 808 total offices, Holding Company: M&T Bank Corporation
- Wilmington Savings Fund Society, FSB: Airport Plaza Branch at 144 North Dupont Highway, branch established on 1989/05/30; Crossroads Shopping Center Branch at 2080 New Castle Avenue, branch established on 1965/03/17. Info updated 2011/07/21: Bank assets: $4,281.1 mil, Deposits: $3,150.2 mil, headquarters in Wilmington, DE, positive income, Commercial Lending Specialization, 43 total offices
- Citibank, National Association: Citibank (Delaware) Branch at One Penn's Way, branch established on 1982/10/06. Info updated 2012/01/10: Bank assets: $1,288,658.0 mil, Deposits: $882,541.0 mil, headquarters in Sioux Falls, SD, positive income, International Specialization, 1048 total offices, Holding Company: Citigroup Inc.
- TD Bank, National Association: Churchmans Corner Branch at 82 Christiana Road, branch established on 2000/08/19. Info updated 2010/10/04: Bank assets: $188,912.6 mil, Deposits: $153,149.8 mil, headquarters in Wilmington, DE, positive income, 1314 total offices, Holding Company: Toronto-Dominion Bank, The
- Wells Fargo Bank, National Association: Wilmington Manor Branch at 1424 N Dupont Hwy, branch established on 1952/07/01. Info updated 2011/04/05: Bank assets: $1,161,490.0 mil, Deposits: $905,653.0 mil, headquarters in Sioux Falls, SD, positive income, 6395 total offices, Holding Company: Wells Fargo & Company
- RBS Citizens, National Association: Airport Plaza Branch at 130 Dupont Highway, branch established on 1989/01/20. Info updated 2007/09/19: Bank assets: $106,940.6 mil, Deposits: $75,690.2 mil, headquarters in Providence, RI, positive income, 1135 total offices, Holding Company: Uk Financial Investments Limited
- Bank of New Castle: Bank Of New Castle at 12 Read's Way, branch established on 1989/08/18. Info updated 2006/11/03: Bank assets: $16.0 mil, Deposits: $0.5 mil, local headquarters, positive income, 1 total offices, Holding Company: Discover Financial Services
- Discover Bank: New Castle Administrative Office at 12 Read's Way, branch established on 1996/06/04. Info updated 2006/11/03: Bank assets: $67,778.5 mil, Deposits: $39,601.6 mil, headquarters in Greenwood, DE, positive income, Credit-Card Specialization, 2 total offices, Holding Company: Discover Financial Services
- PNC Bank, National Association: Basin Road Branch at 1 East Basin Road, branch established on 1967/09/29. Info updated 2012/03/20: Bank assets: $263,309.6 mil, Deposits: $197,343.0 mil, headquarters in Wilmington, DE, positive income, Commercial Lending Specialization, 3085 total offices, Holding Company: Pnc Financial Services Group, Inc., The
For population 15 years and over in New Castle:
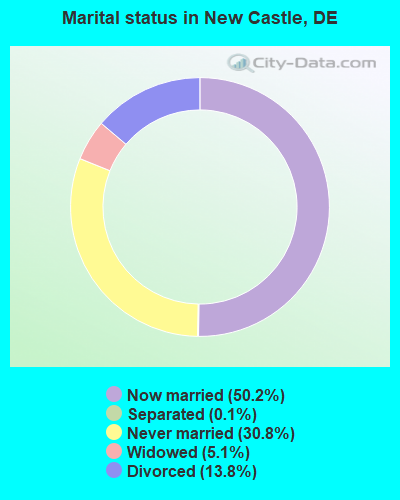
- Never married: 30.8%
- Now married: 50.2%
- Separated: 0.1%
- Widowed: 5.1%
- Divorced: 13.8%
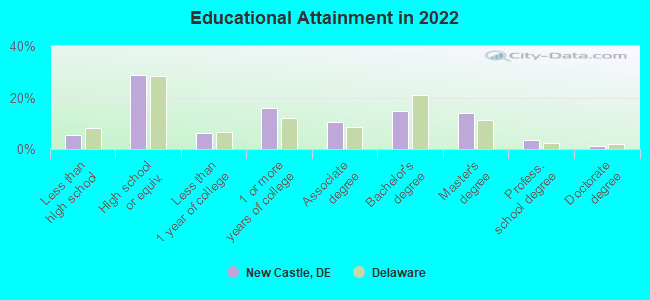
For population 25 years and over in New Castle:
- High school or higher: 94.7%
- Bachelor's degree or higher: 32.0%
- Graduate or professional degree: 18.3%
- Unemployed: 4.6%
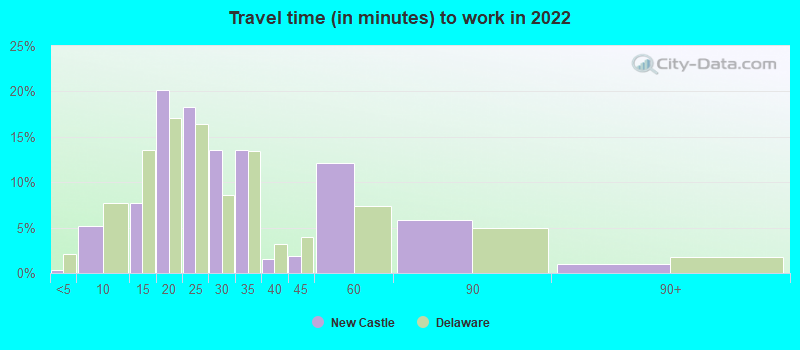
- Mean travel time to work (commute): 17.6 minutes
| Here: | 10.8 |
| Delaware average: | 11.5 |
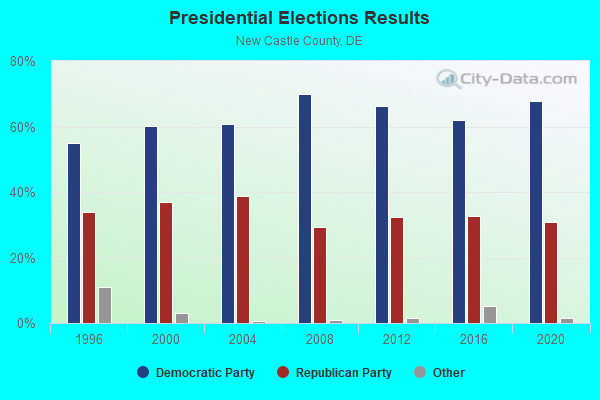
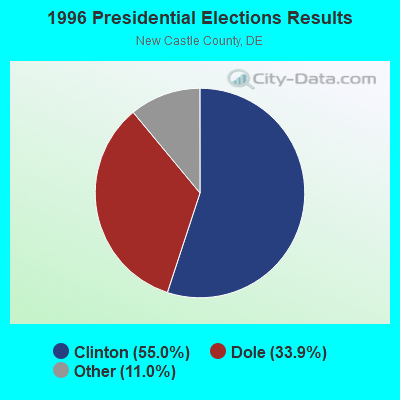
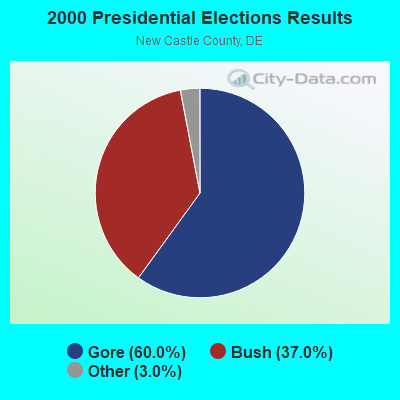
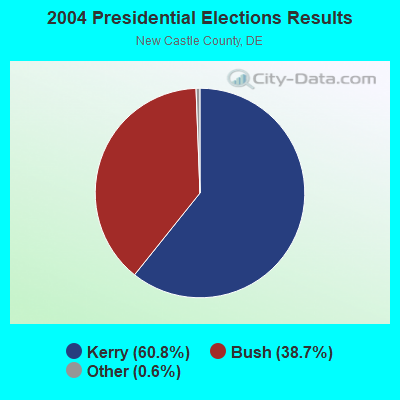
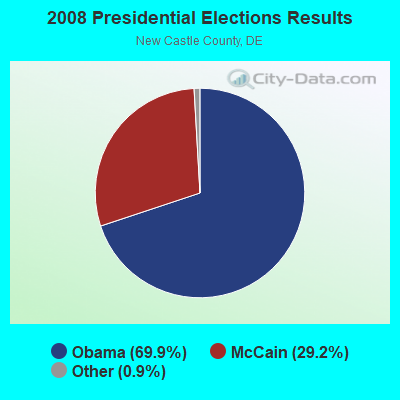
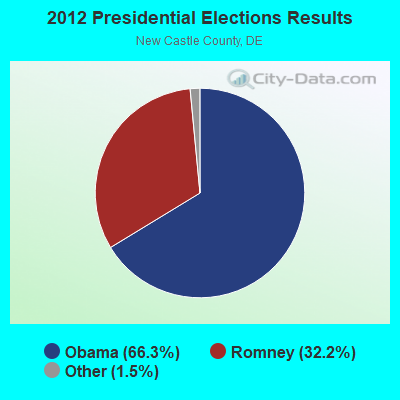


Graphs represent county-level data. Detailed 2008 Election Results
Religion statistics for New Castle, DE (based on New Castle County data)
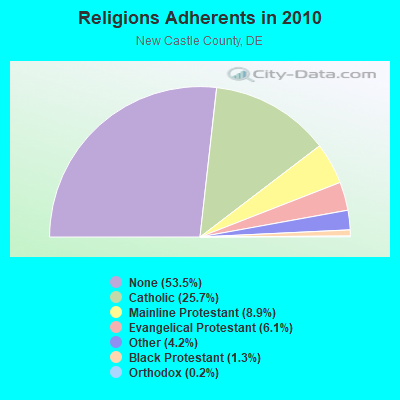
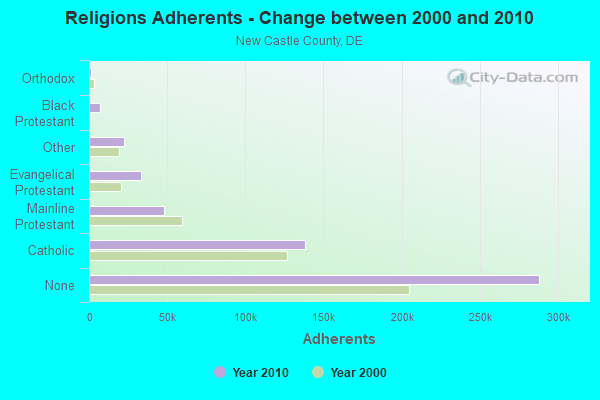
| Religion | Adherents | Congregations |
|---|---|---|
| Catholic | 138,172 | 33 |
| Mainline Protestant | 48,124 | 125 |
| Evangelical Protestant | 32,993 | 169 |
| Other | 22,672 | 45 |
| Black Protestant | 7,212 | 36 |
| Orthodox | 1,166 | 5 |
| None | 288,140 | - |
Food Environment Statistics:
| This county: | 1.56 / 10,000 pop. |
| Delaware: | 1.74 / 10,000 pop. |
| New Castle County: | 0.06 / 10,000 pop. |
| Delaware: | 0.09 / 10,000 pop. |
| New Castle County: | 1.35 / 10,000 pop. |
| State: | 1.25 / 10,000 pop. |
| This county: | 2.13 / 10,000 pop. |
| Delaware: | 2.84 / 10,000 pop. |
| Here: | 6.40 / 10,000 pop. |
| Delaware: | 7.43 / 10,000 pop. |
| This county: | 8.0% |
| Delaware: | 9.0% |
| This county: | 26.7% |
| Delaware: | 27.9% |
Health and Nutrition:
| New Castle: | 51.1% |
| Delaware: | 49.1% |
| New Castle: | 48.7% |
| State: | 45.9% |
| This city: | 29.2 |
| State: | 28.8 |
| This city: | 21.6% |
| Delaware: | 20.8% |
| New Castle: | 12.0% |
| Delaware: | 11.0% |
| This city: | 6.8 |
| Delaware: | 6.8 |
| Here: | 36.3% |
| Delaware: | 33.9% |
| This city: | 57.1% |
| Delaware: | 55.5% |
| New Castle: | 78.9% |
| Delaware: | 79.1% |
More about Health and Nutrition of New Castle, DE Residents
| Local government employment and payroll (March 2022) | |||||
| Function | Full-time employees | Monthly full-time payroll | Average yearly full-time wage | Part-time employees | Monthly part-time payroll |
|---|---|---|---|---|---|
| Police Protection - Officers | 17 | $107,444 | $75,843 | 0 | $0 |
| Solid Waste Management | 10 | $34,215 | $41,058 | 0 | $0 |
| Other and Unallocable | 7 | $43,536 | $74,633 | 2 | $550 |
| Water Supply | 7 | $55,677 | $95,446 | 0 | $0 |
| Electric Power | 6 | $49,847 | $99,694 | 0 | $0 |
| Other Government Administration | 4 | $21,791 | $65,373 | 8 | $3,450 |
| Financial Administration | 2 | $8,919 | $53,514 | 0 | $0 |
| Police - Other | 1 | $4,125 | $49,500 | 0 | $0 |
| Totals for Government | 54 | $325,554 | $72,345 | 10 | $4,000 |
New Castle government finances - Expenditure in 2018 (per resident):
- Current Operations - Police Protection: $1,328,000 ($240.01)
General - Other: $1,293,000 ($233.69)
Central Staff Services: $365,000 ($65.97)
Financial Administration: $161,000 ($29.10)
Solid Waste Management: $153,000 ($27.65)
Regular Highways: $7,000 ($1.27)
- General - Interest on Debt: $4,000 ($0.72)
- Total Salaries and Wages: $2,165,000 ($391.29)
New Castle government finances - Revenue in 2018 (per resident):
- Charges - Other: $9,000 ($1.63)
Solid Waste Management: $8,000 ($1.45)
- Local Intergovernmental - General Local Government Support: $740,000 ($133.74)
- Miscellaneous - General Revenue - Other: $218,000 ($39.40)
Fines and Forfeits: $74,000 ($13.37)
Donations From Private Sources: $12,000 ($2.17)
Interest Earnings: $7,000 ($1.27)
Sale of Property: $4,000 ($0.72)
- State Intergovernmental - Highways: $107,000 ($19.34)
Other: $26,000 ($4.70)
- Tax - Property: $3,480,000 ($628.95)
Occupation and Business License - Other: $212,000 ($38.32)
New Castle government finances - Debt in 2018 (per resident):
- Long Term Debt - Outstanding Unspecified Public Purpose: $1,894,000 ($342.31)
Issue, Unspecified Public Purpose: $1,894,000 ($342.31)
Beginning Outstanding - Public Debt for Private Purpose: $111,000 ($20.06)
Outstanding Nonguaranteed - Industrial Revenue: $94,000 ($16.99)
Retired Nonguaranteed - Public Debt for Private Purpose: $18,000 ($3.25)
New Castle government finances - Cash and Securities in 2018 (per resident):
- Bond Funds - Cash and Securities: $1,894,000 ($342.31)
- Other Funds - Cash and Securities: $3,172,000 ($573.29)
- Sinking Funds - Cash and Securities: $94,000 ($16.99)
5.39% of this county's 2021 resident taxpayers lived in other counties in 2020 ($73,141 average adjusted gross income)
| Here: | 5.39% |
| Delaware average: | 6.79% |
0.01% of residents moved from foreign countries ($80 average AGI)
New Castle County: 0.01% Delaware average: 0.03%
Top counties from which taxpayers relocated into this county between 2020 and 2021:
| from Philadelphia County, PA | |
| from Delaware County, PA | |
| from Kent County, DE |
5.25% of this county's 2020 resident taxpayers moved to other counties in 2021 ($94,385 average adjusted gross income)
| Here: | 5.25% |
| Delaware average: | 5.45% |
0.01% of residents moved to foreign countries ($149 average AGI)
New Castle County: 0.01% Delaware average: 0.03%
Top counties to which taxpayers relocated from this county between 2020 and 2021:
| to Kent County, DE | |
| to Sussex County, DE | |
| to Philadelphia County, PA |
| Businesses in New Castle, DE | ||||
| Name | Count | Name | Count | |
|---|---|---|---|---|
| 7-Eleven | 3 | Motel 6 | 1 | |
| Advance Auto Parts | 1 | Nissan | 1 | |
| Applebee's | 1 | Papa John's Pizza | 1 | |
| Arby's | 1 | Pathmark | 1 | |
| AutoZone | 1 | Payless | 1 | |
| Blockbuster | 1 | Penske | 1 | |
| Budget Car Rental | 1 | Pizza Hut | 1 | |
| Burger King | 2 | Popeyes | 1 | |
| Chevrolet | 1 | Quality | 1 | |
| Clarion | 1 | RadioShack | 1 | |
| Cricket Wireless | 3 | Rite Aid | 2 | |
| Domino's Pizza | 1 | Ryder Rental & Truck Leasing | 1 | |
| Dunkin Donuts | 9 | Sheraton | 1 | |
| Econo Lodge | 1 | Sprint Nextel | 1 | |
| FedEx | 11 | Staples | 1 | |
| Firestone Complete Auto Care | 1 | Subway | 1 | |
| Ford | 2 | Super 8 | 1 | |
| GNC | 2 | Superfresh | 1 | |
| H&R Block | 2 | T-Mobile | 3 | |
| Home Depot | 1 | T.G.I. Driday's | 1 | |
| Hyundai | 1 | Taco Bell | 1 | |
| IHOP | 1 | Toyota | 1 | |
| Just Tires | 1 | U-Haul | 3 | |
| KFC | 1 | UPS | 5 | |
| Lane Furniture | 2 | Verizon Wireless | 1 | |
| Lowe's | 1 | Walgreens | 2 | |
| MasterBrand Cabinets | 1 | Walmart | 1 | |
| Mazda | 1 | Wendy's | 1 | |
| McDonald's | 3 | |||
Strongest AM radio stations in New Castle:
- WVCH (740 AM; 50 kW; CHESTER, PA; Owner: WVCH COMMUNICATIONS, INC.)
- WTMC (1380 AM; 5 kW; WILMINGTON, DE; Owner: STATE OF DELAWARE DEPARTMENT OF TRAN)
- WPEN (950 AM; 50 kW; PHILADELPHIA, PA; Owner: GREATER PHILADELPHIA RADIO, INC.)
- WJBR (1290 AM; 2 kW; WILMINGTON, DE; Owner: CAPSTAR TX LIMITED PARTNERSHIP)
- WZZD (990 AM; 50 kW; PHILADELPHIA, PA; Owner: PENNSYLVANIA MEDIA ASSOCIATES, INC.)
- KYW (1060 AM; 50 kW; PHILADELPHIA, PA; Owner: INFINITY BROADCASTING OPERATIONS, INC.)
- WDEL (1150 AM; 5 kW; WILMINGTON, DE; Owner: DELMARVA BROADCASTING COMPANY)
- WILM (1450 AM; 1 kW; WILMINGTON, DE; Owner: DELAWARE BROADCASTING CO.)
- WNWR (1540 AM; 50 kW; PHILADELPHIA, PA)
- WPHT (1210 AM; 50 kW; PHILADELPHIA, PA; Owner: INFINITY BROADCASTING OPERATIONS, INC.)
- WFAI (1510 AM; daytime; 2 kW; SALEM, NJ; Owner: QC COMMUNICATIONS,INC.)
- WWJZ (640 AM; 50 kW; MOUNT HOLLY, NJ; Owner: ABC, INC.)
- WAMS (1260 AM; 1 kW; NEWARK, DE; Owner: CAPITOL BROADCASTING, INC.)
Strongest FM radio stations in New Castle:
- WSTW (93.7 FM; WILMINGTON, DE; Owner: DELMARVA BROADCASTING COMPANY)
- WJBR-FM (99.5 FM; WILMINGTON, DE; Owner: NM LICENSING, LLC)
- WPLY (100.3 FM; MEDIA, PA; Owner: RADIO ONE LICENSES, LLC)
- WMGK (102.9 FM; PHILADELPHIA, PA; Owner: GREATER PHILADELPHIA RADIO, INC.)
- WMWX (95.7 FM; PHILADELPHIA, PA; Owner: GREATER PHILADELPHIA RADIO, INC.)
- WOGL (98.1 FM; PHILADELPHIA, PA; Owner: INFINITY BROADCASTING OPERATIONS, INC.)
- WBEB (101.1 FM; PHILADELPHIA, PA; Owner: WEAZ-FM RADIO, INC.)
- WRTI (90.1 FM; PHILADELPHIA, PA; Owner: TEMPLE UNIV. OF THE COMMONWEALTH, ET)
- WSNI-FM (104.5 FM; PHILADELPHIA, PA; Owner: AMFM RADIO LICENSES, L.L.C.)
- WPHI-FM (103.9 FM; JENKINTOWN, PA; Owner: RADIO ONE LICENSES, LLC)
- WMMR (93.3 FM; PHILADELPHIA, PA; Owner: GREATER BOSTON RADIO, INC.)
- WHYY-FM (90.9 FM; PHILADELPHIA, PA; Owner: WHYY, INC.)
- WXPN (88.5 FM; PHILADELPHIA, PA; Owner: TRUSTEES OF THE UNIVERSITY OF PENNA.)
- WXTU (92.5 FM; PHILADELPHIA, PA; Owner: WXTU LICENSE LIMITED PARTNERSHIP)
- WDAS-FM (105.3 FM; PHILADELPHIA, PA; Owner: AMFM RADIO LICENSES, L.L.C.)
- WMPH (91.7 FM; WILMINGTON, DE; Owner: BRANDYWINE SCHOOL DIST, BRD OF EDUC)
- WPTP (96.5 FM; PHILADELPHIA, PA; Owner: WDAS LICENSE LIMITED PARTNERSHIP)
- WYSP (94.1 FM; PHILADELPHIA, PA; Owner: INFINITY BROADCASTING OPERATIONS, INC.)
- WUSL (98.9 FM; PHILADELPHIA, PA; Owner: AMFM RADIO LICENSES, L.L.C.)
- W278AK (103.5 FM; VILLAGE GREEN, PA; Owner: PRIORITY RADIO, INC.)
TV broadcast stations around New Castle:
- WTSD-CA (Channel 14; WILMINGTON, DE; Owner: PRIORITY COMMUNICATIONS MINISTRIES, INC.)
- KYW-TV (Channel 3; PHILADELPHIA, PA; Owner: CBS BROADCASTING INC.)
- WPHL-TV (Channel 17; PHILADELPHIA, PA; Owner: TRIBUNE TELEVISION COMPANY)
- WPPX (Channel 61; WILMINGTON, DE; Owner: PAXSON PHILADELPHIA LICENSE, INC.)
- WPVI-TV (Channel 6; PHILADELPHIA, PA; Owner: ABC, INC.)
- WPSG (Channel 57; PHILADELPHIA, PA; Owner: VIACOM STATIONS GROUP OF PHILADELPHIA INC.)
- WCAU (Channel 10; PHILADELPHIA, PA; Owner: NBC SUBSIDIARY (WCAU-TV), L.P.)
- WWJT-LP (Channel 7; PHILADELPHIA, PA; Owner: PHILADELPHIA TELEVISION NETWORK, INC)
- WGTW (Channel 48; BURLINGTON, NJ; Owner: BRUNSON COMMUNICATIONS, INC.)
- WYBE (Channel 35; PHILADELPHIA, PA; Owner: INDEPENDENCE PUBLIC MEDIA OF PHILADELPHIA, INC.)
- WMCN-TV (Channel 53; ATLANTIC CITY, NJ; Owner: LENFEST BROADCASTING, LLC)
- WHYY-TV (Channel 12; WILMINGTON, DE; Owner: WHYY, INC.)
- WUVP (Channel 65; VINELAND, NJ; Owner: UNIVISION PHILADELPHIA LLC)
- WTXF-TV (Channel 29; PHILADELPHIA, PA; Owner: FOX TV STATIONS OF PHILADELPHIA)
- W40AZ (Channel 40; WILMINGTON, DE; Owner: NATIONAL MINORITY T.V., INC.)
- W55BT (Channel 55; TALLEYVILLE, DE; Owner: MEDIACASTING LLC)
- WELL-LP (Channel 8; WILLOW GROVE, ETC., PA; Owner: WORD OF GOD FELLOWSHIP, INC.)
- WNJS (Channel 23; CAMDEN, NJ; Owner: NEW JERSEY PUBLIC BROADCASTING AUTHORITY)
- WFPA-CA (Channel 28; PHILADELPHIA, PA; Owner: WXTV LICENSE PARTNERSHIP, G.P.)
- National Bridge Inventory (NBI) Statistics
- 30Number of bridges
- 2,425ft / 739mTotal length
- $95,742,000Total costs
- 832,143Total average daily traffic
- 74,826Total average daily truck traffic
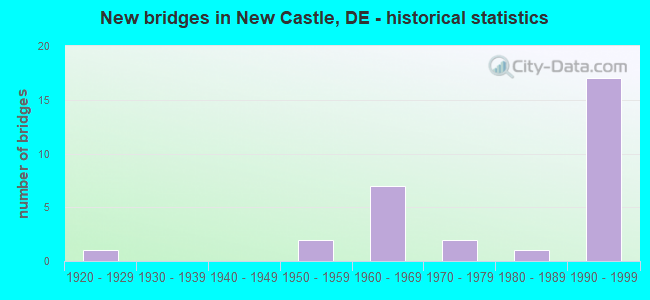
- New bridges - historical statistics
- 11920-1929
- 21950-1959
- 71960-1969
- 21970-1979
- 11980-1989
- 171990-1999
FCC Registered Private Land Mobile Towers: 2 (See the full list of FCC Registered Private Land Mobile Towers in New Castle, DE)
FCC Registered Broadcast Land Mobile Towers: 41 (See the full list of FCC Registered Broadcast Land Mobile Towers)
FCC Registered Microwave Towers: 37 (See the full list of FCC Registered Microwave Towers in this town)
FCC Registered Maritime Coast & Aviation Ground Towers: 14 (See the full list of FCC Registered Maritime Coast & Aviation Ground Towers)
FCC Registered Amateur Radio Licenses: 142 (See the full list of FCC Registered Amateur Radio Licenses in New Castle)
FAA Registered Aircraft Manufacturers and Dealers: 1 (See the full list of FAA Registered Manufacturers and Dealers in New Castle)
FAA Registered Aircraft: 239 (See the full list of FAA Registered Aircraft)
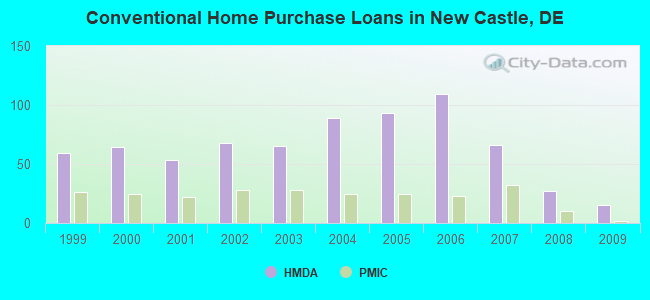
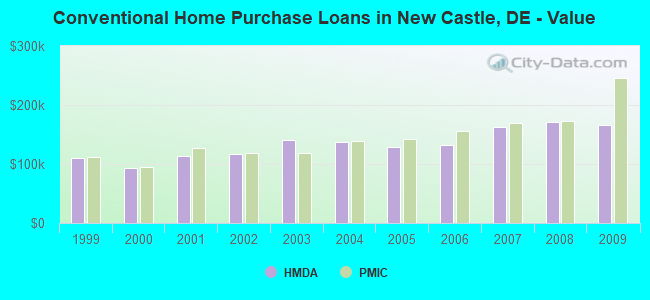
| Home Mortgage Disclosure Act Aggregated Statistics For Year 2009 (Based on 1 full and 3 partial tracts) | ||||||||||
| A) FHA, FSA/RHS & VA Home Purchase Loans | B) Conventional Home Purchase Loans | C) Refinancings | D) Home Improvement Loans | F) Non-occupant Loans on < 5 Family Dwellings (A B C & D) | ||||||
|---|---|---|---|---|---|---|---|---|---|---|
| Number | Average Value | Number | Average Value | Number | Average Value | Number | Average Value | Number | Average Value | |
| LOANS ORIGINATED | 36 | $167,842 | 15 | $166,899 | 93 | $162,127 | 9 | $57,891 | 11 | $141,414 |
| APPLICATIONS APPROVED, NOT ACCEPTED | 1 | $179,780 | 3 | $190,557 | 8 | $171,936 | 2 | $83,400 | 1 | $65,670 |
| APPLICATIONS DENIED | 4 | $146,880 | 3 | $76,397 | 48 | $136,160 | 14 | $60,721 | 2 | $42,340 |
| APPLICATIONS WITHDRAWN | 4 | $188,178 | 1 | $216,820 | 24 | $160,348 | 1 | $88,590 | 3 | $171,967 |
| FILES CLOSED FOR INCOMPLETENESS | 0 | $0 | 0 | $0 | 11 | $155,598 | 1 | $93,000 | 1 | $108,500 |
Detailed HMDA statistics for the following Tracts: 0151.00 , 0158.00, 0161.00, 0162.00
| Private Mortgage Insurance Companies Aggregated Statistics For Year 2009 (Based on 1 full and 2 partial tracts) | ||||
| A) Conventional Home Purchase Loans | B) Refinancings | |||
|---|---|---|---|---|
| Number | Average Value | Number | Average Value | |
| LOANS ORIGINATED | 2 | $245,500 | 1 | $143,950 |
| APPLICATIONS APPROVED, NOT ACCEPTED | 0 | $0 | 1 | $190,440 |
| APPLICATIONS DENIED | 2 | $252,645 | 0 | $0 |
| APPLICATIONS WITHDRAWN | 0 | $0 | 0 | $0 |
| FILES CLOSED FOR INCOMPLETENESS | 0 | $0 | 0 | $0 |
Detailed PMIC statistics for the following Tracts: 0151.00 , 0158.00, 0161.00, 0162.00
2002 - 2018 National Fire Incident Reporting System (NFIRS) incidents
- Fire incident types reported to NFIRS in New Castle, DE
- 5,93366.9%Structure Fires
- 1,60918.2%Outside Fires
- 1,05911.9%Mobile Property/Vehicle Fires
- 2623.0%Other
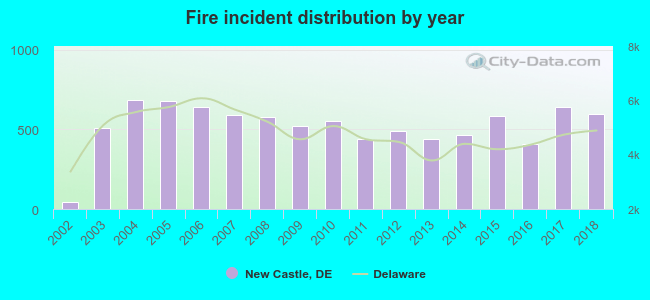 Based on the data from the years 2002 - 2018 the average number of fires per year is 521. The highest number of reported fires - 683 took place in 2004, and the least - 45 in 2002. The data has an increasing trend.
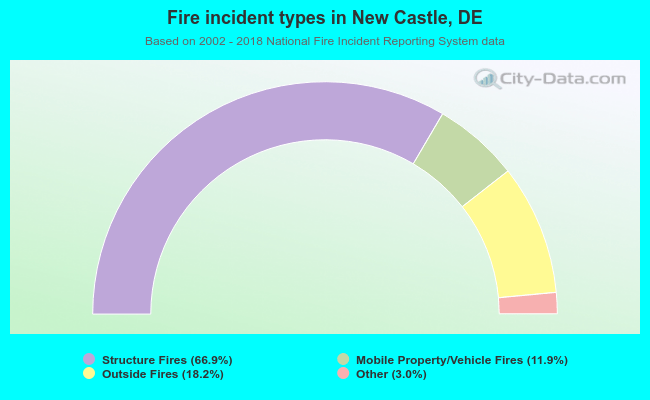 When looking into fire subcategories, the most reports belonged to: Structure Fires (66.9%), and Outside Fires (18.2%).
Fire-safe hotels and motels in New Castle, Delaware:
- Super 8 Motel, 215 S Dupont Hwy, New Castle, Delaware 19720 , Phone: (302) 322-9480
- Dutch Inn, 111 S Dupont Hwy, New Castle, Delaware 19720 , Phone: (302) 328-6246, Fax: (302) 328-9493
- Budget Inn, 3 Memorial Dr, New Castle, Delaware 19720 , Phone: (302) 654-5400, Fax: (302) 654-5775
- New Castle Super Lodge, 1213 West Ave, New Castle, Delaware 19720 , Phone: (302) 654-5544, Fax: (302) 652-0146
- Quality Inn Skyways, 147 N Dupont Hwy, New Castle, Delaware 19720 , Phone: (302) 328-6666, Fax: (302) 322-3791
- Clarion Hotel, 1612 N Dupont Hwy, New Castle, Delaware 19720 , Phone: (302) 428-1000, Fax: (302) 428-1440
- Sheraton Wilmington South, 365 Airport Rd, New Castle, Delaware 19720 , Phone: (302) 328-6200
- Fairfield Inn And Suites, 2117 N Dupont Hwy, New Castle, Delaware 19720 , Phone: (302) 777-4700, Fax: (302) 777-4701
| Most common first names in New Castle, DE among deceased individuals | ||
| Name | Count | Lived (average) |
|---|---|---|
| John | 426 | 71.5 years |
| William | 387 | 70.7 years |
| Mary | 369 | 76.9 years |
| James | 319 | 70.8 years |
| Robert | 204 | 65.7 years |
| Charles | 199 | 73.8 years |
| Joseph | 192 | 71.8 years |
| George | 161 | 71.5 years |
| Elizabeth | 148 | 76.5 years |
| Margaret | 148 | 75.8 years |
| Most common last names in New Castle, DE among deceased individuals | ||
| Last name | Count | Lived (average) |
|---|---|---|
| Smith | 106 | 70.7 years |
| Johnson | 93 | 70.4 years |
| Brown | 84 | 69.1 years |
| Jones | 77 | 71.2 years |
| Williams | 72 | 70.2 years |
| Davis | 68 | 71.3 years |
| Wilson | 57 | 73.2 years |
| Taylor | 54 | 72.2 years |
| Thomas | 51 | 70.7 years |
| White | 48 | 73.9 years |
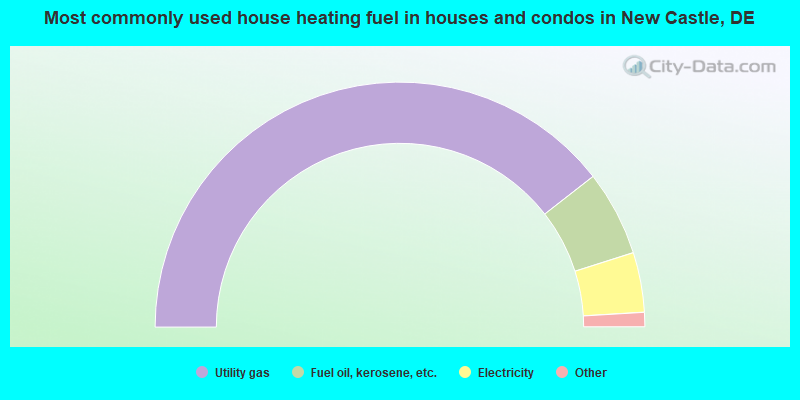
- 79.0%Utility gas
- 11.3%Fuel oil, kerosene, etc.
- 7.9%Electricity
- 1.5%No fuel used
- 0.3%Bottled, tank, or LP gas
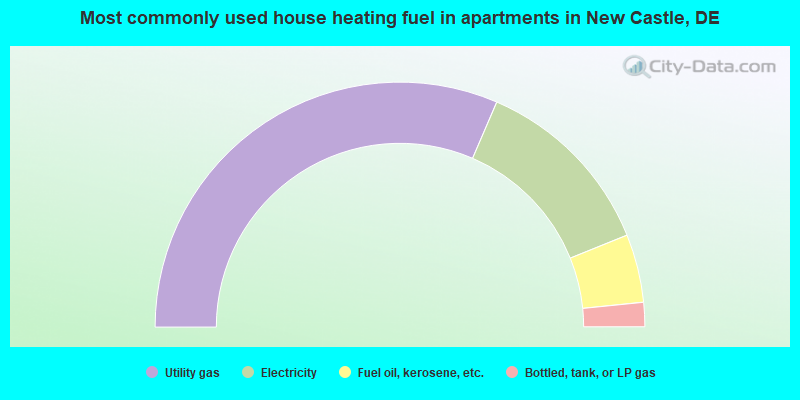
- 62.9%Utility gas
- 24.8%Electricity
- 9.0%Fuel oil, kerosene, etc.
- 3.2%Bottled, tank, or LP gas
New Castle compared to Delaware state average:
- Unemployed percentage significantly below state average.
- House age above state average.
- Number of college students below state average.
New Castle on our top lists:
- #21 on the list of "Top 101 cities with largest percentage of females in industries: finance and insurance (population 5,000+)"
- #53 on the list of "Top 101 cities with the most residents born in Sierra Leone (population 500+)"
- #17 on the list of "Top 101 counties with the highest number of infant deaths per 1000 residents 2007-2013 (pop. 50,000+)"
- #35 on the list of "Top 101 counties with the highest percentage of residents that visited a dentist within the past year"
- #51 on the list of "Top 101 counties with the highest carbon monoxide air pollution readings in 2012 (ppm)"
- #53 on the list of "Top 101 counties with the highest average weight of females"
- #55 on the list of "Top 101 counties with the highest Nitrogen Dioxide air pollution readings in 2012 (ppm)"

|
|
Total of 139 patent applications in 2008-2024.