Shorewood, Minnesota Submit your own pictures of this city and show them to the world
OSM Map
General Map
Google Map
MSN Map
OSM Map
General Map
Google Map
MSN Map
OSM Map
General Map
Google Map
MSN Map
OSM Map
General Map
Google Map
MSN Map
Please wait while loading the map...
Population in 2022: 7,624 (100% urban, 0% rural). Population change since 2000: +3.0%Males: 3,908 Females: 3,716
March 2022 cost of living index in Shorewood: 115.2 (more than average, U.S. average is 100) Percentage of residents living in poverty in 2022: 4.3%for White Non-Hispanic residents , 23.8% for Black residents , 3.8% for Hispanic or Latino residents , 78.9% for other race residents )Business Search - 14 Million verified businesses
Data:
Median household income ($)
Median household income (% change since 2000)
Household income diversity
Ratio of average income to average house value (%)
Ratio of average income to average rent
Median household income ($) - White
Median household income ($) - Black or African American
Median household income ($) - Asian
Median household income ($) - Hispanic or Latino
Median household income ($) - American Indian and Alaska Native
Median household income ($) - Multirace
Median household income ($) - Other Race
Median household income for houses/condos with a mortgage ($)
Median household income for apartments without a mortgage ($)
Races - White alone (%)
Races - White alone (% change since 2000)
Races - Black alone (%)
Races - Black alone (% change since 2000)
Races - American Indian alone (%)
Races - American Indian alone (% change since 2000)
Races - Asian alone (%)
Races - Asian alone (% change since 2000)
Races - Hispanic (%)
Races - Hispanic (% change since 2000)
Races - Native Hawaiian and Other Pacific Islander alone (%)
Races - Native Hawaiian and Other Pacific Islander alone (% change since 2000)
Races - Two or more races (%)
Races - Two or more races (% change since 2000)
Races - Other race alone (%)
Races - Other race alone (% change since 2000)
Racial diversity
Unemployment (%)
Unemployment (% change since 2000)
Unemployment (%) - White
Unemployment (%) - Black or African American
Unemployment (%) - Asian
Unemployment (%) - Hispanic or Latino
Unemployment (%) - American Indian and Alaska Native
Unemployment (%) - Multirace
Unemployment (%) - Other Race
Population density (people per square mile)
Population - Males (%)
Population - Females (%)
Population - Males (%) - White
Population - Males (%) - Black or African American
Population - Males (%) - Asian
Population - Males (%) - Hispanic or Latino
Population - Males (%) - American Indian and Alaska Native
Population - Males (%) - Multirace
Population - Males (%) - Other Race
Population - Females (%) - White
Population - Females (%) - Black or African American
Population - Females (%) - Asian
Population - Females (%) - Hispanic or Latino
Population - Females (%) - American Indian and Alaska Native
Population - Females (%) - Multirace
Population - Females (%) - Other Race
Coronavirus confirmed cases (Apr 27, 2024)
Deaths caused by coronavirus (Apr 27, 2024)
Coronavirus confirmed cases (per 100k population) (Apr 27, 2024)
Deaths caused by coronavirus (per 100k population) (Apr 27, 2024)
Daily increase in number of cases (Apr 27, 2024)
Weekly increase in number of cases (Apr 27, 2024)
Cases doubled (in days) (Apr 27, 2024)
Hospitalized patients (Apr 18, 2022)
Negative test results (Apr 18, 2022)
Total test results (Apr 18, 2022)
COVID Vaccine doses distributed (per 100k population) (Sep 19, 2023)
COVID Vaccine doses administered (per 100k population) (Sep 19, 2023)
COVID Vaccine doses distributed (Sep 19, 2023)
COVID Vaccine doses administered (Sep 19, 2023)
Likely homosexual households (%)
Likely homosexual households (% change since 2000)
Likely homosexual households - Lesbian couples (%)
Likely homosexual households - Lesbian couples (% change since 2000)
Likely homosexual households - Gay men (%)
Likely homosexual households - Gay men (% change since 2000)
Cost of living index
Median gross rent ($)
Median contract rent ($)
Median monthly housing costs ($)
Median house or condo value ($)
Median house or condo value ($ change since 2000)
Mean house or condo value by units in structure - 1, detached ($)
Mean house or condo value by units in structure - 1, attached ($)
Mean house or condo value by units in structure - 2 ($)
Mean house or condo value by units in structure by units in structure - 3 or 4 ($)
Mean house or condo value by units in structure - 5 or more ($)
Mean house or condo value by units in structure - Boat, RV, van, etc. ($)
Mean house or condo value by units in structure - Mobile home ($)
Median house or condo value ($) - White
Median house or condo value ($) - Black or African American
Median house or condo value ($) - Asian
Median house or condo value ($) - Hispanic or Latino
Median house or condo value ($) - American Indian and Alaska Native
Median house or condo value ($) - Multirace
Median house or condo value ($) - Other Race
Median resident age
Resident age diversity
Median resident age - Males
Median resident age - Females
Median resident age - White
Median resident age - Black or African American
Median resident age - Asian
Median resident age - Hispanic or Latino
Median resident age - American Indian and Alaska Native
Median resident age - Multirace
Median resident age - Other Race
Median resident age - Males - White
Median resident age - Males - Black or African American
Median resident age - Males - Asian
Median resident age - Males - Hispanic or Latino
Median resident age - Males - American Indian and Alaska Native
Median resident age - Males - Multirace
Median resident age - Males - Other Race
Median resident age - Females - White
Median resident age - Females - Black or African American
Median resident age - Females - Asian
Median resident age - Females - Hispanic or Latino
Median resident age - Females - American Indian and Alaska Native
Median resident age - Females - Multirace
Median resident age - Females - Other Race
Commute - mean travel time to work (minutes)
Travel time to work - Less than 5 minutes (%)
Travel time to work - Less than 5 minutes (% change since 2000)
Travel time to work - 5 to 9 minutes (%)
Travel time to work - 5 to 9 minutes (% change since 2000)
Travel time to work - 10 to 19 minutes (%)
Travel time to work - 10 to 19 minutes (% change since 2000)
Travel time to work - 20 to 29 minutes (%)
Travel time to work - 20 to 29 minutes (% change since 2000)
Travel time to work - 30 to 39 minutes (%)
Travel time to work - 30 to 39 minutes (% change since 2000)
Travel time to work - 40 to 59 minutes (%)
Travel time to work - 40 to 59 minutes (% change since 2000)
Travel time to work - 60 to 89 minutes (%)
Travel time to work - 60 to 89 minutes (% change since 2000)
Travel time to work - 90 or more minutes (%)
Travel time to work - 90 or more minutes (% change since 2000)
Marital status - Never married (%)
Marital status - Now married (%)
Marital status - Separated (%)
Marital status - Widowed (%)
Marital status - Divorced (%)
Median family income ($)
Median family income (% change since 2000)
Median non-family income ($)
Median non-family income (% change since 2000)
Median per capita income ($)
Median per capita income (% change since 2000)
Median family income ($) - White
Median family income ($) - Black or African American
Median family income ($) - Asian
Median family income ($) - Hispanic or Latino
Median family income ($) - American Indian and Alaska Native
Median family income ($) - Multirace
Median family income ($) - Other Race
Median year house/condo built
Median year apartment built
Year house built - Built 2005 or later (%)
Year house built - Built 2000 to 2004 (%)
Year house built - Built 1990 to 1999 (%)
Year house built - Built 1980 to 1989 (%)
Year house built - Built 1970 to 1979 (%)
Year house built - Built 1960 to 1969 (%)
Year house built - Built 1950 to 1959 (%)
Year house built - Built 1940 to 1949 (%)
Year house built - Built 1939 or earlier (%)
Average household size
Household density (households per square mile)
Average household size - White
Average household size - Black or African American
Average household size - Asian
Average household size - Hispanic or Latino
Average household size - American Indian and Alaska Native
Average household size - Multirace
Average household size - Other Race
Occupied housing units (%)
Vacant housing units (%)
Owner occupied housing units (%)
Renter occupied housing units (%)
Vacancy status - For rent (%)
Vacancy status - For sale only (%)
Vacancy status - Rented or sold, not occupied (%)
Vacancy status - For seasonal, recreational, or occasional use (%)
Vacancy status - For migrant workers (%)
Vacancy status - Other vacant (%)
Residents with income below the poverty level (%)
Residents with income below 50% of the poverty level (%)
Children below poverty level (%)
Poor families by family type - Married-couple family (%)
Poor families by family type - Male, no wife present (%)
Poor families by family type - Female, no husband present (%)
Poverty status for native-born residents (%)
Poverty status for foreign-born residents (%)
Poverty among high school graduates not in families (%)
Poverty among people who did not graduate high school not in families (%)
Residents with income below the poverty level (%) - White
Residents with income below the poverty level (%) - Black or African American
Residents with income below the poverty level (%) - Asian
Residents with income below the poverty level (%) - Hispanic or Latino
Residents with income below the poverty level (%) - American Indian and Alaska Native
Residents with income below the poverty level (%) - Multirace
Residents with income below the poverty level (%) - Other Race
Air pollution - Air Quality Index (AQI)
Air pollution - CO
Air pollution - NO2
Air pollution - SO2
Air pollution - Ozone
Air pollution - PM10
Air pollution - PM25
Air pollution - Pb
Crime - Murders per 100,000 population
Crime - Rapes per 100,000 population
Crime - Robberies per 100,000 population
Crime - Assaults per 100,000 population
Crime - Burglaries per 100,000 population
Crime - Thefts per 100,000 population
Crime - Auto thefts per 100,000 population
Crime - Arson per 100,000 population
Crime - City-data.com crime index
Crime - Violent crime index
Crime - Property crime index
Crime - Murders per 100,000 population (5 year average)
Crime - Rapes per 100,000 population (5 year average)
Crime - Robberies per 100,000 population (5 year average)
Crime - Assaults per 100,000 population (5 year average)
Crime - Burglaries per 100,000 population (5 year average)
Crime - Thefts per 100,000 population (5 year average)
Crime - Auto thefts per 100,000 population (5 year average)
Crime - Arson per 100,000 population (5 year average)
Crime - City-data.com crime index (5 year average)
Crime - Violent crime index (5 year average)
Crime - Property crime index (5 year average)
1996 Presidential Elections Results (%) - Democratic Party (Clinton)
1996 Presidential Elections Results (%) - Republican Party (Dole)
1996 Presidential Elections Results (%) - Other
2000 Presidential Elections Results (%) - Democratic Party (Gore)
2000 Presidential Elections Results (%) - Republican Party (Bush)
2000 Presidential Elections Results (%) - Other
2004 Presidential Elections Results (%) - Democratic Party (Kerry)
2004 Presidential Elections Results (%) - Republican Party (Bush)
2004 Presidential Elections Results (%) - Other
2008 Presidential Elections Results (%) - Democratic Party (Obama)
2008 Presidential Elections Results (%) - Republican Party (McCain)
2008 Presidential Elections Results (%) - Other
2012 Presidential Elections Results (%) - Democratic Party (Obama)
2012 Presidential Elections Results (%) - Republican Party (Romney)
2012 Presidential Elections Results (%) - Other
2016 Presidential Elections Results (%) - Democratic Party (Clinton)
2016 Presidential Elections Results (%) - Republican Party (Trump)
2016 Presidential Elections Results (%) - Other
2020 Presidential Elections Results (%) - Democratic Party (Biden)
2020 Presidential Elections Results (%) - Republican Party (Trump)
2020 Presidential Elections Results (%) - Other
Ancestries Reported - Arab (%)
Ancestries Reported - Czech (%)
Ancestries Reported - Danish (%)
Ancestries Reported - Dutch (%)
Ancestries Reported - English (%)
Ancestries Reported - French (%)
Ancestries Reported - French Canadian (%)
Ancestries Reported - German (%)
Ancestries Reported - Greek (%)
Ancestries Reported - Hungarian (%)
Ancestries Reported - Irish (%)
Ancestries Reported - Italian (%)
Ancestries Reported - Lithuanian (%)
Ancestries Reported - Norwegian (%)
Ancestries Reported - Polish (%)
Ancestries Reported - Portuguese (%)
Ancestries Reported - Russian (%)
Ancestries Reported - Scotch-Irish (%)
Ancestries Reported - Scottish (%)
Ancestries Reported - Slovak (%)
Ancestries Reported - Subsaharan African (%)
Ancestries Reported - Swedish (%)
Ancestries Reported - Swiss (%)
Ancestries Reported - Ukrainian (%)
Ancestries Reported - United States (%)
Ancestries Reported - Welsh (%)
Ancestries Reported - West Indian (%)
Ancestries Reported - Other (%)
Educational Attainment - No schooling completed (%)
Educational Attainment - Less than high school (%)
Educational Attainment - High school or equivalent (%)
Educational Attainment - Less than 1 year of college (%)
Educational Attainment - 1 or more years of college (%)
Educational Attainment - Associate degree (%)
Educational Attainment - Bachelor's degree (%)
Educational Attainment - Master's degree (%)
Educational Attainment - Professional school degree (%)
Educational Attainment - Doctorate degree (%)
School Enrollment - Nursery, preschool (%)
School Enrollment - Kindergarten (%)
School Enrollment - Grade 1 to 4 (%)
School Enrollment - Grade 5 to 8 (%)
School Enrollment - Grade 9 to 12 (%)
School Enrollment - College undergrad (%)
School Enrollment - Graduate or professional (%)
School Enrollment - Not enrolled in school (%)
School enrollment - Public schools (%)
School enrollment - Private schools (%)
School enrollment - Not enrolled (%)
Median number of rooms in houses and condos
Median number of rooms in apartments
Housing units lacking complete plumbing facilities (%)
Housing units lacking complete kitchen facilities (%)
Density of houses
Urban houses (%)
Rural houses (%)
Households with people 60 years and over (%)
Households with people 65 years and over (%)
Households with people 75 years and over (%)
Households with one or more nonrelatives (%)
Households with no nonrelatives (%)
Population in households (%)
Family households (%)
Nonfamily households (%)
Population in families (%)
Family households with own children (%)
Median number of bedrooms in owner occupied houses
Mean number of bedrooms in owner occupied houses
Median number of bedrooms in renter occupied houses
Mean number of bedrooms in renter occupied houses
Median number of vehichles in owner occupied houses
Mean number of vehichles in owner occupied houses
Median number of vehichles in renter occupied houses
Mean number of vehichles in renter occupied houses
Mortgage status - with mortgage (%)
Mortgage status - with second mortgage (%)
Mortgage status - with home equity loan (%)
Mortgage status - with both second mortgage and home equity loan (%)
Mortgage status - without a mortgage (%)
Average family size
Average family size - White
Average family size - Black or African American
Average family size - Asian
Average family size - Hispanic or Latino
Average family size - American Indian and Alaska Native
Average family size - Multirace
Average family size - Other Race
Geographical mobility - Same house 1 year ago (%)
Geographical mobility - Moved within same county (%)
Geographical mobility - Moved from different county within same state (%)
Geographical mobility - Moved from different state (%)
Geographical mobility - Moved from abroad (%)
Place of birth - Born in state of residence (%)
Place of birth - Born in other state (%)
Place of birth - Native, outside of US (%)
Place of birth - Foreign born (%)
Housing units in structures - 1, detached (%)
Housing units in structures - 1, attached (%)
Housing units in structures - 2 (%)
Housing units in structures - 3 or 4 (%)
Housing units in structures - 5 to 9 (%)
Housing units in structures - 10 to 19 (%)
Housing units in structures - 20 to 49 (%)
Housing units in structures - 50 or more (%)
Housing units in structures - Mobile home (%)
Housing units in structures - Boat, RV, van, etc. (%)
House/condo owner moved in on average (years ago)
Renter moved in on average (years ago)
Year householder moved into unit - Moved in 1999 to March 2000 (%)
Year householder moved into unit - Moved in 1995 to 1998 (%)
Year householder moved into unit - Moved in 1990 to 1994 (%)
Year householder moved into unit - Moved in 1980 to 1989 (%)
Year householder moved into unit - Moved in 1970 to 1979 (%)
Year householder moved into unit - Moved in 1969 or earlier (%)
Means of transportation to work - Drove car alone (%)
Means of transportation to work - Carpooled (%)
Means of transportation to work - Public transportation (%)
Means of transportation to work - Bus or trolley bus (%)
Means of transportation to work - Streetcar or trolley car (%)
Means of transportation to work - Subway or elevated (%)
Means of transportation to work - Railroad (%)
Means of transportation to work - Ferryboat (%)
Means of transportation to work - Taxicab (%)
Means of transportation to work - Motorcycle (%)
Means of transportation to work - Bicycle (%)
Means of transportation to work - Walked (%)
Means of transportation to work - Other means (%)
Working at home (%)
Industry diversity
Most Common Industries - Agriculture, forestry, fishing and hunting, and mining (%)
Most Common Industries - Agriculture, forestry, fishing and hunting (%)
Most Common Industries - Mining, quarrying, and oil and gas extraction (%)
Most Common Industries - Construction (%)
Most Common Industries - Manufacturing (%)
Most Common Industries - Wholesale trade (%)
Most Common Industries - Retail trade (%)
Most Common Industries - Transportation and warehousing, and utilities (%)
Most Common Industries - Transportation and warehousing (%)
Most Common Industries - Utilities (%)
Most Common Industries - Information (%)
Most Common Industries - Finance and insurance, and real estate and rental and leasing (%)
Most Common Industries - Finance and insurance (%)
Most Common Industries - Real estate and rental and leasing (%)
Most Common Industries - Professional, scientific, and management, and administrative and waste management services (%)
Most Common Industries - Professional, scientific, and technical services (%)
Most Common Industries - Management of companies and enterprises (%)
Most Common Industries - Administrative and support and waste management services (%)
Most Common Industries - Educational services, and health care and social assistance (%)
Most Common Industries - Educational services (%)
Most Common Industries - Health care and social assistance (%)
Most Common Industries - Arts, entertainment, and recreation, and accommodation and food services (%)
Most Common Industries - Arts, entertainment, and recreation (%)
Most Common Industries - Accommodation and food services (%)
Most Common Industries - Other services, except public administration (%)
Most Common Industries - Public administration (%)
Occupation diversity
Most Common Occupations - Management, business, science, and arts occupations (%)
Most Common Occupations - Management, business, and financial occupations (%)
Most Common Occupations - Management occupations (%)
Most Common Occupations - Business and financial operations occupations (%)
Most Common Occupations - Computer, engineering, and science occupations (%)
Most Common Occupations - Computer and mathematical occupations (%)
Most Common Occupations - Architecture and engineering occupations (%)
Most Common Occupations - Life, physical, and social science occupations (%)
Most Common Occupations - Education, legal, community service, arts, and media occupations (%)
Most Common Occupations - Community and social service occupations (%)
Most Common Occupations - Legal occupations (%)
Most Common Occupations - Education, training, and library occupations (%)
Most Common Occupations - Arts, design, entertainment, sports, and media occupations (%)
Most Common Occupations - Healthcare practitioners and technical occupations (%)
Most Common Occupations - Health diagnosing and treating practitioners and other technical occupations (%)
Most Common Occupations - Health technologists and technicians (%)
Most Common Occupations - Service occupations (%)
Most Common Occupations - Healthcare support occupations (%)
Most Common Occupations - Protective service occupations (%)
Most Common Occupations - Fire fighting and prevention, and other protective service workers including supervisors (%)
Most Common Occupations - Law enforcement workers including supervisors (%)
Most Common Occupations - Food preparation and serving related occupations (%)
Most Common Occupations - Building and grounds cleaning and maintenance occupations (%)
Most Common Occupations - Personal care and service occupations (%)
Most Common Occupations - Sales and office occupations (%)
Most Common Occupations - Sales and related occupations (%)
Most Common Occupations - Office and administrative support occupations (%)
Most Common Occupations - Natural resources, construction, and maintenance occupations (%)
Most Common Occupations - Farming, fishing, and forestry occupations (%)
Most Common Occupations - Construction and extraction occupations (%)
Most Common Occupations - Installation, maintenance, and repair occupations (%)
Most Common Occupations - Production, transportation, and material moving occupations (%)
Most Common Occupations - Production occupations (%)
Most Common Occupations - Transportation occupations (%)
Most Common Occupations - Material moving occupations (%)
People in Group quarters - Institutionalized population (%)
People in Group quarters - Correctional institutions (%)
People in Group quarters - Federal prisons and detention centers (%)
People in Group quarters - Halfway houses (%)
People in Group quarters - Local jails and other confinement facilities (including police lockups) (%)
People in Group quarters - Military disciplinary barracks (%)
People in Group quarters - State prisons (%)
People in Group quarters - Other types of correctional institutions (%)
People in Group quarters - Nursing homes (%)
People in Group quarters - Hospitals/wards, hospices, and schools for the handicapped (%)
People in Group quarters - Hospitals/wards and hospices for chronically ill (%)
People in Group quarters - Hospices or homes for chronically ill (%)
People in Group quarters - Military hospitals or wards for chronically ill (%)
People in Group quarters - Other hospitals or wards for chronically ill (%)
People in Group quarters - Hospitals or wards for drug/alcohol abuse (%)
People in Group quarters - Mental (Psychiatric) hospitals or wards (%)
People in Group quarters - Schools, hospitals, or wards for the mentally retarded (%)
People in Group quarters - Schools, hospitals, or wards for the physically handicapped (%)
People in Group quarters - Institutions for the deaf (%)
People in Group quarters - Institutions for the blind (%)
People in Group quarters - Orthopedic wards and institutions for the physically handicapped (%)
People in Group quarters - Wards in general hospitals for patients who have no usual home elsewhere (%)
People in Group quarters - Wards in military hospitals for patients who have no usual home elsewhere (%)
People in Group quarters - Juvenile institutions (%)
People in Group quarters - Long-term care (%)
People in Group quarters - Homes for abused, dependent, and neglected children (%)
People in Group quarters - Residential treatment centers for emotionally disturbed children (%)
People in Group quarters - Training schools for juvenile delinquents (%)
People in Group quarters - Short-term care, detention or diagnostic centers for delinquent children (%)
People in Group quarters - Type of juvenile institution unknown (%)
People in Group quarters - Noninstitutionalized population (%)
People in Group quarters - College dormitories (includes college quarters off campus) (%)
People in Group quarters - Military quarters (%)
People in Group quarters - On base (%)
People in Group quarters - Barracks, unaccompanied personnel housing (UPH), (Enlisted/Officer), ;and similar group living quarters for military personnel (%)
People in Group quarters - Transient quarters for temporary residents (%)
People in Group quarters - Military ships (%)
People in Group quarters - Group homes (%)
People in Group quarters - Homes or halfway houses for drug/alcohol abuse (%)
People in Group quarters - Homes for the mentally ill (%)
People in Group quarters - Homes for the mentally retarded (%)
People in Group quarters - Homes for the physically handicapped (%)
People in Group quarters - Other group homes (%)
People in Group quarters - Religious group quarters (%)
People in Group quarters - Dormitories (%)
People in Group quarters - Agriculture workers' dormitories on farms (%)
People in Group quarters - Job Corps and vocational training facilities (%)
People in Group quarters - Other workers' dormitories (%)
People in Group quarters - Crews of maritime vessels (%)
People in Group quarters - Other nonhousehold living situations (%)
People in Group quarters - Other noninstitutional group quarters (%)
Residents speaking English at home (%)
Residents speaking English at home - Born in the United States (%)
Residents speaking English at home - Native, born elsewhere (%)
Residents speaking English at home - Foreign born (%)
Residents speaking Spanish at home (%)
Residents speaking Spanish at home - Born in the United States (%)
Residents speaking Spanish at home - Native, born elsewhere (%)
Residents speaking Spanish at home - Foreign born (%)
Residents speaking other language at home (%)
Residents speaking other language at home - Born in the United States (%)
Residents speaking other language at home - Native, born elsewhere (%)
Residents speaking other language at home - Foreign born (%)
Class of Workers - Employee of private company (%)
Class of Workers - Self-employed in own incorporated business (%)
Class of Workers - Private not-for-profit wage and salary workers (%)
Class of Workers - Local government workers (%)
Class of Workers - State government workers (%)
Class of Workers - Federal government workers (%)
Class of Workers - Self-employed workers in own not incorporated business and Unpaid family workers (%)
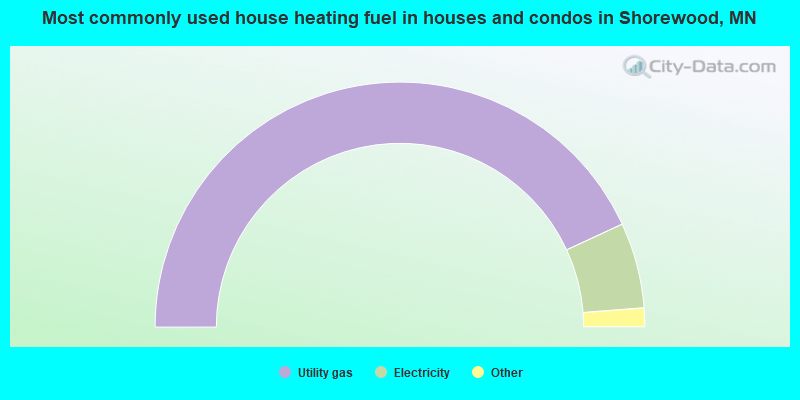
House heating fuel used in houses and condos - Utility gas (%)
House heating fuel used in houses and condos - Bottled, tank, or LP gas (%)
House heating fuel used in houses and condos - Electricity (%)
House heating fuel used in houses and condos - Fuel oil, kerosene, etc. (%)
House heating fuel used in houses and condos - Coal or coke (%)
House heating fuel used in houses and condos - Wood (%)
House heating fuel used in houses and condos - Solar energy (%)
House heating fuel used in houses and condos - Other fuel (%)
House heating fuel used in houses and condos - No fuel used (%)
House heating fuel used in apartments - Utility gas (%)
House heating fuel used in apartments - Bottled, tank, or LP gas (%)
House heating fuel used in apartments - Electricity (%)
House heating fuel used in apartments - Fuel oil, kerosene, etc. (%)
House heating fuel used in apartments - Coal or coke (%)
House heating fuel used in apartments - Wood (%)
House heating fuel used in apartments - Solar energy (%)
House heating fuel used in apartments - Other fuel (%)
House heating fuel used in apartments - No fuel used (%)
Armed forces status - In Armed Forces (%)
Armed forces status - Civilian (%)
Armed forces status - Civilian - Veteran (%)
Armed forces status - Civilian - Nonveteran (%)
Fatal accidents locations in years 2005-2021
Fatal accidents locations in 2005
Fatal accidents locations in 2006
Fatal accidents locations in 2007
Fatal accidents locations in 2008
Fatal accidents locations in 2009
Fatal accidents locations in 2010
Fatal accidents locations in 2011
Fatal accidents locations in 2012
Fatal accidents locations in 2013
Fatal accidents locations in 2014
Fatal accidents locations in 2015
Fatal accidents locations in 2016
Fatal accidents locations in 2017
Fatal accidents locations in 2018
Fatal accidents locations in 2019
Fatal accidents locations in 2020
Fatal accidents locations in 2021
Alcohol use - People drinking some alcohol every month (%)
Alcohol use - People not drinking at all (%)
Alcohol use - Average days/month drinking alcohol
Alcohol use - Average drinks/week
Alcohol use - Average days/year people drink much
Audiometry - Average condition of hearing (%)
Audiometry - People that can hear a whisper from across a quiet room (%)
Audiometry - People that can hear normal voice from across a quiet room (%)
Audiometry - Ears ringing, roaring, buzzing (%)
Audiometry - Had a job exposure to loud noise (%)
Audiometry - Had off-work exposure to loud noise (%)
Blood Pressure & Cholesterol - Has high blood pressure (%)
Blood Pressure & Cholesterol - Checking blood pressure at home (%)
Blood Pressure & Cholesterol - Frequently checking blood cholesterol (%)
Blood Pressure & Cholesterol - Has high cholesterol level (%)
Consumer Behavior - Money monthly spent on food at supermarket/grocery store
Consumer Behavior - Money monthly spent on food at other stores
Consumer Behavior - Money monthly spent on eating out
Consumer Behavior - Money monthly spent on carryout/delivered foods
Consumer Behavior - Income spent on food at supermarket/grocery store (%)
Consumer Behavior - Income spent on food at other stores (%)
Consumer Behavior - Income spent on eating out (%)
Consumer Behavior - Income spent on carryout/delivered foods (%)
Current Health Status - General health condition (%)
Current Health Status - Blood donors (%)
Current Health Status - Has blood ever tested for HIV virus (%)
Current Health Status - Left-handed people (%)
Dermatology - People using sunscreen (%)
Diabetes - Diabetics (%)
Diabetes - Had a blood test for high blood sugar (%)
Diabetes - People taking insulin (%)
Diet Behavior & Nutrition - Diet health (%)
Diet Behavior & Nutrition - Milk product consumption (# of products/month)
Diet Behavior & Nutrition - Meals not home prepared (#/week)
Diet Behavior & Nutrition - Meals from fast food or pizza place (#/week)
Diet Behavior & Nutrition - Ready-to-eat foods (#/month)
Diet Behavior & Nutrition - Frozen meals/pizza (#/month)
Drug Use - People that ever used marijuana or hashish (%)
Drug Use - Ever used hard drugs (%)
Drug Use - Ever used any form of cocaine (%)
Drug Use - Ever used heroin (%)
Drug Use - Ever used methamphetamine (%)
Health Insurance - People covered by health insurance (%)
Kidney Conditions-Urology - Avg. # of times urinating at night
Medical Conditions - People with asthma (%)
Medical Conditions - People with anemia (%)
Medical Conditions - People with psoriasis (%)
Medical Conditions - People with overweight (%)
Medical Conditions - Elderly people having difficulties in thinking or remembering (%)
Medical Conditions - People who ever received blood transfusion (%)
Medical Conditions - People having trouble seeing even with glass/contacts (%)
Medical Conditions - People with arthritis (%)
Medical Conditions - People with gout (%)
Medical Conditions - People with congestive heart failure (%)
Medical Conditions - People with coronary heart disease (%)
Medical Conditions - People with angina pectoris (%)
Medical Conditions - People who ever had heart attack (%)
Medical Conditions - People who ever had stroke (%)
Medical Conditions - People with emphysema (%)
Medical Conditions - People with thyroid problem (%)
Medical Conditions - People with chronic bronchitis (%)
Medical Conditions - People with any liver condition (%)
Medical Conditions - People who ever had cancer or malignancy (%)
Mental Health - People who have little interest in doing things (%)
Mental Health - People feeling down, depressed, or hopeless (%)
Mental Health - People who have trouble sleeping or sleeping too much (%)
Mental Health - People feeling tired or having little energy (%)
Mental Health - People with poor appetite or overeating (%)
Mental Health - People feeling bad about themself (%)
Mental Health - People who have trouble concentrating on things (%)
Mental Health - People moving or speaking slowly or too fast (%)
Mental Health - People having thoughts they would be better off dead (%)
Oral Health - Average years since last visit a dentist
Oral Health - People embarrassed because of mouth (%)
Oral Health - People with gum disease (%)
Oral Health - General health of teeth and gums (%)
Oral Health - Average days a week using dental floss/device
Oral Health - Average days a week using mouthwash for dental problem
Oral Health - Average number of teeth
Pesticide Use - Households using pesticides to control insects (%)
Pesticide Use - Households using pesticides to kill weeds (%)
Physical Activity - People doing vigorous-intensity work activities (%)
Physical Activity - People doing moderate-intensity work activities (%)
Physical Activity - People walking or bicycling (%)
Physical Activity - People doing vigorous-intensity recreational activities (%)
Physical Activity - People doing moderate-intensity recreational activities (%)
Physical Activity - Average hours a day doing sedentary activities
Physical Activity - Average hours a day watching TV or videos
Physical Activity - Average hours a day using computer
Physical Functioning - People having limitations keeping them from working (%)
Physical Functioning - People limited in amount of work they can do (%)
Physical Functioning - People that need special equipment to walk (%)
Physical Functioning - People experiencing confusion/memory problems (%)
Physical Functioning - People requiring special healthcare equipment (%)
Prescription Medications - Average number of prescription medicines taking
Preventive Aspirin Use - Adults 40+ taking low-dose aspirin (%)
Reproductive Health - Vaginal deliveries (%)
Reproductive Health - Cesarean deliveries (%)
Reproductive Health - Deliveries resulted in a live birth (%)
Reproductive Health - Pregnancies resulted in a delivery (%)
Reproductive Health - Women breastfeeding newborns (%)
Reproductive Health - Women that had a hysterectomy (%)
Reproductive Health - Women that had both ovaries removed (%)
Reproductive Health - Women that have ever taken birth control pills (%)
Reproductive Health - Women taking birth control pills (%)
Reproductive Health - Women that have ever used Depo-Provera or injectables (%)
Reproductive Health - Women that have ever used female hormones (%)
Sexual Behavior - People 18+ that ever had sex (vaginal, anal, or oral) (%)
Sexual Behavior - Males 18+ that ever had vaginal sex with a woman (%)
Sexual Behavior - Males 18+ that ever performed oral sex on a woman (%)
Sexual Behavior - Males 18+ that ever had anal sex with a woman (%)
Sexual Behavior - Males 18+ that ever had any sex with a man (%)
Sexual Behavior - Females 18+ that ever had vaginal sex with a man (%)
Sexual Behavior - Females 18+ that ever performed oral sex on a man (%)
Sexual Behavior - Females 18+ that ever had anal sex with a man (%)
Sexual Behavior - Females 18+ that ever had any kind of sex with a woman (%)
Sexual Behavior - Average age people first had sex
Sexual Behavior - Average number of female sex partners in lifetime (males 18+)
Sexual Behavior - Average number of female vaginal sex partners in lifetime (males 18+)
Sexual Behavior - Average age people first performed oral sex on a woman (18+)
Sexual Behavior - Average number of woman performed oral sex on in lifetime (18+)
Sexual Behavior - Average number of male sex partners in lifetime (males 18+)
Sexual Behavior - Average number of male anal sex partners in lifetime (males 18+)
Sexual Behavior - Average age people first performed oral sex on a man (18+)
Sexual Behavior - Average number of male oral sex partners in lifetime (18+)
Sexual Behavior - People using protection when performing oral sex (%)
Sexual Behavior - Average number of times people have vaginal or anal sex a year
Sexual Behavior - People having sex without condom (%)
Sexual Behavior - Average number of male sex partners in lifetime (females 18+)
Sexual Behavior - Average number of male vaginal sex partners in lifetime (females 18+)
Sexual Behavior - Average number of female sex partners in lifetime (females 18+)
Sexual Behavior - Circumcised males 18+ (%)
Sleep Disorders - Average hours sleeping at night
Sleep Disorders - People that has trouble sleeping (%)
Smoking-Cigarette Use - People smoking cigarettes (%)
Taste & Smell - People 40+ having problems with smell (%)
Taste & Smell - People 40+ having problems with taste (%)
Taste & Smell - People 40+ that ever had wisdom teeth removed (%)
Taste & Smell - People 40+ that ever had tonsils teeth removed (%)
Taste & Smell - People 40+ that ever had a loss of consciousness because of a head injury (%)
Taste & Smell - People 40+ that ever had a broken nose or other serious injury to face or skull (%)
Taste & Smell - People 40+ that ever had two or more sinus infections (%)
Weight - Average height (inches)
Weight - Average weight (pounds)
Weight - Average BMI
Weight - People that are obese (%)
Weight - People that ever were obese (%)
Weight - People trying to lose weight (%)
Latest news from Shorewood, MN collected exclusively by city-data.com from local newspapers, TV, and radio stations
Ancestries: German (31.8%), English (8.4%), Norwegian (8.4%), American (7.0%), Irish (6.2%), Swedish (4.9%).
Current Local Time:
Land area: 5.31 square miles.
Population density: 1,436 people per square mile (low).
342 residents are foreign born (2.2% Asia , 1.6% Europe ).
This city:
4.5%Minnesota:
8.5%
Median real estate property taxes paid for housing units with mortgages in 2022: $6,802 (1.0%)Median real estate property taxes paid for housing units with no mortgage in 2022: $7,038 (1.1%)
Nearest city with pop. 50,000+: Minnetonka, MN
Nearest city with pop. 200,000+: Minneapolis, MN
Nearest city with pop. 1,000,000+: Chicago, IL
Nearest cities:
Latitude: 44.90 N, Longitude: 93.58 W
Daytime population change due to commuting: -1,327 (-17.3%)Workers who live and work in this city: 1,378 (37.1%)
Single-family new house construction building permits:
2022: 12 buildings , average cost: $704,1002021: 29 buildings , average cost: $712,0002020: 43 buildings , average cost: $628,8002019: 52 buildings , average cost: $559,2002018: 59 buildings , average cost: $564,0002017: 20 buildings , average cost: $612,8002016: 11 buildings , average cost: $518,0002015: 14 buildings , average cost: $801,0002014: 18 buildings , average cost: $584,3002013: 16 buildings , average cost: $455,6002012: 18 buildings , average cost: $396,1002011: 8 buildings , average cost: $554,4002010: 8 buildings , average cost: $461,8002009: 3 buildings , average cost: $343,7002008: 7 buildings , average cost: $745,0002007: 17 buildings , average cost: $607,8002006: 31 buildings , average cost: $547,0002005: 24 buildings , average cost: $586,1002004: 25 buildings , average cost: $466,9002003: 25 buildings , average cost: $424,3002002: 8 buildings , average cost: $452,9002001: 34 buildings , average cost: $338,9002000: 62 buildings , average cost: $253,1001999: 39 buildings , average cost: $273,7001998: 34 buildings , average cost: $271,3001997: 41 buildings , average cost: $288,400Unemployment in December 2023:
Population change in the 1990s: +1,573 (+27.0%).
Most common occupations in Shorewood, MN (%)
Both Males Females
Other management occupations, except farmers and farm managers (6.7%)
Top executives (6.7%)
Sales representatives, services, wholesale and manufacturing (6.4%)
Advertising, marketing, promotions, public relations, and sales managers (5.5%)
Other office and administrative support workers, including supervisors (4.1%)
Retail sales workers, except cashiers (3.9%)
Other sales and related occupations, including supervisors (3.2%)
Top executives (10.3%)
Other management occupations, except farmers and farm managers (8.4%)
Sales representatives, services, wholesale and manufacturing (8.3%)
Advertising, marketing, promotions, public relations, and sales managers (6.4%)
Computer specialists (4.3%)
Other sales and related occupations, including supervisors (3.8%)
Engineers (3.6%)
Other office and administrative support workers, including supervisors (7.6%)
Retail sales workers, except cashiers (6.7%)
Preschool, kindergarten, elementary, and middle school teachers (5.7%)
Other management occupations, except farmers and farm managers (4.4%)
Advertising, marketing, promotions, public relations, and sales managers (4.2%)
Information and record clerks, except customer service representatives (4.2%)
Other teachers, instructors, education, training, and library occupations (4.0%)
Tornado activity:
Shorewood-area historical tornado activity is slightly above Minnesota state average. It is 30% greater than the overall U.S. average.
On 5/6/1965, a category F4 (max. wind speeds 207-260 mph) tornado 3.9 miles away from the Shorewood city center caused between $5,000,000 and $50,000,000 in damages.
On 5/6/1965, a category F4 tornado 8.7 miles away from the city center killed 3 people and injured 175 people and caused between $5,000,000 and $50,000,000 in damages.
Earthquake activity:
Shorewood-area historical earthquake activity is significantly above Minnesota state average. It is 53% smaller than the overall U.S. average. On 7/9/1975 at 14:54:15, a magnitude 4.6 (4.6 MB, Class: Light, Intensity: IV - V) earthquake occurred 131.0 miles away from the city center On 6/5/1993 at 01:24:53, a magnitude 4.1 (4.1 LG, Depth: 6.2 mi) earthquake occurred 142.5 miles away from the city center On 3/4/1983 at 06:32:18, a magnitude 4.6 (4.4 MB, 4.6 LG, 4.4 ML) earthquake occurred 291.3 miles away from the city center On 10/20/1995 at 15:57:18, a magnitude 3.7 (3.7 LG, Depth: 3.1 mi, Class: Light, Intensity: II - III) earthquake occurred 171.0 miles away from the city center On 2/9/1994 at 08:45:35, a magnitude 3.1 (3.1 LG, Depth: 3.1 mi) earthquake occurred 69.9 miles away from Shorewood center On 11/3/2002 at 20:41:56, a magnitude 4.3 (4.3 MB, Depth: 3.1 mi) earthquake occurred 303.6 miles away from the city center Magnitude types: regional Lg-wave magnitude (LG), body-wave magnitude (MB), local magnitude (ML) Natural disasters: The number of natural disasters in Hennepin County (17) is near the US average (15).Major Disasters (Presidential) Declared: 12Emergencies Declared: 4Floods: 11, Storms: 8, Tornadoes: 4, Winds: 3, Drought: 1, Hurricane: 1, Landslide: 1, Mudslide: 1, Other: 2 (Note: some incidents may be assigned to more than one category). Hospitals and medical centers near Shorewood: EXCELSIOR NURSING HOME (Nursing Home, about 2 miles away; EXCELSIOR, MN)
GOLDEN LIVINGCENTER - EXCELSIOR (Nursing Home, about 2 miles away; EXCELSIOR, MN)
LAKE MINNETONKA CARE CENTER (Nursing Home, about 3 miles away; DEEPHAVEN, MN)
MINNETONKA HEALTH CARE CENTER (Nursing Home, about 3 miles away; EXCELSIOR, MN)
MINNETONKA DIALYSIS OF DAVITA (Dialysis Facility, about 4 miles away; MINNETONKA, MN)
MOUNT OLIVET ROLLING ACRES (Hospital, about 4 miles away; VICTORIA, MN)
MSOCS EDEN PRAIRIE DELL (Hospital, about 4 miles away; EDEN PRAIRIE, MN)
Amtrak station near Shorewood: 20 miles: ST. PAUL/MINNEAPOLIS (ST. PAUL, 730 TRANSFER RD.) Services: ticket office, fully wheelchair accessible, enclosed waiting area, public restrooms, public payphones, vending machines, free short-term parking, free long-term parking, call for car rental service, taxi stand.
Colleges/universities with over 2000 students nearest to Shorewood:
Normandale Community College (about 14 miles; Bloomington, MN ; Full-time enrollment: 7,048)
Minneapolis Community and Technical College (about 16 miles; Minneapolis, MN ; FT enrollment: 6,726)
Capella University (about 16 miles; Minneapolis, MN ; FT enrollment: 21,718)
Hennepin Technical College (about 16 miles; Brooklyn Park, MN ; FT enrollment: 4,515)
Walden University (about 17 miles; Minneapolis, MN ; FT enrollment: 62,473)
Augsburg College (about 17 miles; Minneapolis, MN ; FT enrollment: 2,954)
North Hennepin Community College (about 18 miles; Brooklyn Park, MN ; FT enrollment: 4,943)
Notable locations in Shorewood: (A) , Excelsior Fire District Station 1 (B) . Display/hide their locations on the map
Shopping Centers: (1) , Smithtown Crossing Shopping Center (2) . Display/hide their locations on the map
Cemeteries: (1) , Resurrection Cemetery (2) . Display/hide their locations on the map
Lakes: (A) , Silver Lake (B) , Lake Minnetonka (C) , Mary Lake (D) , Lower Lake (E) , Lake Linden (F) , Lake Como (G) , Christmas Lake (H) . Display/hide their locations on the map
Park in Shorewood: (1) . Display/hide its location on the map
Birthplace of: John Curry (ice hockey) - Ice hockey goaltender.
Hennepin County has a predicted average indoor radon screening level greater than 4 pCi/L (pico curies per liter) - Highest Potential Average household size: This city:
2.8 peopleMinnesota:
2.5 people
Percentage of family households: This city:
80.2%Whole state:
64.6%
Percentage of households with unmarried partners: This city:
3.1%Whole state:
6.9%
Likely homosexual households (counted as self-reported same-sex unmarried-partner households)
Lesbian couples: 0.2% of all households Gay men: 0.3% of all households
4 people in group homes intended for adults in 2010
Banks with branches in Shorewood (2011 data):
Beacon Bank: at 19765 Highway 7, branch established on 1906/01/01. Info updated 2006/11/03: Bank assets: $307.6 mil, Deposits: $261.6 mil, local headquarters , positive income , Commercial Lending Specialization, 6 total offices , Holding Company: Excelsior Financial Services, Inc.
For population 15 years and over in Shorewood:
Never married: 20.1%Now married: 67.0%Separated: 0.7%Widowed: 4.3%Divorced: 7.9% For population 25 years and over in Shorewood:
High school or higher: 99.0%Bachelor's degree or higher: 72.0%Graduate or professional degree: 28.1%Unemployed: 2.4%Mean travel time to work (commute): 16.1 minutes
Education Gini index (Inequality in education) Here:
7.3Minnesota average:
10.9
Religion statistics for Shorewood, MN (based on Hennepin County data)
Religion Adherents Congregations Catholic 215,205 74 Mainline Protestant 193,498 234 Evangelical Protestant 162,094 393 Other 41,287 110 Black Protestant 10,812 21 Orthodox 3,337 6 None 526,192 -
Source: Clifford Grammich, Kirk Hadaway, Richard Houseal, Dale E.Jones, Alexei Krindatch, Richie Stanley and Richard H.Taylor. 2012. 2010 U.S.Religion Census: Religious Congregations & Membership Study. Association of Statisticians of American Religious Bodies. Jones, Dale E., et al. 2002. Congregations and Membership in the United States 2000. Nashville, TN: Glenmary Research Center. Graphs represent county-level data
Food Environment Statistics: Number of grocery stores : 203This county :
1.79 / 10,000 pop.Minnesota :
1.83 / 10,000 pop.
Number of supercenters and club stores : 14Hennepin County :
0.12 / 10,000 pop.State :
0.13 / 10,000 pop.
Number of convenience stores (no gas) : 78Hennepin County :
0.69 / 10,000 pop.State :
0.49 / 10,000 pop.
Number of convenience stores (with gas) : 283Hennepin County :
2.50 / 10,000 pop.Minnesota :
3.90 / 10,000 pop.
Number of full-service restaurants : 807This county :
7.13 / 10,000 pop.Minnesota :
6.98 / 10,000 pop.
Adult diabetes rate : This county :
5.8%State :
6.5%
Adult obesity rate : Hennepin County :
22.8%Minnesota :
25.9%
Low-income preschool obesity rate : Hennepin County :
15.2%State :
13.0%
Health and Nutrition: Healthy diet rate : Shorewood:
56.0%Minnesota:
50.6%
Average overall health of teeth and gums : Shorewood:
56.2%Minnesota:
48.4%
Average BMI : This city:
28.1Minnesota:
28.5
People feeling badly about themselves : Shorewood:
19.5%Minnesota:
21.0%
People not drinking alcohol at all : Shorewood:
7.5%Minnesota:
9.8%
Average hours sleeping at night : Shorewood:
7.0Minnesota:
6.8
Overweight people : This city:
34.2%Minnesota:
33.5%
General health condition : Shorewood:
63.2%Minnesota:
57.7%
Average condition of hearing : This city:
81.4%Minnesota:
79.3%
More about Health and Nutrition of Shorewood, MN Residents
Local government employment and payroll (March 2022)
Function
Full-time employees
Monthly full-time payroll
Average yearly full-time wage
Part-time employees
Monthly part-time payroll
Other Government Administration
6 $47,178 $94,356 6 $2,276 Streets and Highways
6 $48,756 $97,512 0 $0 Parks and Recreation
3 $18,972 $75,888 0 $0 Financial Administration
2 $17,772 $106,632 0 $0 Sewerage
1 $7,192 $86,304 0 $0 Other and Unallocable
1 $7,881 $94,572 1 $779 Water Supply
1 $7,177 $86,124 0 $0
Totals for Government
20 $154,927 $92,956 7 $3,055
Shorewood government finances - Expenditure in 2018 (per resident):
Construction - Regular Highways: $775,000 ($101.65)
Parks and Recreation: $771,000 ($101.13)Water Utilities: $651,000 ($85.39)Current Operations - Police Protection: $1,350,000 ($177.07)
Sewerage: $995,000 ($130.51)Regular Highways: $786,000 ($103.10)Water Utilities: $751,000 ($98.50)General - Other: $734,000 ($96.27)Financial Administration: $651,000 ($85.39)Parks and Recreation: $409,000 ($53.65)Local Fire Protection: $373,000 ($48.92)General Public Buildings: $173,000 ($22.69)Protective Inspection and Regulation - Other: $165,000 ($21.64)Solid Waste Management: $138,000 ($18.10)Judicial and Legal Services: $113,000 ($14.82)Central Staff Services: $108,000 ($14.17)General - Interest on Debt: $182,000 ($23.87)
Other Capital Outlay - Parks and Recreation: $771,000 ($101.13)
General - Other: $659,000 ($86.44)Regular Highways: $449,000 ($58.89)Local Fire Protection: $257,000 ($33.71)Police Protection: $214,000 ($28.07)Sewerage: $73,000 ($9.58)Water Utilities: $49,000 ($6.43)Central Staff Services: $8,000 ($1.05)Total Salaries and Wages: $1,421,000 ($186.39)
Water Utilities - Interest on Debt: $16,000 ($2.10)
Shorewood government finances - Revenue in 2018 (per resident):
Charges - Other: $1,133,000 ($148.61)
Sewerage: $860,000 ($112.80)Regular Highways: $575,000 ($75.42)Parks and Recreation: $394,000 ($51.68)Solid Waste Management: $203,000 ($26.63)Federal Intergovernmental - Other: $1,000 ($0.13)
Highways: $1,000 ($0.13)Local Intergovernmental - Other: $276,000 ($36.20)
General Local Government Support: $19,000 ($2.49)Water Utilities: $8,000 ($1.05)Miscellaneous - General Revenue - Other: $248,000 ($32.53)
Fines and Forfeits: $76,000 ($9.97)Interest Earnings: $75,000 ($9.84)Special Assessments: $7,000 ($0.92)Donations From Private Sources: $5,000 ($0.66)Revenue - Water Utilities: $106,000 ($13.90)
State Intergovernmental - Highways: $204,000 ($26.76)
Water Utilities: $8,000 ($1.05)Public Welfare: $6,000 ($0.79)Other: $5,000 ($0.66)Tax - Property: $5,221,000 ($684.81)
Other License: $316,000 ($41.45)Alcoholic Beverage License: $4,000 ($0.52)Occupation and Business License - Other: $4,000 ($0.52)
Shorewood government finances - Debt in 2018 (per resident):
Long Term Debt - Beginning Outstanding - Unspecified Public Purpose: $8,465,000 ($1110.31)
Outstanding Unspecified Public Purpose: $7,360,000 ($965.37)Retired Unspecified Public Purpose: $2,055,000 ($269.54)Issue, Unspecified Public Purpose: $950,000 ($124.61)
Shorewood government finances - Cash and Securities in 2018 (per resident):
Other Funds - Cash and Securities: $6,998,000 ($917.89)
6.75% of this county's 2021 resident taxpayers lived in other counties in 2020 ($70,758 average adjusted gross income )
Here:
6.75%Minnesota average:
7.43%
0.00% of residents moved from foreign countries ($39 average AGI )Hennepin County:
0.00%Minnesota average:
0.00%
Top counties from which taxpayers relocated into this county between 2020 and 2021:
8.44% of this county's 2020 resident taxpayers moved to other counties in 2021 ($85,733 average adjusted gross income )
Here:
8.44%Minnesota average:
7.79%
0.01% of residents moved to foreign countries ($68 average AGI )Hennepin County:
0.01%Minnesota average:
0.00%
Top counties to which taxpayers relocated from this county between 2020 and 2021: Businesses in Shorewood, MN
Caribou Coffee: 1H&R Block: 1 Strongest AM radio stations in Shorewood:
KSMM (1530 AM; 9 kW; SHAKOPEE, MN; Owner: STARBOARD BROADCASTING, INC.)
WCCO (830 AM; 50 kW; MINNEAPOLIS, MN; Owner: INFINITY MEDIA CORPORATION)
KFAN (1130 AM; 50 kW; MINNEAPOLIS, MN; Owner: AMFM RADIO LICENSES, L.L.C.)
KSTP (1500 AM; 50 kW; ST. PAUL, MN; Owner: KSTP-AM, LLC (DELAWARE))
WCTS (1030 AM; 50 kW; MAPLEWOOD, MN; Owner: CNTL. BAPT. THEO/AL SEMI MINNEAPOLIS)
WMNN (1330 AM; 10 kW; MINNEAPOLIS, MN; Owner: MINNESOTA PUBLIC RADIO.)
KWOM (1600 AM; 5 kW; WATERTOWN, MN; Owner: WATERTOWN RADIO, INC.)
KTIS (900 AM; 25 kW; MINNEAPOLIS, MN; Owner: NORTHWESTERN COLLEGE)
WWTC (1280 AM; 5 kW; MINNEAPOLIS, MN; Owner: SCA LICENSE CORPORATION)
KDIZ (1440 AM; 5 kW; GOLDEN VALLEY, MN; Owner: KQRS, INC.)
KYCR (1570 AM; 4 kW; GOLDEN VALLEY, MN; Owner: COMMON GROUND BROADCASTING COMPANY,)
KCCO (950 AM; 1 kW; ST. LOUIS PARK, MN; Owner: THE AUDIO HOUSE, INC.)
KUOM (770 AM; daytime; 5 kW; MINNEAPOLIS, MN)
Strongest FM radio stations in Shorewood:
KTCZ-FM (97.1 FM; MINNEAPOLIS, MN; Owner: AMFM RADIO LICENSES, L.L.C.)
KNOW-FM (91.1 FM; MINNEAPOLIS-ST. PAUL, MN; Owner: MINNESOTA PUBLIC RADIO)
WLTE (102.9 FM; MINNEAPOLIS, MN; Owner: INFINITY MEDIA CORPORATION)
WGVZ (105.7 FM; EDEN PRAIRIE, MN; Owner: KQRS, INC.)
KSTP-FM (94.5 FM; ST. PAUL, MN; Owner: KSTP-FM, LLC, A DELAWARE LLC)
KQQL (107.9 FM; ANOKA, MN; Owner: AMFM RADIO LICENSES, L.L.C.)
K214DF (90.7 FM; GOLDEN VALLEY, MN; Owner: EDUCATIONAL MEDIA FOUNDATION)
KEEY-FM (102.1 FM; ST. PAUL, MN; Owner: AMFM RADIO LICENSES, L.L.C.)
KTIS-FM (98.5 FM; MINNEAPOLIS, MN; Owner: NORTHWESTERN COLLEGE)
KDWB-FM (101.3 FM; RICHFIELD, MN; Owner: AMFM RADIO LICENSES, L.L.C.)
KQRS-FM (92.5 FM; GOLDEN VALLEY, MN; Owner: KQRS, Inc.)
KSJN (99.5 FM; MINNEAPOLIS, MN; Owner: MINNESOTA PUBLIC RADIO)
KXXR (93.7 FM; MINNEAPOLIS, MN; Owner: KQRS, INC.)
KTTB (96.3 FM; GLENCOE, MN; Owner: BLUE CHIP BROADCASTING LICENSES II, LTD.)
KFAI (90.3 FM; MINNEAPOLIS, MN; Owner: FRESH AIR, INC.)
KJZI (100.3 FM; MINNEAPOLIS, MN; Owner: AMFM RADIO LICENSES, L.L.C.)
KBEM-FM (88.5 FM; MINNEAPOLIS, MN; Owner: BD. OF EDUCATION, S.S.D. NO. 1)
WCAL (89.3 FM; NORTHFIELD, MN; Owner: ST. OLAF COLLEGE)
WGVX (105.1 FM; LAKEVILLE, MN; Owner: KQRS, INC.)
WXPT (104.1 FM; ST. LOUIS PARK, MN; Owner: THE AUDIO HOUSE, INC.)
TV broadcast stations around Shorewood:
K07UI (Channel 7; MINNEAPOLIS, ETC., MN; Owner: WORD OF GOD FELLOWSHIP, INC.)
KARE (Channel 11; MINNEAPOLIS, MN; Owner: MULTIMEDIA HOLDINGS CORPORATION)
KSTP-TV (Channel 5; ST. PAUL, MN; Owner: HUBBARD BROADCASTING, INC.)
KMSP-TV (Channel 9; MINNEAPOLIS, MN; Owner: FOX TELEVISION STATIONS, INC.)
KTCA-TV (Channel 2; ST. PAUL, MN; Owner: TWIN CITIES PUBLIC TELEVISION, INC.)
K58BS (Channel 58; MINNEAPOLIS, MN; Owner: TRINITY BROADCASTING NETWORK)
K67HG (Channel 67; MINNEAPOLIS, MN; Owner: VENTANA TELEVISION, INC.)
K14KH (Channel 14; MINNEAPOLIS, MN; Owner: THREE ANGELS BROADCASTING NETWORK)
K19ER (Channel 19; ST. PAUL, MN; Owner: CATHOLIC VIEWS BROADCASTS, INC.)
W62BD (Channel 62; MINNEAPOLIS, MN; Owner: WORD OF GOD FELLOWSHIP, INC.)
WCCO-TV (Channel 4; MINNEAPOLIS, MN; Owner: CBS BROADCASTING INC.)
KSTC-TV (Channel 45; MINNEAPOLIS, MN; Owner: HUBBARD BROADCASTING, INC.)
KTCI-TV (Channel 17; ST. PAUL, MN; Owner: TWIN CITIES PUBLIC TELEVISION, INC.)
KMWB (Channel 23; MINNEAPOLIS, MN; Owner: KLGT LICENSEE, LLC)
WFTC (Channel 29; MINNEAPOLIS, MN; Owner: FOX TELEVISION STATIONS, INC.)
WBWX-CA (Channel 13; MINNEAPOLIS, MN; Owner: THE BOX WORLDWIDE LLC)
KPXM (Channel 41; ST. CLOUD, MN; Owner: PAXSON MINNEAPOLIS LICENSE, INC.)
National Bridge Inventory (NBI) Statistics 1 Number of bridges7ft / 1.6m Total length $128,000,000 Total costs260 Total average daily traffic260 Total future (year 2029) average daily traffic
FCC Registered Antenna Towers: 13 (
See the full list of FCC Registered Antenna Towers in Shorewood )
FCC Registered Broadcast Land Mobile Towers: 1
6000 Chaska Rd (Lat: 44.894167 Lon: -93.573611), Call Sign: WRTP288, Assigned Frequencies: 451.287 MHz, 456.287 MHz, 451.412 MHz, 456.412 MHz, 451.562 MHz, 456.562 MHz, 451.737 MHz, 456.737 MHz, 452.087 MHz, 457.087 MHz, Grant Date: 07/11/2022, Expiration Date: 07/11/2032, Certifier: David Millett, Registrant: Advanced Wireless Communications, 20809 Kensington Blvd, Lakeville, MN 55044-8353, Phone: (952) 469-5400, Email:
FCC Registered Microwave Towers: 1
MSPSSW, Smithtown Road (Lat: 44.899694 Lon: -93.615806), Type: Tower, Structure height: 33.5 m, Call Sign: WQJR391, Assigned Frequencies: 11585.0 MHz, 11585.0 MHz, 19600.0 MHz, 11685.0 MHz, 19600.0 MHz, 19680.0 MHz, 11685.0 MHz, 19600.0 MHz, 19680.0 MHz, 11685.0 MHz... (+11 more), Grant Date: 12/02/2008, Expiration Date: 12/02/2018, Cancellation Date: 02/16/2019, Certifier: Kurt Maass, Registrant: Telecom Transport Management, Inc., 146 N. Canal Street, Suite 210, Seattle, WA 98103, Phone: (206) 816-6907, Fax: (206) 545-9585, Email:
FCC Registered Paging Towers: 1
24285 Smithtown Road (Lat: 44.900222 Lon: -93.588000), Type: Tower, Structure height: 46.3 m, Overall height: 50.9 m, Call Sign: KUC996, Assigned Frequencies: 152.840 MHz, Grant Date: 07/28/1998, Expiration Date: 07/01/2008, Cancellation Date: 12/03/2002, Certifier: Paul H Kuzia, Registrant: Wilkinson Barker Knauer, LLP, 2300 N Street, N.W., 7th Floor, Washington, DC 20037, Phone: (202) 783-4141, Fax: (202) 783-5851, Email:
FCC Registered Amateur Radio Licenses: 31 (
See the full list of FCC Registered Amateur Radio Licenses in Shorewood )
FAA Registered Aircraft: 3
Aircraft: BEECH A36 (Category: Land, Seats: 6, Weight: Up to 12,499 Pounds, Speed: 138 mph), Engine: CONT MOTOR IO 520 SERIES (285 HP) (Reciprocating)N-Number: 17669, N17669, N-17669, Serial Number: E-1002, Year manufactured: 1977, Airworthiness Date: 02/07/1977, Certificate Issue Date: 05/07/2018Registrant (LLC): Primo Family LLC, 5905 Sweetwater Cir, Shorewood, MN 55331Aircraft: CESSNA 177 (Category: Land, Seats: 4, Weight: Up to 12,499 Pounds, Speed: 108 mph), Engine: LYCOMING 0-320 SERIES (180 HP) (Reciprocating)N-Number: 29307, N29307, N-29307, Serial Number: 17700803, Year manufactured: 1968, Airworthiness Date: 01/22/1968, Certificate Issue Date: 06/18/1990Registrant (Co-Owned): Michael G Lacroix, 5920 Mckinley Pl, Shorewood, MN 55331, Other Owners: Anthony E LoweAircraft: PIPER PA-28-180 (Category: Land, Seats: 4, Weight: Up to 12,499 Pounds, Speed: 107 mph), Engine: LYCOMING O&VO-360 SER (180 HP) (Reciprocating)N-Number: 6598J, N6598J, N-6598J, Serial Number: 28-5057, Year manufactured: 1968, Airworthiness Date: 07/22/1968, Certificate Issue Date: 10/15/2020Registrant (Individual): Bruce Lyall Thatcher, 19220 Covington Ct, Shorewood, MN 55336
Home Mortgage Disclosure Act Aggregated Statistics For Year 2009(Based on 2 full and 2 partial tracts) A) FHA, FSA/RHS & VA B) Conventional C) Refinancings D) Home Improvement Loans E) Loans on Dwellings For 5+ Families F) Non-occupant Loans on Number Average Value Number Average Value Number Average Value Number Average Value Number Average Value Number Average Value
LOANS ORIGINATED 23 $274,300 92 $389,160 495 $310,296 25 $210,557 1 $257,350 27 $310,628 APPLICATIONS APPROVED, NOT ACCEPTED 2 $247,005 10 $297,614 32 $310,922 1 $274,750 0 $0 2 $87,280 APPLICATIONS DENIED 3 $204,207 8 $665,376 111 $444,293 5 $81,184 0 $0 3 $743,990 APPLICATIONS WITHDRAWN 4 $276,745 15 $445,021 75 $379,875 1 $220,170 0 $0 4 $266,055 FILES CLOSED FOR INCOMPLETENESS 0 $0 4 $606,302 23 $325,974 1 $238,550 0 $0 1 $374,400
Aggregated Statistics For Year 2008(Based on 2 full and 2 partial tracts) A) FHA, FSA/RHS & VA B) Conventional C) Refinancings D) Home Improvement Loans F) Non-occupant Loans on G) Loans On Manufactured Number Average Value Number Average Value Number Average Value Number Average Value Number Average Value Number Average Value
LOANS ORIGINATED 7 $292,140 124 $423,067 186 $360,846 12 $180,858 23 $451,250 0 $0 APPLICATIONS APPROVED, NOT ACCEPTED 1 $249,000 15 $409,829 35 $350,831 2 $130,430 2 $207,565 0 $0 APPLICATIONS DENIED 0 $0 11 $818,986 84 $451,821 12 $239,162 9 $310,743 1 $131,270 APPLICATIONS WITHDRAWN 2 $267,365 12 $589,752 40 $430,701 2 $13,815 3 $413,760 0 $0 FILES CLOSED FOR INCOMPLETENESS 0 $0 2 $803,100 11 $820,003 3 $105,510 1 $1,924,990 0 $0
Aggregated Statistics For Year 2007(Based on 2 full and 2 partial tracts) A) FHA, FSA/RHS & VA B) Conventional C) Refinancings D) Home Improvement Loans F) Non-occupant Loans on Number Average Value Number Average Value Number Average Value Number Average Value Number Average Value
LOANS ORIGINATED 1 $222,560 167 $494,174 199 $398,987 31 $228,251 27 $416,821 APPLICATIONS APPROVED, NOT ACCEPTED 0 $0 13 $417,905 42 $385,785 7 $99,677 3 $272,963 APPLICATIONS DENIED 0 $0 18 $718,649 108 $422,535 18 $184,409 13 $521,215 APPLICATIONS WITHDRAWN 1 $167,000 17 $594,590 41 $395,351 5 $228,798 6 $335,303 FILES CLOSED FOR INCOMPLETENESS 0 $0 3 $476,627 16 $311,706 2 $193,160 2 $256,500
Aggregated Statistics For Year 2006(Based on 2 full and 2 partial tracts) A) FHA, FSA/RHS & VA B) Conventional C) Refinancings D) Home Improvement Loans E) Loans on Dwellings For 5+ Families F) Non-occupant Loans on G) Loans On Manufactured Number Average Value Number Average Value Number Average Value Number Average Value Number Average Value Number Average Value Number Average Value
LOANS ORIGINATED 1 $326,870 155 $478,792 268 $375,097 36 $106,097 1 $1,010,760 34 $445,995 0 $0 APPLICATIONS APPROVED, NOT ACCEPTED 0 $0 12 $401,472 38 $364,659 8 $108,716 0 $0 5 $449,508 1 $125,000 APPLICATIONS DENIED 0 $0 29 $441,702 106 $499,719 15 $219,829 0 $0 13 $445,564 0 $0 APPLICATIONS WITHDRAWN 0 $0 28 $640,338 86 $402,412 5 $178,136 0 $0 7 $458,189 0 $0 FILES CLOSED FOR INCOMPLETENESS 0 $0 2 $750,000 20 $435,016 4 $135,152 0 $0 0 $0 0 $0
Aggregated Statistics For Year 2005(Based on 2 full and 2 partial tracts) A) FHA, FSA/RHS & VA B) Conventional C) Refinancings D) Home Improvement Loans E) Loans on Dwellings For 5+ Families F) Non-occupant Loans on Number Average Value Number Average Value Number Average Value Number Average Value Number Average Value Number Average Value
LOANS ORIGINATED 1 $267,520 226 $437,237 327 $387,381 46 $216,450 1 $2,262,310 43 $304,173 APPLICATIONS APPROVED, NOT ACCEPTED 0 $0 29 $487,838 50 $283,202 6 $85,440 0 $0 3 $499,797 APPLICATIONS DENIED 0 $0 27 $328,125 106 $414,415 14 $202,454 0 $0 17 $298,364 APPLICATIONS WITHDRAWN 0 $0 27 $397,331 112 $397,668 9 $116,740 0 $0 6 $331,755 FILES CLOSED FOR INCOMPLETENESS 0 $0 4 $262,750 45 $416,165 4 $95,930 0 $0 3 $411,120
Aggregated Statistics For Year 2004(Based on 2 full and 2 partial tracts) B) Conventional C) Refinancings D) Home Improvement Loans E) Loans on Dwellings For 5+ Families F) Non-occupant Loans on Number Average Value Number Average Value Number Average Value Number Average Value Number Average Value
LOANS ORIGINATED 214 $410,868 458 $317,535 36 $137,187 2 $1,272,380 38 $284,979 APPLICATIONS APPROVED, NOT ACCEPTED 17 $357,789 43 $286,027 10 $119,589 0 $0 2 $265,120 APPLICATIONS DENIED 20 $307,164 106 $481,244 17 $99,568 0 $0 9 $440,539 APPLICATIONS WITHDRAWN 24 $516,535 105 $296,547 6 $398,958 0 $0 7 $240,790 FILES CLOSED FOR INCOMPLETENESS 3 $312,787 23 $360,732 3 $210,467 0 $0 0 $0
Aggregated Statistics For Year 2003(Based on 2 full and 2 partial tracts) A) FHA, FSA/RHS & VA B) Conventional C) Refinancings D) Home Improvement Loans E) Loans on Dwellings For 5+ Families F) Non-occupant Loans on Number Average Value Number Average Value Number Average Value Number Average Value Number Average Value Number Average Value
LOANS ORIGINATED 2 $208,055 234 $352,049 1,320 $281,371 38 $68,345 1 $151,000 39 $312,429 APPLICATIONS APPROVED, NOT ACCEPTED 0 $0 23 $274,695 114 $286,533 6 $64,768 0 $0 9 $251,934 APPLICATIONS DENIED 0 $0 14 $373,449 155 $336,427 8 $87,972 0 $0 14 $304,301 APPLICATIONS WITHDRAWN 0 $0 30 $415,160 149 $297,762 2 $155,755 0 $0 5 $343,698 FILES CLOSED FOR INCOMPLETENESS 0 $0 8 $459,804 31 $297,163 1 $26,980 0 $0 3 $193,333
Aggregated Statistics For Year 2002(Based on 2 partial tracts) A) FHA, FSA/RHS & VA B) Conventional C) Refinancings D) Home Improvement Loans E) Loans on Dwellings For 5+ Families F) Non-occupant Loans on Number Average Value Number Average Value Number Average Value Number Average Value Number Average Value Number Average Value
LOANS ORIGINATED 0 $0 86 $355,535 330 $286,587 9 $71,876 1 $1,849,240 22 $359,776 APPLICATIONS APPROVED, NOT ACCEPTED 0 $0 8 $451,185 27 $293,536 4 $45,968 0 $0 1 $154,610 APPLICATIONS DENIED 0 $0 7 $507,150 40 $346,794 5 $78,332 0 $0 2 $164,425 APPLICATIONS WITHDRAWN 1 $77,310 8 $432,569 31 $349,235 1 $55,950 0 $0 2 $479,160 FILES CLOSED FOR INCOMPLETENESS 1 $101,720 2 $341,810 21 $324,580 0 $0 0 $0 0 $0
Aggregated Statistics For Year 2001(Based on 2 partial tracts) A) FHA, FSA/RHS & VA B) Conventional C) Refinancings D) Home Improvement Loans F) Non-occupant Loans on Number Average Value Number Average Value Number Average Value Number Average Value Number Average Value
LOANS ORIGINATED 3 $248,113 74 $272,040 263 $268,484 16 $85,029 15 $324,531 APPLICATIONS APPROVED, NOT ACCEPTED 0 $0 5 $301,414 20 $254,018 5 $37,632 0 $0 APPLICATIONS DENIED 0 $0 5 $327,470 41 $225,169 7 $103,410 2 $269,665 APPLICATIONS WITHDRAWN 1 $129,200 3 $485,340 30 $225,803 4 $46,255 0 $0 FILES CLOSED FOR INCOMPLETENESS 0 $0 2 $335,980 12 $255,862 1 $95,010 0 $0
Aggregated Statistics For Year 2000(Based on 2 partial tracts) A) FHA, FSA/RHS & VA B) Conventional C) Refinancings D) Home Improvement Loans F) Non-occupant Loans on Number Average Value Number Average Value Number Average Value Number Average Value Number Average Value
LOANS ORIGINATED 3 $143,297 82 $313,671 64 $227,512 31 $59,817 7 $450,529 APPLICATIONS APPROVED, NOT ACCEPTED 0 $0 6 $182,210 13 $193,058 5 $69,604 0 $0 APPLICATIONS DENIED 0 $0 5 $179,268 19 $149,005 10 $59,632 1 $213,100 APPLICATIONS WITHDRAWN 0 $0 7 $375,486 21 $156,627 1 $124,320 1 $163,090 FILES CLOSED FOR INCOMPLETENESS 0 $0 2 $208,020 5 $229,550 0 $0 0 $0
Aggregated Statistics For Year 1999(Based on 1 full tract) A) FHA, FSA/RHS & VA B) Conventional C) Refinancings D) Home Improvement Loans E) Loans on Dwellings For 5+ Families F) Non-occupant Loans on Number Average Value Number Average Value Number Average Value Number Average Value Number Average Value Number Average Value
LOANS ORIGINATED 2 $117,590 168 $240,769 203 $181,032 47 $35,998 0 $0 4 $143,582 APPLICATIONS APPROVED, NOT ACCEPTED 0 $0 12 $279,878 27 $141,919 5 $36,734 0 $0 1 $157,430 APPLICATIONS DENIED 0 $0 17 $223,228 47 $156,522 9 $48,158 0 $0 1 $249,750 APPLICATIONS WITHDRAWN 1 $153,540 15 $209,649 36 $137,915 7 $57,891 1 $124,390 2 $211,850 FILES CLOSED FOR INCOMPLETENESS 0 $0 5 $314,086 12 $172,252 0 $0 0 $0 0 $0
Detailed HMDA statistics for the following Tracts:
0274.00
, 0275.01 , 0275.03 , 0275.04
Private Mortgage Insurance Companies Aggregated Statistics For Year 2009(Based on 2 full and 2 partial tracts) A) Conventional B) Refinancings C) Non-occupant Loans on Number Average Value Number Average Value Number Average Value
LOANS ORIGINATED 10 $270,795 3 $340,963 1 $281,000 APPLICATIONS APPROVED, NOT ACCEPTED 1 $688,200 4 $331,025 0 $0 APPLICATIONS DENIED 3 $235,770 0 $0 0 $0 APPLICATIONS WITHDRAWN 4 $293,385 1 $443,200 0 $0 FILES CLOSED FOR INCOMPLETENESS 0 $0 0 $0 0 $0
Aggregated Statistics For Year 2008(Based on 2 full and 2 partial tracts) A) Conventional B) Refinancings C) Non-occupant Loans on Number Average Value Number Average Value Number Average Value
LOANS ORIGINATED 11 $313,345 5 $333,048 1 $398,170 APPLICATIONS APPROVED, NOT ACCEPTED 3 $256,967 0 $0 0 $0 APPLICATIONS DENIED 0 $0 1 $345,000 0 $0 APPLICATIONS WITHDRAWN 0 $0 0 $0 0 $0 FILES CLOSED FOR INCOMPLETENESS 1 $223,280 0 $0 0 $0
Aggregated Statistics For Year 2007(Based on 1 full and 2 partial tracts) A) Conventional B) Refinancings C) Non-occupant Loans on Number Average Value Number Average Value Number Average Value
LOANS ORIGINATED 8 $257,715 4 $370,458 2 $208,145 APPLICATIONS APPROVED, NOT ACCEPTED 0 $0 0 $0 0 $0 APPLICATIONS DENIED 0 $0 0 $0 0 $0 APPLICATIONS WITHDRAWN 0 $0 0 $0 0 $0 FILES CLOSED FOR INCOMPLETENESS 0 $0 0 $0 0 $0
Aggregated Statistics For Year 2006(Based on 2 full and 2 partial tracts) A) Conventional B) Refinancings Number Average Value Number Average Value
LOANS ORIGINATED 3 $348,717 7 $382,056 APPLICATIONS APPROVED, NOT ACCEPTED 2 $340,845 2 $526,500 APPLICATIONS DENIED 0 $0 0 $0 APPLICATIONS WITHDRAWN 0 $0 0 $0 FILES CLOSED FOR INCOMPLETENESS 0 $0 0 $0
Aggregated Statistics For Year 2005(Based on 2 full and 2 partial tracts) A) Conventional B) Refinancings C) Non-occupant Loans on Number Average Value Number Average Value Number Average Value
LOANS ORIGINATED 8 $296,891 3 $319,527 1 $349,680 APPLICATIONS APPROVED, NOT ACCEPTED 1 $265,000 1 $347,560 0 $0 APPLICATIONS DENIED 0 $0 0 $0 0 $0 APPLICATIONS WITHDRAWN 1 $326,420 0 $0 1 $166,000 FILES CLOSED FOR INCOMPLETENESS 0 $0 0 $0 0 $0
Aggregated Statistics For Year 2004(Based on 2 full and 2 partial tracts) A) Conventional B) Refinancings C) Non-occupant Loans on Number Average Value Number Average Value Number Average Value
LOANS ORIGINATED 11 $300,080 5 $341,682 1 $439,210 APPLICATIONS APPROVED, NOT ACCEPTED 1 $355,590 2 $289,740 0 $0 APPLICATIONS DENIED 0 $0 1 $630,000 0 $0 APPLICATIONS WITHDRAWN 0 $0 0 $0 0 $0 FILES CLOSED FOR INCOMPLETENESS 0 $0 0 $0 0 $0
Aggregated Statistics For Year 2003(Based on 2 full and 2 partial tracts) A) Conventional B) Refinancings C) Non-occupant Loans on Number Average Value Number Average Value Number Average Value
LOANS ORIGINATED 17 $246,893 16 $257,189 2 $162,245 APPLICATIONS APPROVED, NOT ACCEPTED 5 $262,992 10 $598,232 1 $143,860 APPLICATIONS DENIED 1 $220,800 0 $0 0 $0 APPLICATIONS WITHDRAWN 2 $160,310 1 $185,000 0 $0 FILES CLOSED FOR INCOMPLETENESS 0 $0 0 $0 0 $0
Aggregated Statistics For Year 2002(Based on 2 partial tracts) A) Conventional B) Refinancings C) Non-occupant Loans on Number Average Value Number Average Value Number Average Value
LOANS ORIGINATED 9 $229,746 4 $182,900 1 $189,710 APPLICATIONS APPROVED, NOT ACCEPTED 1 $441,590 1 $299,000 0 $0 APPLICATIONS DENIED 0 $0 0 $0 0 $0 APPLICATIONS WITHDRAWN 0 $0 0 $0 0 $0 FILES CLOSED FOR INCOMPLETENESS 0 $0 0 $0 0 $0
Aggregated Statistics For Year 2001(Based on 2 partial tracts) A) Conventional B) Refinancings C) Non-occupant Loans on Number Average Value Number Average Value Number Average Value
LOANS ORIGINATED 10 $197,500 6 $231,260 1 $165,850 APPLICATIONS APPROVED, NOT ACCEPTED 1 $223,780 3 $286,827 0 $0 APPLICATIONS DENIED 0 $0 0 $0 0 $0 APPLICATIONS WITHDRAWN 0 $0 1 $542,220 0 $0 FILES CLOSED FOR INCOMPLETENESS 0 $0 0 $0 0 $0
Aggregated Statistics For Year 2000(Based on 2 partial tracts) A) Conventional B) Refinancings Number Average Value Number Average Value
LOANS ORIGINATED 9 $204,820 4 $211,880 APPLICATIONS APPROVED, NOT ACCEPTED 1 $72,730 0 $0 APPLICATIONS DENIED 1 $94,090 0 $0 APPLICATIONS WITHDRAWN 0 $0 0 $0 FILES CLOSED FOR INCOMPLETENESS 0 $0 0 $0
Aggregated Statistics For Year 1999(Based on 1 full tract) A) Conventional B) Refinancings C) Non-occupant Loans on Number Average Value Number Average Value Number Average Value
LOANS ORIGINATED 29 $195,868 11 $148,685 1 $157,430 APPLICATIONS APPROVED, NOT ACCEPTED 4 $186,585 0 $0 0 $0 APPLICATIONS DENIED 2 $207,480 0 $0 1 $249,750 APPLICATIONS WITHDRAWN 0 $0 0 $0 0 $0 FILES CLOSED FOR INCOMPLETENESS 0 $0 0 $0 0 $0
Detailed PMIC statistics for the following Tracts:
0274.00
, 0275.01 , 0275.03 , 0275.04 Shorewood compared to Minnesota state average:
Median household income above state average. Median house value above state average. Unemployed percentage significantly below state average. Black race population percentage significantly below state average. Foreign-born population percentage below state average. Renting percentage significantly below state average. Length of stay since moving in significantly above state average. Number of rooms per house significantly above state average. Percentage of population with a bachelor's degree or higher significantly above state average.
#40 on the list of "Top 101 cities with largest percentage of males in occupations: sales and related occupations (population 5,000+)"
#63 on the list of "Top 101 cities with largest percentage of females in occupations: management occupations (population 5,000+)"
#4 on the list of "Top 101 counties with the most Mainline Protestant adherents"
#7 on the list of "Top 101 counties with the highest percentage of residents that exercised in the past month"
#10 on the list of "Top 101 counties with the most Mainline Protestant congregations"
#15 on the list of "Top 101 counties with the highest percentage of residents that visited a dentist within the past year"
#28 on the list of "Top 101 counties with the best general health status score of residents (1-5), 3 years of data"
Top Patent Applicants
Timothy R. Ryan (44)
Jeffrey Paul Solum (30)
Patrick A. Mach (29)
James A. Alexander (22)
Jeff A. Ridley (20)
Romney R. Katti (20)
Steven Rosenberg (19)
Dayton T. Reardan (17)
Calvin G. Nelson (17)
Philip Zumsteg (15)
Total of 442 patent applications in 2008-2024.
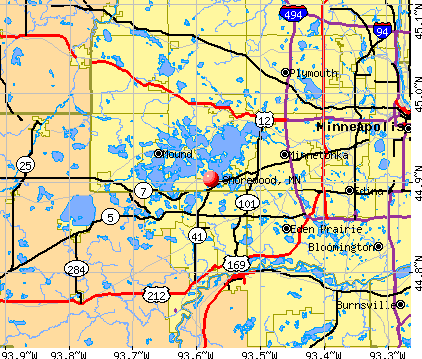


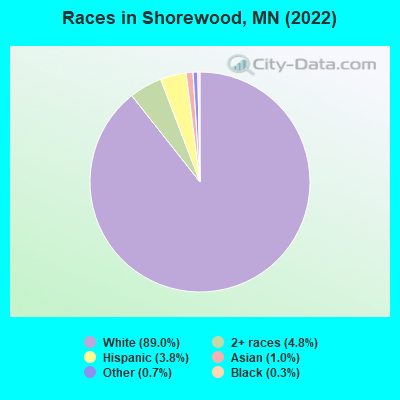
 Recent articles from our blog. Our writers, many of them Ph.D. graduates or candidates, create easy-to-read articles on a wide variety of topics.

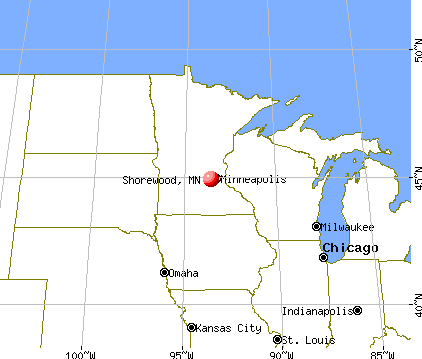
 (6.0 miles
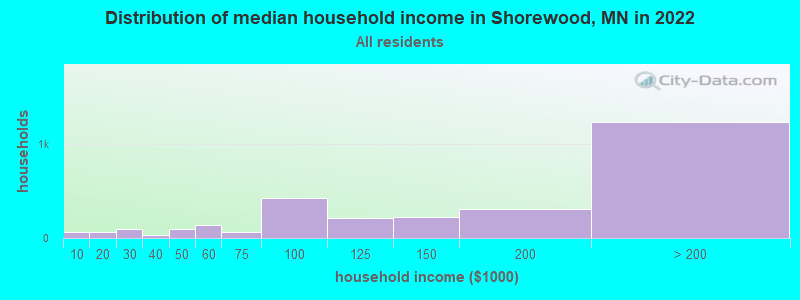
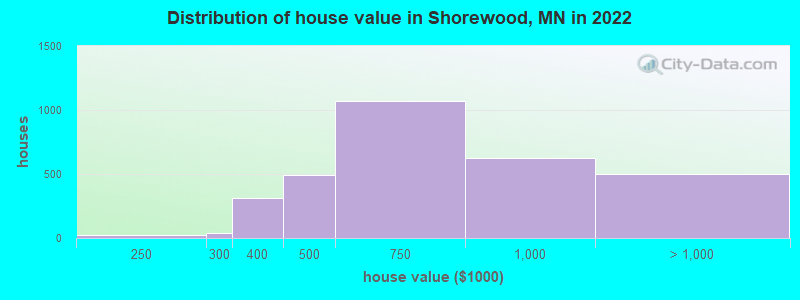

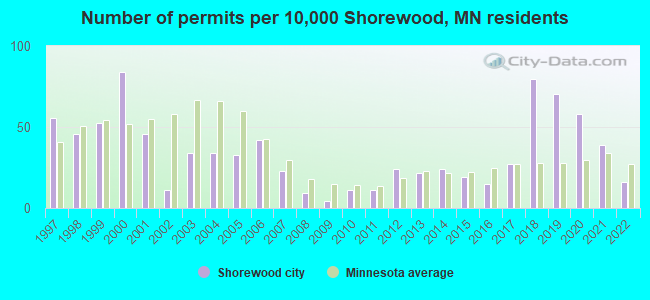
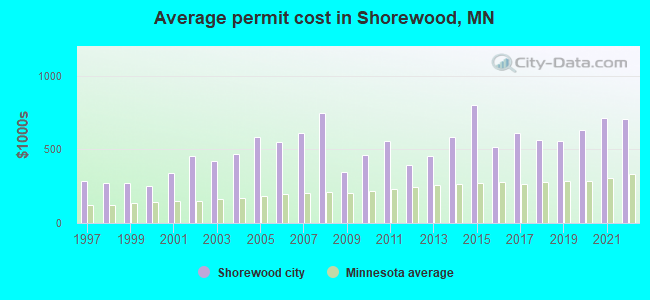
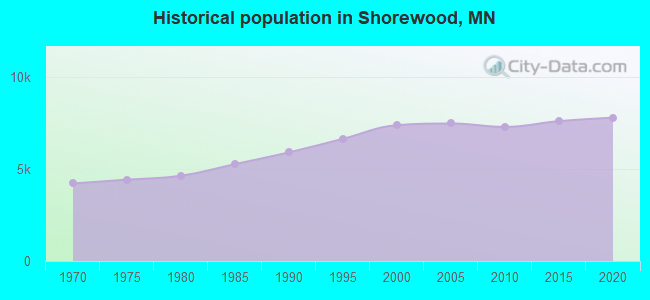
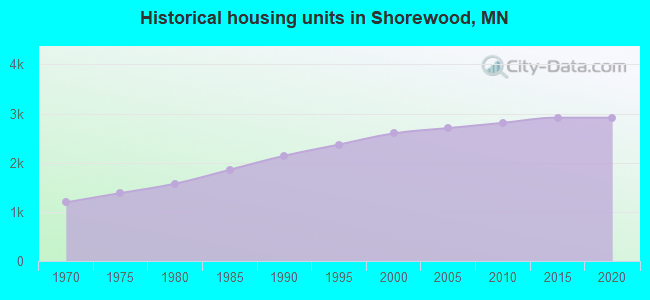
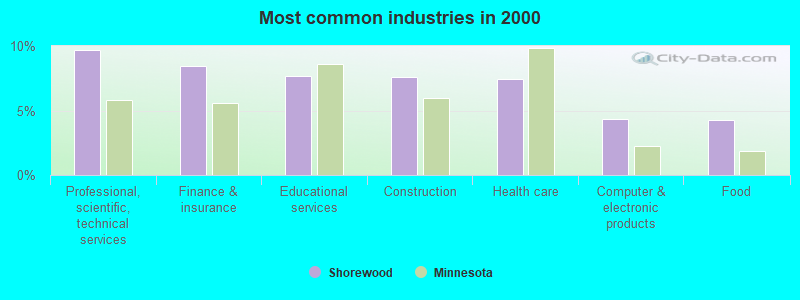
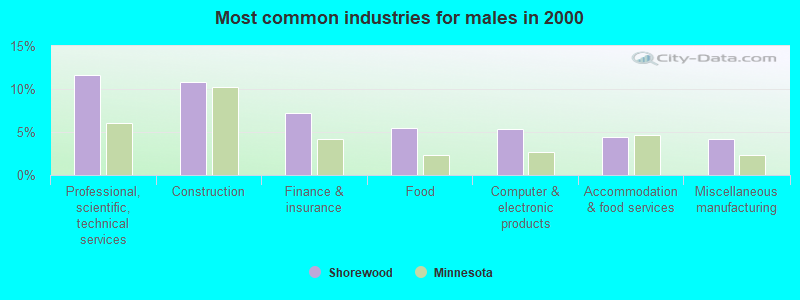
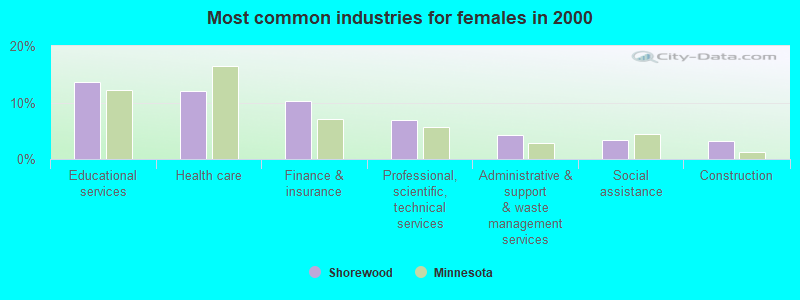
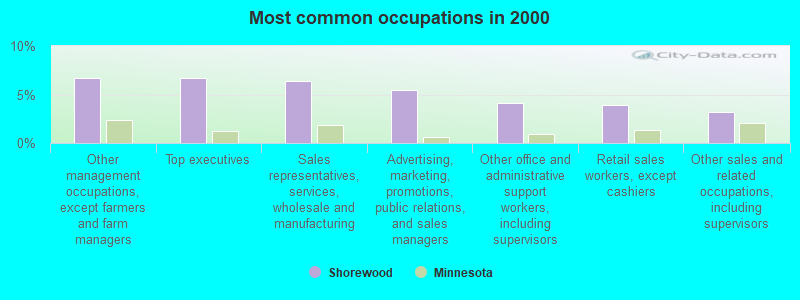
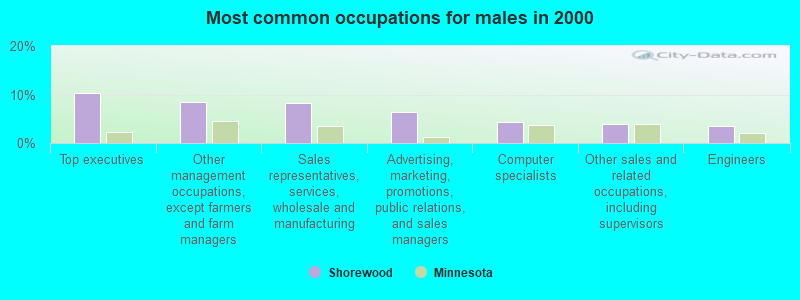
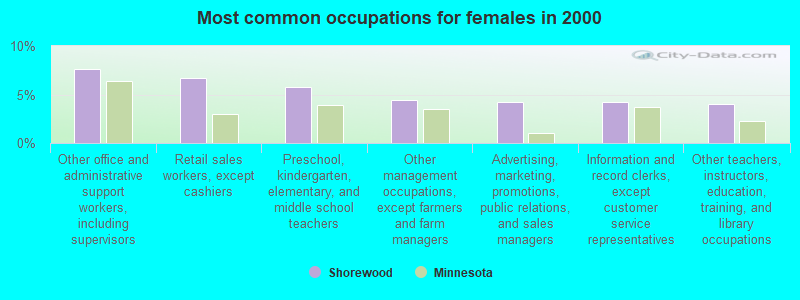
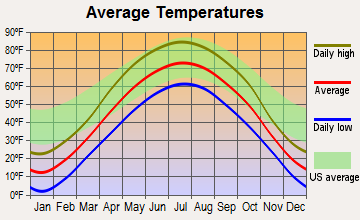
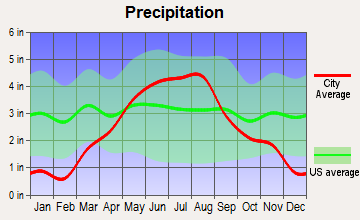
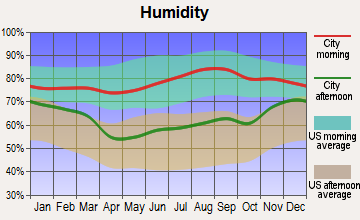
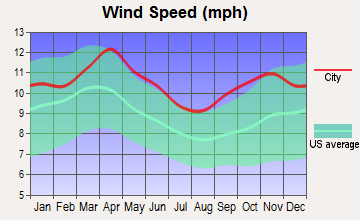
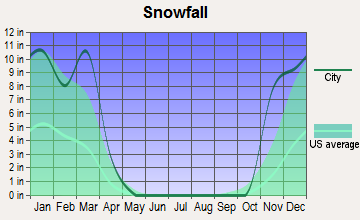
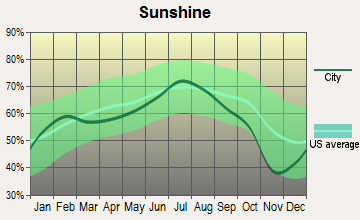
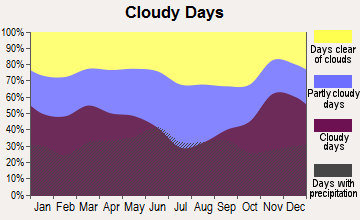

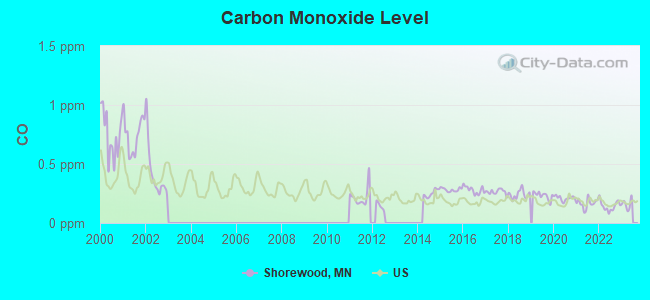
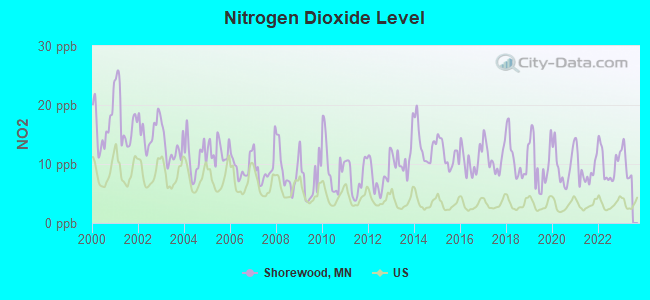
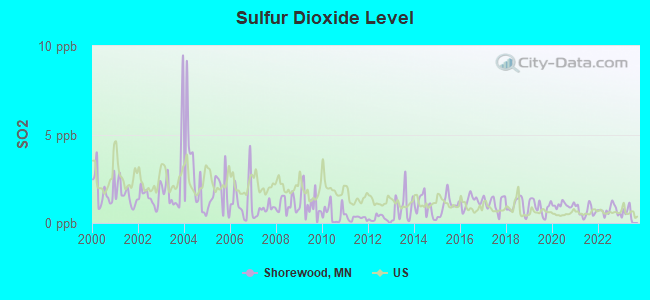
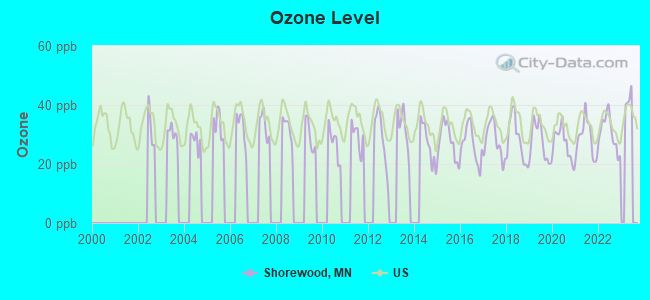
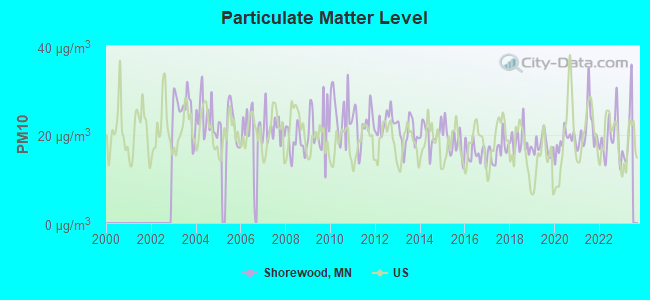
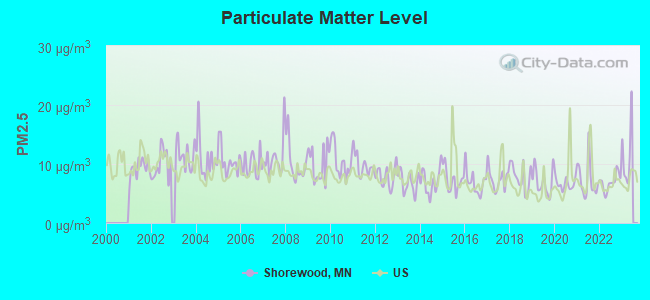
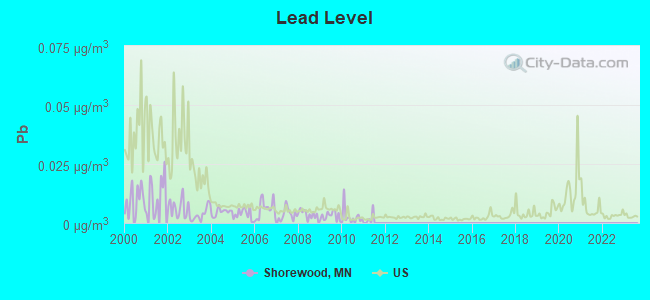
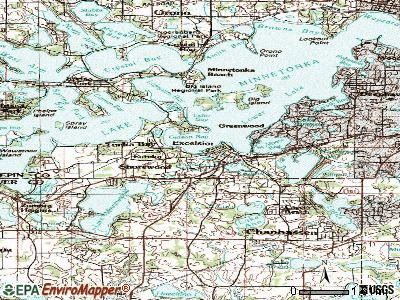
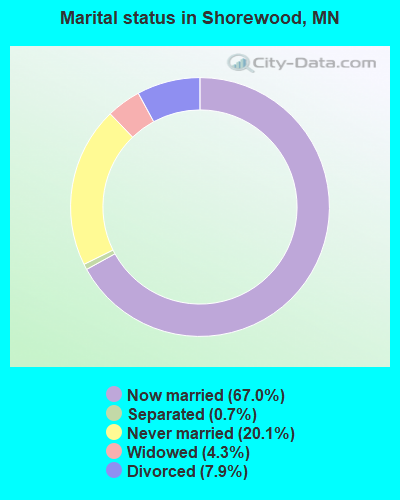
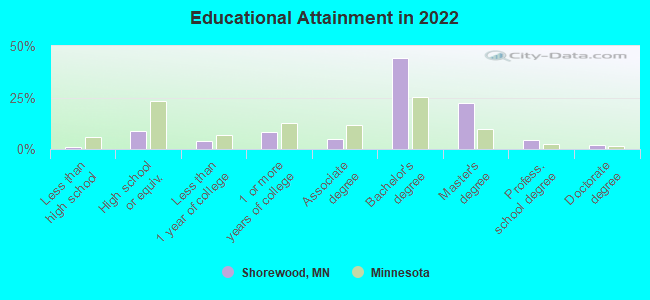
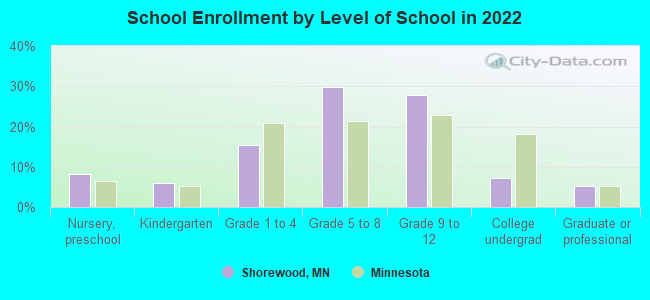
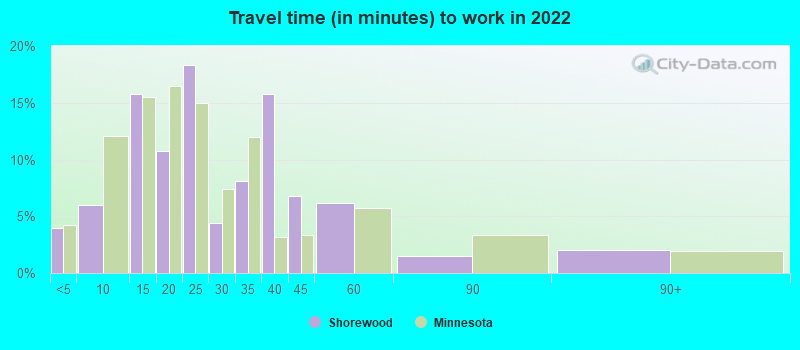
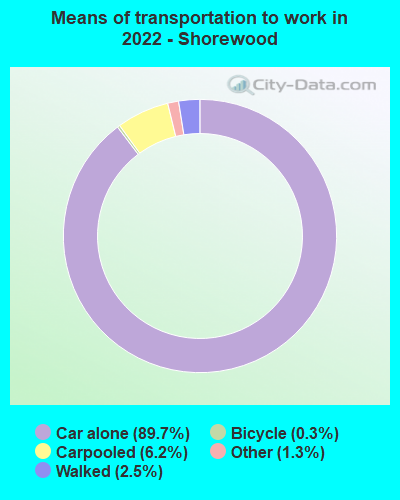
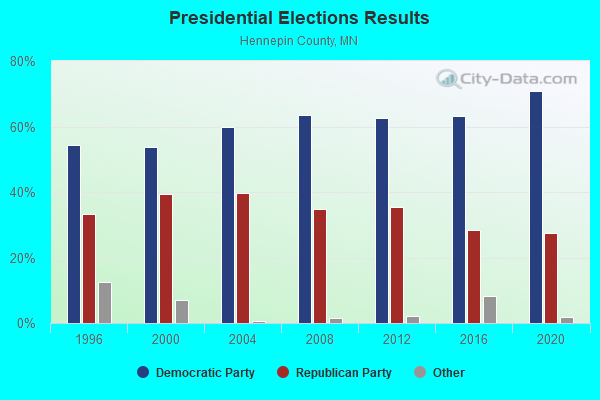
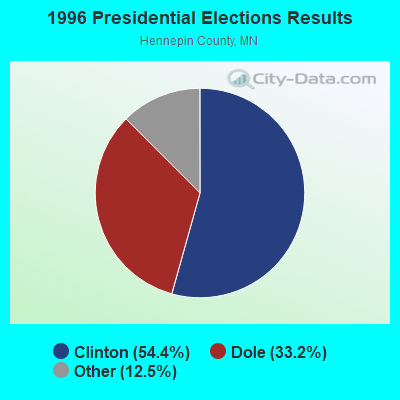
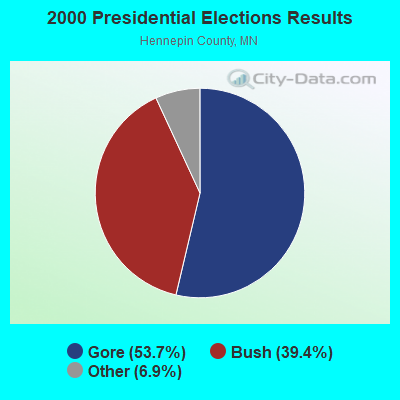
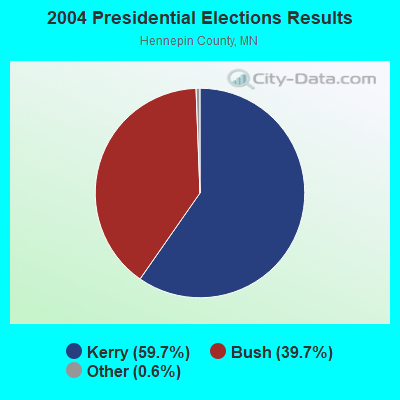
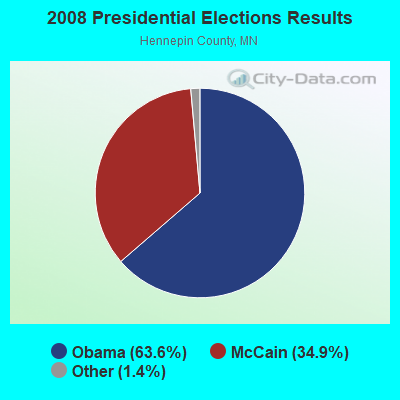
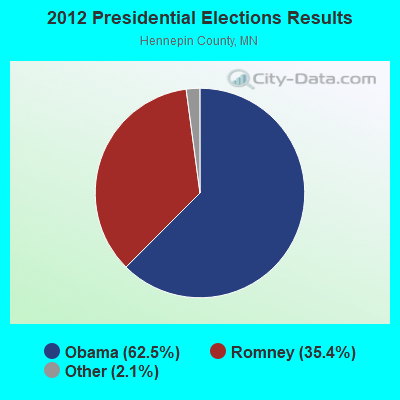
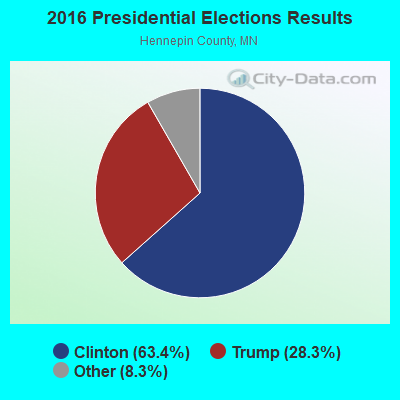
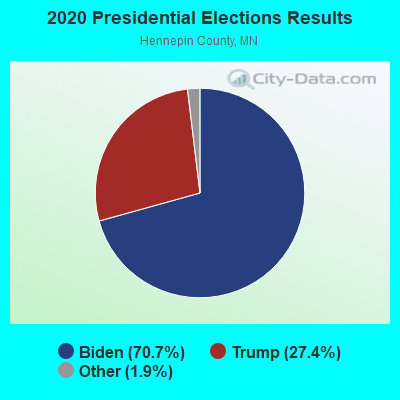
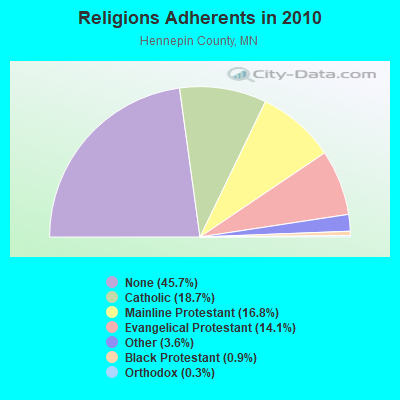
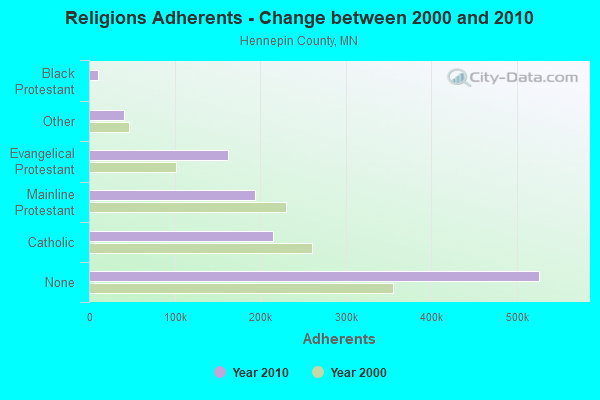
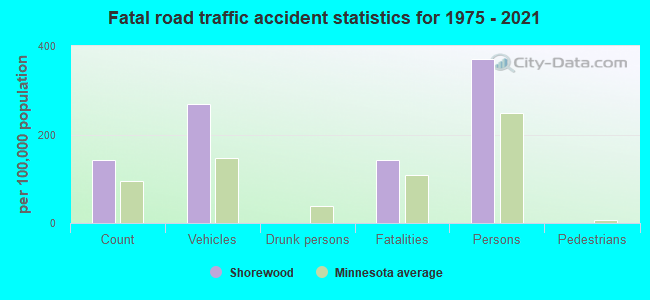
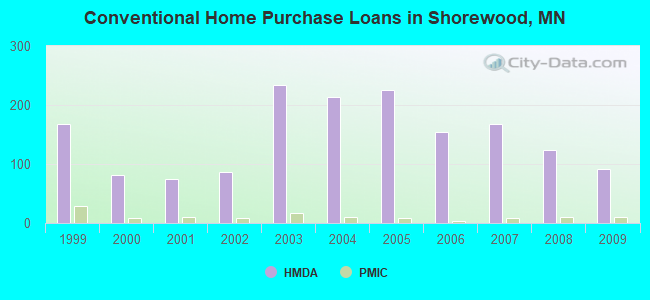
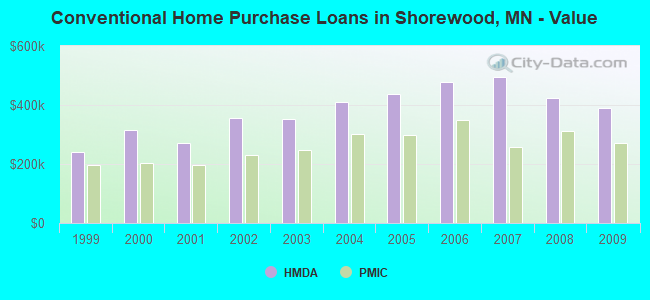
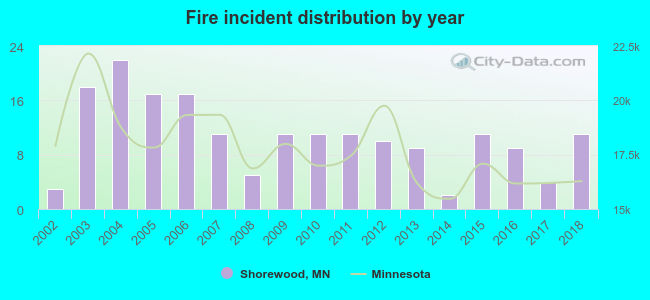 According to the data from the years 2002 - 2018 the average number of fire incidents per year is 11. The highest number of reported fire incidents - 22 took place in 2004, and the least - 2 in 2014. The data has a growing trend.
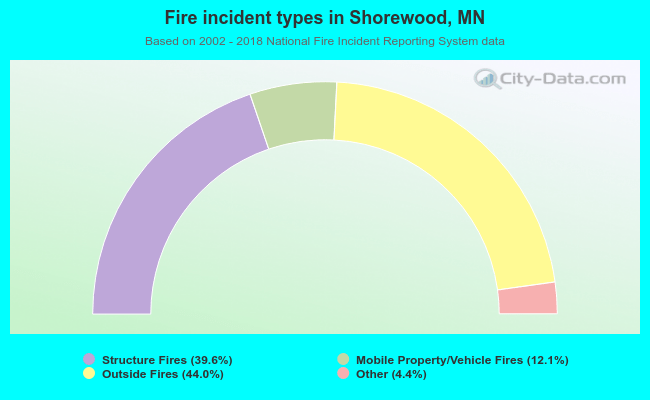 When looking into fire subcategories, the most reports belonged to: Outside Fires (44.0%), and Structure Fires (39.6%).