Stillwater, Minnesota
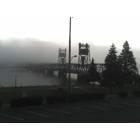
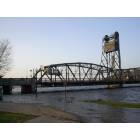
Stillwater: Lift Bridge
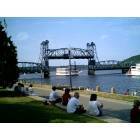
Stillwater: Boat on the river 2
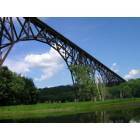
Stillwater: High bridge on the St. Croix river.
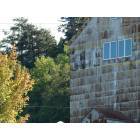
Stillwater: A Building Window
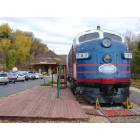
Stillwater: Minnesota Zephyr at Stillwater, MN Depot
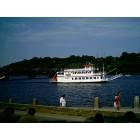
Stillwater: Boat on river
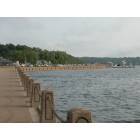
Stillwater: St. Croix River and Levee
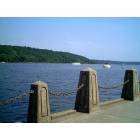
Stillwater: River walk
Stillwater: Stillwater Bridge to Wisconsin
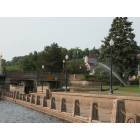
Stillwater: Lowell Park
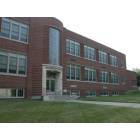
Stillwater: Washington Elementary (from "The Cure")
- see
18
more - add
your
Submit your own pictures of this city and show them to the world
- OSM Map
- General Map
- Google Map
- MSN Map
Population change since 2000: +27.3%
| Males: 9,694 | |
| Females: 9,582 |
| Median resident age: | 41.9 years |
| Minnesota median age: | 39.0 years |
Zip codes: 55082.
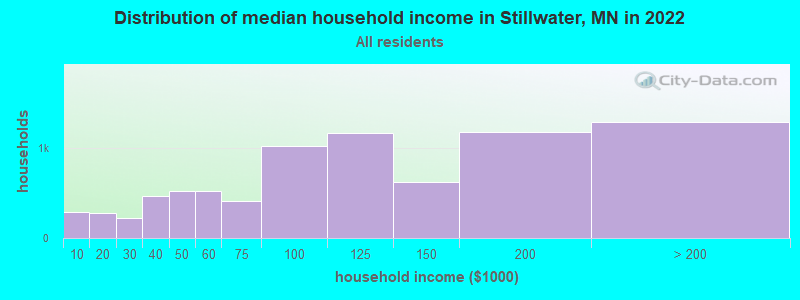
| Stillwater: | $103,778 |
| MN: | $82,338 |
Estimated per capita income in 2022: $53,311 (it was $27,163 in 2000)
Stillwater city income, earnings, and wages data
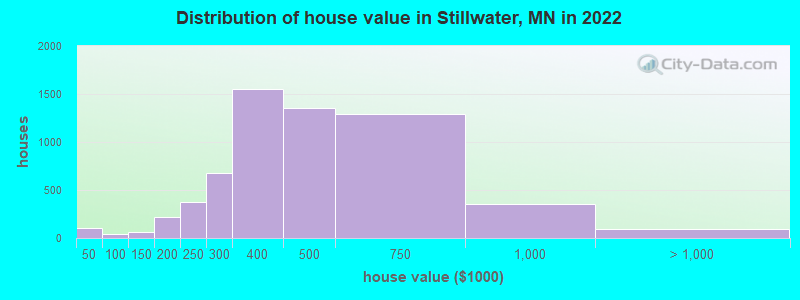
Estimated median house or condo value in 2022: $410,560 (it was $155,600 in 2000)
| Stillwater: | $410,560 |
| MN: | $314,600 |
Mean prices in 2022: all housing units: $422,317; detached houses: $463,507; townhouses or other attached units: $277,768; in 2-unit structures: $335,333; in 3-to-4-unit structures: $207,045; in 5-or-more-unit structures: $257,560; mobile homes: $38,327
Median gross rent in 2022: $1,499.
(5.3% for White Non-Hispanic residents, 1.4% for Black residents, 19.4% for Hispanic or Latino residents, 58.1% for other race residents, 3.7% for two or more races residents)
Detailed information about poverty and poor residents in Stillwater, MN


Compare current foreclosures near Stillwater, MN:
| Photo | Address | Area | Beds / Baths | Price | Details |
|---|---|---|---|---|---|

|
#1
Saint Croix Ave W
Stillwater, MN 55082
|
2,314 sq. feet
|
2 baths 3 beds |
$344,000
|
show details |

|
#2
Timber Way
Stillwater, MN 55082
|
1,635 sq. feet
|
2 baths 3 beds |
show details | |

|
#3
Peacan Ave N
Stillwater, MN 55082
|
2,716 sq. feet
|
1 baths 2 beds |
show details | |

|
#4
60th St N
Stillwater, MN 55082
|
1,313 sq. feet
|
1 baths 3 beds |
show details | |

|
#5
Atwood Ln
Stillwater, MN 55082
|
2,536 sq. feet
|
2 baths 3 beds |
show details | |

|
#6
Linden St W
Stillwater, MN 55082
|
2,108 sq. feet
|
3 baths 5 beds |
show details | |

|
#7
Pineridge Ln
Stillwater, MN 55082
|
2,489 sq. feet
|
4 baths 3 beds |
show details | |

|
#8
Saint Croix Ave W
Stillwater, MN 55082
|
2,394 sq. feet
|
2 baths 4 beds |
show details | |

|
#9
67th Ln N
Stillwater, MN 55082
|
3,539 sq. feet
|
2 baths 3 beds |
show details | |

|
#10
Sunrise Ave
Stillwater, MN 55082
|
1,380 sq. feet
|
2 baths 3 beds |
show details |
| Photo | Address | Area | Beds / Baths | Price | Details |
|---|---|---|---|---|---|

|
#11
54th St N
Stillwater, MN 55082
|
1,898 sq. feet
|
2 baths 3 beds |
show details | |

|
#12
Saint Croix Trl N Apt 228
Stillwater, MN 55082
|
- sq. feet
|
- baths - beds |
show details | |

|
#13
Dellwood Rd N
Stillwater, MN 55082
|
- sq. feet
|
- baths - beds |
show details | |

|
#14
58th St N
Stillwater, MN 55082
|
- sq. feet
|
- baths - beds |
show details | |

|
#15
Wilkins St W
Stillwater, MN 55082
|
- sq. feet
|
- baths - beds |
show details | |

|
#16
Orleans St W Apt 203
Stillwater, MN 55082
|
- sq. feet
|
- baths - beds |
show details | |

|
#17
Saint Croix Trl N Apt 113
Stillwater, MN 55082
|
- sq. feet
|
- baths - beds |
show details | |

|
#18
58th St N Apt 4d
Stillwater, MN 55082
|
- sq. feet
|
- baths - beds |
show details | |

|
#19
Granite St
Saint Paul, MN 55117
|
2,136 sq. feet
|
2 baths 4 beds |
$172,000
|
show details |

|
#20
Wacouta St Unit Unit Gl-D
Saint Paul, MN 55101
|
- sq. feet
|
1 baths 1 beds |
$179,900
|
show details |
| Photo | Address | Area | Beds / Baths | Price | Details |
|---|---|---|---|---|---|

|
#21
Main St
Hugo, MN 55038
|
1,569 sq. feet
|
2 baths 4 beds |
show details | |

|
#22
78th St S
Cottage Grove, MN 55016
|
1,790 sq. feet
|
4 baths 4 beds |
show details | |

|
#23
7th St N
Saint Paul, MN 55128
|
874 sq. feet
|
1 baths 3 beds |
show details | |

|
#24
Emerald Dr
Saint Paul, MN 55110
|
1,787 sq. feet
|
2 baths 5 beds |
show details | |

|
#25
Margaret St
Saint Paul, MN 55106
|
1,275 sq. feet
|
1 baths 3 beds |
show details | |

|
#26
Exhall Ave N
Hugo, MN 55038
|
3,580 sq. feet
|
2 baths 4 beds |
show details | |

|
#27
Prairie Rd
Saint Paul, MN 55110
|
1,518 sq. feet
|
2 baths 3 beds |
show details | |

|
#28
2nd Ave S
South Saint Paul, MN 55075
|
- sq. feet
|
2 baths 6 beds |
show details | |

|
#29
Gershwin Ct N
Saint Paul, MN 55128
|
2,458 sq. feet
|
2 baths 4 beds |
show details | |

|
#30
Winifred St W
Saint Paul, MN 55107
|
1,400 sq. feet
|
1 baths 3 beds |
show details |
| Photo | Address | Area | Beds / Baths | Price | Details |
|---|---|---|---|---|---|

|
#31
Juliet Dr
Saint Paul, MN 55125
|
1,084 sq. feet
|
2 baths 2 beds |
show details | |

|
#32
Quasar Ct S
Lakeland, MN 55043
|
2,064 sq. feet
|
3 baths 3 beds |
show details | |

|
#33
Geranium Ave E
Saint Paul, MN 55130
|
2,112 sq. feet
|
2 baths 6 beds |
show details | |

|
#34
Oakmede Ln
Saint Paul, MN 55110
|
1,100 sq. feet
|
3 baths 3 beds |
show details | |

|
#35
8th Ave S
South Saint Paul, MN 55075
|
761 sq. feet
|
1 baths 2 beds |
show details | |

|
#36
Dorland Rd S
Saint Paul, MN 55119
|
1,028 sq. feet
|
2 baths 3 beds |
show details | |

|
#37
Jewel Ave S
Cottage Grove, MN 55016
|
1,308 sq. feet
|
2 baths 3 beds |
show details | |

|
#38
3rd St E
Saint Paul, MN 55106
|
1,016 sq. feet
|
1 baths 3 beds |
show details | |

|
#39
Bayhill Rd
Saint Paul, MN 55110
|
2,576 sq. feet
|
3 baths 4 beds |
show details | |

|
#40
Nokomis Ave
Saint Paul, MN 55119
|
1,152 sq. feet
|
1 baths 3 beds |
show details |
| Photo | Address | Area | Beds / Baths | Price | Details |
|---|---|---|---|---|---|

|
#41
Belmont Ln W
Saint Paul, MN 55113
|
978 sq. feet
|
1 baths 3 beds |
show details | |

|
#42
Cedar St
Saint Paul, MN 55110
|
2,079 sq. feet
|
2 baths 4 beds |
show details | |

|
#43
Arkwright St
Saint Paul, MN 55130
|
1,230 sq. feet
|
1 baths 3 beds |
show details | |

|
#44
Mclean Ave
Saint Paul, MN 55106
|
1,400 sq. feet
|
1 baths 3 beds |
show details | |

|
#45
Jewel Ave N
Forest Lake, MN 55025
|
1,130 sq. feet
|
2 baths 4 beds |
show details | |

|
#46
Maple St
Saint Paul, MN 55106
|
1,436 sq. feet
|
2 baths 3 beds |
show details | |

|
#47
Flanders Rd
Saint Paul, MN 55109
|
1,640 sq. feet
|
2 baths 4 beds |
show details | |

|
#48
Cedar Cv
Saint Paul, MN 55110
|
1,310 sq. feet
|
1 baths 2 beds |
show details | |

|
#49
Jackson St
Saint Paul, MN 55117
|
1,200 sq. feet
|
1 baths 3 beds |
show details | |

|
Check over 1 million property listings on Foreclosure.com!
|
browse all offers | |||


- 16,29482.1%White alone
- 1,4107.1%Hispanic
- 6623.3%Two or more races
- 6123.1%Black alone
- 5332.7%Asian alone
- 1000.5%Other race alone
- 730.4%American Indian alone
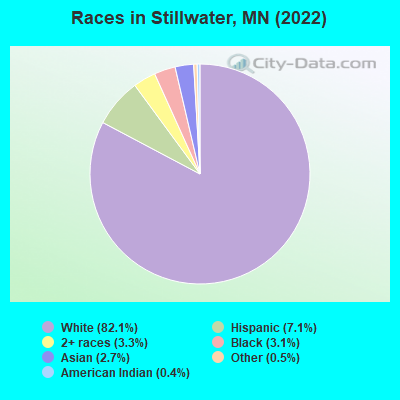
Races in Stillwater detailed stats: ancestries, foreign born residents, place of birth
According to our research of Minnesota and other state lists, there were 2 registered sex offenders living in Stillwater, Minnesota as of April 26, 2024.
The ratio of all residents to sex offenders in Stillwater is 9,739 to 1.
The ratio of registered sex offenders to all residents in this city is lower than the state average.
Type |
2009 |
2010 |
2011 |
2012 |
2013 |
2014 |
2015 |
2016 |
2017 |
2018 |
2019 |
2020 |
2021 |
2022 |
|---|---|---|---|---|---|---|---|---|---|---|---|---|---|---|
| Murders (per 100,000) | 2 (11.0) | 0 (0.0) | 0 (0.0) | 1 (5.4) | 0 (0.0) | 0 (0.0) | 0 (0.0) | 1 (5.2) | 0 (0.0) | 0 (0.0) | 0 (0.0) | 0 (0.0) | 0 (0.0) | 0 (0.0) |
| Rapes (per 100,000) | 0 (0.0) | 6 (32.9) | 2 (10.9) | 3 (16.1) | 6 (32.2) | 1 (5.3) | 6 (31.7) | 5 (26.2) | 7 (36.1) | 4 (20.5) | 10 (51.3) | 6 (30.4) | 5 (25.3) | 7 (36.1) |
| Robberies (per 100,000) | 3 (16.5) | 0 (0.0) | 3 (16.3) | 1 (5.4) | 4 (21.5) | 2 (10.7) | 0 (0.0) | 4 (21.0) | 6 (30.9) | 1 (5.1) | 3 (15.4) | 5 (25.3) | 2 (10.1) | 1 (5.2) |
| Assaults (per 100,000) | 7 (38.5) | 12 (65.8) | 8 (43.6) | 8 (43.1) | 6 (32.2) | 5 (26.6) | 11 (58.1) | 10 (52.5) | 8 (41.2) | 13 (66.8) | 4 (20.5) | 6 (30.4) | 19 (96.0) | 11 (56.7) |
| Burglaries (per 100,000) | 51 (280.7) | 92 (504.8) | 83 (451.9) | 86 (462.8) | 45 (241.5) | 27 (143.8) | 42 (221.9) | 58 (304.4) | 54 (278.4) | 28 (143.8) | 45 (230.8) | 36 (182.4) | 30 (151.5) | 14 (72.2) |
| Thefts (per 100,000) | 383 (2,108) | 496 (2,722) | 377 (2,053) | 370 (1,991) | 262 (1,406) | 228 (1,215) | 231 (1,220) | 331 (1,737) | 320 (1,650) | 117 (601.0) | 196 (1,005) | 212 (1,074) | 153 (772.8) | 138 (711.8) |
| Auto thefts (per 100,000) | 13 (71.6) | 15 (82.3) | 14 (76.2) | 22 (118.4) | 13 (69.8) | 14 (74.6) | 11 (58.1) | 18 (94.5) | 21 (108.3) | 6 (30.8) | 21 (107.7) | 23 (116.5) | 27 (136.4) | 20 (103.2) |
| Arson (per 100,000) | 2 (11.0) | 4 (21.9) | 1 (5.4) | 4 (21.5) | 2 (10.7) | 0 (0.0) | 1 (5.3) | 3 (15.7) | 5 (25.8) | 0 (0.0) | 0 (0.0) | 1 (5.1) | 1 (5.1) | 0 (0.0) |
| City-Data.com crime index | 144.4 | 190.3 | 142.2 | 155.4 | 117.4 | 77.4 | 106.0 | 146.7 | 140.6 | 67.9 | 114.7 | 103.1 | 94.9 | 83.6 |
The City-Data.com crime index weighs serious crimes and violent crimes more heavily. Higher means more crime, U.S. average is 246.1. It adjusts for the number of visitors and daily workers commuting into cities.
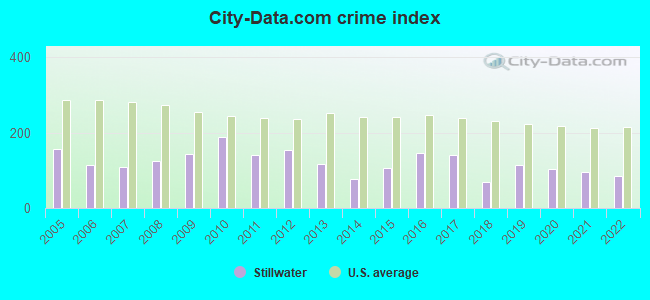
Crime rate in Stillwater detailed stats: murders, rapes, robberies, assaults, burglaries, thefts, arson
Full-time law enforcement employees in 2021, including police officers: 28 (23 officers - 19 male; 4 female).
| Officers per 1,000 residents here: | 1.16 |
| Minnesota average: | 1.76 |
 Recent articles from our blog. Our writers, many of them Ph.D. graduates or candidates, create easy-to-read articles on a wide variety of topics.


Latest news from Stillwater, MN collected exclusively by city-data.com from local newspapers, TV, and radio stations
Stillwater, MN City Guides:
Ancestries: German (23.5%), American (10.2%), Norwegian (7.8%), European (6.6%), Irish (6.0%), Swedish (5.5%).
Current Local Time: CST time zone
Incorporated on 03/04/1854
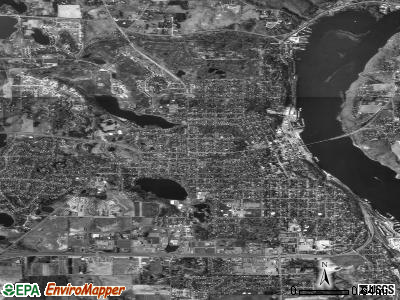
Land area: 6.47 square miles.
Population density: 2,979 people per square mile (average).
1,006 residents are foreign born (2.3% Asia, 1.8% Latin America, 0.5% Europe).
| This city: | 5.1% |
| Minnesota: | 8.5% |
Median real estate property taxes paid for housing units with mortgages in 2022: $3,655 (0.9%)
Median real estate property taxes paid for housing units with no mortgage in 2022: $3,729 (1.0%)
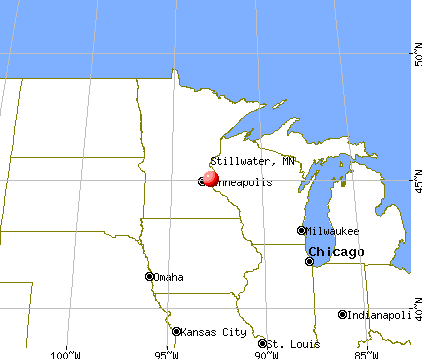
Nearest city with pop. 50,000+: St. Paul, MN  (16.0 miles , pop. 287,151).
Nearest city with pop. 1,000,000+: Chicago, IL (340.5 miles , pop. 2,896,016).
Nearest cities:
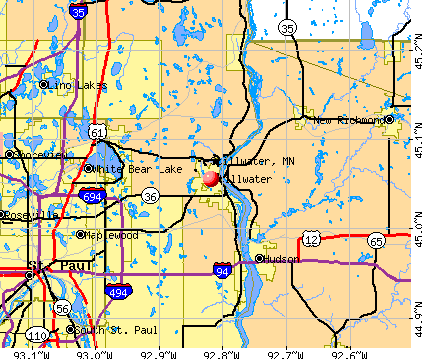
), ), ), ), ), Latitude: 45.06 N, Longitude: 92.82 W
Daytime population change due to commuting: +1,030 (+5.2%)
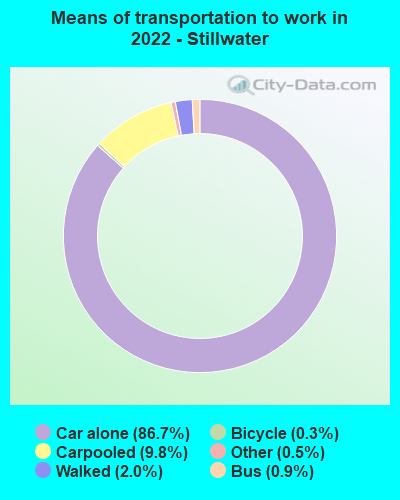
Workers who live and work in this city: 4,016 (38.7%)
Area code: 651
Stillwater, Minnesota accommodation & food services, waste management - Economy and Business Data
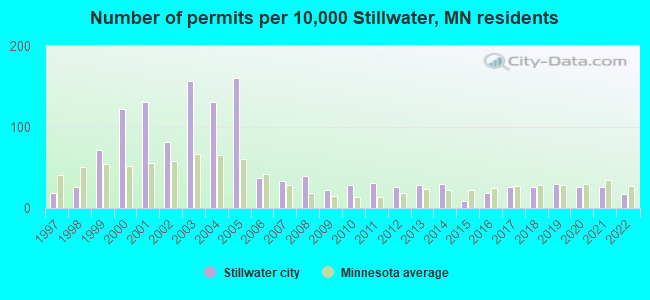
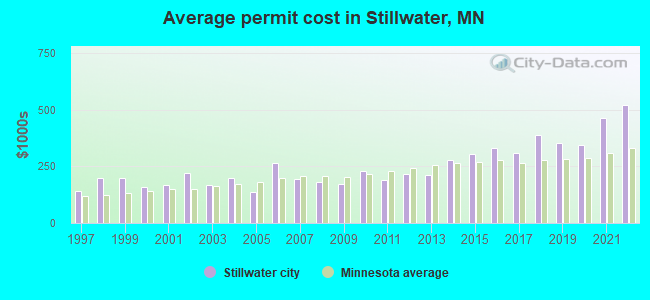
Single-family new house construction building permits:
- 2022: 25 buildings, average cost: $521,300
- 2021: 39 buildings, average cost: $464,000
- 2020: 39 buildings, average cost: $345,200
- 2019: 46 buildings, average cost: $354,600
- 2018: 40 buildings, average cost: $387,900
- 2017: 40 buildings, average cost: $308,500
- 2016: 27 buildings, average cost: $329,200
- 2015: 13 buildings, average cost: $304,600
- 2014: 45 buildings, average cost: $278,600
- 2013: 42 buildings, average cost: $213,400
- 2012: 39 buildings, average cost: $215,000
- 2011: 47 buildings, average cost: $191,600
- 2010: 44 buildings, average cost: $228,900
- 2009: 34 buildings, average cost: $174,300
- 2008: 60 buildings, average cost: $182,300
- 2007: 50 buildings, average cost: $194,800
- 2006: 56 buildings, average cost: $265,100
- 2005: 244 buildings, average cost: $139,000
- 2004: 198 buildings, average cost: $198,500
- 2003: 238 buildings, average cost: $167,300
- 2002: 124 buildings, average cost: $222,100
- 2001: 198 buildings, average cost: $167,900
- 2000: 184 buildings, average cost: $158,600
- 1999: 107 buildings, average cost: $199,800
- 1998: 39 buildings, average cost: $197,200
- 1997: 28 buildings, average cost: $141,700
| Here: | 2.1% |
| Minnesota: | 2.6% |
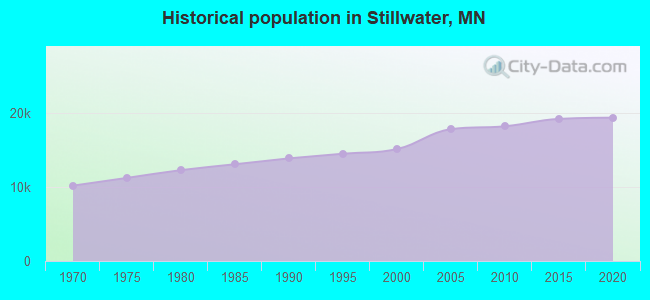
Population change in the 1990s: +1,085 (+7.7%).
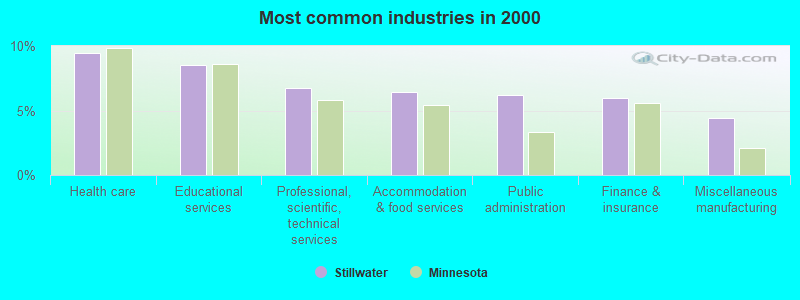
- Health care (9.5%)
- Educational services (8.5%)
- Professional, scientific, technical services (6.7%)
- Accommodation & food services (6.4%)
- Public administration (6.2%)
- Finance & insurance (6.0%)
- Miscellaneous manufacturing (4.4%)
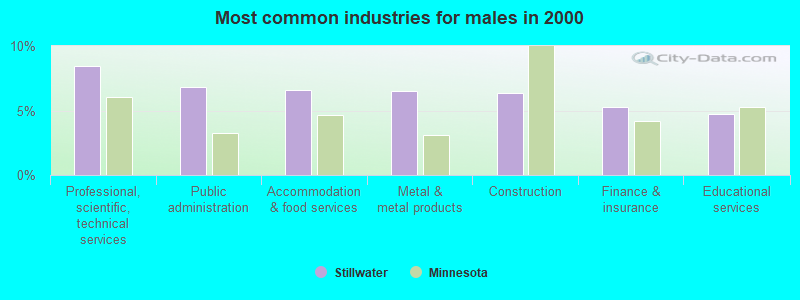
- Professional, scientific, technical services (8.4%)
- Public administration (6.9%)
- Accommodation & food services (6.6%)
- Metal & metal products (6.5%)
- Construction (6.3%)
- Finance & insurance (5.3%)
- Educational services (4.7%)
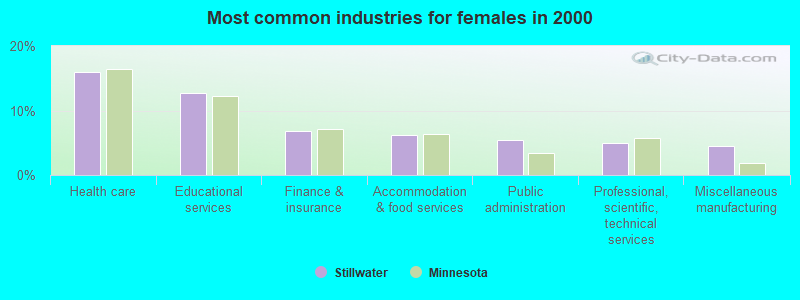
- Health care (15.9%)
- Educational services (12.6%)
- Finance & insurance (6.8%)
- Accommodation & food services (6.2%)
- Public administration (5.4%)
- Professional, scientific, technical services (4.9%)
- Miscellaneous manufacturing (4.5%)

- Other management occupations, except farmers and farm managers (6.1%)
- Other sales and related occupations, including supervisors (5.6%)
- Sales representatives, services, wholesale and manufacturing (5.0%)
- Other office and administrative support workers, including supervisors (3.9%)
- Retail sales workers, except cashiers (3.4%)
- Secretaries and administrative assistants (3.1%)
- Other production occupations, including supervisors (3.0%)

- Sales representatives, services, wholesale and manufacturing (7.4%)
- Other management occupations, except farmers and farm managers (7.2%)
- Other sales and related occupations, including supervisors (5.3%)
- Other production occupations, including supervisors (4.1%)
- Computer specialists (3.8%)
- Engineers (3.7%)
- Metal workers and plastic workers (3.5%)

- Other office and administrative support workers, including supervisors (6.4%)
- Secretaries and administrative assistants (6.3%)
- Other sales and related occupations, including supervisors (5.9%)
- Other management occupations, except farmers and farm managers (5.0%)
- Preschool, kindergarten, elementary, and middle school teachers (4.5%)
- Cashiers (4.2%)
- Retail sales workers, except cashiers (3.8%)
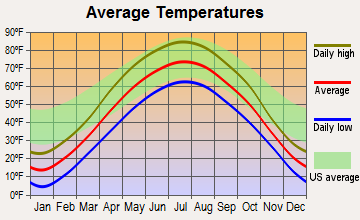
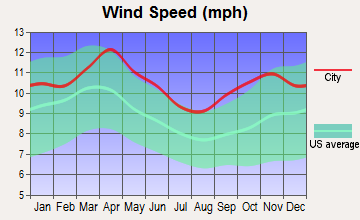
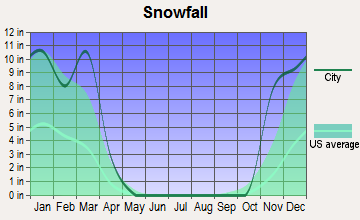
Average climate in Stillwater, Minnesota
Based on data reported by over 4,000 weather stations


|
|

(lower is better)
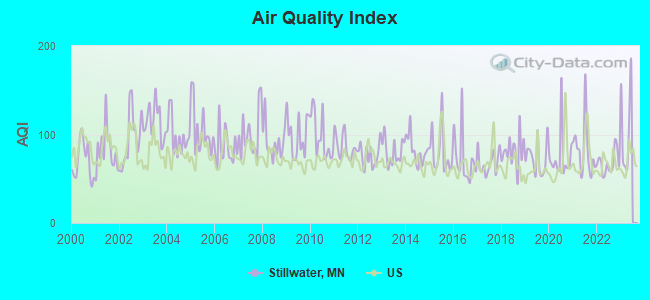
Air Quality Index (AQI) level in 2022 was 67.6. This is about average.
| City: | 67.6 |
| U.S.: | 72.6 |
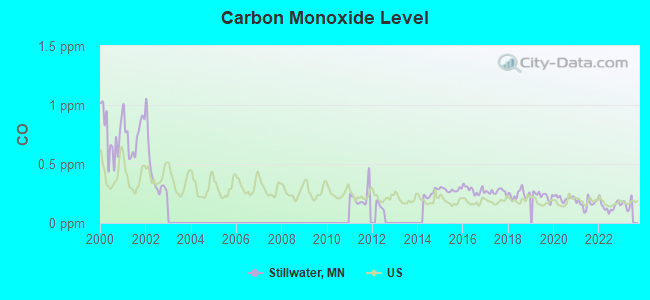
Carbon Monoxide (CO) [ppm] level in 2022 was 0.144. This is significantly better than average. Closest monitor was 15.1 miles away from the city center.
| City: | 0.144 |
| U.S.: | 0.251 |
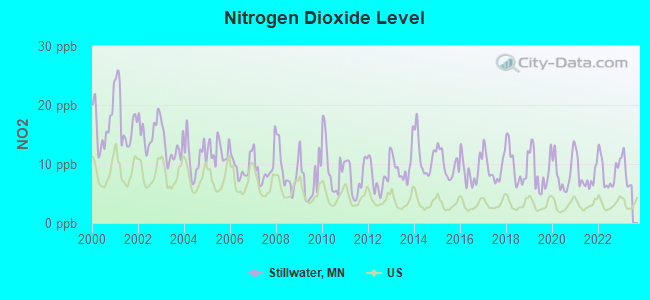
Nitrogen Dioxide (NO2) [ppb] level in 2022 was 8.65. This is significantly worse than average. Closest monitor was 13.2 miles away from the city center.
| City: | 8.65 |
| U.S.: | 5.11 |
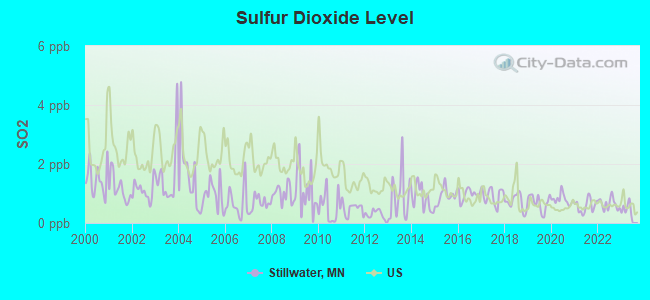
Sulfur Dioxide (SO2) [ppb] level in 2022 was 0.652. This is significantly better than average. Closest monitor was 13.2 miles away from the city center.
| City: | 0.652 |
| U.S.: | 1.515 |
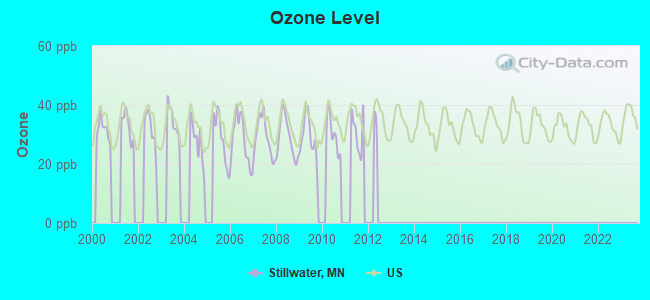
Ozone [ppb] level in 2011 was 30.8. This is about average. Closest monitor was 4.7 miles away from the city center.
| City: | 30.8 |
| U.S.: | 33.3 |
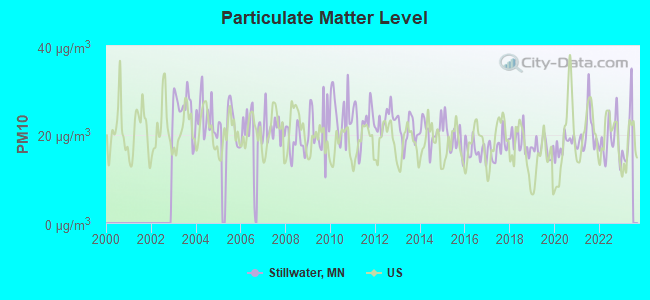
Particulate Matter (PM10) [µg/m3] level in 2022 was 18.7. This is about average. Closest monitor was 4.4 miles away from the city center.
| City: | 18.7 |
| U.S.: | 19.2 |
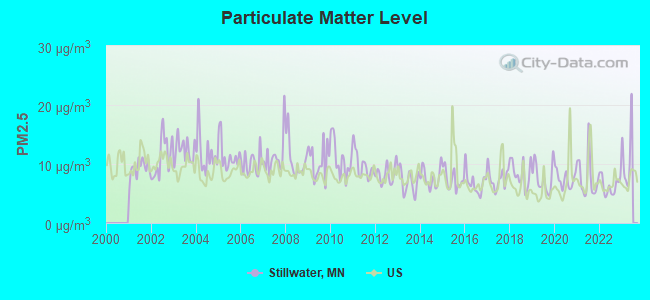
Particulate Matter (PM2.5) [µg/m3] level in 2022 was 6.33. This is better than average. Closest monitor was 3.1 miles away from the city center.
| City: | 6.33 |
| U.S.: | 8.11 |
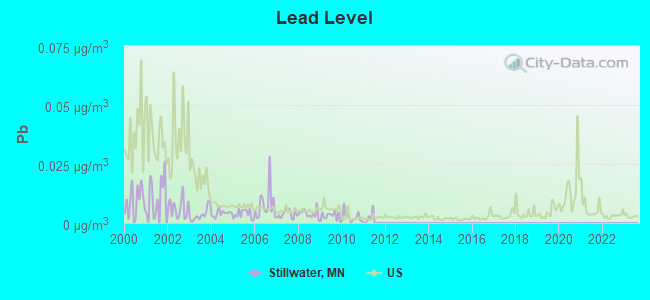
Lead (Pb) [µg/m3] level in 2010 was 0.00244. This is significantly better than average. Closest monitor was 0.7 miles away from the city center.
| City: | 0.00244 |
| U.S.: | 0.00931 |
Tornado activity:
Stillwater-area historical tornado activity is slightly above Minnesota state average. It is 24% greater than the overall U.S. average.
On 6/4/1958, a category F5 (max. wind speeds 261-318 mph) tornado 26.2 miles away from the Stillwater city center killed 21 people and injured 74 people and caused between $5,000,000 and $50,000,000 in damages.
On 5/6/1965, a category F4 (max. wind speeds 207-260 mph) tornado 15.0 miles away from the city center killed 6 people and injured 158 people and caused between $5,000,000 and $50,000,000 in damages.
Earthquake activity:
Stillwater-area historical earthquake activity is significantly above Minnesota state average. It is 59% smaller than the overall U.S. average.On 7/9/1975 at 14:54:15, a magnitude 4.6 (4.6 MB, Class: Light, Intensity: IV - V) earthquake occurred 162.2 miles away from the city center
On 6/5/1993 at 01:24:53, a magnitude 4.1 (4.1 LG, Depth: 6.2 mi) earthquake occurred 174.2 miles away from the city center
On 3/4/1983 at 06:32:18, a magnitude 4.6 (4.4 MB, 4.6 LG, 4.4 ML) earthquake occurred 329.5 miles away from the city center
On 10/20/1995 at 15:57:18, a magnitude 3.7 (3.7 LG, Depth: 3.1 mi, Class: Light, Intensity: II - III) earthquake occurred 202.8 miles away from the city center
On 2/9/1994 at 08:45:35, a magnitude 3.1 (3.1 LG, Depth: 3.1 mi) earthquake occurred 106.7 miles away from the city center
On 6/28/2004 at 06:10:52, a magnitude 4.2 (4.2 MW, Depth: 6.2 mi) earthquake occurred 317.4 miles away from the city center
Magnitude types: regional Lg-wave magnitude (LG), body-wave magnitude (MB), local magnitude (ML), moment magnitude (MW)
Natural disasters:
The number of natural disasters in Washington County (16) is near the US average (15).Major Disasters (Presidential) Declared: 10
Emergencies Declared: 3
Causes of natural disasters: Floods: 11, Storms: 6, Tornadoes: 4, Winds: 2, Drought: 1, Fire: 1, Hurricane: 1, Winter Storm: 1, Other: 1 (Note: some incidents may be assigned to more than one category).
Hospitals and medical centers in Stillwater:
- LAKEVIEW MEMORIAL HOSPITAL (Voluntary non-profit - Private, provides emergency services, 927 WEST CHURCHILL STREET)
- GOLDEN LIVINGCENTER - GREELEY (313 SOUTH GREELEY STREET)
- GOLDEN LIVINGCENTER - LINDEN (105 WEST LINDEN STREET)
- GOOD SAMARITAN SOCIETY - STILLWATER (1119 OWENS STREET NORTH)
- GREENLEY HEALTH CARE CTR (313 SOUTH GREELEY)
- LINDEN NURSING HOME (105 WEST LINDEN ST)
- STILLWATER RESIDENCE (220 W OLIVE ST)
- RIVER CITY DIALYSIS (1970 NORTHWESTERN AVE N)
- LAKEVIEW HOMECARE (1715 TOWER DRIVE WEST SUITE 330)
Airports located in Stillwater:
- Keller Airport (0MN8) (Runways: 1)
Amtrak station near Stillwater:
Colleges/universities with over 2000 students nearest to Stillwater:
- Century College (about 9 miles; White Bear Lake, MN; Full-time enrollment: 7,393)
- Metropolitan State University (about 15 miles; Saint Paul, MN; FT enrollment: 6,159)
- Saint Paul College (about 17 miles; Saint Paul, MN; FT enrollment: 4,778)
- Bethel University (about 17 miles; Saint Paul, MN; FT enrollment: 4,061)
- University of Wisconsin-River Falls (about 17 miles; River Falls, WI; FT enrollment: 5,868)
- University of Northwestern-St Paul (about 18 miles; Saint Paul, MN; FT enrollment: 2,680)
- Concordia University-Saint Paul (about 18 miles; Saint Paul, MN; FT enrollment: 2,501)
Biggest public high schools in Stillwater:
- MCF - OAK PARK HEIGHTS (Location: 5329 OSGOOD AVE N, Grades: 9-12)
- ST. CROIX PREPARATORY ACADEMY UPPER (Location: 4260 STAGECOACH TR N, Grades: 9-12, Charter school)
- NEW HEIGHTS SCHOOL, INC. (Location: 614 W MULBERRY ST, Grades: KG-12, Charter school)
- STILLWATER JUNIOR HIGH (Location: 523 MARSH ST W, Grades: 7-9)
- STILLWATER AREA HIGH SCHOOL (Location: 5701 STILLWATER BLVD N, Grades: 10-12)
- STILLWATER DIST. SPECIAL SERVICES (Location: 1875 GREELEY ST S, Grades: KG-12)
- ST CROIX VALLEY AREA LEARNING CNTR. (Location: 5640 MEMORIAL AVE N, Grades: 7-12)
- PHASE 4 (Location: 5620 MEMORIAL AVE N, Grades: 6-12)
- WCJC (Location: 15015 62ND ST N, Grades: 7-12)
- BRIDGE TRANSITION PROGRAM (Location: 5701 STILLWATER BLVD N, Grades: 12)
Public elementary/middle schools in Stillwater:
- ST. CROIX PREPARATORY ACADEMY LOWER (Location: 4620 STAGECOACH TR N, Grades: KG-4, Charter school)
- ST CROIX PREPARATORY ACADEMY MIDDLE (Location: 4620 STAGECOACH TR N, Grades: 5-8, Charter school)
- A/O PROGRAM (Location: 1111 SOUTH HOLCOMBE ST, Grades: PK-1)
- WILDWOOD ELEMENTARY (Location: 8698 75TH STREET NORTH, Grades: KG-2)
- LILY LAKE ELEMENTARY (Location: 2003 WILLARD ST W, Grades: KG-6)
- OAK PARK ELEMENTARY (Location: 6355 OSMAN AVE N, Grades: KG-6)
- STONEBRIDGE ELEMENTARY (Location: 900 OWENS ST N, Grades: KG-6)
- RUTHERFORD ELEMENTARY (Location: 115 RUTHERFORD RD, Grades: KG-6)
Private elementary/middle schools in Stillwater:
- ST CROIX CATHOLIC SCHOOL (Students: 428, Location: 621 3RD ST S, Grades: PK-8)
- SALEM LUTHERAN SCHOOL (Students: 157, Location: 14940 62ND ST N, Grades: PK-8)
- ST CROIX MONTESSORI (Students: 71, Location: 177 NEAL AVE N, Grades: PK-5)
Library in Stillwater:
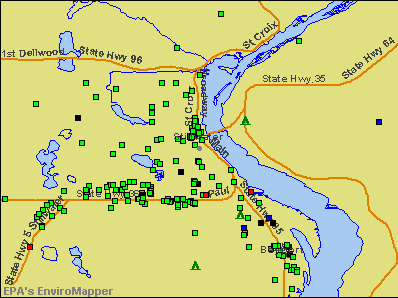
Points of interest:
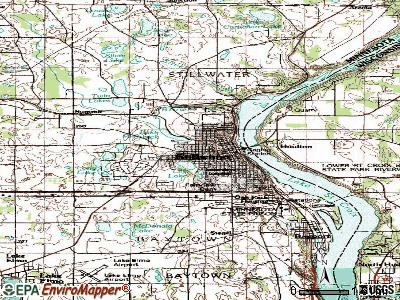
Notable locations in Stillwater: Stillwater (A), Stillwater Country Club (B), Oak Glen Country Club (C), Washington County Sheriff's Office (D), Washington County Government Center (E), Washington County Museum (F), Stillwater Public Library (G), Stillwater City Hall (H), Stillwater Fire and Rescue (I), Stillwater Police Department (J), Washington County Historic Courthouse (K). Display/hide their locations on the map
Shopping Centers: Oak Park Ponds Shopping Center (1), River Heights Plaza Shopping Center (2), Stillwater Market Place Shopping Center (3). Display/hide their locations on the map
Churches in Stillwater include: Ascension Episcopal Church (A), Trinity Lutheran Church (B), True Life Christian Church (C), Saint Michael's Catholic Church (D), Saint Paul Lutheran Church (E), Saint Mary's Catholic Church (F), Saint Peter's United Church (G), Stillwater Christian Fellowship (H), Seventh Day Adventist Church (I). Display/hide their locations on the map
Cemeteries: Salem Cemetery (1), Fairview Cemetery (2). Display/hide their locations on the map
Lakes: Lake McKusick (A), Long Lake (B), Brick Pond (C), Brewers Pond (D), Lily Lake (E). Display/hide their locations on the map
Creeks: Silver Creek (A), Browns Creek (B). Display/hide their locations on the map
Parks in Stillwater include: Lowell Park (1), Staples Park (2), Pioneer Park (3), Schulenburg Park (4), McKusick Park (5), Ramsey Park (6), Park Land (7), JC Ball Fields (8), Creekside Park (9). Display/hide their locations on the map
Tourist attractions: Aamodt's Hot Air Balloon Rides Inc (Po Box 858), Balloons at Stillwater (14791 60th Street North Suite 10).
Hotels: Best Western Stillwater Inn (1750 W Frontage Rd), Mpls./St. Paul/Stillwater Super 8 Motel (PO Box 2116), Holiday Inn Express Hotel & Suites (2000 Washington Avenue South), Lumber Barons (101 Water Street South), Stillwater Motel (1750 Frontage Road West), Country Inn & Suites by Carlson-Stillwater (2200 Frontage Road West), Cover Park Manor Bed & Breakfast (15330 58th Street North), AmericInn Stillwater Oak Park (13025 60th Street), Elephant Walk (801 Pine Street West).
Court: Washington County - County Court- Administration (14949 62nd Street North).
Birthplace of: C. Gardner Sullivan - Screenwriter, Todd Kalis - Football player, Carlson Twins - Male model, Glen Perkins - Baseball player, James B. Clark (director) - Film director, Sheila Harsdorf - Politician, Thomas J. Abercrombie - Photographer and writer, Scott Steindorff - Film producer, Bob Nelson (linebacker) - Football player, Chris Engler - Basketball player.
Drinking water stations with addresses in Stillwater and their reported violations in the past:
INDIAN HILLS DEVELOPMENT (Population served: 120, Groundwater):Past health violations:
- MCL, Monthly (TCR) - Between OCT-2005 and DEC-2005, Contaminant: Coliform. Follow-up actions: St Formal NOV issued (OCT-12-2005), St Tech Assistance Visit (OCT-12-2005), St Compliance Meeting conducted (OCT-12-2005), St Public Notif requested (OCT-12-2005), St Compliance achieved (OCT-19-2005), St Public Notif received (OCT-24-2005)
Drinking water stations with addresses in Stillwater that have no violations reported:
- ST CROIX HARLEY DAVIDSON INC (Serves WI, Population served: 35, Primary Water Source Type: Groundwater)
- CEDAR TERRACE MOBILE HOME PARK (Population served: 25, Primary Water Source Type: Groundwater)
| This city: | 2.5 people |
| Minnesota: | 2.5 people |
| This city: | 69.0% |
| Whole state: | 64.6% |
| This city: | 5.8% |
| Whole state: | 6.9% |
Likely homosexual households (counted as self-reported same-sex unmarried-partner households)
- Lesbian couples: 0.4% of all households
- Gay men: 0.2% of all households
People in group quarters in Stillwater in 2010:
- 208 people in nursing facilities/skilled-nursing facilities
- 206 people in local jails and other municipal confinement facilities
- 51 people in group homes intended for adults
- 7 people in group homes for juveniles (non-correctional)
People in group quarters in Stillwater in 2000:
- 162 people in nursing homes
- 133 people in homes for the mentally retarded
- 28 people in other noninstitutional group quarters
- 7 people in other group homes
- 2 people in religious group quarters
Banks with most branches in Stillwater (2011 data):
- U.S. Bank National Association: Stillwater Branch at 213 East Chestnut Street, branch established on 1856/09/18; Oak Ridge Branch at 6001 Stillwater Boulevard North, branch established on 1984/06/11. Info updated 2012/01/30: Bank assets: $330,470.8 mil, Deposits: $236,091.5 mil, headquarters in Cincinnati, OH, positive income, 3121 total offices, Holding Company: U.S. Bancorp
- First State Bank and Trust: Stillwater Branch at 125 New England Place, branch established on 2004/08/03. Info updated 2006/11/03: Bank assets: $217.7 mil, Deposits: $197.8 mil, headquarters in Bayport, MN, positive income, Mortgage Lending Specialization, 4 total offices, Holding Company: Universal Financial Services, Inc.
- Lake Area Bank: Stillwater Branch at 5795 Morning Dove Avenue North, branch established on 2002/04/01. Info updated 2008/06/04: Bank assets: $274.3 mil, Deposits: $233.1 mil, headquarters in Lindstrom, MN, negative income in the last year, Commercial Lending Specialization, 8 total offices, Holding Company: Freedom Bancorporation, Inc.
- Bremer Bank, National Association: Stillwater Branch at 5990 Nova Scotia Avenue North, branch established on 2008/04/14. Info updated 2006/11/03: Bank assets: $2,725.5 mil, Deposits: $2,268.8 mil, headquarters in South St. Paul, MN, positive income, Commercial Lending Specialization, 29 total offices, Holding Company: Otto Bremer Foundation
- Wells Fargo Bank, National Association: Stillwater Branch at 2000 Northwestern Avenue S, branch established on 1909/09/18. Info updated 2011/04/05: Bank assets: $1,161,490.0 mil, Deposits: $905,653.0 mil, headquarters in Sioux Falls, SD, positive income, 6395 total offices, Holding Company: Wells Fargo & Company
- Central Bank: at 2270 Frontage Road, branch established on 1988/04/29. Info updated 2011/10/11: Bank assets: $1,120.1 mil, Deposits: $949.3 mil, local headquarters, positive income, Commercial Lending Specialization, 20 total offices, Holding Company: Central Bancshares, Inc.
- TCF National Bank: Stillwater Cub Branch at 1801 Market Drive, branch established on 1989/06/30. Info updated 2009/11/23: Bank assets: $19,007.0 mil, Deposits: $12,377.0 mil, headquarters in Sioux Falls, SD, positive income, Commercial Lending Specialization, 441 total offices, Holding Company: Tcf Financial Corporation
- Lake Elmo Bank: Stillwater Branch at 1937 South Greeley Street, branch established on 2006/06/12. Info updated 2006/11/03: Bank assets: $276.7 mil, Deposits: $244.0 mil, headquarters in Lake Elmo, MN, positive income, Commercial Lending Specialization, 6 total offices, Holding Company: Lake Elmo Bancshares, Inc.
- Eagle Valley Bank, National Association: Stillwater Branch at 1946 Washington Avenue, branch established on 1997/11/24. Info updated 2006/11/03: Bank assets: $150.4 mil, Deposits: $112.3 mil, headquarters in St. Croix Falls, WI, negative income in the last year, Commercial Lending Specialization, 5 total offices, Holding Company: Financial Services Of Saint Croix Falls, Inc.
For population 15 years and over in Stillwater:
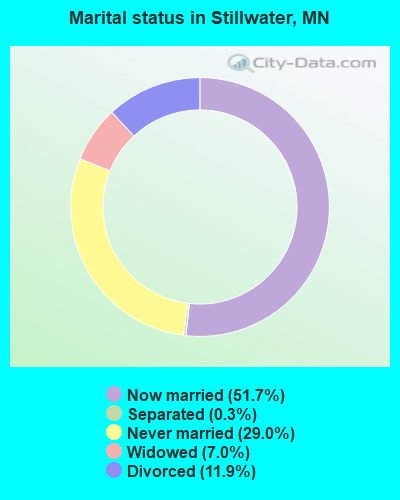
- Never married: 29.0%
- Now married: 51.7%
- Separated: 0.3%
- Widowed: 7.0%
- Divorced: 11.9%
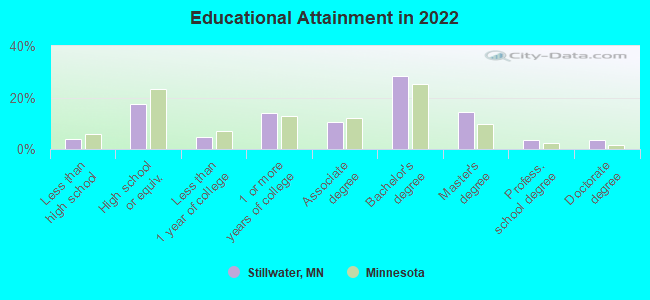
For population 25 years and over in Stillwater:
- High school or higher: 96.8%
- Bachelor's degree or higher: 49.1%
- Graduate or professional degree: 20.4%
- Unemployed: 2.0%
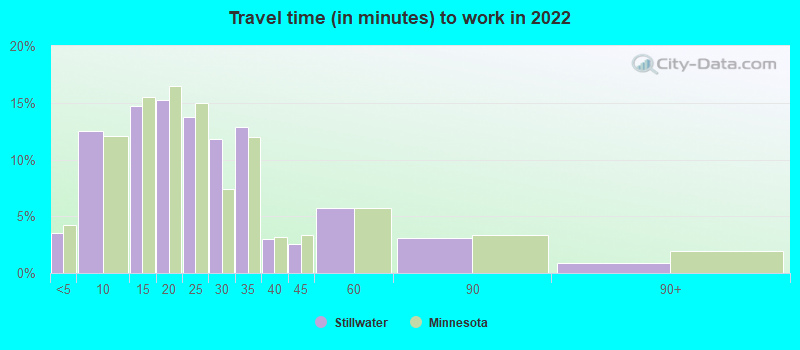
- Mean travel time to work (commute): 17.2 minutes
| Here: | 11.1 |
| Minnesota average: | 10.9 |
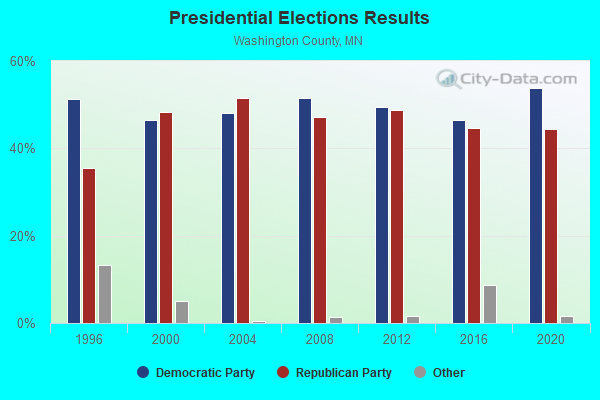
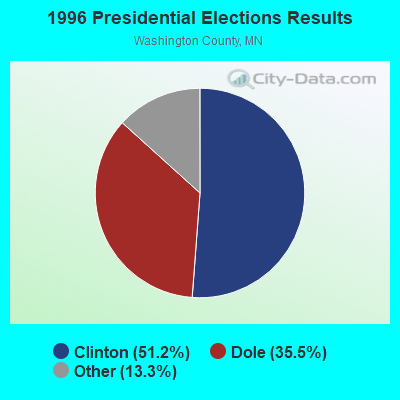
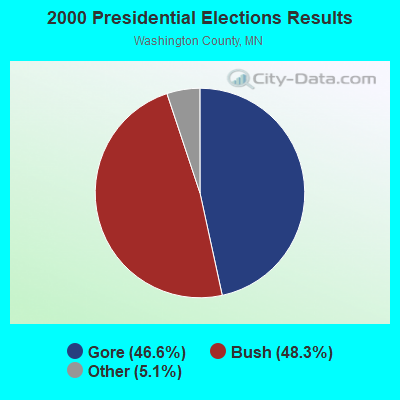

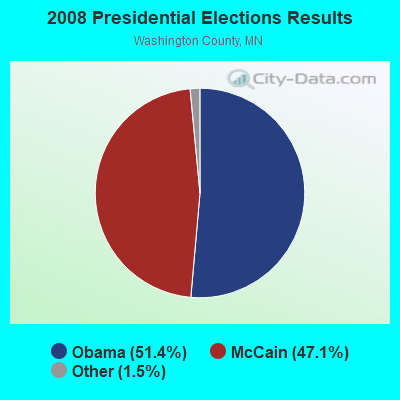
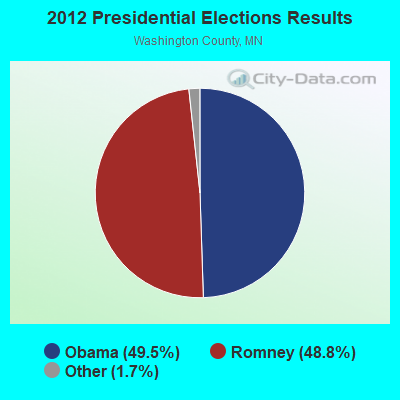


Graphs represent county-level data. Detailed 2008 Election Results
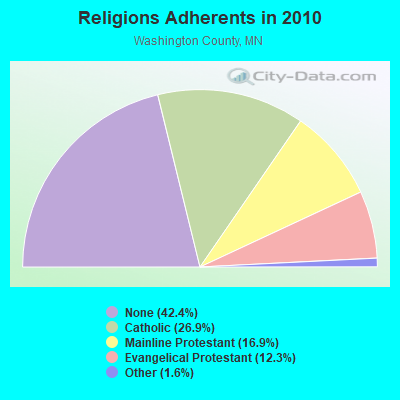
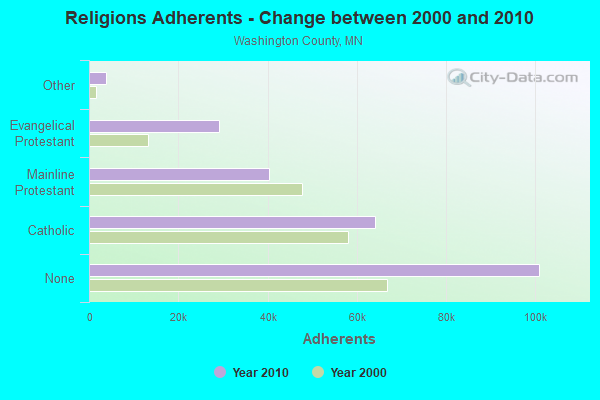
Religion statistics for Stillwater, MN (based on Washington County data)
| Religion | Adherents | Congregations |
|---|---|---|
| Catholic | 64,157 | 9 |
| Mainline Protestant | 40,212 | 38 |
| Evangelical Protestant | 29,174 | 69 |
| Other | 3,699 | 13 |
| None | 100,894 | - |
Food Environment Statistics:
| Here: | 0.89 / 10,000 pop. |
| Minnesota: | 1.83 / 10,000 pop. |
| Washington County: | 0.04 / 10,000 pop. |
| State: | 0.13 / 10,000 pop. |
| Washington County: | 0.22 / 10,000 pop. |
| Minnesota: | 0.49 / 10,000 pop. |
| Here: | 2.30 / 10,000 pop. |
| Minnesota: | 3.90 / 10,000 pop. |
| This county: | 6.02 / 10,000 pop. |
| Minnesota: | 6.98 / 10,000 pop. |
| This county: | 5.3% |
| Minnesota: | 6.5% |
| This county: | 26.7% |
| Minnesota: | 25.9% |
| Here: | 10.8% |
| Minnesota: | 13.0% |
Health and Nutrition:
| This city: | 54.1% |
| Minnesota: | 50.6% |
| Stillwater: | 53.9% |
| Minnesota: | 48.4% |
| Stillwater: | 28.2 |
| State: | 28.5 |
| Stillwater: | 18.9% |
| Minnesota: | 21.0% |
| Here: | 7.5% |
| Minnesota: | 9.8% |
| Here: | 6.9 |
| Minnesota: | 6.8 |
| Here: | 35.3% |
| Minnesota: | 33.5% |
| Stillwater: | 60.7% |
| State: | 57.7% |
| Stillwater: | 80.3% |
| Minnesota: | 79.3% |
More about Health and Nutrition of Stillwater, MN Residents
| Local government employment and payroll (March 2022) | |||||
| Function | Full-time employees | Monthly full-time payroll | Average yearly full-time wage | Part-time employees | Monthly part-time payroll |
|---|---|---|---|---|---|
| Police Protection - Officers | 35 | $210,284 | $72,097 | 0 | $0 |
| Streets and Highways | 22 | $111,070 | $60,584 | 0 | $0 |
| Firefighters | 13 | $80,686 | $74,479 | 39 | $15,420 |
| Other Government Administration | 9 | $59,564 | $79,419 | 10 | $9,306 |
| Financial Administration | 7 | $44,702 | $76,632 | 0 | $0 |
| Parks and Recreation | 7 | $32,963 | $56,508 | 0 | $0 |
| Sewerage | 6 | $27,070 | $54,140 | 0 | $0 |
| Water Supply | 6 | $40,920 | $81,840 | 0 | $0 |
| Police - Other | 4 | $19,493 | $58,479 | 4 | $2,629 |
| Other and Unallocable | 4 | $26,275 | $78,825 | 4 | $4,597 |
| Local Libraries | 4 | $23,189 | $69,567 | 41 | $57,749 |
| Judicial and Legal | 1 | $13,255 | $159,060 | 0 | $0 |
| Totals for Government | 118 | $689,471 | $70,116 | 98 | $89,701 |
Stillwater government finances - Expenditure in 2021 (per resident):
- Construction - Regular Highways: $5,403,000 ($280.30)
- Current Operations - General - Other: $5,808,000 ($301.31)
Police Protection: $5,097,000 ($264.42)
Sewerage: $3,441,000 ($178.51)
Regular Highways: $2,385,000 ($123.73)
Parks and Recreation: $2,228,000 ($115.58)
Local Fire Protection: $1,994,000 ($103.44)
Water Utilities: $1,786,000 ($92.65)
Libraries: $1,387,000 ($71.95)
Financial Administration: $1,132,000 ($58.73)
Central Staff Services: $177,000 ($9.18)
Solid Waste Management: $12,000 ($0.62)
- General - Interest on Debt: $1,074,000 ($55.72)
- Other Capital Outlay - General - Other: $1,071,000 ($55.56)
Regular Highways: $618,000 ($32.06)
Water Utilities: $552,000 ($28.64)
Sewerage: $40,000 ($2.08)
Libraries: $36,000 ($1.87)
- Water Utilities - Interest on Debt: $26,000 ($1.35)
Stillwater government finances - Revenue in 2021 (per resident):
- Charges - Sewerage: $2,722,000 ($141.21)
Regular Highways: $1,315,000 ($68.22)
Parks and Recreation: $1,279,000 ($66.35)
Other: $773,000 ($40.10)
- Federal Intergovernmental - Health and Hospitals: $1,500,000 ($77.82)
- Local Intergovernmental - Other: $159,000 ($8.25)
Highways: $32,000 ($1.66)
- Miscellaneous - Special Assessments: $1,392,000 ($72.21)
General Revenue - Other: $640,000 ($33.20)
Interest Earnings: $591,000 ($30.66)
Fines and Forfeits: $199,000 ($10.32)
- Revenue - Water Utilities: $1,181,000 ($61.27)
- State Intergovernmental - Highways: $1,453,000 ($75.38)
General Local Government Support: $802,000 ($41.61)
Other: $449,000 ($23.29)
Sewerage: $1,000 ($0.05)
- Tax - Property: $14,486,000 ($751.50)
Other License: $672,000 ($34.86)
Public Utilities Sales: $488,000 ($25.32)
Other Selective Sales: $244,000 ($12.66)
Stillwater government finances - Debt in 2021 (per resident):
- Long Term Debt - Beginning Outstanding - Unspecified Public Purpose: $34,630,000 ($1796.53)
Outstanding Unspecified Public Purpose: $30,855,000 ($1600.70)
Beginning Outstanding - Public Debt for Private Purpose: $23,807,000 ($1235.06)
Outstanding Nonguaranteed - Industrial Revenue: $21,427,000 ($1111.59)
Retired Unspecified Public Purpose: $3,775,000 ($195.84)
Retired Nonguaranteed - Public Debt for Private Purpose: $2,380,000 ($123.47)
Stillwater government finances - Cash and Securities in 2021 (per resident):
- Sinking Funds - Cash and Securities: $21,427,000 ($1111.59)
| Businesses in Stillwater, MN | ||||
| Name | Count | Name | Count | |
|---|---|---|---|---|
| Ace Hardware | 1 | MasterBrand Cabinets | 2 | |
| Applebee's | 1 | McDonald's | 1 | |
| Caribou Coffee | 1 | Nike | 1 | |
| Carson Pirie Scott | 1 | OfficeMax | 1 | |
| Chevrolet | 1 | Pizza Hut | 1 | |
| Curves | 1 | Quiznos | 1 | |
| Dairy Queen | 1 | RadioShack | 1 | |
| Discount Tire | 1 | Starbucks | 2 | |
| Famous Footwear | 1 | Subway | 1 | |
| FedEx | 3 | Super 8 | 1 | |
| GNC | 1 | T-Mobile | 1 | |
| H&R Block | 1 | Target | 1 | |
| Jones New York | 2 | U-Haul | 1 | |
| Lane Furniture | 1 | UPS | 3 | |
Strongest AM radio stations in Stillwater:
- WMGT (1220 AM; 5 kW; STILLWATER, MN; Owner: ENDURANCE BROADCASTING, LLC)
- KTIS (900 AM; 25 kW; MINNEAPOLIS, MN; Owner: NORTHWESTERN COLLEGE)
- KSTP (1500 AM; 50 kW; ST. PAUL, MN; Owner: KSTP-AM, LLC (DELAWARE))
- WCTS (1030 AM; 50 kW; MAPLEWOOD, MN; Owner: CNTL. BAPT. THEO/AL SEMI MINNEAPOLIS)
- WDGY (630 AM; 8 kW; HUDSON, WI; Owner: 630 RADIO, INCORPORATED)
- WCCO (830 AM; 50 kW; MINNEAPOLIS, MN; Owner: INFINITY MEDIA CORPORATION)
- KFAN (1130 AM; 50 kW; MINNEAPOLIS, MN; Owner: AMFM RADIO LICENSES, L.L.C.)
- WIXK (1590 AM; daytime; 5 kW; NEW RICHMOND, WI; Owner: WIXK-AM, LLC)
- KUOM (770 AM; daytime; 5 kW; MINNEAPOLIS, MN)
- WMIN (740 AM; daytime; 1 kW; HUDSON, WI; Owner: WRPX, INC.)
- WMNN (1330 AM; 10 kW; MINNEAPOLIS, MN; Owner: MINNESOTA PUBLIC RADIO.)
- KKMS (980 AM; 5 kW; RICHFIELD, MN)
- WEBC (560 AM; 50 kW; DULUTH, MN)
Strongest FM radio stations in Stillwater:
- WXPT (104.1 FM; ST. LOUIS PARK, MN; Owner: THE AUDIO HOUSE, INC.)
- KNOW-FM (91.1 FM; MINNEAPOLIS-ST. PAUL, MN; Owner: MINNESOTA PUBLIC RADIO)
- WLTE (102.9 FM; MINNEAPOLIS, MN; Owner: INFINITY MEDIA CORPORATION)
- KSTP-FM (94.5 FM; ST. PAUL, MN; Owner: KSTP-FM, LLC, A DELAWARE LLC)
- KEEY-FM (102.1 FM; ST. PAUL, MN; Owner: AMFM RADIO LICENSES, L.L.C.)
- KTIS-FM (98.5 FM; MINNEAPOLIS, MN; Owner: NORTHWESTERN COLLEGE)
- KDWB-FM (101.3 FM; RICHFIELD, MN; Owner: AMFM RADIO LICENSES, L.L.C.)
- KQRS-FM (92.5 FM; GOLDEN VALLEY, MN; Owner: KQRS, Inc.)
- KSJN (99.5 FM; MINNEAPOLIS, MN; Owner: MINNESOTA PUBLIC RADIO)
- KXXR (93.7 FM; MINNEAPOLIS, MN; Owner: KQRS, INC.)
- WFMP (107.1 FM; COON RAPIDS, MN; Owner: WFMP-FM, LLC)
- KTCZ-FM (97.1 FM; MINNEAPOLIS, MN; Owner: AMFM RADIO LICENSES, L.L.C.)
- KQQL (107.9 FM; ANOKA, MN; Owner: AMFM RADIO LICENSES, L.L.C.)
- KBEM-FM (88.5 FM; MINNEAPOLIS, MN; Owner: BD. OF EDUCATION, S.S.D. NO. 1)
- WEVR-FM (106.3 FM; RIVER FALLS, WI; Owner: HANTEN BROADCASTING COMPANY, INC.)
- KJZI (100.3 FM; MINNEAPOLIS, MN; Owner: AMFM RADIO LICENSES, L.L.C.)
- K214DF (90.7 FM; GOLDEN VALLEY, MN; Owner: EDUCATIONAL MEDIA FOUNDATION)
- WCAL (89.3 FM; NORTHFIELD, MN; Owner: ST. OLAF COLLEGE)
- K294AM (106.7 FM; WEST ST. PAUL, MN; Owner: FRESH AIR, INCORPORATED)
- KFAI (90.3 FM; MINNEAPOLIS, MN; Owner: FRESH AIR, INC.)
TV broadcast stations around Stillwater:
- KMSP-TV (Channel 9; MINNEAPOLIS, MN; Owner: FOX TELEVISION STATIONS, INC.)
- KTCA-TV (Channel 2; ST. PAUL, MN; Owner: TWIN CITIES PUBLIC TELEVISION, INC.)
- KARE (Channel 11; MINNEAPOLIS, MN; Owner: MULTIMEDIA HOLDINGS CORPORATION)
- KSTP-TV (Channel 5; ST. PAUL, MN; Owner: HUBBARD BROADCASTING, INC.)
- KTCI-TV (Channel 17; ST. PAUL, MN; Owner: TWIN CITIES PUBLIC TELEVISION, INC.)
- WCCO-TV (Channel 4; MINNEAPOLIS, MN; Owner: CBS BROADCASTING INC.)
- KMWB (Channel 23; MINNEAPOLIS, MN; Owner: KLGT LICENSEE, LLC)
- KSTC-TV (Channel 45; MINNEAPOLIS, MN; Owner: HUBBARD BROADCASTING, INC.)
- WFTC (Channel 29; MINNEAPOLIS, MN; Owner: FOX TELEVISION STATIONS, INC.)
- K07UI (Channel 7; MINNEAPOLIS, ETC., MN; Owner: WORD OF GOD FELLOWSHIP, INC.)
- K58BS (Channel 58; MINNEAPOLIS, MN; Owner: TRINITY BROADCASTING NETWORK)
- K67HG (Channel 67; MINNEAPOLIS, MN; Owner: VENTANA TELEVISION, INC.)
- K19ER (Channel 19; ST. PAUL, MN; Owner: CATHOLIC VIEWS BROADCASTS, INC.)
- K14KH (Channel 14; MINNEAPOLIS, MN; Owner: THREE ANGELS BROADCASTING NETWORK)
- W62BD (Channel 62; MINNEAPOLIS, MN; Owner: WORD OF GOD FELLOWSHIP, INC.)
- W55AP (Channel 55; RIVER FALLS, WI; Owner: STATE OF WISCONSIN - EDUCATIONAL COMMUNICATIONS BOARD)
- WBWX-CA (Channel 13; MINNEAPOLIS, MN; Owner: THE BOX WORLDWIDE LLC)
- KPXM (Channel 41; ST. CLOUD, MN; Owner: PAXSON MINNEAPOLIS LICENSE, INC.)
- WHWC-TV (Channel 28; MENOMONIE, WI; Owner: STATE OF WISCONSIN - EDUCATIONAL COMMUNICATIONS BOARD)
- National Bridge Inventory (NBI) Statistics
- 4Number of bridges
- 59ft / 17.6mTotal length
- $271,000,000Total costs
- 61,440Total average daily traffic
- 1,979Total average daily truck traffic
FCC Registered Broadcast Land Mobile Towers: 26 (See the full list of FCC Registered Broadcast Land Mobile Towers in Stillwater, MN)
FCC Registered Microwave Towers: 10 (See the full list of FCC Registered Microwave Towers in this town)
FCC Registered Paging Towers: 6 (See the full list of FCC Registered Paging Towers)
FCC Registered Maritime Coast & Aviation Ground Towers: 5 (See the full list of FCC Registered Maritime Coast & Aviation Ground Towers)
FCC Registered Amateur Radio Licenses: 209 (See the full list of FCC Registered Amateur Radio Licenses in Stillwater)
FAA Registered Aircraft: 78 (See the full list of FAA Registered Aircraft in Stillwater)
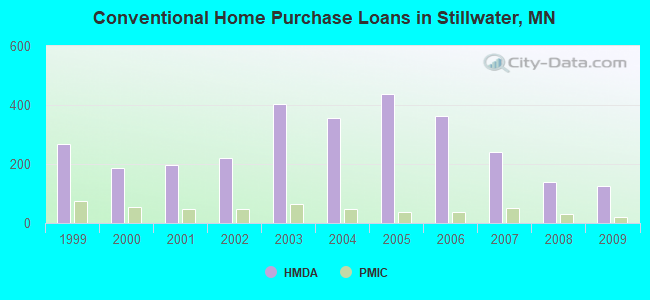
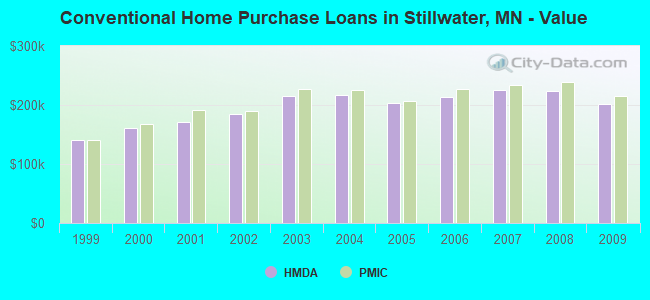
| Home Mortgage Disclosure Act Aggregated Statistics For Year 2009 (Based on 2 full and 2 partial tracts) | ||||||||||||
| A) FHA, FSA/RHS & VA Home Purchase Loans | B) Conventional Home Purchase Loans | C) Refinancings | D) Home Improvement Loans | E) Loans on Dwellings For 5+ Families | F) Non-occupant Loans on < 5 Family Dwellings (A B C & D) | |||||||
|---|---|---|---|---|---|---|---|---|---|---|---|---|
| Number | Average Value | Number | Average Value | Number | Average Value | Number | Average Value | Number | Average Value | Number | Average Value | |
| LOANS ORIGINATED | 71 | $197,526 | 126 | $200,995 | 560 | $220,254 | 30 | $107,115 | 1 | $207,110 | 28 | $177,722 |
| APPLICATIONS APPROVED, NOT ACCEPTED | 7 | $215,540 | 13 | $226,492 | 81 | $227,082 | 4 | $73,458 | 0 | $0 | 7 | $175,086 |
| APPLICATIONS DENIED | 6 | $219,738 | 19 | $181,577 | 124 | $232,424 | 10 | $79,476 | 0 | $0 | 6 | $212,083 |
| APPLICATIONS WITHDRAWN | 4 | $149,268 | 18 | $196,598 | 109 | $225,681 | 11 | $128,567 | 0 | $0 | 10 | $188,624 |
| FILES CLOSED FOR INCOMPLETENESS | 1 | $264,910 | 0 | $0 | 24 | $212,267 | 1 | $55,390 | 0 | $0 | 2 | $356,490 |
Detailed HMDA statistics for the following Tracts: 0705.01 , 0705.02, 0706.01, 0706.02
| Private Mortgage Insurance Companies Aggregated Statistics For Year 2009 (Based on 2 full and 2 partial tracts) | ||||||
| A) Conventional Home Purchase Loans | B) Refinancings | C) Non-occupant Loans on < 5 Family Dwellings (A & B) | ||||
|---|---|---|---|---|---|---|
| Number | Average Value | Number | Average Value | Number | Average Value | |
| LOANS ORIGINATED | 19 | $214,814 | 10 | $247,104 | 1 | $100,180 |
| APPLICATIONS APPROVED, NOT ACCEPTED | 5 | $217,010 | 5 | $275,454 | 0 | $0 |
| APPLICATIONS DENIED | 3 | $146,867 | 4 | $198,838 | 0 | $0 |
| APPLICATIONS WITHDRAWN | 2 | $246,755 | 1 | $171,400 | 0 | $0 |
| FILES CLOSED FOR INCOMPLETENESS | 0 | $0 | 0 | $0 | 0 | $0 |
Detailed PMIC statistics for the following Tracts: 0705.01 , 0705.02, 0706.01, 0706.02
2002 - 2018 National Fire Incident Reporting System (NFIRS) incidents
- Fire incident types reported to NFIRS in Stillwater, MN
- 56048.0%Structure Fires
- 38533.0%Outside Fires
- 18616.0%Mobile Property/Vehicle Fires
- 353.0%Other
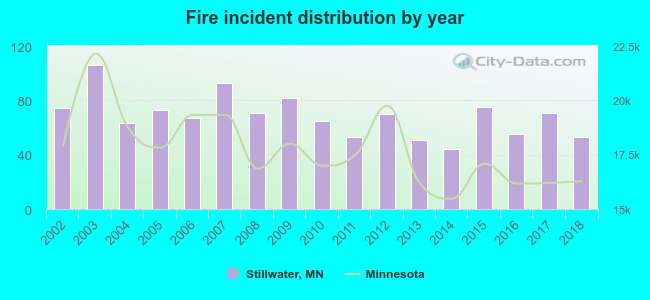 Based on the data from the years 2002 - 2018 the average number of fire incidents per year is 69. The highest number of reported fires - 106 took place in 2003, and the least - 44 in 2014. The data has a dropping trend.
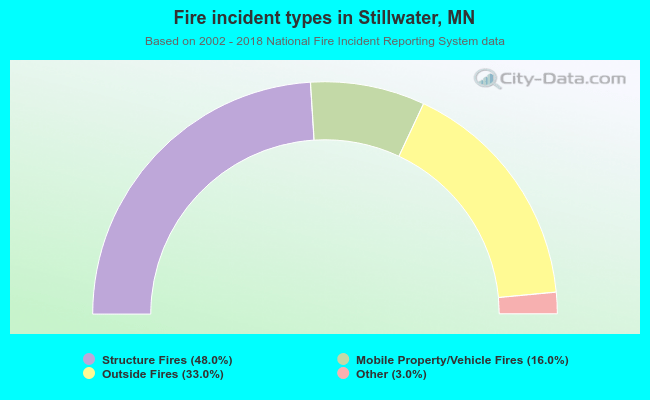 When looking into fire subcategories, the most reports belonged to: Structure Fires (48.0%), and Outside Fires (33.0%).
Fire-safe hotels and motels in Stillwater, Minnesota:
- Americas Best Value Inn, 1750 W Frontage Rd, Stillwater, Minnesota 55082 , Phone: (651) 430-1300, Fax: (651) 430-0596
- Stillwater Super 8 Motel, 2190 W Frontage Rd, Stillwater, Minnesota 55082 , Phone: (651) 430-3990, Fax: (651) 430-3990
- Lexington Inn & Suites, 2000 Washington Ave, Stillwater, Minnesota 55082 , Phone: (651) 275-1401
- Crossings By Grandstay Inn And Suites, 2200 W Frontage Rd, Stillwater, Minnesota 55082 , Phone: (651) 430-2699, Fax: (651) 430-1233
- Comfort Inn and Suites, 2000 Washington Ave, Stillwater, Minnesota 55082 , Phone: (651) 275-1401
| Most common first names in Stillwater, MN among deceased individuals | ||
| Name | Count | Lived (average) |
|---|---|---|
| John | 159 | 73.6 years |
| Mary | 128 | 81.9 years |
| Robert | 111 | 73.1 years |
| William | 106 | 75.5 years |
| James | 84 | 70.1 years |
| Margaret | 83 | 81.4 years |
| Helen | 82 | 83.7 years |
| George | 77 | 78.0 years |
| Ruth | 71 | 80.0 years |
| Richard | 63 | 71.4 years |
| Most common last names in Stillwater, MN among deceased individuals | ||
| Last name | Count | Lived (average) |
|---|---|---|
| Johnson | 122 | 78.6 years |
| Anderson | 94 | 79.9 years |
| Nelson | 73 | 79.5 years |
| Peterson | 66 | 77.9 years |
| Larson | 45 | 78.3 years |
| Carlson | 42 | 80.4 years |
| Smith | 39 | 78.8 years |
| Miller | 36 | 78.8 years |
| Olson | 29 | 77.3 years |
| Erickson | 22 | 82.9 years |
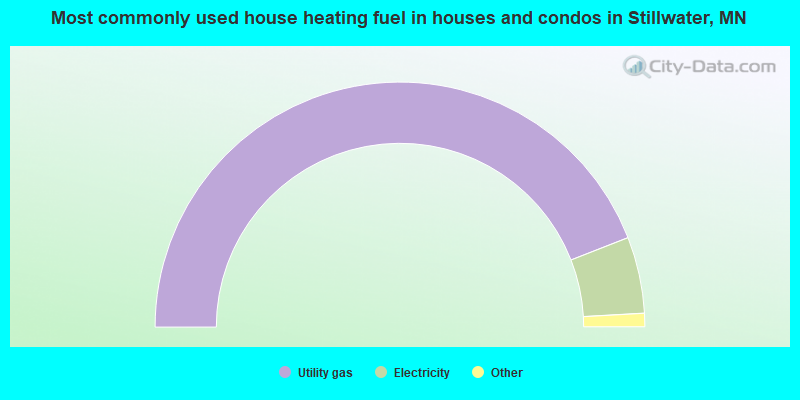
- 88.2%Utility gas
- 10.1%Electricity
- 1.3%Bottled, tank, or LP gas
- 0.3%Fuel oil, kerosene, etc.
- 0.3%Other fuel
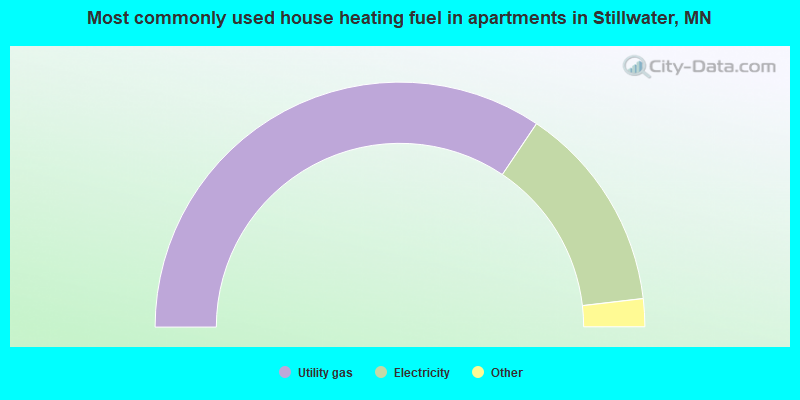
- 68.9%Utility gas
- 27.5%Electricity
- 1.4%Other fuel
- 1.3%Bottled, tank, or LP gas
- 0.5%No fuel used
- 0.4%Wood
Stillwater compared to Minnesota state average:
- Unemployed percentage significantly below state average.
- Black race population percentage below state average.
- Length of stay since moving in significantly above state average.
- Institutionalized population percentage above state average.
- Percentage of population with a bachelor's degree or higher above state average.
State forum archive:

|
|
Total of 1609 patent applications in 2008-2024.