Theodore, Alabama Submit your own pictures of this place and show them to the world
OSM Map
General Map
Google Map
MSN Map
OSM Map
General Map
Google Map
MSN Map
OSM Map
General Map
Google Map
MSN Map
OSM Map
General Map
Google Map
MSN Map
Please wait while loading the map...
Population in 2010: 6,130. Population change since 2000: -10.0%Males: 2,771 Females: 3,359
March 2022 cost of living index in Theodore: 84.2 (less than average, U.S. average is 100) Percentage of residents living in poverty in 2022: 26.5%for White Non-Hispanic residents , 32.1% for Black residents , 36.1% for two or more races residents )
Profiles of local businesses
Business Search - 14 Million verified businesses
Data:
Median household income ($)
Median household income (% change since 2000)
Household income diversity
Ratio of average income to average house value (%)
Ratio of average income to average rent
Median household income ($) - White
Median household income ($) - Black or African American
Median household income ($) - Asian
Median household income ($) - Hispanic or Latino
Median household income ($) - American Indian and Alaska Native
Median household income ($) - Multirace
Median household income ($) - Other Race
Median household income for houses/condos with a mortgage ($)
Median household income for apartments without a mortgage ($)
Races - White alone (%)
Races - White alone (% change since 2000)
Races - Black alone (%)
Races - Black alone (% change since 2000)
Races - American Indian alone (%)
Races - American Indian alone (% change since 2000)
Races - Asian alone (%)
Races - Asian alone (% change since 2000)
Races - Hispanic (%)
Races - Hispanic (% change since 2000)
Races - Native Hawaiian and Other Pacific Islander alone (%)
Races - Native Hawaiian and Other Pacific Islander alone (% change since 2000)
Races - Two or more races (%)
Races - Two or more races (% change since 2000)
Races - Other race alone (%)
Races - Other race alone (% change since 2000)
Racial diversity
Unemployment (%)
Unemployment (% change since 2000)
Unemployment (%) - White
Unemployment (%) - Black or African American
Unemployment (%) - Asian
Unemployment (%) - Hispanic or Latino
Unemployment (%) - American Indian and Alaska Native
Unemployment (%) - Multirace
Unemployment (%) - Other Race
Population density (people per square mile)
Population - Males (%)
Population - Females (%)
Population - Males (%) - White
Population - Males (%) - Black or African American
Population - Males (%) - Asian
Population - Males (%) - Hispanic or Latino
Population - Males (%) - American Indian and Alaska Native
Population - Males (%) - Multirace
Population - Males (%) - Other Race
Population - Females (%) - White
Population - Females (%) - Black or African American
Population - Females (%) - Asian
Population - Females (%) - Hispanic or Latino
Population - Females (%) - American Indian and Alaska Native
Population - Females (%) - Multirace
Population - Females (%) - Other Race
Coronavirus confirmed cases (Apr 27, 2024)
Deaths caused by coronavirus (Apr 27, 2024)
Coronavirus confirmed cases (per 100k population) (Apr 27, 2024)
Deaths caused by coronavirus (per 100k population) (Apr 27, 2024)
Daily increase in number of cases (Apr 27, 2024)
Weekly increase in number of cases (Apr 27, 2024)
Cases doubled (in days) (Apr 27, 2024)
Hospitalized patients (Apr 18, 2022)
Negative test results (Apr 18, 2022)
Total test results (Apr 18, 2022)
COVID Vaccine doses distributed (per 100k population) (Sep 19, 2023)
COVID Vaccine doses administered (per 100k population) (Sep 19, 2023)
COVID Vaccine doses distributed (Sep 19, 2023)
COVID Vaccine doses administered (Sep 19, 2023)
Likely homosexual households (%)
Likely homosexual households (% change since 2000)
Likely homosexual households - Lesbian couples (%)
Likely homosexual households - Lesbian couples (% change since 2000)
Likely homosexual households - Gay men (%)
Likely homosexual households - Gay men (% change since 2000)
Cost of living index
Median gross rent ($)
Median contract rent ($)
Median monthly housing costs ($)
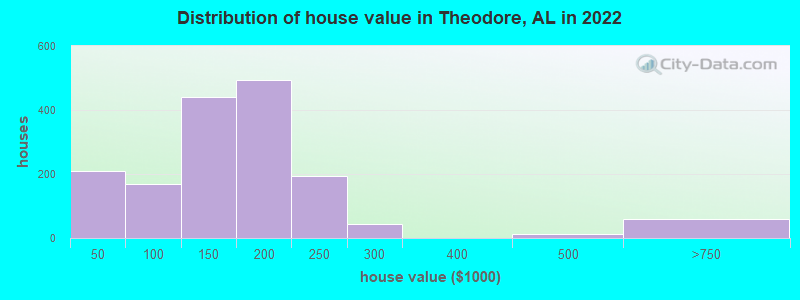
Median house or condo value ($)
Median house or condo value ($ change since 2000)
Mean house or condo value by units in structure - 1, detached ($)
Mean house or condo value by units in structure - 1, attached ($)
Mean house or condo value by units in structure - 2 ($)
Mean house or condo value by units in structure by units in structure - 3 or 4 ($)
Mean house or condo value by units in structure - 5 or more ($)
Mean house or condo value by units in structure - Boat, RV, van, etc. ($)
Mean house or condo value by units in structure - Mobile home ($)
Median house or condo value ($) - White
Median house or condo value ($) - Black or African American
Median house or condo value ($) - Asian
Median house or condo value ($) - Hispanic or Latino
Median house or condo value ($) - American Indian and Alaska Native
Median house or condo value ($) - Multirace
Median house or condo value ($) - Other Race
Median resident age
Resident age diversity
Median resident age - Males
Median resident age - Females
Median resident age - White
Median resident age - Black or African American
Median resident age - Asian
Median resident age - Hispanic or Latino
Median resident age - American Indian and Alaska Native
Median resident age - Multirace
Median resident age - Other Race
Median resident age - Males - White
Median resident age - Males - Black or African American
Median resident age - Males - Asian
Median resident age - Males - Hispanic or Latino
Median resident age - Males - American Indian and Alaska Native
Median resident age - Males - Multirace
Median resident age - Males - Other Race
Median resident age - Females - White
Median resident age - Females - Black or African American
Median resident age - Females - Asian
Median resident age - Females - Hispanic or Latino
Median resident age - Females - American Indian and Alaska Native
Median resident age - Females - Multirace
Median resident age - Females - Other Race
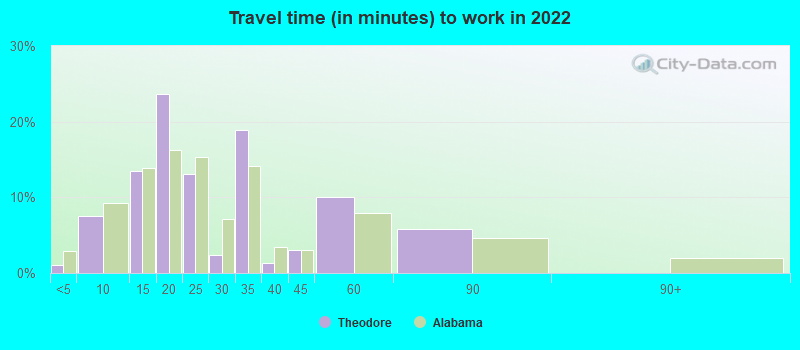
Commute - mean travel time to work (minutes)
Travel time to work - Less than 5 minutes (%)
Travel time to work - Less than 5 minutes (% change since 2000)
Travel time to work - 5 to 9 minutes (%)
Travel time to work - 5 to 9 minutes (% change since 2000)
Travel time to work - 10 to 19 minutes (%)
Travel time to work - 10 to 19 minutes (% change since 2000)
Travel time to work - 20 to 29 minutes (%)
Travel time to work - 20 to 29 minutes (% change since 2000)
Travel time to work - 30 to 39 minutes (%)
Travel time to work - 30 to 39 minutes (% change since 2000)
Travel time to work - 40 to 59 minutes (%)
Travel time to work - 40 to 59 minutes (% change since 2000)
Travel time to work - 60 to 89 minutes (%)
Travel time to work - 60 to 89 minutes (% change since 2000)
Travel time to work - 90 or more minutes (%)
Travel time to work - 90 or more minutes (% change since 2000)
Marital status - Never married (%)
Marital status - Now married (%)
Marital status - Separated (%)
Marital status - Widowed (%)
Marital status - Divorced (%)
Median family income ($)
Median family income (% change since 2000)
Median non-family income ($)
Median non-family income (% change since 2000)
Median per capita income ($)
Median per capita income (% change since 2000)
Median family income ($) - White
Median family income ($) - Black or African American
Median family income ($) - Asian
Median family income ($) - Hispanic or Latino
Median family income ($) - American Indian and Alaska Native
Median family income ($) - Multirace
Median family income ($) - Other Race
Median year house/condo built
Median year apartment built
Year house built - Built 2005 or later (%)
Year house built - Built 2000 to 2004 (%)
Year house built - Built 1990 to 1999 (%)
Year house built - Built 1980 to 1989 (%)
Year house built - Built 1970 to 1979 (%)
Year house built - Built 1960 to 1969 (%)
Year house built - Built 1950 to 1959 (%)
Year house built - Built 1940 to 1949 (%)
Year house built - Built 1939 or earlier (%)
Average household size
Household density (households per square mile)
Average household size - White
Average household size - Black or African American
Average household size - Asian
Average household size - Hispanic or Latino
Average household size - American Indian and Alaska Native
Average household size - Multirace
Average household size - Other Race
Occupied housing units (%)
Vacant housing units (%)
Owner occupied housing units (%)
Renter occupied housing units (%)
Vacancy status - For rent (%)
Vacancy status - For sale only (%)
Vacancy status - Rented or sold, not occupied (%)
Vacancy status - For seasonal, recreational, or occasional use (%)
Vacancy status - For migrant workers (%)
Vacancy status - Other vacant (%)
Residents with income below the poverty level (%)
Residents with income below 50% of the poverty level (%)
Children below poverty level (%)
Poor families by family type - Married-couple family (%)
Poor families by family type - Male, no wife present (%)
Poor families by family type - Female, no husband present (%)
Poverty status for native-born residents (%)
Poverty status for foreign-born residents (%)
Poverty among high school graduates not in families (%)
Poverty among people who did not graduate high school not in families (%)
Residents with income below the poverty level (%) - White
Residents with income below the poverty level (%) - Black or African American
Residents with income below the poverty level (%) - Asian
Residents with income below the poverty level (%) - Hispanic or Latino
Residents with income below the poverty level (%) - American Indian and Alaska Native
Residents with income below the poverty level (%) - Multirace
Residents with income below the poverty level (%) - Other Race
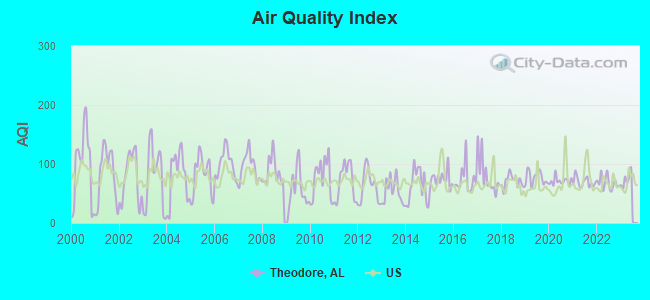
Air pollution - Air Quality Index (AQI)
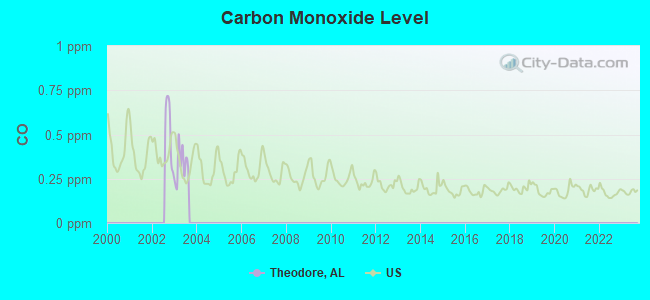
Air pollution - CO
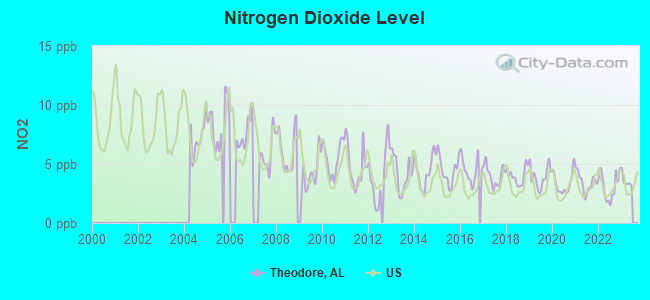
Air pollution - NO2
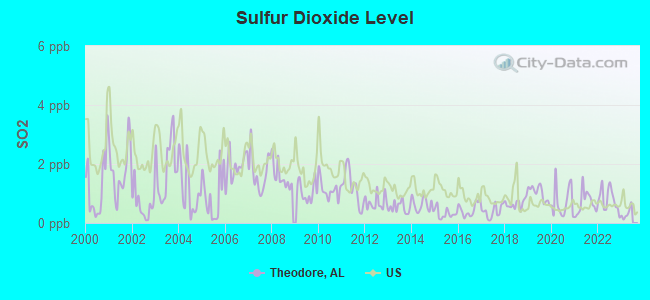
Air pollution - SO2
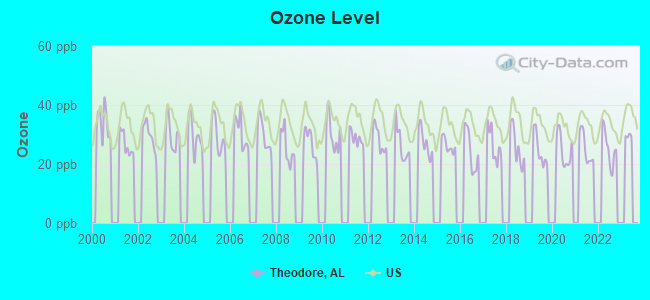
Air pollution - Ozone
Air pollution - PM10
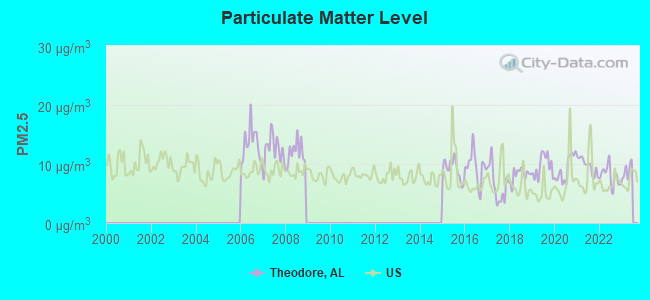
Air pollution - PM25
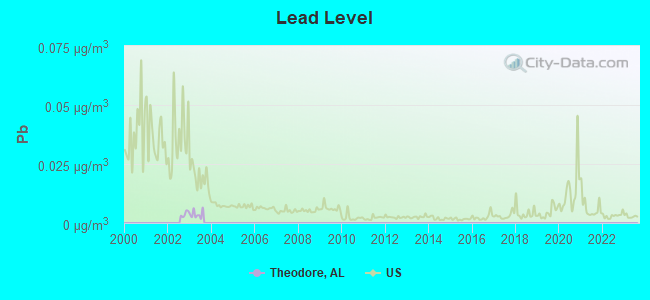
Air pollution - Pb
Crime - Murders per 100,000 population
Crime - Rapes per 100,000 population
Crime - Robberies per 100,000 population
Crime - Assaults per 100,000 population
Crime - Burglaries per 100,000 population
Crime - Thefts per 100,000 population
Crime - Auto thefts per 100,000 population
Crime - Arson per 100,000 population
Crime - City-data.com crime index
Crime - Violent crime index
Crime - Property crime index
Crime - Murders per 100,000 population (5 year average)
Crime - Rapes per 100,000 population (5 year average)
Crime - Robberies per 100,000 population (5 year average)
Crime - Assaults per 100,000 population (5 year average)
Crime - Burglaries per 100,000 population (5 year average)
Crime - Thefts per 100,000 population (5 year average)
Crime - Auto thefts per 100,000 population (5 year average)
Crime - Arson per 100,000 population (5 year average)
Crime - City-data.com crime index (5 year average)
Crime - Violent crime index (5 year average)
Crime - Property crime index (5 year average)
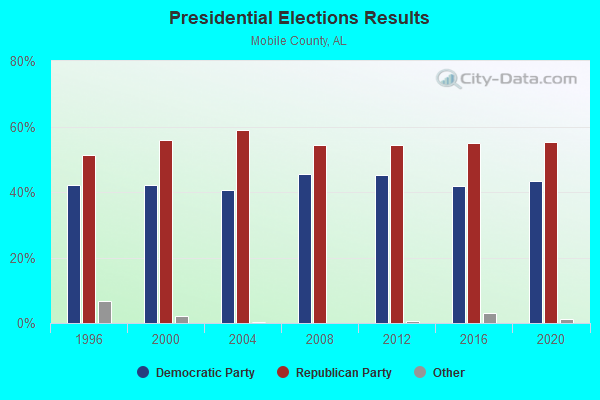
1996 Presidential Elections Results (%) - Democratic Party (Clinton)
1996 Presidential Elections Results (%) - Republican Party (Dole)
1996 Presidential Elections Results (%) - Other
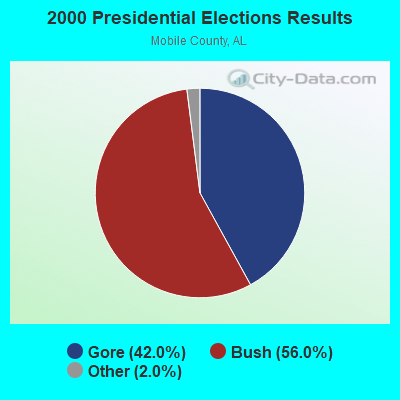
2000 Presidential Elections Results (%) - Democratic Party (Gore)
2000 Presidential Elections Results (%) - Republican Party (Bush)
2000 Presidential Elections Results (%) - Other
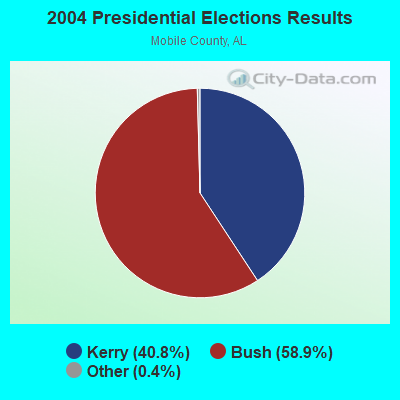
2004 Presidential Elections Results (%) - Democratic Party (Kerry)
2004 Presidential Elections Results (%) - Republican Party (Bush)
2004 Presidential Elections Results (%) - Other
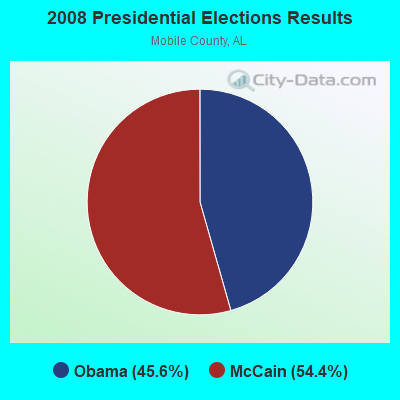
2008 Presidential Elections Results (%) - Democratic Party (Obama)
2008 Presidential Elections Results (%) - Republican Party (McCain)
2008 Presidential Elections Results (%) - Other
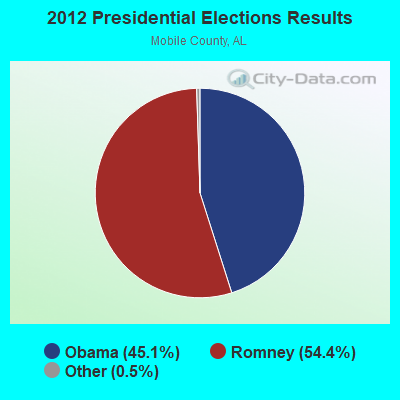
2012 Presidential Elections Results (%) - Democratic Party (Obama)
2012 Presidential Elections Results (%) - Republican Party (Romney)
2012 Presidential Elections Results (%) - Other
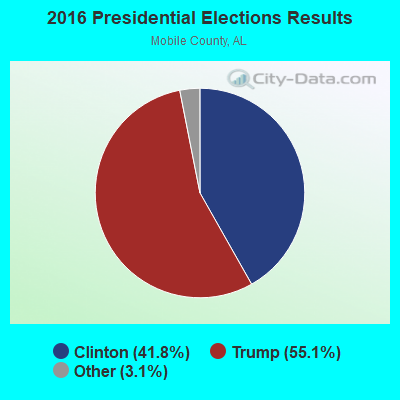
2016 Presidential Elections Results (%) - Democratic Party (Clinton)
2016 Presidential Elections Results (%) - Republican Party (Trump)
2016 Presidential Elections Results (%) - Other
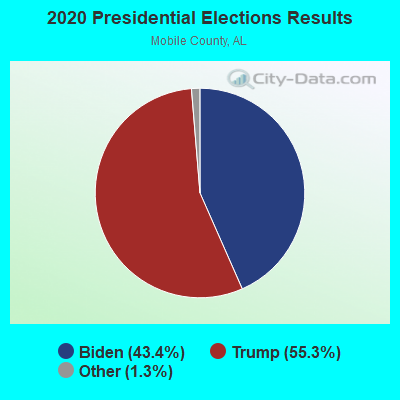
2020 Presidential Elections Results (%) - Democratic Party (Biden)
2020 Presidential Elections Results (%) - Republican Party (Trump)
2020 Presidential Elections Results (%) - Other
Ancestries Reported - Arab (%)
Ancestries Reported - Czech (%)
Ancestries Reported - Danish (%)
Ancestries Reported - Dutch (%)
Ancestries Reported - English (%)
Ancestries Reported - French (%)
Ancestries Reported - French Canadian (%)
Ancestries Reported - German (%)
Ancestries Reported - Greek (%)
Ancestries Reported - Hungarian (%)
Ancestries Reported - Irish (%)
Ancestries Reported - Italian (%)
Ancestries Reported - Lithuanian (%)
Ancestries Reported - Norwegian (%)
Ancestries Reported - Polish (%)
Ancestries Reported - Portuguese (%)
Ancestries Reported - Russian (%)
Ancestries Reported - Scotch-Irish (%)
Ancestries Reported - Scottish (%)
Ancestries Reported - Slovak (%)
Ancestries Reported - Subsaharan African (%)
Ancestries Reported - Swedish (%)
Ancestries Reported - Swiss (%)
Ancestries Reported - Ukrainian (%)
Ancestries Reported - United States (%)
Ancestries Reported - Welsh (%)
Ancestries Reported - West Indian (%)
Ancestries Reported - Other (%)
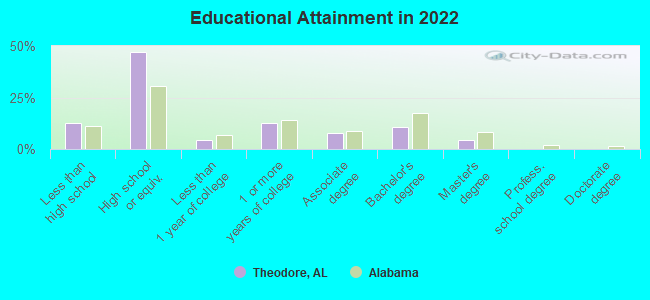
Educational Attainment - No schooling completed (%)
Educational Attainment - Less than high school (%)
Educational Attainment - High school or equivalent (%)
Educational Attainment - Less than 1 year of college (%)
Educational Attainment - 1 or more years of college (%)
Educational Attainment - Associate degree (%)
Educational Attainment - Bachelor's degree (%)
Educational Attainment - Master's degree (%)
Educational Attainment - Professional school degree (%)
Educational Attainment - Doctorate degree (%)
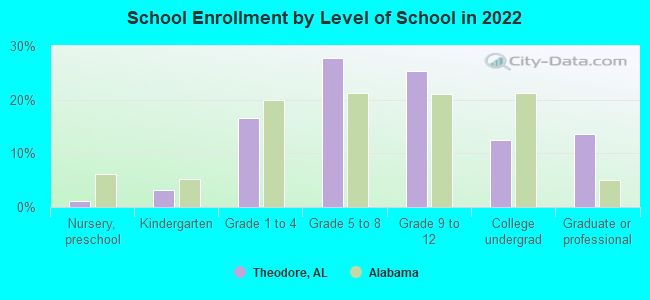
School Enrollment - Nursery, preschool (%)
School Enrollment - Kindergarten (%)
School Enrollment - Grade 1 to 4 (%)
School Enrollment - Grade 5 to 8 (%)
School Enrollment - Grade 9 to 12 (%)
School Enrollment - College undergrad (%)
School Enrollment - Graduate or professional (%)
School Enrollment - Not enrolled in school (%)
School enrollment - Public schools (%)
School enrollment - Private schools (%)
School enrollment - Not enrolled (%)
Median number of rooms in houses and condos
Median number of rooms in apartments
Housing units lacking complete plumbing facilities (%)
Housing units lacking complete kitchen facilities (%)
Density of houses
Urban houses (%)
Rural houses (%)
Households with people 60 years and over (%)
Households with people 65 years and over (%)
Households with people 75 years and over (%)
Households with one or more nonrelatives (%)
Households with no nonrelatives (%)
Population in households (%)
Family households (%)
Nonfamily households (%)
Population in families (%)
Family households with own children (%)
Median number of bedrooms in owner occupied houses
Mean number of bedrooms in owner occupied houses
Median number of bedrooms in renter occupied houses
Mean number of bedrooms in renter occupied houses
Median number of vehichles in owner occupied houses
Mean number of vehichles in owner occupied houses
Median number of vehichles in renter occupied houses
Mean number of vehichles in renter occupied houses
Mortgage status - with mortgage (%)
Mortgage status - with second mortgage (%)
Mortgage status - with home equity loan (%)
Mortgage status - with both second mortgage and home equity loan (%)
Mortgage status - without a mortgage (%)
Average family size
Average family size - White
Average family size - Black or African American
Average family size - Asian
Average family size - Hispanic or Latino
Average family size - American Indian and Alaska Native
Average family size - Multirace
Average family size - Other Race
Geographical mobility - Same house 1 year ago (%)
Geographical mobility - Moved within same county (%)
Geographical mobility - Moved from different county within same state (%)
Geographical mobility - Moved from different state (%)
Geographical mobility - Moved from abroad (%)
Place of birth - Born in state of residence (%)
Place of birth - Born in other state (%)
Place of birth - Native, outside of US (%)
Place of birth - Foreign born (%)
Housing units in structures - 1, detached (%)
Housing units in structures - 1, attached (%)
Housing units in structures - 2 (%)
Housing units in structures - 3 or 4 (%)
Housing units in structures - 5 to 9 (%)
Housing units in structures - 10 to 19 (%)
Housing units in structures - 20 to 49 (%)
Housing units in structures - 50 or more (%)
Housing units in structures - Mobile home (%)
Housing units in structures - Boat, RV, van, etc. (%)
House/condo owner moved in on average (years ago)
Renter moved in on average (years ago)
Year householder moved into unit - Moved in 1999 to March 2000 (%)
Year householder moved into unit - Moved in 1995 to 1998 (%)
Year householder moved into unit - Moved in 1990 to 1994 (%)
Year householder moved into unit - Moved in 1980 to 1989 (%)
Year householder moved into unit - Moved in 1970 to 1979 (%)
Year householder moved into unit - Moved in 1969 or earlier (%)
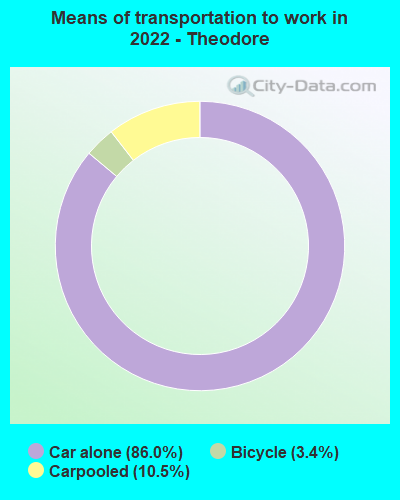
Means of transportation to work - Drove car alone (%)
Means of transportation to work - Carpooled (%)
Means of transportation to work - Public transportation (%)
Means of transportation to work - Bus or trolley bus (%)
Means of transportation to work - Streetcar or trolley car (%)
Means of transportation to work - Subway or elevated (%)
Means of transportation to work - Railroad (%)
Means of transportation to work - Ferryboat (%)
Means of transportation to work - Taxicab (%)
Means of transportation to work - Motorcycle (%)
Means of transportation to work - Bicycle (%)
Means of transportation to work - Walked (%)
Means of transportation to work - Other means (%)
Working at home (%)
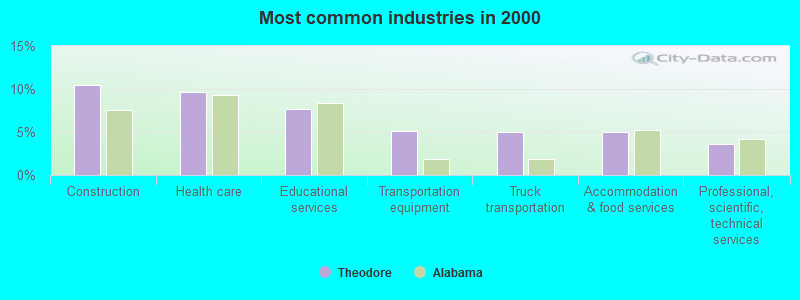
Industry diversity
Most Common Industries - Agriculture, forestry, fishing and hunting, and mining (%)
Most Common Industries - Agriculture, forestry, fishing and hunting (%)
Most Common Industries - Mining, quarrying, and oil and gas extraction (%)
Most Common Industries - Construction (%)
Most Common Industries - Manufacturing (%)
Most Common Industries - Wholesale trade (%)
Most Common Industries - Retail trade (%)
Most Common Industries - Transportation and warehousing, and utilities (%)
Most Common Industries - Transportation and warehousing (%)
Most Common Industries - Utilities (%)
Most Common Industries - Information (%)
Most Common Industries - Finance and insurance, and real estate and rental and leasing (%)
Most Common Industries - Finance and insurance (%)
Most Common Industries - Real estate and rental and leasing (%)
Most Common Industries - Professional, scientific, and management, and administrative and waste management services (%)
Most Common Industries - Professional, scientific, and technical services (%)
Most Common Industries - Management of companies and enterprises (%)
Most Common Industries - Administrative and support and waste management services (%)
Most Common Industries - Educational services, and health care and social assistance (%)
Most Common Industries - Educational services (%)
Most Common Industries - Health care and social assistance (%)
Most Common Industries - Arts, entertainment, and recreation, and accommodation and food services (%)
Most Common Industries - Arts, entertainment, and recreation (%)
Most Common Industries - Accommodation and food services (%)
Most Common Industries - Other services, except public administration (%)
Most Common Industries - Public administration (%)
Occupation diversity
Most Common Occupations - Management, business, science, and arts occupations (%)
Most Common Occupations - Management, business, and financial occupations (%)
Most Common Occupations - Management occupations (%)
Most Common Occupations - Business and financial operations occupations (%)
Most Common Occupations - Computer, engineering, and science occupations (%)
Most Common Occupations - Computer and mathematical occupations (%)
Most Common Occupations - Architecture and engineering occupations (%)
Most Common Occupations - Life, physical, and social science occupations (%)
Most Common Occupations - Education, legal, community service, arts, and media occupations (%)
Most Common Occupations - Community and social service occupations (%)
Most Common Occupations - Legal occupations (%)
Most Common Occupations - Education, training, and library occupations (%)
Most Common Occupations - Arts, design, entertainment, sports, and media occupations (%)
Most Common Occupations - Healthcare practitioners and technical occupations (%)
Most Common Occupations - Health diagnosing and treating practitioners and other technical occupations (%)
Most Common Occupations - Health technologists and technicians (%)
Most Common Occupations - Service occupations (%)
Most Common Occupations - Healthcare support occupations (%)
Most Common Occupations - Protective service occupations (%)
Most Common Occupations - Fire fighting and prevention, and other protective service workers including supervisors (%)
Most Common Occupations - Law enforcement workers including supervisors (%)
Most Common Occupations - Food preparation and serving related occupations (%)
Most Common Occupations - Building and grounds cleaning and maintenance occupations (%)
Most Common Occupations - Personal care and service occupations (%)
Most Common Occupations - Sales and office occupations (%)
Most Common Occupations - Sales and related occupations (%)
Most Common Occupations - Office and administrative support occupations (%)
Most Common Occupations - Natural resources, construction, and maintenance occupations (%)
Most Common Occupations - Farming, fishing, and forestry occupations (%)
Most Common Occupations - Construction and extraction occupations (%)
Most Common Occupations - Installation, maintenance, and repair occupations (%)
Most Common Occupations - Production, transportation, and material moving occupations (%)
Most Common Occupations - Production occupations (%)
Most Common Occupations - Transportation occupations (%)
Most Common Occupations - Material moving occupations (%)
People in Group quarters - Institutionalized population (%)
People in Group quarters - Correctional institutions (%)
People in Group quarters - Federal prisons and detention centers (%)
People in Group quarters - Halfway houses (%)
People in Group quarters - Local jails and other confinement facilities (including police lockups) (%)
People in Group quarters - Military disciplinary barracks (%)
People in Group quarters - State prisons (%)
People in Group quarters - Other types of correctional institutions (%)
People in Group quarters - Nursing homes (%)
People in Group quarters - Hospitals/wards, hospices, and schools for the handicapped (%)
People in Group quarters - Hospitals/wards and hospices for chronically ill (%)
People in Group quarters - Hospices or homes for chronically ill (%)
People in Group quarters - Military hospitals or wards for chronically ill (%)
People in Group quarters - Other hospitals or wards for chronically ill (%)
People in Group quarters - Hospitals or wards for drug/alcohol abuse (%)
People in Group quarters - Mental (Psychiatric) hospitals or wards (%)
People in Group quarters - Schools, hospitals, or wards for the mentally retarded (%)
People in Group quarters - Schools, hospitals, or wards for the physically handicapped (%)
People in Group quarters - Institutions for the deaf (%)
People in Group quarters - Institutions for the blind (%)
People in Group quarters - Orthopedic wards and institutions for the physically handicapped (%)
People in Group quarters - Wards in general hospitals for patients who have no usual home elsewhere (%)
People in Group quarters - Wards in military hospitals for patients who have no usual home elsewhere (%)
People in Group quarters - Juvenile institutions (%)
People in Group quarters - Long-term care (%)
People in Group quarters - Homes for abused, dependent, and neglected children (%)
People in Group quarters - Residential treatment centers for emotionally disturbed children (%)
People in Group quarters - Training schools for juvenile delinquents (%)
People in Group quarters - Short-term care, detention or diagnostic centers for delinquent children (%)
People in Group quarters - Type of juvenile institution unknown (%)
People in Group quarters - Noninstitutionalized population (%)
People in Group quarters - College dormitories (includes college quarters off campus) (%)
People in Group quarters - Military quarters (%)
People in Group quarters - On base (%)
People in Group quarters - Barracks, unaccompanied personnel housing (UPH), (Enlisted/Officer), ;and similar group living quarters for military personnel (%)
People in Group quarters - Transient quarters for temporary residents (%)
People in Group quarters - Military ships (%)
People in Group quarters - Group homes (%)
People in Group quarters - Homes or halfway houses for drug/alcohol abuse (%)
People in Group quarters - Homes for the mentally ill (%)
People in Group quarters - Homes for the mentally retarded (%)
People in Group quarters - Homes for the physically handicapped (%)
People in Group quarters - Other group homes (%)
People in Group quarters - Religious group quarters (%)
People in Group quarters - Dormitories (%)
People in Group quarters - Agriculture workers' dormitories on farms (%)
People in Group quarters - Job Corps and vocational training facilities (%)
People in Group quarters - Other workers' dormitories (%)
People in Group quarters - Crews of maritime vessels (%)
People in Group quarters - Other nonhousehold living situations (%)
People in Group quarters - Other noninstitutional group quarters (%)
Residents speaking English at home (%)
Residents speaking English at home - Born in the United States (%)
Residents speaking English at home - Native, born elsewhere (%)
Residents speaking English at home - Foreign born (%)
Residents speaking Spanish at home (%)
Residents speaking Spanish at home - Born in the United States (%)
Residents speaking Spanish at home - Native, born elsewhere (%)
Residents speaking Spanish at home - Foreign born (%)
Residents speaking other language at home (%)
Residents speaking other language at home - Born in the United States (%)
Residents speaking other language at home - Native, born elsewhere (%)
Residents speaking other language at home - Foreign born (%)
Class of Workers - Employee of private company (%)
Class of Workers - Self-employed in own incorporated business (%)
Class of Workers - Private not-for-profit wage and salary workers (%)
Class of Workers - Local government workers (%)
Class of Workers - State government workers (%)
Class of Workers - Federal government workers (%)
Class of Workers - Self-employed workers in own not incorporated business and Unpaid family workers (%)
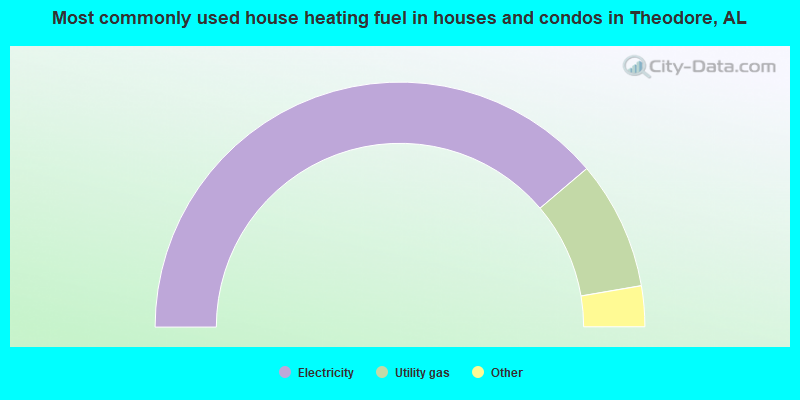
House heating fuel used in houses and condos - Utility gas (%)
House heating fuel used in houses and condos - Bottled, tank, or LP gas (%)
House heating fuel used in houses and condos - Electricity (%)
House heating fuel used in houses and condos - Fuel oil, kerosene, etc. (%)
House heating fuel used in houses and condos - Coal or coke (%)
House heating fuel used in houses and condos - Wood (%)
House heating fuel used in houses and condos - Solar energy (%)
House heating fuel used in houses and condos - Other fuel (%)
House heating fuel used in houses and condos - No fuel used (%)
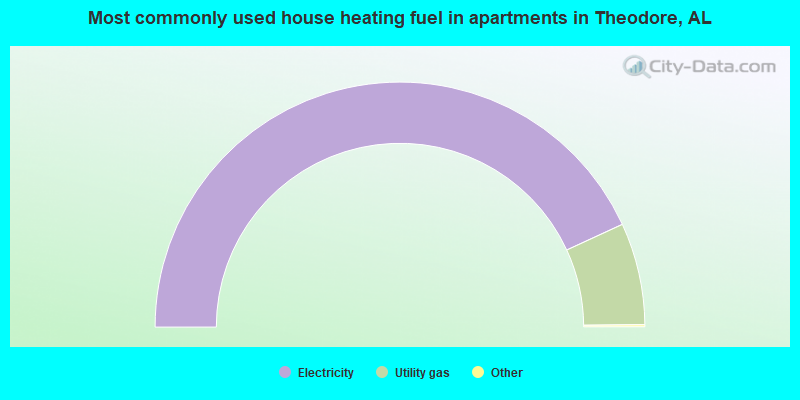
House heating fuel used in apartments - Utility gas (%)
House heating fuel used in apartments - Bottled, tank, or LP gas (%)
House heating fuel used in apartments - Electricity (%)
House heating fuel used in apartments - Fuel oil, kerosene, etc. (%)
House heating fuel used in apartments - Coal or coke (%)
House heating fuel used in apartments - Wood (%)
House heating fuel used in apartments - Solar energy (%)
House heating fuel used in apartments - Other fuel (%)
House heating fuel used in apartments - No fuel used (%)
Armed forces status - In Armed Forces (%)
Armed forces status - Civilian (%)
Armed forces status - Civilian - Veteran (%)
Armed forces status - Civilian - Nonveteran (%)
Fatal accidents locations in years 2005-2021
Fatal accidents locations in 2005
Fatal accidents locations in 2006
Fatal accidents locations in 2007
Fatal accidents locations in 2008
Fatal accidents locations in 2009
Fatal accidents locations in 2010
Fatal accidents locations in 2011
Fatal accidents locations in 2012
Fatal accidents locations in 2013
Fatal accidents locations in 2014
Fatal accidents locations in 2015
Fatal accidents locations in 2016
Fatal accidents locations in 2017
Fatal accidents locations in 2018
Fatal accidents locations in 2019
Fatal accidents locations in 2020
Fatal accidents locations in 2021
Alcohol use - People drinking some alcohol every month (%)
Alcohol use - People not drinking at all (%)
Alcohol use - Average days/month drinking alcohol
Alcohol use - Average drinks/week
Alcohol use - Average days/year people drink much
Audiometry - Average condition of hearing (%)
Audiometry - People that can hear a whisper from across a quiet room (%)
Audiometry - People that can hear normal voice from across a quiet room (%)
Audiometry - Ears ringing, roaring, buzzing (%)
Audiometry - Had a job exposure to loud noise (%)
Audiometry - Had off-work exposure to loud noise (%)
Blood Pressure & Cholesterol - Has high blood pressure (%)
Blood Pressure & Cholesterol - Checking blood pressure at home (%)
Blood Pressure & Cholesterol - Frequently checking blood cholesterol (%)
Blood Pressure & Cholesterol - Has high cholesterol level (%)
Consumer Behavior - Money monthly spent on food at supermarket/grocery store
Consumer Behavior - Money monthly spent on food at other stores
Consumer Behavior - Money monthly spent on eating out
Consumer Behavior - Money monthly spent on carryout/delivered foods
Consumer Behavior - Income spent on food at supermarket/grocery store (%)
Consumer Behavior - Income spent on food at other stores (%)
Consumer Behavior - Income spent on eating out (%)
Consumer Behavior - Income spent on carryout/delivered foods (%)
Current Health Status - General health condition (%)
Current Health Status - Blood donors (%)
Current Health Status - Has blood ever tested for HIV virus (%)
Current Health Status - Left-handed people (%)
Dermatology - People using sunscreen (%)
Diabetes - Diabetics (%)
Diabetes - Had a blood test for high blood sugar (%)
Diabetes - People taking insulin (%)
Diet Behavior & Nutrition - Diet health (%)
Diet Behavior & Nutrition - Milk product consumption (# of products/month)
Diet Behavior & Nutrition - Meals not home prepared (#/week)
Diet Behavior & Nutrition - Meals from fast food or pizza place (#/week)
Diet Behavior & Nutrition - Ready-to-eat foods (#/month)
Diet Behavior & Nutrition - Frozen meals/pizza (#/month)
Drug Use - People that ever used marijuana or hashish (%)
Drug Use - Ever used hard drugs (%)
Drug Use - Ever used any form of cocaine (%)
Drug Use - Ever used heroin (%)
Drug Use - Ever used methamphetamine (%)
Health Insurance - People covered by health insurance (%)
Kidney Conditions-Urology - Avg. # of times urinating at night
Medical Conditions - People with asthma (%)
Medical Conditions - People with anemia (%)
Medical Conditions - People with psoriasis (%)
Medical Conditions - People with overweight (%)
Medical Conditions - Elderly people having difficulties in thinking or remembering (%)
Medical Conditions - People who ever received blood transfusion (%)
Medical Conditions - People having trouble seeing even with glass/contacts (%)
Medical Conditions - People with arthritis (%)
Medical Conditions - People with gout (%)
Medical Conditions - People with congestive heart failure (%)
Medical Conditions - People with coronary heart disease (%)
Medical Conditions - People with angina pectoris (%)
Medical Conditions - People who ever had heart attack (%)
Medical Conditions - People who ever had stroke (%)
Medical Conditions - People with emphysema (%)
Medical Conditions - People with thyroid problem (%)
Medical Conditions - People with chronic bronchitis (%)
Medical Conditions - People with any liver condition (%)
Medical Conditions - People who ever had cancer or malignancy (%)
Mental Health - People who have little interest in doing things (%)
Mental Health - People feeling down, depressed, or hopeless (%)
Mental Health - People who have trouble sleeping or sleeping too much (%)
Mental Health - People feeling tired or having little energy (%)
Mental Health - People with poor appetite or overeating (%)
Mental Health - People feeling bad about themself (%)
Mental Health - People who have trouble concentrating on things (%)
Mental Health - People moving or speaking slowly or too fast (%)
Mental Health - People having thoughts they would be better off dead (%)
Oral Health - Average years since last visit a dentist
Oral Health - People embarrassed because of mouth (%)
Oral Health - People with gum disease (%)
Oral Health - General health of teeth and gums (%)
Oral Health - Average days a week using dental floss/device
Oral Health - Average days a week using mouthwash for dental problem
Oral Health - Average number of teeth
Pesticide Use - Households using pesticides to control insects (%)
Pesticide Use - Households using pesticides to kill weeds (%)
Physical Activity - People doing vigorous-intensity work activities (%)
Physical Activity - People doing moderate-intensity work activities (%)
Physical Activity - People walking or bicycling (%)
Physical Activity - People doing vigorous-intensity recreational activities (%)
Physical Activity - People doing moderate-intensity recreational activities (%)
Physical Activity - Average hours a day doing sedentary activities
Physical Activity - Average hours a day watching TV or videos
Physical Activity - Average hours a day using computer
Physical Functioning - People having limitations keeping them from working (%)
Physical Functioning - People limited in amount of work they can do (%)
Physical Functioning - People that need special equipment to walk (%)
Physical Functioning - People experiencing confusion/memory problems (%)
Physical Functioning - People requiring special healthcare equipment (%)
Prescription Medications - Average number of prescription medicines taking
Preventive Aspirin Use - Adults 40+ taking low-dose aspirin (%)
Reproductive Health - Vaginal deliveries (%)
Reproductive Health - Cesarean deliveries (%)
Reproductive Health - Deliveries resulted in a live birth (%)
Reproductive Health - Pregnancies resulted in a delivery (%)
Reproductive Health - Women breastfeeding newborns (%)
Reproductive Health - Women that had a hysterectomy (%)
Reproductive Health - Women that had both ovaries removed (%)
Reproductive Health - Women that have ever taken birth control pills (%)
Reproductive Health - Women taking birth control pills (%)
Reproductive Health - Women that have ever used Depo-Provera or injectables (%)
Reproductive Health - Women that have ever used female hormones (%)
Sexual Behavior - People 18+ that ever had sex (vaginal, anal, or oral) (%)
Sexual Behavior - Males 18+ that ever had vaginal sex with a woman (%)
Sexual Behavior - Males 18+ that ever performed oral sex on a woman (%)
Sexual Behavior - Males 18+ that ever had anal sex with a woman (%)
Sexual Behavior - Males 18+ that ever had any sex with a man (%)
Sexual Behavior - Females 18+ that ever had vaginal sex with a man (%)
Sexual Behavior - Females 18+ that ever performed oral sex on a man (%)
Sexual Behavior - Females 18+ that ever had anal sex with a man (%)
Sexual Behavior - Females 18+ that ever had any kind of sex with a woman (%)
Sexual Behavior - Average age people first had sex
Sexual Behavior - Average number of female sex partners in lifetime (males 18+)
Sexual Behavior - Average number of female vaginal sex partners in lifetime (males 18+)
Sexual Behavior - Average age people first performed oral sex on a woman (18+)
Sexual Behavior - Average number of woman performed oral sex on in lifetime (18+)
Sexual Behavior - Average number of male sex partners in lifetime (males 18+)
Sexual Behavior - Average number of male anal sex partners in lifetime (males 18+)
Sexual Behavior - Average age people first performed oral sex on a man (18+)
Sexual Behavior - Average number of male oral sex partners in lifetime (18+)
Sexual Behavior - People using protection when performing oral sex (%)
Sexual Behavior - Average number of times people have vaginal or anal sex a year
Sexual Behavior - People having sex without condom (%)
Sexual Behavior - Average number of male sex partners in lifetime (females 18+)
Sexual Behavior - Average number of male vaginal sex partners in lifetime (females 18+)
Sexual Behavior - Average number of female sex partners in lifetime (females 18+)
Sexual Behavior - Circumcised males 18+ (%)
Sleep Disorders - Average hours sleeping at night
Sleep Disorders - People that has trouble sleeping (%)
Smoking-Cigarette Use - People smoking cigarettes (%)
Taste & Smell - People 40+ having problems with smell (%)
Taste & Smell - People 40+ having problems with taste (%)
Taste & Smell - People 40+ that ever had wisdom teeth removed (%)
Taste & Smell - People 40+ that ever had tonsils teeth removed (%)
Taste & Smell - People 40+ that ever had a loss of consciousness because of a head injury (%)
Taste & Smell - People 40+ that ever had a broken nose or other serious injury to face or skull (%)
Taste & Smell - People 40+ that ever had two or more sinus infections (%)
Weight - Average height (inches)
Weight - Average weight (pounds)
Weight - Average BMI
Weight - People that are obese (%)
Weight - People that ever were obese (%)
Weight - People trying to lose weight (%)
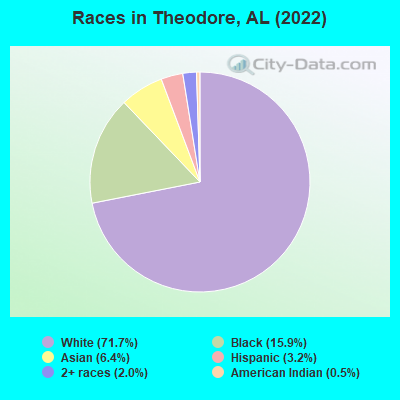
3,651 71.7% White alone 809 15.9% Black alone 326 6.4% Asian alone 163 3.2% Hispanic 104 2.0% Two or more races 25 0.5% American Indian alone
Latest news from Theodore, AL collected exclusively by city-data.com from local newspapers, TV, and radio stations
Ancestries: American (16.2%), Irish (9.5%), English (5.4%), German (3.4%), Italian (3.3%), Welsh (2.7%).
Current Local Time:
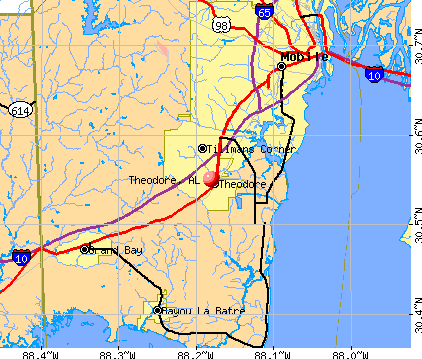
Land area: 11.9 square miles.
Population density: 514 people per square mile (low).
267 residents are foreign born (3.5% Asia , 1.2% Europe ).
This place:
5.2%Alabama:
3.5%
Median real estate property taxes paid for housing units with mortgages in 2022: $668 (0.4%)Median real estate property taxes paid for housing units with no mortgage in 2022: $513 (0.4%)
Nearest city with pop. 50,000+: Tanner-Williams, AL (8.7 miles
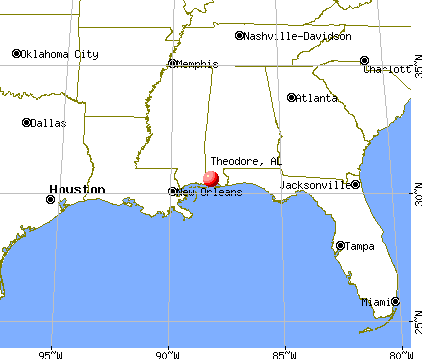
Nearest city with pop. 200,000+: New Orleans, LA
Nearest city with pop. 1,000,000+: Houston, TX
Nearest cities:
Latitude: 30.55 N, Longitude: 88.18 W
Daytime population change due to commuting: -6 (-0.1%)Workers who live and work in this place: 234 (10.5%)
Area code commonly used in this area: 251
Theodore tourist attractions:
Unemployment in December 2023:
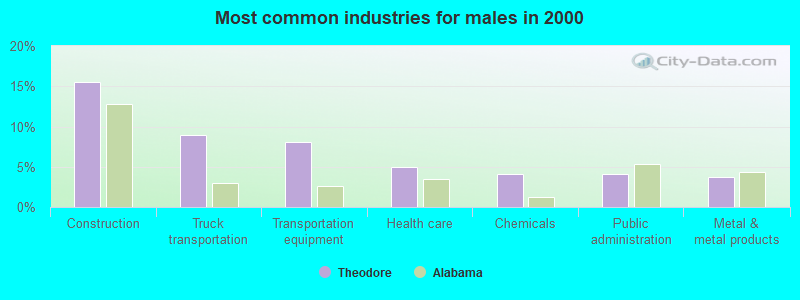
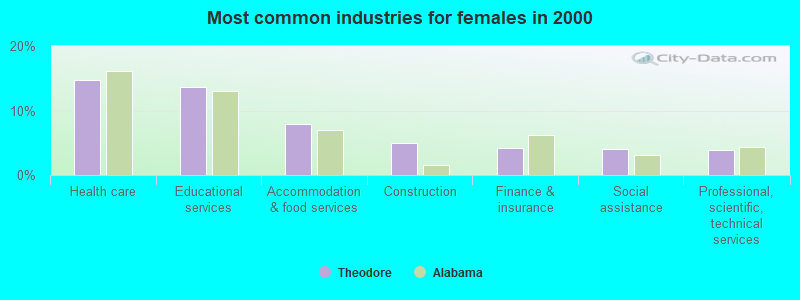
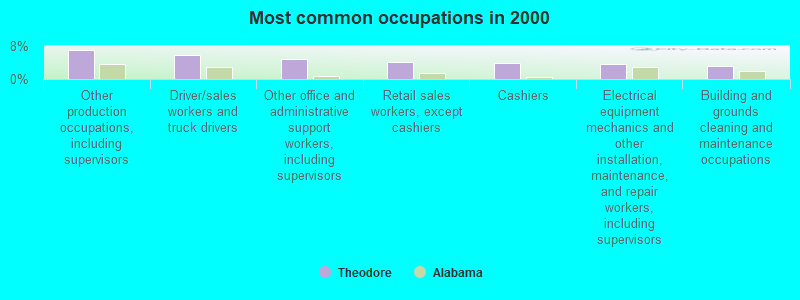
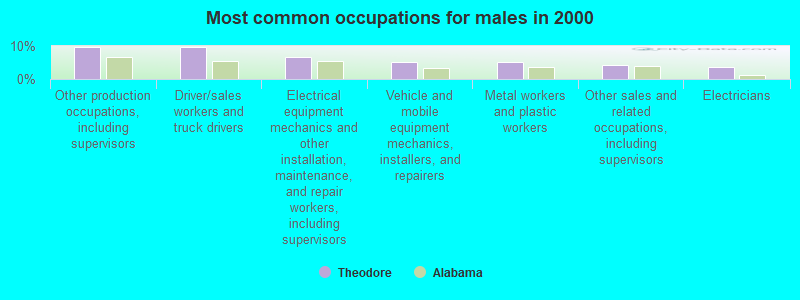
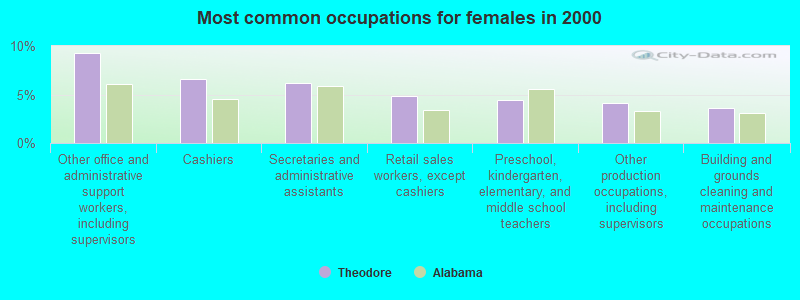
Most common occupations in Theodore, AL (%)
Both Males Females
Other production occupations, including supervisors (7.1%)
Driver/sales workers and truck drivers (5.8%)
Other office and administrative support workers, including supervisors (4.8%)
Retail sales workers, except cashiers (4.1%)
Cashiers (4.0%)
Electrical equipment mechanics and other installation, maintenance, and repair workers, including supervisors (3.7%)
Building and grounds cleaning and maintenance occupations (3.2%)
Other production occupations, including supervisors (9.8%)
Driver/sales workers and truck drivers (9.7%)
Electrical equipment mechanics and other installation, maintenance, and repair workers, including supervisors (6.7%)
Vehicle and mobile equipment mechanics, installers, and repairers (5.1%)
Metal workers and plastic workers (5.1%)
Other sales and related occupations, including supervisors (4.3%)
Electricians (3.6%)
Other office and administrative support workers, including supervisors (9.2%)
Cashiers (6.6%)
Secretaries and administrative assistants (6.2%)
Retail sales workers, except cashiers (4.9%)
Preschool, kindergarten, elementary, and middle school teachers (4.4%)
Other production occupations, including supervisors (4.1%)
Building and grounds cleaning and maintenance occupations (3.6%)
Tornado activity:
Theodore-area historical tornado activity is below Alabama state average. It is 23% greater than the overall U.S. average.
On 4/18/1950, a category F3 (max. wind speeds 158-206 mph) tornado 8.3 miles away from the Theodore place center injured 15 people and caused between $5000 and $50,000 in damages.
On 11/3/1968, a category F3 tornado 15.6 miles away from the place center injured 18 people and caused between $50,000 and $500,000 in damages.
Earthquake activity:
Theodore-area historical earthquake activity is significantly above Alabama state average. It is 58% smaller than the overall U.S. average. On 10/24/1997 at 08:35:17, a magnitude 4.9 (4.8 MB, 4.2 MS, 4.9 LG, Depth: 6.2 mi, Class: Light, Intensity: IV - V) earthquake occurred 66.9 miles away from the city center On 9/10/2006 at 14:56:08, a magnitude 5.9 (5.9 MB, 5.5 MS, 5.8 MW, Class: Moderate, Intensity: VI - VII) earthquake occurred 312.1 miles away from Theodore center On 1/18/1999 at 07:00:53, a magnitude 4.8 (4.8 MB, 4.0 LG, Depth: 0.6 mi) earthquake occurred 204.8 miles away from Theodore center On 5/6/2018 at 16:47:09, a magnitude 4.6 (4.6 MB, Depth: 6.2 mi) earthquake occurred 187.8 miles away from Theodore center On 11/7/2004 at 11:20:21, a magnitude 4.3 (4.3 MW, Depth: 3.1 mi) earthquake occurred 145.9 miles away from the city center On 9/3/2020 at 15:07:53, a magnitude 3.8 (3.8 MW, Depth: 2.5 mi, Class: Light, Intensity: II - III) earthquake occurred 67.2 miles away from the city center Magnitude types: regional Lg-wave magnitude (LG), body-wave magnitude (MB), surface-wave magnitude (MS), moment magnitude (MW) Natural disasters: The number of natural disasters in Mobile County (31) is a lot greater than the US average (15).Major Disasters (Presidential) Declared: 20Emergencies Declared: 7Hurricanes: 18, Floods: 8, Storms: 8, Tornadoes: 6, Winds: 3, Tropical Storms: 2, Drought: 1, Snowfall: 1, Winter Storm: 1, Other: 1 (Note: some incidents may be assigned to more than one category). Hospitals and medical centers near Theodore: INFIRMARY WEST (Hospital, about 5 miles away; MOBILE, AL)
BAYPOINTE BEHAVIORAL HEALTH (Hospital, about 6 miles away; MOBILE, AL)
GORDON OAKS CONVALESCENT CENTER (Nursing Home, about 6 miles away; MOBILE, AL)
LYNWOOD NH (Nursing Home, about 6 miles away; MOBILE, AL)
LYNWOOD NURSING HOME (Nursing Home, about 6 miles away; MOBILE, AL)
DESTINY HOSPICE PALLIATIVE CARE SPECIALTY SERVICES (Hospital, about 7 miles away; MOBILE, AL)
MOBILE NURSING AND REHABILITATION CENTER (Nursing Home, about 8 miles away; MOBILE, AL)
Amtrak station near Theodore: 13 miles: MOBILE (11 GOVERNMENT ST.) Services: ticket office, fully wheelchair accessible, enclosed waiting area, public restrooms, public payphones, paid short-term parking, call for taxi service, public transit connection.
Colleges/universities with over 2000 students nearest to Theodore:
University of South Alabama (about 10 miles; Mobile, AL ; Full-time enrollment: 13,228)
Bishop State Community College (about 13 miles; Mobile, AL ; FT enrollment: 2,822)
James H Faulkner State Community College (about 32 miles; Bay Minette, AL ; FT enrollment: 3,703)
Columbia Southern University (about 35 miles; Orange Beach, AL ; FT enrollment: 14,996)
The University of West Florida (about 58 miles; Pensacola, FL ; FT enrollment: 10,240)
Pensacola State College (about 59 miles; Pensacola, FL ; FT enrollment: 8,740)
Mississippi Gulf Coast Community College (about 60 miles; Perkinston, MS ; FT enrollment: 8,320)
Public high school in Theodore:
Private high schools in Theodore: LIGHTHOUSE BAPTIST ACADEMY Students: 189, Location: 6335 SWEDE COWN RD, Grades: PK-12)
GOOD SHEPHERD ACADEMY Students: 50, Location: 5851 PLANTATION RD, Grades: 1-12)
Public elementary/middle schools in Theodore:
See full list of schools located in Theodore
Notable locations in Theodore: (A) , Iron Works Road Industrial Facility (B) , Burton Pate Industrial Park (C) , Interstate 10 Industrial Parkway Industrial Park (D) , Rite Industrial Park (E) . Display/hide their locations on the map
Shopping Center: (1) . Display/hide its location on the map
Churches in Theodore include: (A) , Evangelist Temple Church (B) , Mount Arrat Church (C) , Good Shepherd Church (D) , Heritage Presbyterian Church (E) , Theodore United Methodist Church (F) , Lighthouse Baptist Church (G) , First Baptist Church of Theodore (H) , Theodore Church of God (I) . Display/hide their locations on the map
Cemetery: (1) . Display/hide its location on the map
Park in Theodore: (1) . Display/hide its location on the map
Tourist attractions:
Hotels:
Birthplace of: Etric Pruitt - 2005 NFL player (Atlanta Falcons, born : Aug 16, 1981), C. J. Mosley (linebacker) - College football player, Willie Quinnie - Player of and football.
Mobile County has a predicted average indoor radon screening level less than 2 pCi/L (pico curies per liter) - Low Potential Drinking water stations with addresses in Theodore and their reported violations in the past:
MOBILE COUNTY WATER & FIRE PRO AUTHORITY (Address: 5780 Theodore Dawes Road Population served: 35,949, Groundwater):
Past monitoring violations:
Monitoring and Reporting (DBP) - Between JAN-2007 and DEC-2007, Contaminant: Total Haloacetic Acids (HAA5). Follow-up actions: St Public Notif requested (FEB-11-2008), St Violation/Reminder Notice (FEB-11-2008), St Compliance achieved (OCT-10-2008)
Monitoring and Reporting (DBP) - Between JAN-2007 and DEC-2007, Contaminant: TTHM. Follow-up actions: St Public Notif requested (FEB-11-2008), St Violation/Reminder Notice (FEB-11-2008), St Compliance achieved (OCT-10-2008)
65 regular monitoring violations
Address: 9002 GREEN VALLEY DRIVE Population served: 4,902, Groundwater):
Past health violations:
MCL, Average - Between APR-2005 and JUN-2005, Contaminant: TTHM. Follow-up actions: St Public Notif requested (JUL-13-2005), St Violation/Reminder Notice (JUL-13-2005), St Compliance achieved (OCT-01-2006)
Past monitoring violations:
Follow-up Or Routine LCR Tap M/R - In OCT-11-2005, Contaminant: Lead and Copper Rule. Follow-up actions: St Public Notif requested (DEC-14-2005), St Violation/Reminder Notice (DEC-14-2005), St Compliance achieved (SEP-06-2008)
Average household size: This place:
2.7 peopleAlabama:
2.5 people
Percentage of family households: This place:
73.3%Whole state:
67.8%
Percentage of households with unmarried partners: This place:
7.4%Whole state:
4.7%
Likely homosexual households (counted as self-reported same-sex unmarried-partner households)
Lesbian couples: 0.7% of all households Gay men: 0.3% of all households
3 people in group homes intended for adults in 2010people in other noninstitutional group quarters in 2000
Banks with branches in Theodore (2011 data):
Bay Bank: Theodore Oaks Branch at 5808 Highway 90 West Suite E, branch established on 2003/09/01; Dauphin Island Parkway Branch at 10861 Dauphin Island Parkway, branch established on 2006/12/31. Info updated 2010/04/07: Bank assets: $86.8 mil, Deposits: $64.7 mil, headquarters in Mobile, AL, positive income , Commercial Lending Specialization, 4 total offices , Holding Company: Bcb Holding Company, Inc.
Regions Bank: Hamilton Blvd Market Branch at 5810 Highway 90, branch established on 1999/05/31. Info updated 2011/02/24: Bank assets: $123,368.2 mil, Deposits: $98,301.3 mil, headquarters in Birmingham, AL, positive income , Commercial Lending Specialization, 1778 total offices , Holding Company: Regions Financial Corporation
Branch Banking and Trust Company: Theodore Branch at 5826 Highway 90, branch established on 1972/11/03. Info updated 2010/03/29: Bank assets: $168,867.6 mil, Deposits: $127,549.5 mil, headquarters in Winston Salem, NC, positive income , Commercial Lending Specialization, 1793 total offices , Holding Company: Bb&T Corporation
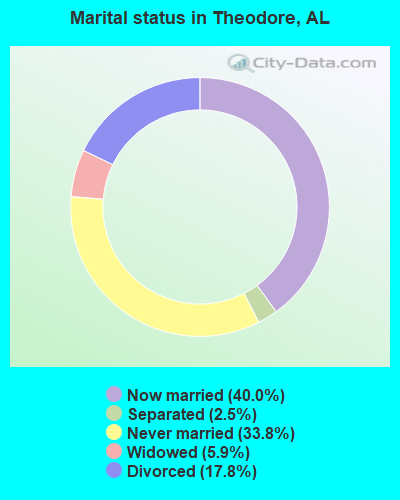
For population 15 years and over in Theodore:
Never married: 33.8%Now married: 40.0%Separated: 2.5%Widowed: 5.9%Divorced: 17.8% For population 25 years and over in Theodore:
High school or higher: 85.3%Bachelor's degree or higher: 14.6%Graduate or professional degree: 4.6%Unemployed: 7.7%Mean travel time to work (commute): 23.5 minutes
Education Gini index (Inequality in education) Here:
8.9Alabama average:
11.5
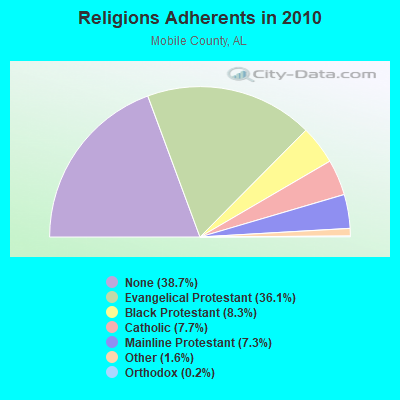
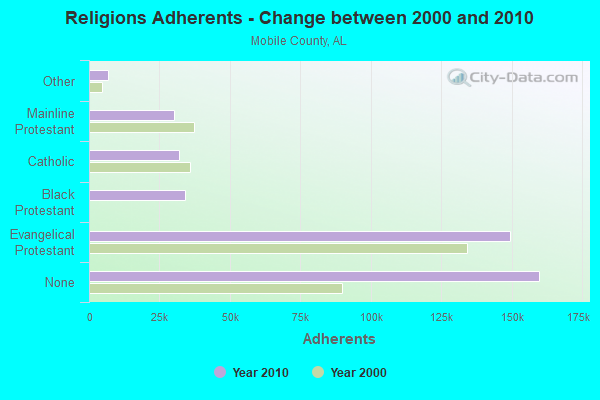
Religion statistics for Theodore, AL (based on Mobile County data)
Religion Adherents Congregations Evangelical Protestant 149,286 354 Black Protestant 34,124 99 Catholic 32,003 35 Mainline Protestant 30,312 79 Other 6,684 30 Orthodox 724 2 None 159,859 -
Source: Clifford Grammich, Kirk Hadaway, Richard Houseal, Dale E.Jones, Alexei Krindatch, Richie Stanley and Richard H.Taylor. 2012. 2010 U.S.Religion Census: Religious Congregations & Membership Study. Association of Statisticians of American Religious Bodies. Jones, Dale E., et al. 2002. Congregations and Membership in the United States 2000. Nashville, TN: Glenmary Research Center. Graphs represent county-level data
Food Environment Statistics: Number of grocery stores : 61Here :
1.51 / 10,000 pop.Alabama :
1.89 / 10,000 pop.
Number of supercenters and club stores : 6Mobile County :
0.15 / 10,000 pop.State :
0.20 / 10,000 pop.
Number of convenience stores (no gas) : 18This county :
0.45 / 10,000 pop.State :
0.65 / 10,000 pop.
Number of convenience stores (with gas) : 246Mobile County :
6.09 / 10,000 pop.Alabama :
6.32 / 10,000 pop.
Number of full-service restaurants : 211This county :
5.22 / 10,000 pop.Alabama :
5.75 / 10,000 pop.
Adult diabetes rate : Mobile County :
11.8%State :
11.8%
Adult obesity rate : Mobile County :
29.9%Alabama :
31.7%
Low-income preschool obesity rate : Health and Nutrition:
Average overall health of teeth and gums : Theodore:
45.4%Alabama:
45.7%
Average BMI : Theodore:
28.9Alabama:
28.9
People feeling badly about themselves : People not drinking alcohol at all : Theodore:
12.2%Alabama:
11.0%
Average hours sleeping at night : Overweight people : Theodore:
34.6%Alabama:
34.4%
General health condition : Theodore:
55.4%Alabama:
55.2%
Average condition of hearing : This city:
79.5%State:
79.3%
More about Health and Nutrition of Theodore, AL Residents
4.11% of this county's 2021 resident taxpayers lived in other counties in 2020 ($52,985 average adjusted gross income )
Here:
4.11%Alabama average:
6.87%
0.01% of residents moved from foreign countries ($193 average AGI )Mobile County:
0.01%Alabama average:
0.02%
Top counties from which taxpayers relocated into this county between 2020 and 2021:
Businesses in Theodore, AL
Name Count Name Count
Advance Auto Parts 2 Hardee's 1 Burger King 1 Lane Furniture 1 Church's Chicken 1 MasterBrand Cabinets 1 Circle K 1 McDonald's 2 Curves 1 Rite Aid 1 DHL 1 Subway 2 FedEx 5 U-Haul 4 GNC 1 UPS 3 GameStop 1 Waffle House 2
Strongest AM radio stations in Theodore:
WNTM (710 AM; 10 kW; MOBILE, AL; Owner: CLEAR CHANNEL BROADCASTING LICENSES, INC.)
WBHY (840 AM; daytime; 10 kW; MOBILE, AL; Owner: GOFORTH MEDIA, INC.)
WDLT (660 AM; 10 kW; FAIRHOPE, AL; Owner: CUMULUS LICENSING CORP.)
WLPR (960 AM; 5 kW; PRICHARD, AL; Owner: GOFORTH MEDIA, INC.)
WMOB (1360 AM; 5 kW; MOBILE, AL; Owner: BUDDY TUCKER ASSOCIATION, INC.)
WABB (1480 AM; 5 kW; MOBILE, AL; Owner: WABB-FM, INC.)
WKSJ (1270 AM; 5 kW; PRICHARD, AL; Owner: CLEAR CHANNEL BROADCASTING LICENSES, INC.)
WASG (550 AM; 25 kW; ATMORE, AL; Owner: 550 AM, INC)
WLVV (1410 AM; 5 kW; MOBILE, AL; Owner: WLVV, INC.)
WBCA (1110 AM; daytime; 10 kW; BAY MINETTE, AL; Owner: SOUTHERN MEDIA COMMUNICATIONS, INC)
WGOK (900 AM; 1 kW; MOBILE, AL; Owner: CUMULUS LICENSING CORP.)
WZZJ (1580 AM; 5 kW; PASCAGOULA-MOSS POIN, MS; Owner: JUDAH BROADASTING NETWORK, INC.)
WEBY (1330 AM; 25 kW; MILTON, FL; Owner: SPINNAKER LICENSE CORPORATION)
Strongest FM radio stations in Theodore:
WRKH (96.1 FM; MOBILE, AL; Owner: CLEAR CHANNEL BROADCASTING LICENSES, INC.)
WMXC (99.9 FM; MOBILE, AL; Owner: CLEAR CHANNEL BROADCASTING LICENSES, INC.)
WABB-FM (97.5 FM; MOBILE, AL; Owner: WABB-FM, INC.)
WDLT-FM (98.3 FM; CHICKASAW, AL; Owner: CUMULUS LICENSING CORP.)
WHIL-FM (91.3 FM; MOBILE, AL; Owner: SPRING HILL COLLEGE)
WJLQ (100.7 FM; PENSACOLA, FL; Owner: CUMULUS LICENSING CORP.)
WBLX-FM (92.9 FM; MOBILE, AL; Owner: CUMULUS LICENSING CORP.)
WYOK (104.1 FM; ATMORE, AL; Owner: CUMULUS LICENSING CORP.)
WZEW (92.1 FM; FAIRHOPE, AL; Owner: BALDWIN BROADCASTING COMPANY, DEBTOR IN POSSESSION)
WBHY-FM (88.5 FM; MOBILE, AL; Owner: GOFORTH MEDIA, INC.)
WMEZ (94.1 FM; PENSACOLA, FL; Owner: 6 JOHNSON ROAD LICENSES, INC.)
WKSJ-FM (94.9 FM; MOBILE, AL; Owner: CLEAR CHANNEL BROADCASTING LICENSES, INC.)
WOSM (103.1 FM; OCEAN SPRINGS, MS; Owner: CHARLES H. COOPER)
WPCS (89.5 FM; PENSACOLA, FL; Owner: PENSACOLA CHRISTIAN COLLEGE, INC)
WKNN-FM (99.1 FM; PASCAGOULA, MS; Owner: CHASE RADIO PROPERTIES, L.L.C.)
WMJY (93.7 FM; BILOXI, MS; Owner: CHASE RADIO PROPERTIES, L.L.C.)
WBUV (104.9 FM; MOSS POINT, MS; Owner: CLEAR CHANNEL BROADCASTING LICENSES, INC.)
WYCL (107.3 FM; PENSACOLA, FL; Owner: CONCORD MEDIA GROUP, INC.)
WMAH-FM (90.3 FM; BILOXI, MS; Owner: MISSISSIPPI AUTHORITY FOR EDUCATIONAL TV)
WAVH (106.5 FM; DAPHNE, AL; Owner: BALDWIN BROADCASTING COMPANY, DEBTOR IN POSSESSION)
TV broadcast stations around Theodore:
WRBM-LP (Channel 60; PRICHARD, AL; Owner: UPPER GULF COAST, L.L.C.)
WKRG-TV (Channel 5; MOBILE, AL; Owner: MEDIA GENERAL BROADCASTING OF SOUTH CAROLINA HOLDINGS, INC.)
WEAR-TV (Channel 3; PENSACOLA, FL; Owner: WEAR LICENSEE, LLC)
WMPV-TV (Channel 21; MOBILE, AL; Owner: TRINITY BROADCASTING NETWORK)
WPMI (Channel 15; MOBILE, AL; Owner: CLEAR CHANNEL BROADCASTING LICENSES, INC.)
WALA-TV (Channel 10; MOBILE, AL; Owner: EMMIS TELEVISION LICENSE CORPORATION)
WJTC (Channel 44; PENSACOLA, FL; Owner: CLEAR CHANNEL BROADCASTING LICENSES, INC.)
W52BF (Channel 52; MOBILE, AL; Owner: VENTANA TELEVISION, INC.)
WHBR (Channel 33; PENSACOLA, FL; Owner: CHRISTIAN TELEVISION OF PENSACOLA/MOBILE, INC.)
WEIQ (Channel 42; MOBILE, AL; Owner: ALABAMA EDUCATIONAL TELEVISION COMMISSION)
WBPG (Channel 55; GULF SHORES, AL; Owner: EMMIS TELEVISION LICENSE CORPORATION)
WSRE (Channel 23; PENSACOLA, FL; Owner: DST .BD. OF TRUSTEES PENSACOLA JR. COLLEGE)
WMAH-TV (Channel 19; BILOXI, MS; Owner: MISSISSIPPI AUTHORITY FOR EDUCATIONAL TELEVISION)
WMOE-LP (Channel 12; MOBILE, AL; Owner: TIGER EYE BROADCASTING CORPORATION)
W50CF (Channel 50; MOBILE, AL; Owner: FRANKLIN MEDIA, INC.)
National Bridge Inventory (NBI) Statistics 30 Number of bridges262ft / 80.1m Total length $37,449,000 Total costs272,886 Total average daily traffic33,840 Total average daily truck traffic
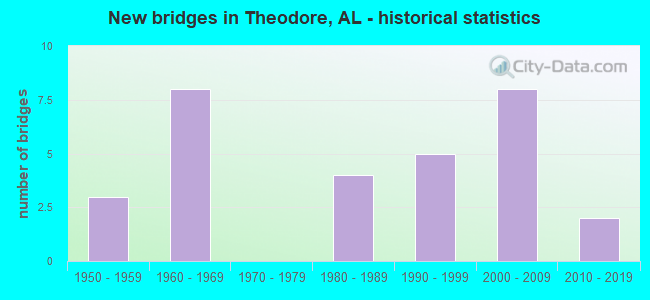
New bridges - historical statistics
3 1950-1959 8 1960-1969 4 1980-1989 5 1990-1999 8 2000-2009 2 2010-2019
See full National Bridge Inventory statistics for Theodore, AL
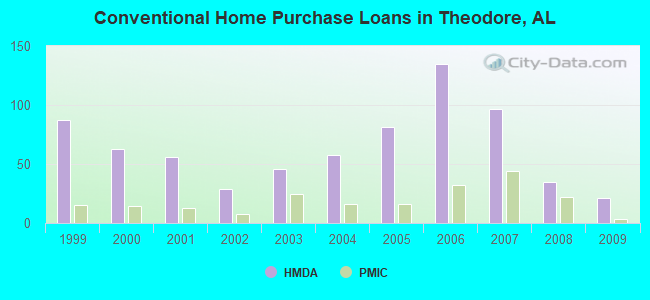
Home Mortgage Disclosure Act Aggregated Statistics For Year 2009(Based on 1 full and 1 partial tracts) A) FHA, FSA/RHS & VA B) Conventional C) Refinancings D) Home Improvement Loans F) Non-occupant Loans on G) Loans On Manufactured Number Average Value Number Average Value Number Average Value Number Average Value Number Average Value Number Average Value
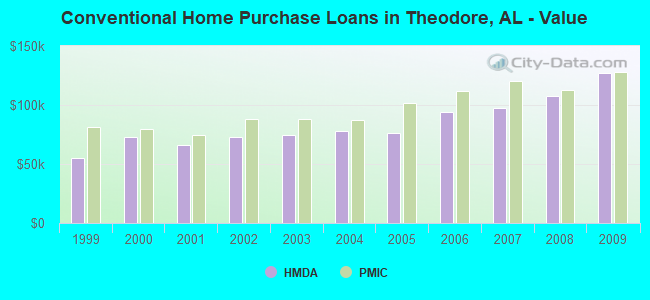
LOANS ORIGINATED 43 $118,781 21 $126,803 85 $114,398 7 $55,434 6 $97,892 1 $56,300 APPLICATIONS APPROVED, NOT ACCEPTED 3 $68,610 1 $345,690 10 $115,368 0 $0 0 $0 1 $44,750 APPLICATIONS DENIED 5 $100,318 6 $74,050 50 $102,173 10 $30,112 1 $42,940 3 $28,973 APPLICATIONS WITHDRAWN 4 $112,915 0 $0 36 $118,814 2 $63,705 0 $0 0 $0 FILES CLOSED FOR INCOMPLETENESS 2 $138,860 0 $0 13 $129,202 0 $0 0 $0 0 $0
Aggregated Statistics For Year 2008(Based on 1 full and 1 partial tracts) A) FHA, FSA/RHS & VA B) Conventional C) Refinancings D) Home Improvement Loans E) Loans on Dwellings For 5+ Families F) Non-occupant Loans on G) Loans On Manufactured Number Average Value Number Average Value Number Average Value Number Average Value Number Average Value Number Average Value Number Average Value
LOANS ORIGINATED 52 $115,843 35 $107,739 85 $104,106 12 $44,702 1 $1,301,790 14 $87,504 7 $35,166 APPLICATIONS APPROVED, NOT ACCEPTED 4 $97,535 5 $92,162 13 $114,817 3 $34,143 0 $0 0 $0 3 $58,127 APPLICATIONS DENIED 5 $104,336 17 $106,888 76 $115,169 18 $66,114 0 $0 3 $181,943 9 $40,851 APPLICATIONS WITHDRAWN 4 $132,910 3 $118,853 17 $107,276 3 $60,250 0 $0 1 $140,460 1 $9,880 FILES CLOSED FOR INCOMPLETENESS 2 $92,350 2 $65,860 11 $124,866 1 $94,820 0 $0 0 $0 0 $0
Aggregated Statistics For Year 2007(Based on 1 full and 1 partial tracts) A) FHA, FSA/RHS & VA B) Conventional C) Refinancings D) Home Improvement Loans F) Non-occupant Loans on G) Loans On Manufactured Number Average Value Number Average Value Number Average Value Number Average Value Number Average Value Number Average Value
LOANS ORIGINATED 40 $117,962 97 $97,869 92 $93,405 12 $47,444 18 $77,030 4 $18,340 APPLICATIONS APPROVED, NOT ACCEPTED 1 $176,800 12 $93,480 16 $91,178 3 $54,950 4 $116,055 3 $72,160 APPLICATIONS DENIED 6 $110,942 29 $99,584 85 $93,942 22 $60,519 2 $146,480 10 $45,091 APPLICATIONS WITHDRAWN 3 $127,413 15 $142,215 29 $99,409 4 $63,228 2 $125,440 0 $0 FILES CLOSED FOR INCOMPLETENESS 0 $0 8 $102,186 15 $99,151 0 $0 0 $0 0 $0
Aggregated Statistics For Year 2006(Based on 1 full and 1 partial tracts) A) FHA, FSA/RHS & VA B) Conventional C) Refinancings D) Home Improvement Loans F) Non-occupant Loans on G) Loans On Manufactured Number Average Value Number Average Value Number Average Value Number Average Value Number Average Value Number Average Value
LOANS ORIGINATED 24 $118,202 135 $93,665 103 $89,365 19 $38,002 23 $88,047 6 $51,343 APPLICATIONS APPROVED, NOT ACCEPTED 1 $116,550 18 $96,833 22 $74,833 4 $29,898 2 $131,920 3 $33,260 APPLICATIONS DENIED 2 $68,955 34 $72,996 81 $89,146 22 $32,129 6 $100,363 10 $34,975 APPLICATIONS WITHDRAWN 0 $0 22 $108,628 52 $92,889 6 $59,980 1 $125,080 0 $0 FILES CLOSED FOR INCOMPLETENESS 1 $82,990 6 $97,750 21 $95,679 0 $0 1 $55,320 0 $0
Aggregated Statistics For Year 2005(Based on 1 full and 1 partial tracts) A) FHA, FSA/RHS & VA B) Conventional C) Refinancings D) Home Improvement Loans F) Non-occupant Loans on G) Loans On Manufactured Number Average Value Number Average Value Number Average Value Number Average Value Number Average Value Number Average Value
LOANS ORIGINATED 22 $100,445 81 $76,309 78 $77,976 12 $37,141 17 $55,818 3 $14,780 APPLICATIONS APPROVED, NOT ACCEPTED 0 $0 19 $71,311 24 $100,638 2 $61,410 0 $0 3 $54,193 APPLICATIONS DENIED 8 $97,852 31 $54,434 96 $83,511 20 $29,050 4 $52,248 17 $33,210 APPLICATIONS WITHDRAWN 0 $0 10 $93,684 54 $105,309 7 $137,094 0 $0 3 $83,560 FILES CLOSED FOR INCOMPLETENESS 1 $94,820 5 $87,330 13 $82,153 0 $0 0 $0 1 $75,070
Aggregated Statistics For Year 2004(Based on 1 full and 1 partial tracts) A) FHA, FSA/RHS & VA B) Conventional C) Refinancings D) Home Improvement Loans F) Non-occupant Loans on G) Loans On Manufactured Number Average Value Number Average Value Number Average Value Number Average Value Number Average Value Number Average Value
LOANS ORIGINATED 39 $93,181 58 $78,096 95 $78,593 10 $46,661 8 $61,822 10 $47,596 APPLICATIONS APPROVED, NOT ACCEPTED 0 $0 8 $69,144 40 $71,820 2 $24,910 2 $65,935 2 $43,190 APPLICATIONS DENIED 5 $62,846 31 $70,452 108 $81,269 20 $23,803 10 $48,397 16 $49,956 APPLICATIONS WITHDRAWN 1 $122,470 13 $92,517 103 $90,483 1 $16,790 3 $132,953 0 $0 FILES CLOSED FOR INCOMPLETENESS 0 $0 2 $107,835 22 $111,028 1 $96,790 2 $48,890 0 $0
Aggregated Statistics For Year 2003(Based on 1 full and 1 partial tracts) A) FHA, FSA/RHS & VA B) Conventional C) Refinancings D) Home Improvement Loans F) Non-occupant Loans on Number Average Value Number Average Value Number Average Value Number Average Value Number Average Value
LOANS ORIGINATED 35 $91,190 46 $74,393 186 $75,636 9 $34,811 17 $56,611 APPLICATIONS APPROVED, NOT ACCEPTED 0 $0 11 $112,569 37 $81,469 2 $29,630 2 $64,860 APPLICATIONS DENIED 4 $90,128 15 $50,203 89 $88,033 11 $24,680 2 $53,405 APPLICATIONS WITHDRAWN 6 $80,498 6 $78,600 74 $92,490 1 $82,590 3 $39,507 FILES CLOSED FOR INCOMPLETENESS 0 $0 4 $78,418 21 $81,880 1 $93,830 0 $0
Aggregated Statistics For Year 2002(Based on 1 full and 1 partial tracts) A) FHA, FSA/RHS & VA B) Conventional C) Refinancings D) Home Improvement Loans F) Non-occupant Loans on Number Average Value Number Average Value Number Average Value Number Average Value Number Average Value
LOANS ORIGINATED 52 $88,452 29 $72,594 117 $77,493 7 $16,791 8 $109,000 APPLICATIONS APPROVED, NOT ACCEPTED 0 $0 15 $74,339 38 $70,196 1 $15,860 3 $103,050 APPLICATIONS DENIED 4 $86,405 21 $40,762 72 $67,616 15 $13,359 3 $17,880 APPLICATIONS WITHDRAWN 2 $111,455 7 $77,714 23 $74,946 0 $0 3 $54,323 FILES CLOSED FOR INCOMPLETENESS 0 $0 6 $57,370 21 $72,854 0 $0 0 $0
Aggregated Statistics For Year 2001(Based on 1 full and 1 partial tracts) A) FHA, FSA/RHS & VA B) Conventional C) Refinancings D) Home Improvement Loans F) Non-occupant Loans on Number Average Value Number Average Value Number Average Value Number Average Value Number Average Value
LOANS ORIGINATED 50 $81,804 56 $65,935 91 $73,957 13 $15,542 11 $53,900 APPLICATIONS APPROVED, NOT ACCEPTED 2 $48,330 8 $30,766 14 $54,934 0 $0 0 $0 APPLICATIONS DENIED 5 $66,954 47 $43,807 59 $69,119 8 $6,360 2 $41,570 APPLICATIONS WITHDRAWN 8 $81,521 8 $80,824 32 $64,222 1 $28,060 3 $42,800 FILES CLOSED FOR INCOMPLETENESS 1 $81,980 2 $97,290 13 $79,618 0 $0 1 $78,320
Aggregated Statistics For Year 2000(Based on 1 full and 1 partial tracts) A) FHA, FSA/RHS & VA B) Conventional C) Refinancings D) Home Improvement Loans F) Non-occupant Loans on Number Average Value Number Average Value Number Average Value Number Average Value Number Average Value
LOANS ORIGINATED 45 $81,917 63 $72,670 41 $54,604 21 $10,989 7 $69,074 APPLICATIONS APPROVED, NOT ACCEPTED 9 $56,662 21 $64,500 12 $67,197 2 $44,410 1 $93,330 APPLICATIONS DENIED 8 $69,958 94 $36,386 36 $64,108 16 $9,956 5 $34,094 APPLICATIONS WITHDRAWN 4 $83,065 7 $60,657 19 $76,219 1 $9,880 1 $67,450 FILES CLOSED FOR INCOMPLETENESS 1 $71,490 0 $0 22 $54,799 0 $0 0 $0
Aggregated Statistics For Year 1999(Based on 1 full and 1 partial tracts) A) FHA, FSA/RHS & VA B) Conventional C) Refinancings D) Home Improvement Loans F) Non-occupant Loans on Number Average Value Number Average Value Number Average Value Number Average Value Number Average Value
LOANS ORIGINATED 46 $80,714 87 $54,773 68 $50,557 22 $9,286 6 $29,508 APPLICATIONS APPROVED, NOT ACCEPTED 0 $0 23 $39,240 12 $54,815 1 $11,110 0 $0 APPLICATIONS DENIED 6 $90,530 101 $35,931 40 $60,118 12 $7,253 2 $52,840 APPLICATIONS WITHDRAWN 4 $89,018 19 $48,414 15 $63,891 2 $17,335 1 $45,570 FILES CLOSED FOR INCOMPLETENESS 0 $0 6 $69,837 9 $78,084 0 $0 0 $0
Detailed HMDA statistics for the following Tracts:
0071.01
, 0071.02
Private Mortgage Insurance Companies Aggregated Statistics For Year 2009(Based on 1 full and 1 partial tracts) A) Conventional B) Refinancings Number Average Value Number Average Value
LOANS ORIGINATED 3 $127,820 5 $122,474 APPLICATIONS APPROVED, NOT ACCEPTED 1 $307,170 2 $102,720 APPLICATIONS DENIED 0 $0 0 $0 APPLICATIONS WITHDRAWN 0 $0 1 $95,810 FILES CLOSED FOR INCOMPLETENESS 0 $0 0 $0
Aggregated Statistics For Year 2008(Based on 1 full and 1 partial tracts) A) Conventional B) Refinancings C) Non-occupant Loans on Number Average Value Number Average Value Number Average Value
LOANS ORIGINATED 22 $112,890 6 $122,315 3 $117,050 APPLICATIONS APPROVED, NOT ACCEPTED 8 $124,811 3 $132,740 0 $0 APPLICATIONS DENIED 2 $145,370 1 $89,880 1 $141,600 APPLICATIONS WITHDRAWN 1 $147,170 1 $174,070 0 $0 FILES CLOSED FOR INCOMPLETENESS 0 $0 0 $0 0 $0
Aggregated Statistics For Year 2007(Based on 1 full and 1 partial tracts) A) Conventional B) Refinancings Number Average Value Number Average Value
LOANS ORIGINATED 44 $120,222 8 $104,275 APPLICATIONS APPROVED, NOT ACCEPTED 1 $198,180 3 $114,463 APPLICATIONS DENIED 1 $107,660 1 $126,430 APPLICATIONS WITHDRAWN 2 $98,815 1 $105,680 FILES CLOSED FOR INCOMPLETENESS 0 $0 0 $0
Aggregated Statistics For Year 2006(Based on 1 full and 1 partial tracts) A) Conventional B) Refinancings C) Non-occupant Loans on Number Average Value Number Average Value Number Average Value
LOANS ORIGINATED 32 $111,453 8 $99,236 2 $74,570 APPLICATIONS APPROVED, NOT ACCEPTED 2 $67,955 2 $53,830 2 $52,505 APPLICATIONS DENIED 0 $0 0 $0 0 $0 APPLICATIONS WITHDRAWN 2 $139,260 0 $0 0 $0 FILES CLOSED FOR INCOMPLETENESS 0 $0 0 $0 0 $0
Aggregated Statistics For Year 2005(Based on 1 full and 1 partial tracts) A) Conventional B) Refinancings C) Non-occupant Loans on Number Average Value Number Average Value Number Average Value
LOANS ORIGINATED 16 $101,495 7 $81,857 3 $82,307 APPLICATIONS APPROVED, NOT ACCEPTED 0 $0 5 $82,446 1 $41,290 APPLICATIONS DENIED 0 $0 0 $0 0 $0 APPLICATIONS WITHDRAWN 0 $0 1 $74,080 0 $0 FILES CLOSED FOR INCOMPLETENESS 0 $0 1 $213,340 0 $0
Aggregated Statistics For Year 2004(Based on 1 full and 1 partial tracts) A) Conventional B) Refinancings C) Non-occupant Loans on Number Average Value Number Average Value Number Average Value
LOANS ORIGINATED 16 $87,655 13 $86,008 2 $88,345 APPLICATIONS APPROVED, NOT ACCEPTED 2 $96,210 1 $60,250 1 $60,250 APPLICATIONS DENIED 0 $0 0 $0 0 $0 APPLICATIONS WITHDRAWN 1 $71,110 2 $101,685 0 $0 FILES CLOSED FOR INCOMPLETENESS 0 $0 0 $0 0 $0
Aggregated Statistics For Year 2003(Based on 1 full and 1 partial tracts) A) Conventional B) Refinancings C) Non-occupant Loans on Number Average Value Number Average Value Number Average Value
LOANS ORIGINATED 25 $87,815 32 $84,842 5 $77,936 APPLICATIONS APPROVED, NOT ACCEPTED 7 $87,544 6 $91,642 0 $0 APPLICATIONS DENIED 0 $0 0 $0 0 $0 APPLICATIONS WITHDRAWN 0 $0 6 $99,997 0 $0 FILES CLOSED FOR INCOMPLETENESS 0 $0 0 $0 0 $0
Aggregated Statistics For Year 2002(Based on 1 full and 1 partial tracts) A) Conventional B) Refinancings C) Non-occupant Loans on Number Average Value Number Average Value Number Average Value
LOANS ORIGINATED 8 $88,129 23 $83,312 3 $76,383 APPLICATIONS APPROVED, NOT ACCEPTED 2 $127,905 3 $85,270 1 $131,360 APPLICATIONS DENIED 0 $0 3 $77,370 0 $0 APPLICATIONS WITHDRAWN 1 $56,300 4 $77,288 0 $0 FILES CLOSED FOR INCOMPLETENESS 0 $0 0 $0 0 $0
Aggregated Statistics For Year 2001(Based on 1 full and 1 partial tracts) A) Conventional B) Refinancings C) Non-occupant Loans on Number Average Value Number Average Value Number Average Value
LOANS ORIGINATED 13 $74,363 15 $78,192 2 $63,420 APPLICATIONS APPROVED, NOT ACCEPTED 1 $72,960 1 $145,930 0 $0 APPLICATIONS DENIED 0 $0 4 $72,020 1 $78,160 APPLICATIONS WITHDRAWN 0 $0 0 $0 0 $0 FILES CLOSED FOR INCOMPLETENESS 0 $0 0 $0 0 $0
Aggregated Statistics For Year 2000(Based on 1 full and 1 partial tracts) A) Conventional B) Refinancings C) Non-occupant Loans on Number Average Value Number Average Value Number Average Value
LOANS ORIGINATED 14 $79,843 2 $84,125 1 $88,890 APPLICATIONS APPROVED, NOT ACCEPTED 0 $0 1 $49,380 0 $0 APPLICATIONS DENIED 1 $153,590 2 $111,335 0 $0 APPLICATIONS WITHDRAWN 0 $0 0 $0 0 $0 FILES CLOSED FOR INCOMPLETENESS 0 $0 0 $0 0 $0
Aggregated Statistics For Year 1999(Based on 1 full and 1 partial tracts) A) Conventional B) Refinancings Number Average Value Number Average Value
LOANS ORIGINATED 15 $81,581 6 $80,092 APPLICATIONS APPROVED, NOT ACCEPTED 2 $78,755 1 $58,450 APPLICATIONS DENIED 0 $0 0 $0 APPLICATIONS WITHDRAWN 0 $0 0 $0 FILES CLOSED FOR INCOMPLETENESS 0 $0 0 $0
Detailed PMIC statistics for the following Tracts:
0071.01
, 0071.02
Most common first names in Theodore, AL among deceased individuals Name Count Lived (average)
James 119 69.6 years William 119 72.5 years John 97 70.4 years Mary 91 75.3 years Charles 70 70.1 years Robert 66 72.6 years Thomas 53 64.6 years George 47 69.6 years Joseph 37 68.7 years Dorothy 36 73.0 years
Most common last names in Theodore, AL among deceased individuals Last name Count Lived (average)
Williams 76 71.7 years Smith 55 72.1 years Davis 33 72.2 years Miller 29 67.6 years Johnson 28 68.6 years Brown 28 73.3 years Thompson 26 73.2 years Jones 26 69.2 years Harris 23 74.3 years Walker 22 66.9 years
Theodore compared to Alabama state average:
Unemployed percentage below state average. Black race population percentage below state average. Hispanic race population percentage below state average. Median age significantly below state average. Length of stay since moving in significantly above state average.
Top Patent Applicants
Takeshi Kamei (6)
Harald Van Bracht (5)
Laura Prine (3)
Rick Deckbar (2)
Matthias Colomb (2)
Rodney Paul Rocconi (1)
Jean-Jacques Delisle (1)
Christopher Cook (1)
Mitsubishi Polycrystalline Silicon America Corporation (mipsa) (1)
Bryan Nettles (1)
Total of 22 patent applications in 2008-2024.


 Recent articles from our blog. Our writers, many of them Ph.D. graduates or candidates, create easy-to-read articles on a wide variety of topics.

 , pop. 59,443).


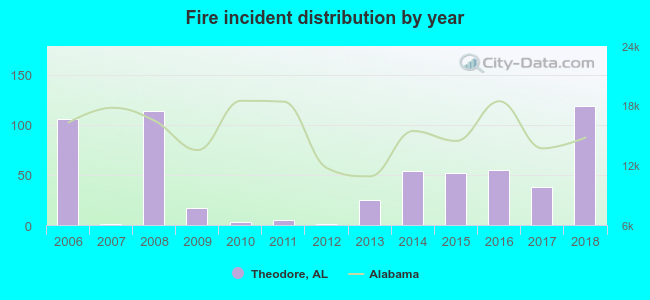 Based on the data from the years 2006 - 2018 the average number of fires per year is 45. The highest number of reported fire incidents - 119 took place in 2018, and the least - 1 in 2007. The data has a growing trend.
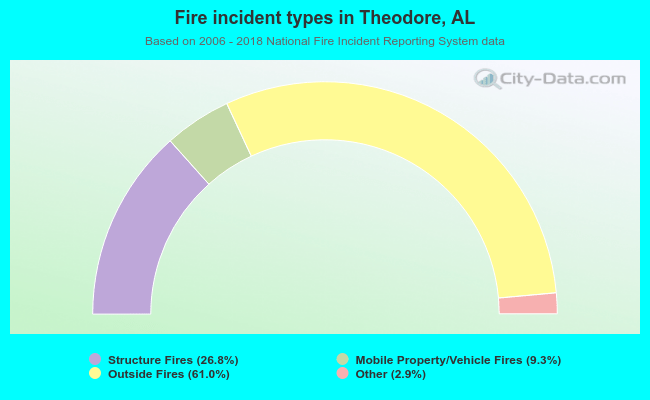 When looking into fire subcategories, the most incidents belonged to: Outside Fires (61.0%), and Structure Fires (26.8%).