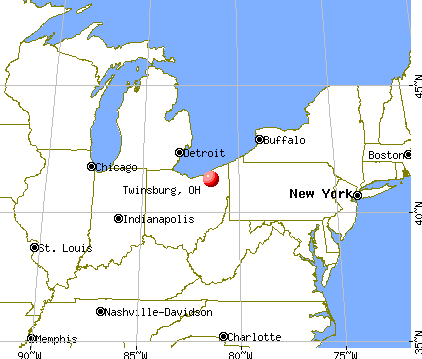
Twinsburg, Ohio

Twinsburg: Head size mushroom found in woods

Twinsburg: Twinsburg Post Office
Twinsburg: High way 271 to Twinsburg 91

Twinsburg: duck by the lake
- add
your
Submit your own pictures of this city and show them to the world
- OSM Map
- General Map
- Google Map
- MSN Map
Population change since 2000: +14.2%
 |
| Males: 9,195 | |
| Females: 10,221 |
| Median resident age: | 44.0 years |
| Ohio median age: | 39.9 years |
Zip codes: 44087.
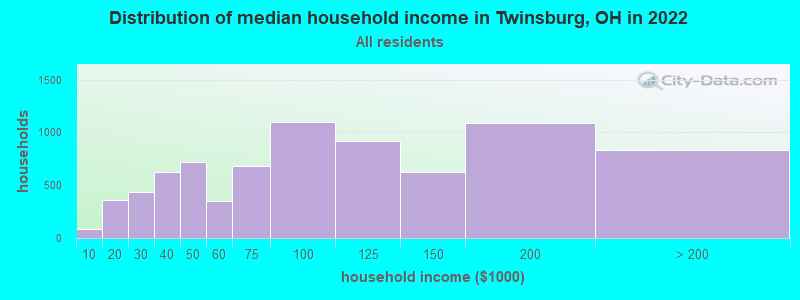
| Twinsburg: | $88,076 |
| OH: | $65,720 |
Estimated per capita income in 2022: $50,183 (it was $27,708 in 2000)
Twinsburg city income, earnings, and wages data
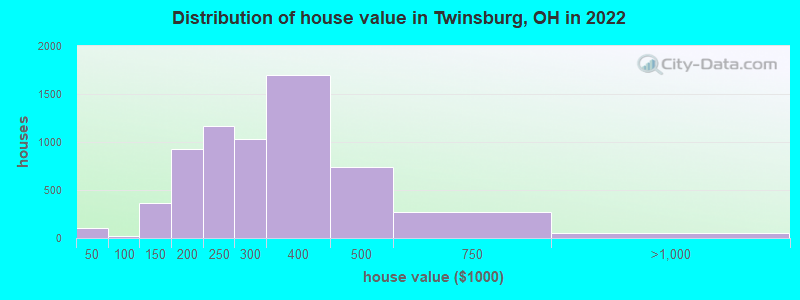
Estimated median house or condo value in 2022: $292,382 (it was $168,500 in 2000)
| Twinsburg: | $292,382 |
| OH: | $204,100 |
Mean prices in 2022: all housing units: $313,284; detached houses: $336,828; townhouses or other attached units: $182,106; in 5-or-more-unit structures: $121,534
Median gross rent in 2022: $1,175.
(3.0% for White Non-Hispanic residents, 2.4% for Black residents, 7.1% for Hispanic or Latino residents, 15.3% for two or more races residents)
Detailed information about poverty and poor residents in Twinsburg, OH

Compare current foreclosures in Twinsburg, OH:
| Photo | Address | Area | Beds / Baths | Price | Details |
|---|---|---|---|---|---|

|
#1
E Cobblestone Ln
Twinsburg, OH 44087
|
1,814 sq. feet
|
2 baths 3 beds |
show details | |

|
#2
Iris Glen Dr
Twinsburg, OH 44087
|
1,332 sq. feet
|
2 baths 2 beds |
show details | |

|
#3
Sherwin Dr
Twinsburg, OH 44087
|
1,487 sq. feet
|
1 baths 3 beds |
show details | |

|
#4
Parkland Dr
Twinsburg, OH 44087
|
2,556 sq. feet
|
2 baths 4 beds |
show details | |

|
#5
Ridgewood Dr
Twinsburg, OH 44087
|
2,482 sq. feet
|
2 baths 4 beds |
show details | |

|
#6
Ravenna Rd
Twinsburg, OH 44087
|
1,520 sq. feet
|
1 baths 4 beds |
show details | |

|
#7
Briardale Ct
Twinsburg, OH 44087
|
1,541 sq. feet
|
1 baths 4 beds |
show details | |

|
#8
Cambridge St
Twinsburg, OH 44087
|
1,008 sq. feet
|
1 baths 3 beds |
show details | |

|
#9
Burridge Cir
Twinsburg, OH 44087
|
1,466 sq. feet
|
2 baths 3 beds |
show details | |

|
#10
Demi Dr
Twinsburg, OH 44087
|
2,154 sq. feet
|
2 baths 3 beds |
show details |
| Photo | Address | Area | Beds / Baths | Price | Details |
|---|---|---|---|---|---|

|
#11
Sandalwood Ln
Twinsburg, OH 44087
|
2,188 sq. feet
|
2 baths 3 beds |
show details | |

|
#12
Post Rd
Twinsburg, OH 44087
|
1,072 sq. feet
|
1 baths 3 beds |
show details | |

|
#13
Case St
Twinsburg, OH 44087
|
1,056 sq. feet
|
1 baths 3 beds |
show details | |

|
#14
Ashcroft Ln
Twinsburg, OH 44087
|
3,428 sq. feet
|
2 baths 4 beds |
show details | |

|
#15
Glenwood Dr
Twinsburg, OH 44087
|
1,092 sq. feet
|
1 baths 3 beds |
show details | |

|
#16
Dayflower Dr
Twinsburg, OH 44087
|
2,433 sq. feet
|
2 baths 4 beds |
show details | |

|
#17
Ray Ct
Twinsburg, OH 44087
|
- sq. feet
|
- baths - beds |
show details | |

|
#18
Americana Drive, Apt 304
Twinsburg, OH 44087
|
- sq. feet
|
- baths - beds |
show details | |

|
#19
Chamberlin Rd
Twinsburg, OH 44087
|
- sq. feet
|
- baths - beds |
show details | |

|
#20
Presidential Pkwy Apt 71
Twinsburg, OH 44087
|
- sq. feet
|
- baths - beds |
show details |
| Photo | Address | Area | Beds / Baths | Price | Details |
|---|---|---|---|---|---|

|
#21
Arbor Glen Dr Apt 212
Twinsburg, OH 44087
|
- sq. feet
|
- baths - beds |
show details | |

|
#22
Altamont Dr Apt B
Twinsburg, OH 44087
|
- sq. feet
|
- baths - beds |
show details | |

|
#23
Ray Ct Apt 1
Twinsburg, OH 44087
|
- sq. feet
|
- baths - beds |
show details | |

|
#24
Darrow Park Dr Apt 114
Twinsburg, OH 44087
|
- sq. feet
|
- baths - beds |
show details | |

|
#25
Arbor Glen Dr Apt 312
Twinsburg, OH 44087
|
- sq. feet
|
- baths - beds |
show details | |

|
#26
Darrow Rd Bldg A
Twinsburg, OH 44087
|
- sq. feet
|
- baths - beds |
show details | |

|
#27
Ray Ct Apt 7
Twinsburg, OH 44087
|
- sq. feet
|
- baths - beds |
show details | |

|
#28
Merryvale Dr
Twinsburg, OH 44087
|
- sq. feet
|
- baths - beds |
show details | |

|
#29
Presidential Pkwy Apt 67
Twinsburg, OH 44087
|
- sq. feet
|
- baths - beds |
show details | |

|
#30
Glenbrook Dr Apt 202
Twinsburg, OH 44087
|
- sq. feet
|
- baths - beds |
show details |
| Photo | Address | Area | Beds / Baths | Price | Details |
|---|---|---|---|---|---|

|
#31
Arbor Glen Dr, Apt 204
Twinsburg, OH 44087
|
- sq. feet
|
- baths - beds |
show details | |

|
#32
Rugby St
Twinsburg, OH 44087
|
- sq. feet
|
- baths - beds |
show details | |

|
#33
Heather Ln
Twinsburg, OH 44087
|
- sq. feet
|
- baths - beds |
show details | |

|
#34
Pebble Creek Dr Apt 203
Twinsburg, OH 44087
|
- sq. feet
|
- baths - beds |
show details | |

|
#35
Darrow Park Dr Apt 103g
Twinsburg, OH 44087
|
- sq. feet
|
- baths - beds |
show details | |

|
#36
Ravenna Rd Apt 101
Twinsburg, OH 44087
|
- sq. feet
|
- baths - beds |
show details | |

|
#37
Richner Ct
Twinsburg, OH 44087
|
- sq. feet
|
- baths - beds |
show details | |

|
#38
Stanford St
Twinsburg, OH 44087
|
- sq. feet
|
- baths - beds |
show details | |

|
Check over 1 million property listings on Foreclosure.com!
|
browse all offers | |||


- 12,90067.3%White alone
- 3,18116.6%Black alone
- 1,5698.2%Asian alone
- 7664.0%Two or more races
- 5943.1%Hispanic
- 1360.7%Other race alone
- 250.1%American Indian alone
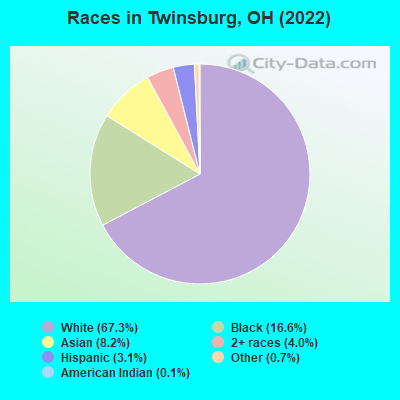
Races in Twinsburg detailed stats: ancestries, foreign born residents, place of birth
According to our research of Ohio and other state lists, there were 16 registered sex offenders living in Twinsburg, Ohio as of May 09, 2024.
The ratio of all residents to sex offenders in Twinsburg is 1,176 to 1.
The ratio of registered sex offenders to all residents in this city is lower than the state average.
Type |
2009 |
2010 |
2011 |
2012 |
2013 |
2014 |
2015 |
2016 |
2017 |
2018 |
2019 |
2020 |
2021 |
2022 |
|---|---|---|---|---|---|---|---|---|---|---|---|---|---|---|
| Murders (per 100,000) | 1 (5.7) | 0 (0.0) | 0 (0.0) | 0 (0.0) | 1 (5.3) | 0 (0.0) | 1 (5.3) | 1 (5.3) | 2 (10.6) | 1 (5.3) | 1 (5.2) | 1 (5.3) | 0 (0.0) | 0 (0.0) |
| Rapes (per 100,000) | 0 (0.0) | 2 (10.6) | 4 (21.3) | 4 (21.4) | 3 (16.0) | 1 (5.3) | 1 (5.3) | 1 (5.3) | 0 (0.0) | 1 (5.3) | 1 (5.2) | 0 (0.0) | 2 (10.6) | 2 (10.3) |
| Robberies (per 100,000) | 1 (5.7) | 0 (0.0) | 4 (21.3) | 2 (10.7) | 1 (5.3) | 2 (10.6) | 3 (15.9) | 5 (26.5) | 4 (21.2) | 3 (15.8) | 4 (20.9) | 2 (10.6) | 0 (0.0) | 1 (5.2) |
| Assaults (per 100,000) | 3 (17.2) | 3 (16.0) | 3 (15.9) | 4 (21.4) | 4 (21.3) | 2 (10.6) | 17 (90.2) | 13 (68.8) | 12 (63.5) | 7 (36.9) | 11 (57.6) | 13 (68.8) | 3 (15.8) | 12 (61.8) |
| Burglaries (per 100,000) | 19 (109.0) | 25 (133.0) | 30 (159.5) | 12 (64.1) | 20 (106.7) | 20 (105.9) | 22 (116.7) | 19 (100.6) | 9 (47.6) | 16 (84.3) | 9 (47.1) | 6 (31.8) | 8 (42.2) | 7 (36.1) |
| Thefts (per 100,000) | 100 (573.7) | 105 (558.7) | 132 (701.8) | 117 (624.8) | 104 (554.7) | 108 (572.0) | 124 (657.9) | 109 (577.1) | 99 (524.1) | 87 (458.3) | 80 (418.8) | 102 (539.8) | 102 (538.1) | 111 (572.1) |
| Auto thefts (per 100,000) | 11 (63.1) | 8 (42.6) | 7 (37.2) | 10 (53.4) | 8 (42.7) | 4 (21.2) | 4 (21.2) | 3 (15.9) | 3 (15.9) | 6 (31.6) | 3 (15.7) | 18 (95.3) | 7 (36.9) | 9 (46.4) |
| Arson (per 100,000) | 2 (11.5) | 2 (10.6) | 0 (0.0) | 0 (0.0) | 0 (0.0) | 1 (5.3) | 0 (0.0) | 1 (5.3) | 0 (0.0) | 0 (0.0) | 0 (0.0) | 1 (5.3) | 0 (0.0) | 0 (0.0) |
| City-Data.com crime index | 52.3 | 46.8 | 68.8 | 58.3 | 62.4 | 41.5 | 73.9 | 67.9 | 65.8 | 53.6 | 53.8 | 59.0 | 39.0 | 51.3 |
The City-Data.com crime index weighs serious crimes and violent crimes more heavily. Higher means more crime, U.S. average is 246.1. It adjusts for the number of visitors and daily workers commuting into cities.
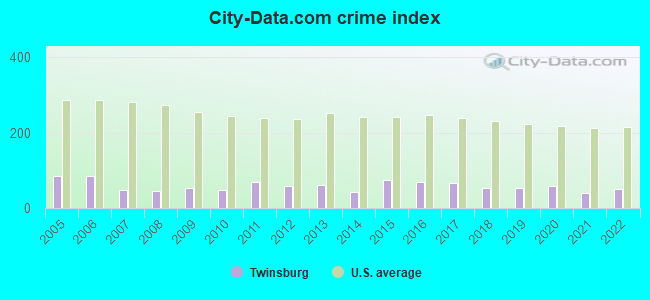
Crime rate in Twinsburg detailed stats: murders, rapes, robberies, assaults, burglaries, thefts, arson
Full-time law enforcement employees in 2015, including police officers: 42 (31 officers - 29 male; 2 female).
| Officers per 1,000 residents here: | 1.64 |
| Ohio average: | 2.00 |
 Recent articles from our blog. Our writers, many of them Ph.D. graduates or candidates, create easy-to-read articles on a wide variety of topics.

 | Macedonia or Twinsburg (2 replies) |
| Military relocating me to Twinsburg (8 replies) |
| What is Twinsburg like? (11 replies) |
| 23, moving to Northern Ohio and need advice badly! (10 replies) |
| West side (Brecksville, North Royalton) Vs. East (Stow, Cuyahoga Falls) (9 replies) |
| Romantic restaurant for Valentine's Day? (5 replies) |
Latest news from Twinsburg, OH collected exclusively by city-data.com from local newspapers, TV, and radio stations
Ancestries: Italian (12.2%), German (9.3%), Irish (5.9%), English (5.4%), Polish (4.5%), American (2.8%).
Current Local Time: EST time zone
Incorporated in 1957
Elevation: 1004 feet
Land area: 12.4 square miles.
Population density: 1,560 people per square mile (low).
1,472 residents are foreign born (5.6% Asia, 0.9% Europe).
| This city: | 7.7% |
| Ohio: | 4.9% |
Median real estate property taxes paid for housing units with mortgages in 2022: $4,266 (1.4%)
Median real estate property taxes paid for housing units with no mortgage in 2022: $3,699 (1.3%)
Nearest city with pop. 50,000+: Parma, OH  (15.1 miles , pop. 85,655).
Nearest city with pop. 200,000+: Cleveland, OH (15.7 miles , pop. 478,403).
Nearest city with pop. 1,000,000+: Chicago, IL (324.1 miles , pop. 2,896,016).
Nearest cities:
), ), ), ), Latitude: 41.32 N, Longitude: 81.45 W
Daytime population change due to commuting: +6,013 (+31.4%)
Workers who live and work in this city: 3,462 (33.0%)
Area code: 330
Property values in Twinsburg, OH

Twinsburg, Ohio accommodation & food services, waste management - Economy and Business Data
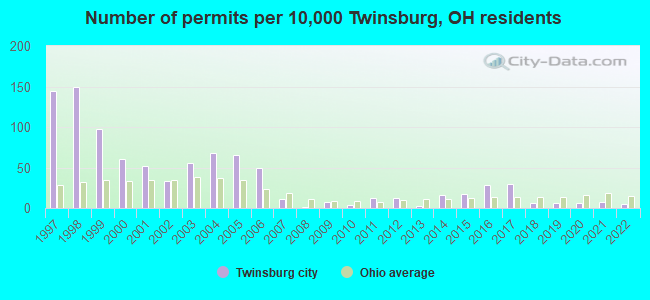
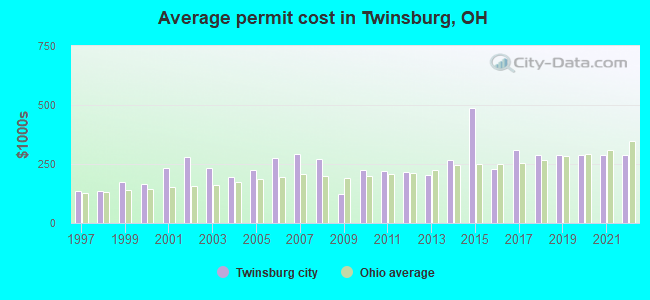
Single-family new house construction building permits:
- 2022: 9 buildings, average cost: $289,200
- 2021: 12 buildings, average cost: $289,200
- 2020: 11 buildings, average cost: $289,200
- 2019: 10 buildings, average cost: $289,200
- 2018: 10 buildings, average cost: $289,200
- 2017: 51 buildings, average cost: $311,200
- 2016: 50 buildings, average cost: $230,200
- 2015: 29 buildings, average cost: $485,800
- 2014: 27 buildings, average cost: $268,100
- 2013: 5 buildings, average cost: $204,700
- 2012: 21 buildings, average cost: $213,600
- 2011: 21 buildings, average cost: $221,600
- 2010: 7 buildings, average cost: $225,000
- 2009: 13 buildings, average cost: $124,100
- 2008: 2 buildings, average cost: $271,300
- 2007: 19 buildings, average cost: $291,000
- 2006: 83 buildings, average cost: $276,700
- 2005: 110 buildings, average cost: $226,000
- 2004: 116 buildings, average cost: $196,000
- 2003: 94 buildings, average cost: $233,800
- 2002: 56 buildings, average cost: $280,700
- 2001: 88 buildings, average cost: $233,400
- 2000: 103 buildings, average cost: $165,500
- 1999: 166 buildings, average cost: $172,600
- 1998: 253 buildings, average cost: $136,300
- 1997: 246 buildings, average cost: $136,300
| Here: | 3.3% |
| Ohio: | 3.1% |
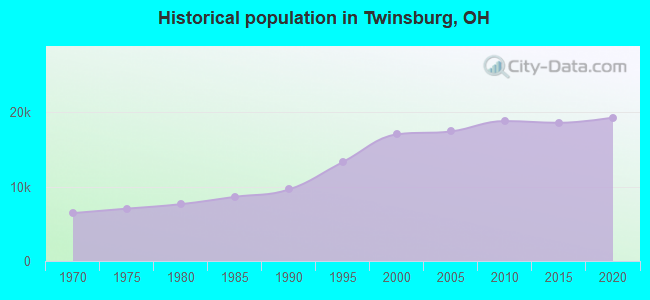
Population change in the 1990s: +7,322 (+75.6%).
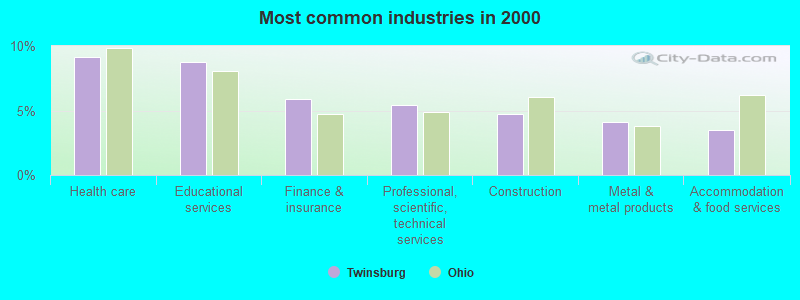
- Health care (9.1%)
- Educational services (8.8%)
- Finance & insurance (5.9%)
- Professional, scientific, technical services (5.5%)
- Construction (4.8%)
- Metal & metal products (4.1%)
- Accommodation & food services (3.5%)
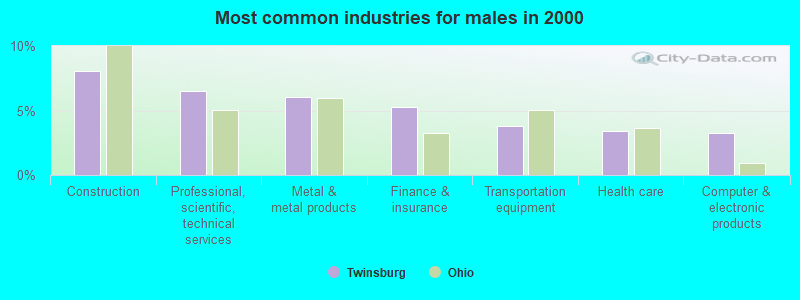
- Construction (8.0%)
- Professional, scientific, technical services (6.5%)
- Metal & metal products (6.0%)
- Finance & insurance (5.2%)
- Transportation equipment (3.8%)
- Health care (3.4%)
- Computer & electronic products (3.2%)
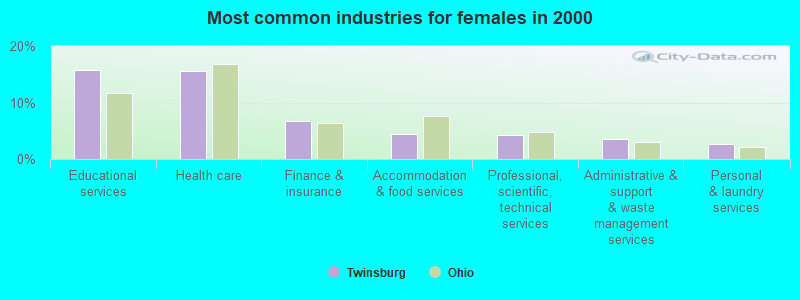
- Educational services (15.8%)
- Health care (15.6%)
- Finance & insurance (6.7%)
- Accommodation & food services (4.4%)
- Professional, scientific, technical services (4.2%)
- Administrative & support & waste management services (3.5%)
- Personal & laundry services (2.7%)
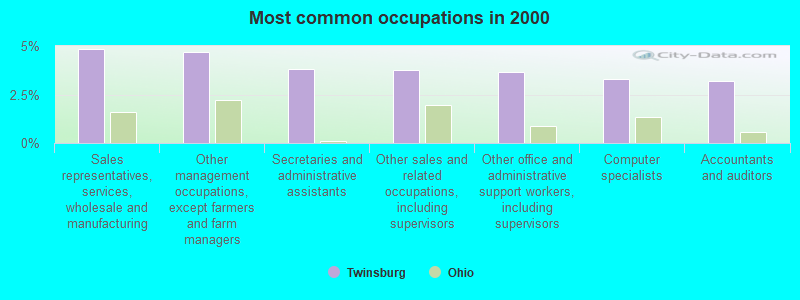
- Sales representatives, services, wholesale and manufacturing (4.8%)
- Other management occupations, except farmers and farm managers (4.7%)
- Secretaries and administrative assistants (3.8%)
- Other sales and related occupations, including supervisors (3.8%)
- Other office and administrative support workers, including supervisors (3.7%)
- Computer specialists (3.3%)
- Accountants and auditors (3.2%)
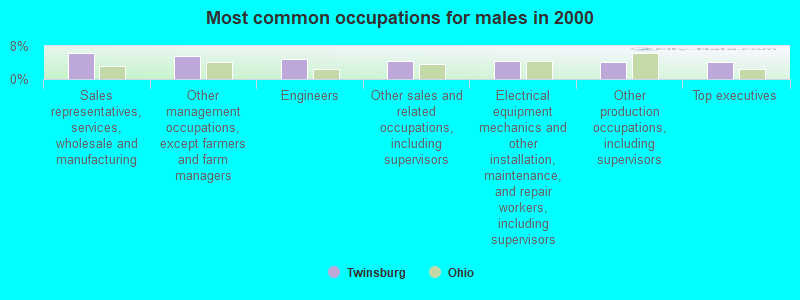
- Sales representatives, services, wholesale and manufacturing (6.2%)
- Other management occupations, except farmers and farm managers (5.5%)
- Engineers (4.8%)
- Other sales and related occupations, including supervisors (4.5%)
- Electrical equipment mechanics and other installation, maintenance, and repair workers, including supervisors (4.4%)
- Other production occupations, including supervisors (4.2%)
- Top executives (4.1%)

- Secretaries and administrative assistants (8.1%)
- Preschool, kindergarten, elementary, and middle school teachers (6.1%)
- Other office and administrative support workers, including supervisors (5.1%)
- Accountants and auditors (4.0%)
- Bookkeeping, accounting, and auditing clerks (4.0%)
- Registered nurses (4.0%)
- Information and record clerks, except customer service representatives (3.9%)
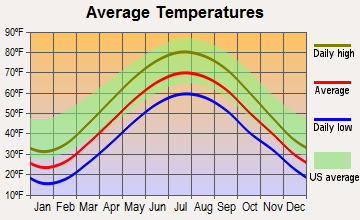
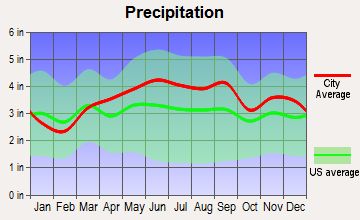
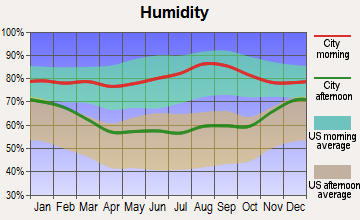
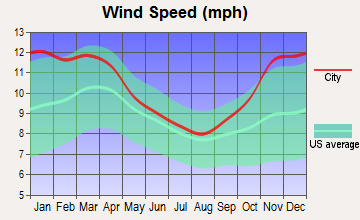
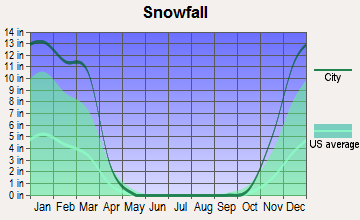
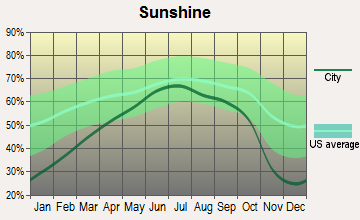
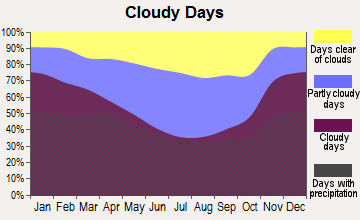
Average climate in Twinsburg, Ohio
Based on data reported by over 4,000 weather stations
|
|

(lower is better)
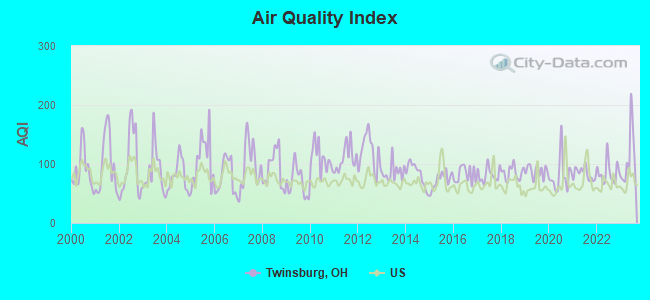
Air Quality Index (AQI) level in 2023 was 110. This is significantly worse than average.
| City: | 110 |
| U.S.: | 73 |
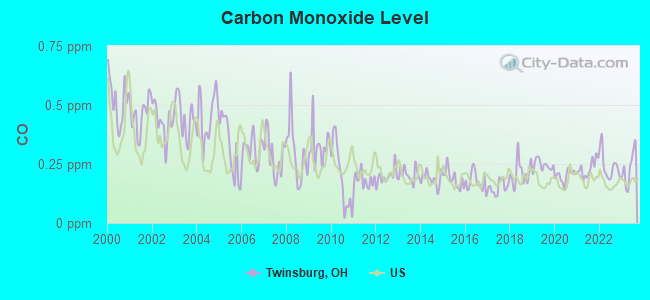
Carbon Monoxide (CO) [ppm] level in 2023 was 0.235. This is about average. Closest monitor was 11.6 miles away from the city center.
| City: | 0.235 |
| U.S.: | 0.251 |
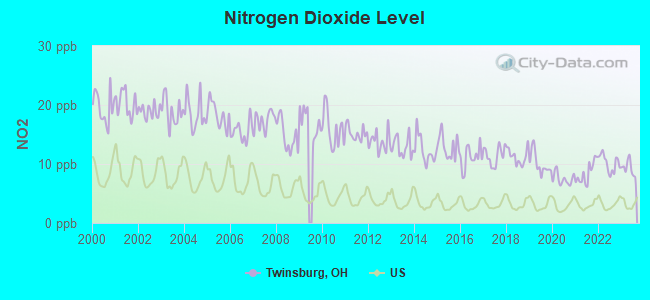
Nitrogen Dioxide (NO2) [ppb] level in 2023 was 9.32. This is significantly worse than average. Closest monitor was 0.9 miles away from the city center.
| City: | 9.32 |
| U.S.: | 5.11 |
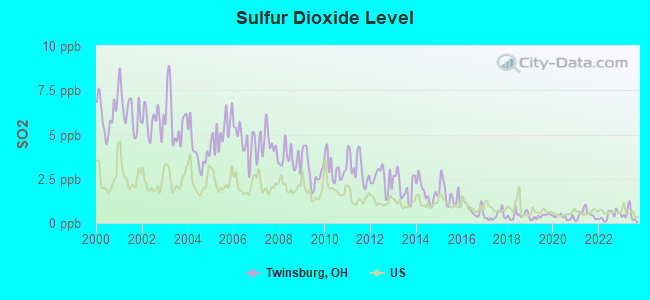
Sulfur Dioxide (SO2) [ppb] level in 2023 was 0.491. This is significantly better than average. Closest monitor was 0.9 miles away from the city center.
| City: | 0.491 |
| U.S.: | 1.515 |
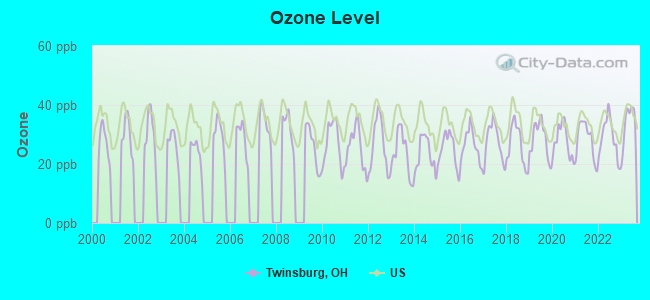
Ozone [ppb] level in 2023 was 33.8. This is about average. Closest monitor was 6.8 miles away from the city center.
| City: | 33.8 |
| U.S.: | 33.3 |
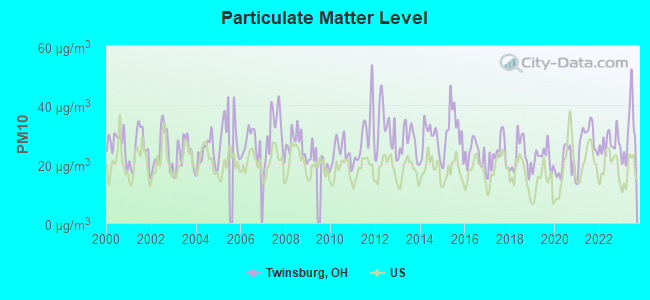
Particulate Matter (PM10) [µg/m3] level in 2023 was 30.7. This is significantly worse than average. Closest monitor was 13.8 miles away from the city center.
| City: | 30.7 |
| U.S.: | 19.2 |
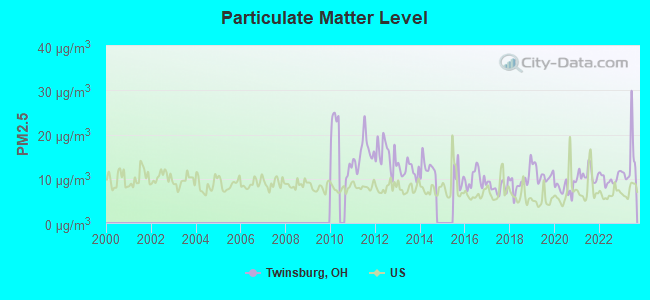
Particulate Matter (PM2.5) [µg/m3] level in 2023 was 13.9. This is significantly worse than average. Closest monitor was 11.7 miles away from the city center.
| City: | 13.9 |
| U.S.: | 8.1 |
Tornado activity:
Twinsburg-area historical tornado activity is slightly below Ohio state average. It is 2% greater than the overall U.S. average.
On 5/31/1985, a category F5 (max. wind speeds 261-318 mph) tornado 17.9 miles away from the Twinsburg city center killed 18 people and injured 310 people and caused between $50,000,000 and $500,000,000 in damages.
On 6/8/1953, a category F4 (max. wind speeds 207-260 mph) tornado 18.4 miles away from the city center killed 17 people and injured 379 people.
Earthquake activity:
Twinsburg-area historical earthquake activity is significantly above Ohio state average. It is 50% smaller than the overall U.S. average.On 9/25/1998 at 19:52:52, a magnitude 5.2 (4.8 MB, 4.3 MS, 5.2 LG, 4.5 MW, Depth: 3.1 mi, Class: Moderate, Intensity: VI - VII) earthquake occurred 56.0 miles away from the city center
On 1/31/1986 at 16:46:43, a magnitude 5.0 (5.0 MB) earthquake occurred 24.5 miles away from the city center
On 8/23/2011 at 17:51:04, a magnitude 5.8 (5.8 MW, Depth: 3.7 mi) earthquake occurred 301.4 miles away from Twinsburg center
On 7/27/1980 at 18:52:21, a magnitude 5.2 (5.1 MB, 4.7 MS, 5.0 UK, 5.2 UK) earthquake occurred 253.1 miles away from the city center
On 6/10/2019 at 14:50:45, a magnitude 4.0 (4.0 MB, Depth: 1.2 mi, Class: Light, Intensity: IV - V) earthquake occurred 24.6 miles away from Twinsburg center
On 12/31/2011 at 20:05:01, a magnitude 4.0 (4.0 ML, Depth: 3.1 mi) earthquake occurred 42.4 miles away from the city center
Magnitude types: regional Lg-wave magnitude (LG), body-wave magnitude (MB), local magnitude (ML), surface-wave magnitude (MS), moment magnitude (MW)
Natural disasters:
The number of natural disasters in Summit County (11) is smaller than the US average (15).Major Disasters (Presidential) Declared: 7
Emergencies Declared: 3
Causes of natural disasters: Storms: 6, Tornadoes: 5, Floods: 4, Winds: 2, Blizzard: 1, Hurricane: 1, Power Outage: 1, Snowstorm: 1, Tropical Depression: 1, Other: 1 (Note: some incidents may be assigned to more than one category).

Main business address for: COLE NATIONAL CORP /DE/ (RETAIL-RETAIL STORES, NEC), COLE NATIONAL GROUP INC (RETAIL-HOBBY, TOY & GAME SHOPS).
Hospitals and medical centers in Twinsburg:
Other hospitals and medical centers near Twinsburg:
- SOLON FAMILY HOME (Hospital, about 3 miles away; SOLON, OH)
- IN-HOUSE HOSPICE SOLUTIONS (Hospital, about 3 miles away; MACEDONIA, OH)
- KINDRED NURSING AND REHAB - STRATFORD (Nursing Home, about 4 miles away; GLENWILLOW, OH)
- WOOD HOUSE (Hospital, about 4 miles away; OAKWOOD, OH)
- IMA CARE, INC (Home Health Center, about 4 miles away; AURORA, OH)
- HERITAGE HEALTH CARE CENTER (Nursing Home, about 4 miles away; OAKWOOD VILLAGE, OH)
- HERITAGE NURSING AND REHAB CTR (Nursing Home, about 4 miles away; OAKWOOD VILLAGE, OH)
Heliports located in Twinsburg:
Amtrak stations near Twinsburg:
- 18 miles: AKRON (906 E. BOWERY ST.) . Services: enclosed waiting area, public restrooms, public payphones, free short-term parking, free long-term parking, taxi stand.
- 18 miles: CLEVELAND (200 CLEVELAND MEMORIAL SHOREWAY) . Services: ticket office, partially wheelchair accessible, enclosed waiting area, public restrooms, public payphones, vending machines, free short-term parking, paid long-term parking, taxi stand, public transit connection.
College/University in Twinsburg:
Colleges/universities with over 2000 students nearest to Twinsburg:
- John Carroll University (about 13 miles; University Heights, OH; Full-time enrollment: 3,546)
- Kent State University at Kent (about 14 miles; Kent, OH; FT enrollment: 25,431)
- Case Western Reserve University (about 15 miles; Cleveland, OH; FT enrollment: 7,034)
- Cuyahoga Community College District (about 17 miles; Cleveland, OH; FT enrollment: 20,271)
- Cleveland State University (about 17 miles; Cleveland, OH; FT enrollment: 14,161)
- University of Akron Main Campus (about 18 miles; Akron, OH; FT enrollment: 22,216)
- Baldwin Wallace University (about 21 miles; Berea, OH; FT enrollment: 3,699)
Public high school in Twinsburg:
- TWINSBURG HIGH SCHOOL (Students: 1,353, Location: 10084 RAVENNA RD, Grades: 9-12)
Public elementary/middle schools in Twinsburg:
- GEO G DODGE ELEMENTARY SCHOOL (Students: 948, Location: 10225 RAVENNA RD, Grades: 4-6)
- R B CHAMBERLIN MIDDLE SCHOOL (Students: 695, Location: 10270 RAVENNA RD, Grades: 7-8)
- SAMUEL BISSELL ELEMENTARY SCHOOL (Students: 637, Location: 1811 GLENWOOD DR, Grades: 2-3)
- WILCOX ELEMENTARY SCHOOL (Location: 9198 DARROW RD, Grades: PK-1)
Library in Twinsburg:
Points of interest:
Notable locations in Twinsburg: Glen Eagle Golf Course (A), Midway Industrial Park (B), Chrysler Industrial Park (C), Canyon Falls Corporate Office Park (D), Twinsburg Industrial Park (E), Twinsburg Fire Department Station 1 (F), Twinsburg Fire Department Station 2 (G), Twinsburg Town Hall (H), Twinsburg Public Library (I). Display/hide their locations on the map
Main business address in Twinsburg include: COLE NATIONAL CORP /DE/ (A), COLE NATIONAL GROUP INC (B). Display/hide their locations on the map
Church in Twinsburg: Twinsburg Congregational Church (A). Display/hide its location on the map
Cemeteries: Crown Hill Cemetery (1), Locust Grove Cemetery (2). Display/hide their locations on the map
Lake: Lake Plata (A). Display/hide its location on the map
Parks in Twinsburg include: Adams Park (1), Center Valley Park (2), Gillie Park (3), Glen Chamberlin Park (4), Glen Meadow Park (5), Ledges Park (6), Mortus Park (7), Public Square (8), Tinkers Woods Park (9). Display/hide their locations on the map
Hotels: Comfort Suites Inn (2684 East Aurora Road), Bridgestreet Corporate Housing (2242 Pinnacle Parkway), Blue Top Motel (9392 Ravenna Road), Hilton Garden Inn Cleveland/Twinsburg (8971 Wilcox Dr).
Drinking water stations with addresses in Twinsburg and their reported violations in the past:
REDWOOD SWIM CLUB (Population served: 200, Groundwater):Past monitoring violations:
- One routine major monitoring violation
| This city: | 2.5 people |
| Ohio: | 2.4 people |
| This city: | 68.3% |
| Whole state: | 65.0% |
| This city: | 3.8% |
| Whole state: | 6.8% |
Likely homosexual households (counted as self-reported same-sex unmarried-partner households)
- Lesbian couples: 0.2% of all households
- Gay men: 0.2% of all households
5 people in local jails and other municipal confinement facilities in 2010
People in group quarters in Twinsburg in 2000:
- 126 people in nursing homes
- 2 people in local jails and other confinement facilities (including police lockups)
- 2 people in religious group quarters
Banks with most branches in Twinsburg (2011 data):
- Firstmerit Bank, National Association: Auto-Teller Branch at 9089 Darrow Road, branch established on 1970/03/23; Twinsburg Branch at 9777 Ravenna Road, branch established on 1912/08/14. Info updated 2010/05/17: Bank assets: $14,420.6 mil, Deposits: $11,497.6 mil, headquarters in Akron, OH, positive income, Commercial Lending Specialization, 213 total offices, Holding Company: Firstmerit Corporation
- KeyBank National Association: Twinsburg Branch at 2566 Aurora Road, branch established on 2001/12/17. Info updated 2008/03/03: Bank assets: $86,198.8 mil, Deposits: $64,214.8 mil, headquarters in Cleveland, OH, positive income, Commercial Lending Specialization, 1067 total offices, Holding Company: Keycorp
- Fifth Third Bank: Twinsburg Banking Center Branch at 8901 Darrow Road, branch established on 1995/09/18. Info updated 2009/10/05: Bank assets: $114,540.4 mil, Deposits: $89,689.1 mil, headquarters in Cincinnati, OH, positive income, Commercial Lending Specialization, 1378 total offices, Holding Company: Fifth Third Bancorp
- PNC Bank, National Association: Twinsburg Branch at 2710 Aurora Road, branch established on 1986/09/02. Info updated 2012/03/20: Bank assets: $263,309.6 mil, Deposits: $197,343.0 mil, headquarters in Wilmington, DE, positive income, Commercial Lending Specialization, 3085 total offices, Holding Company: Pnc Financial Services Group, Inc., The
- Park View Federal Savings Bank: Twinsburg Branch at 10071 Darrow Road, branch established on 2000/08/17. Info updated 2011/07/21: Bank assets: $803.3 mil, Deposits: $696.8 mil, headquarters in Solon, OH, negative income in the last year, Commercial Lending Specialization, 17 total offices
- The Huntington National Bank: Twinsburg Branch at 8936 Darrow Road, branch established on 1998/12/14. Info updated 2012/04/02: Bank assets: $54,183.4 mil, Deposits: $44,300.3 mil, headquarters in Columbus, OH, positive income, Commercial Lending Specialization, 878 total offices, Holding Company: Huntington Bancshares Incorporated
- RBS Citizens, National Association: Twinsburg Branch at 8969 Darrow Road, branch established on 2009/05/11. Info updated 2007/09/19: Bank assets: $106,940.6 mil, Deposits: $75,690.2 mil, headquarters in Providence, RI, positive income, 1135 total offices, Holding Company: Uk Financial Investments Limited
- JPMorgan Chase Bank, National Association: Twinsburg Branch at 9023 Darrow Road, branch established on 1975/02/20. Info updated 2011/11/10: Bank assets: $1,811,678.0 mil, Deposits: $1,190,738.0 mil, headquarters in Columbus, OH, positive income, International Specialization, 5577 total offices, Holding Company: Jpmorgan Chase & Co.
- Liberty Bank, National Association: at 2351 Edison Boulevard, branch established on 1990/10/09. Info updated 2006/11/03: Bank assets: $211.3 mil, Deposits: $187.9 mil, local headquarters, negative income in the last year, Commercial Lending Specialization, 3 total offices
For population 15 years and over in Twinsburg:
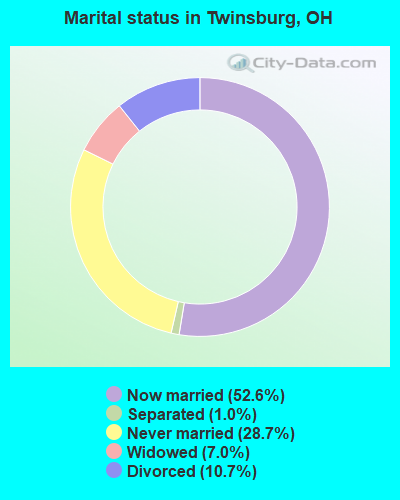
- Never married: 28.7%
- Now married: 52.6%
- Separated: 1.0%
- Widowed: 7.0%
- Divorced: 10.7%
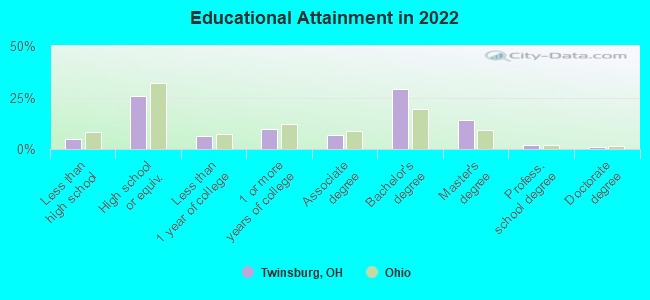
For population 25 years and over in Twinsburg:
- High school or higher: 95.5%
- Bachelor's degree or higher: 44.3%
- Graduate or professional degree: 15.9%
- Unemployed: 2.4%
- Mean travel time to work (commute): 18.6 minutes
| Here: | 10.0 |
| Ohio average: | 11.0 |

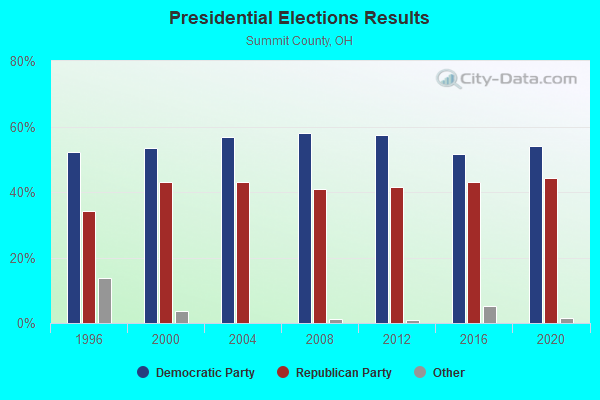
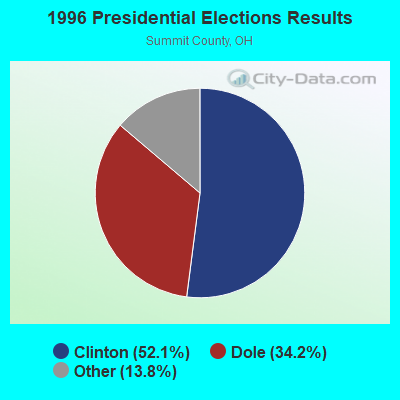
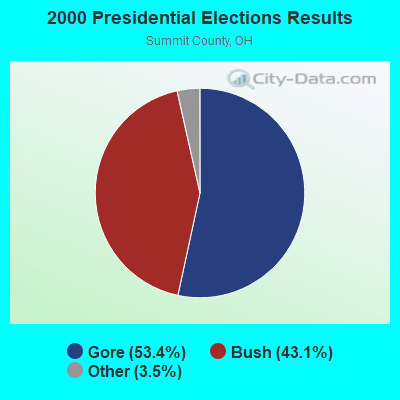
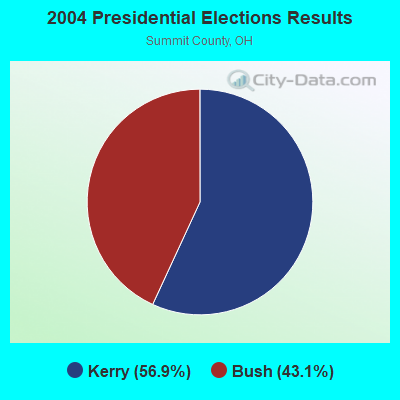
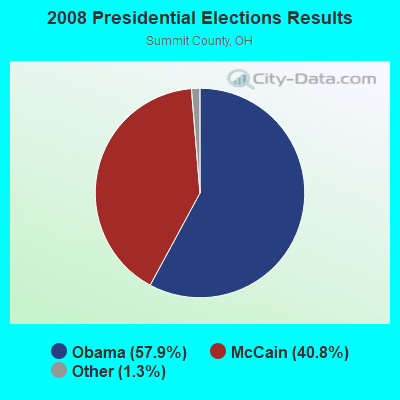
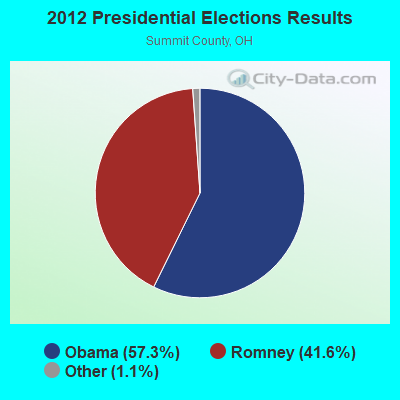
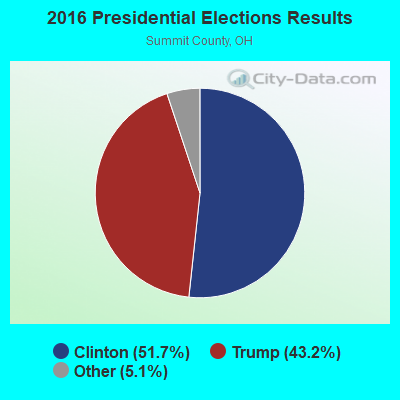
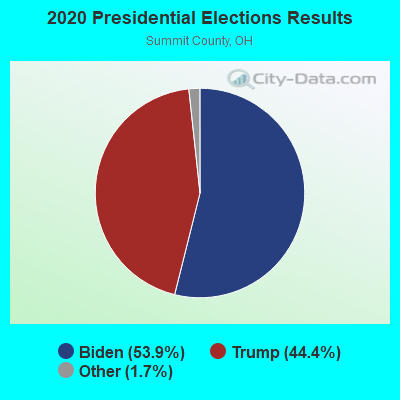
Graphs represent county-level data. Detailed 2008 Election Results
Religion statistics for Twinsburg, OH (based on Summit County data)
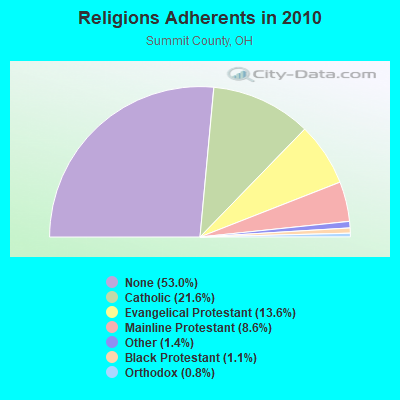
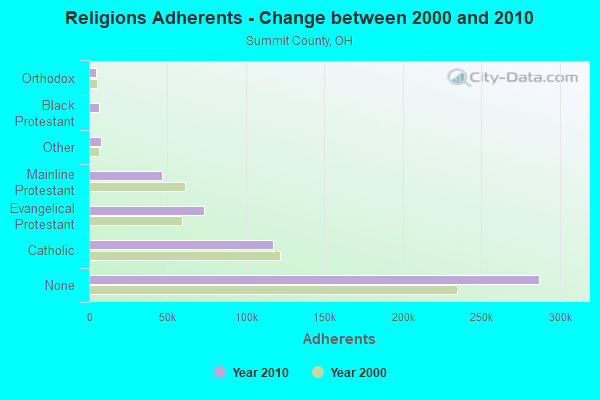
| Religion | Adherents | Congregations |
|---|---|---|
| Catholic | 116,941 | 33 |
| Evangelical Protestant | 73,586 | 254 |
| Mainline Protestant | 46,521 | 127 |
| Other | 7,347 | 34 |
| Black Protestant | 6,129 | 26 |
| Orthodox | 4,230 | 12 |
| None | 287,027 | - |
Food Environment Statistics:
| Here: | 1.54 / 10,000 pop. |
| State: | 1.89 / 10,000 pop. |
| Summit County: | 0.07 / 10,000 pop. |
| Ohio: | 0.13 / 10,000 pop. |
| Summit County: | 0.77 / 10,000 pop. |
| State: | 1.25 / 10,000 pop. |
| This county: | 2.67 / 10,000 pop. |
| Ohio: | 2.93 / 10,000 pop. |
| Here: | 6.20 / 10,000 pop. |
| Ohio: | 6.25 / 10,000 pop. |
| Here: | 10.7% |
| Ohio: | 10.3% |
| Summit County: | 27.6% |
| Ohio: | 29.1% |
| Summit County: | 12.0% |
| Ohio: | 11.9% |
Health and Nutrition:
| Here: | 51.4% |
| Ohio: | 50.4% |
| Twinsburg: | 48.9% |
| State: | 47.8% |
| Twinsburg: | 28.9 |
| State: | 28.7 |
| Twinsburg: | 19.8% |
| Ohio: | 20.6% |
| Twinsburg: | 11.1% |
| Ohio: | 10.4% |
| Twinsburg: | 6.8 |
| Ohio: | 6.8 |
| Twinsburg: | 35.8% |
| Ohio: | 34.3% |
| This city: | 57.7% |
| Ohio: | 57.0% |
| Twinsburg: | 79.7% |
| Ohio: | 79.1% |
More about Health and Nutrition of Twinsburg, OH Residents
| Local government employment and payroll (March 2022) | |||||
| Function | Full-time employees | Monthly full-time payroll | Average yearly full-time wage | Part-time employees | Monthly part-time payroll |
|---|---|---|---|---|---|
| Police Protection - Officers | 34 | $281,271 | $99,272 | 0 | $0 |
| Firefighters | 34 | $259,975 | $91,756 | 2 | $2,462 |
| Streets and Highways | 28 | $188,896 | $80,955 | 0 | $0 |
| Sewerage | 23 | $152,988 | $79,820 | 0 | $0 |
| Parks and Recreation | 23 | $125,087 | $65,263 | 39 | $30,909 |
| Police - Other | 15 | $81,927 | $65,542 | 2 | $4,094 |
| Other and Unallocable | 11 | $74,486 | $81,257 | 4 | $5,519 |
| Financial Administration | 5 | $39,251 | $94,202 | 0 | $0 |
| Other Government Administration | 3 | $26,519 | $106,076 | 10 | $21,126 |
| Judicial and Legal | 1 | $11,714 | $140,568 | 1 | $2,315 |
| Fire - Other | 1 | $6,153 | $73,836 | 0 | $0 |
| Correction | 0 | $0 | 2 | $3,234 | |
| Totals for Government | 178 | $1,248,267 | $84,153 | 60 | $69,659 |
Twinsburg government finances - Expenditure in 2021 (per resident):
- Construction - Regular Highways: $1,946,000 ($100.23)
- Current Operations - Parks and Recreation: $10,305,000 ($530.75)
General - Other: $5,901,000 ($303.92)
Regular Highways: $5,227,000 ($269.21)
Police Protection: $4,911,000 ($252.94)
Local Fire Protection: $3,585,000 ($184.64)
Sewerage: $3,042,000 ($156.67)
Central Staff Services: $2,076,000 ($106.92)
Financial Administration: $1,393,000 ($71.74)
General Public Buildings: $363,000 ($18.70)
Judicial and Legal Services: $212,000 ($10.92)
Water Utilities: $105,000 ($5.41)
- General - Interest on Debt: $196,000 ($10.09)
- Intergovernmental to Local - Other - Health - Other: $211,000 ($10.87)
Other - Central Staff Services: $42,000 ($2.16)
- Intergovernmental to State - Central Staff Services: $331,000 ($17.05)
- Other Capital Outlay - Local Fire Protection: $223,000 ($11.49)
Police Protection: $210,000 ($10.82)
Parks and Recreation: $21,000 ($1.08)
General Public Building: $11,000 ($0.57)
- Total Salaries and Wages: $14,497,000 ($746.65)
Twinsburg government finances - Revenue in 2021 (per resident):
- Charges - Sewerage: $4,246,000 ($218.69)
Parks and Recreation: $1,925,000 ($99.15)
Hospital Public: $446,000 ($22.97)
- Federal Intergovernmental - Other: $1,625,000 ($83.69)
Health and Hospitals: $80,000 ($4.12)
Highways: $10,000 ($0.52)
Housing and Community Development: $5,000 ($0.26)
- Local Intergovernmental - Other: $915,000 ($47.13)
Highways: $327,000 ($16.84)
- Miscellaneous - General Revenue - Other: $3,788,000 ($195.10)
Interest Earnings: $233,000 ($12.00)
Fines and Forfeits: $95,000 ($4.89)
Special Assessments: $44,000 ($2.27)
Rents: $43,000 ($2.21)
Sale of Property: $31,000 ($1.60)
Donations From Private Sources: $22,000 ($1.13)
- Revenue - Water Utilities: $79,000 ($4.07)
- State Intergovernmental - Highways: $1,305,000 ($67.21)
General Local Government Support: $203,000 ($10.46)
Housing and Community Development: $29,000 ($1.49)
Health and Hospitals: $15,000 ($0.77)
- Tax - Individual Income: $19,427,000 ($1000.57)
Corporation Net Income: $3,171,000 ($163.32)
Property: $1,120,000 ($57.68)
Other License: $452,000 ($23.28)
Other Selective Sales: $99,000 ($5.10)
Occupation and Business License - Other: $58,000 ($2.99)
Twinsburg government finances - Debt in 2021 (per resident):
- Long Term Debt - Beginning Outstanding - Unspecified Public Purpose: $15,041,000 ($774.67)
Outstanding Unspecified Public Purpose: $14,905,000 ($767.67)
Retired Unspecified Public Purpose: $14,741,000 ($759.22)
Issue, Unspecified Public Purpose: $14,606,000 ($752.27)
Retired Nonguaranteed - Public Debt for Private Purpose: $13,276,000 ($683.77)
Issue, Nonguaranteed - Public Debt for Private Purpose: $7,233,000 ($372.53)
Beginning Outstanding - Public Debt for Private Purpose: $6,789,000 ($349.66)
Outstanding Nonguaranteed - Industrial Revenue: $745,000 ($38.37)
- Short Term Debt Outstanding - Beginning: $6,138,000 ($316.13)
Twinsburg government finances - Cash and Securities in 2021 (per resident):
- Other Funds - Cash and Securities: $22,738,000 ($1171.10)
- Sinking Funds - Cash and Securities: $1,484,000 ($76.43)
5.57% of this county's 2021 resident taxpayers lived in other counties in 2020 ($56,230 average adjusted gross income)
| Here: | 5.57% |
| Ohio average: | 5.68% |
0.01% of residents moved from foreign countries ($80 average AGI)
Summit County: 0.01% Ohio average: 0.01%
Top counties from which taxpayers relocated into this county between 2020 and 2021:
| from Cuyahoga County, OH | |
| from Stark County, OH | |
| from Portage County, OH |
| Businesses in Twinsburg, OH | ||||
| Name | Count | Name | Count | |
|---|---|---|---|---|
| Advance Auto Parts | 1 | McDonald's | 1 | |
| Arby's | 1 | Penske | 1 | |
| Burger King | 1 | Pizza Hut | 1 | |
| CVS | 2 | Sprint Nextel | 1 | |
| Circle K | 2 | Starbucks | 1 | |
| Comfort Suites | 1 | Subway | 2 | |
| Cracker Barrel | 1 | Super 8 | 1 | |
| Curves | 1 | Taco Bell | 1 | |
| Dairy Queen | 1 | True Value | 1 | |
| FedEx | 5 | U-Haul | 1 | |
| GNC | 1 | UPS | 9 | |
| H&R Block | 1 | Walgreens | 1 | |
| Hilton | 1 | Wendy's | 1 | |
Strongest AM radio stations in Twinsburg:
- WTAM (1100 AM; 50 kW; CLEVELAND, OH; Owner: JACOR BROADCASTING CORPORATION)
- WKNR (850 AM; 50 kW; CLEVELAND, OH; Owner: CARON BROADCASTING, INC.)
- WHK (1220 AM; 50 kW; CLEVELAND, OH; Owner: CARON BROADCASTING, INC.)
- WWMK (1260 AM; 10 kW; CLEVELAND, OH; Owner: ABC, INC.)
- WCUE (1150 AM; 5 kW; CUYAHOGA FALLS, OH; Owner: FAMILY STATIONS, INC.)
- WTOU (1350 AM; 5 kW; AKRON, OH)
- WRMR (1420 AM; 5 kW; CLEVELAND, OH; Owner: CLEVELAND CLASSICAL RADIO, LLC)
- WHLO (640 AM; 5 kW; AKRON, OH; Owner: CLEAR CHANNEL BROADCASTING LICENSES, INC.)
- WERE (1300 AM; 5 kW; CLEVELAND, OH)
- WHBC (1480 AM; 15 kW; CANTON, OH; Owner: NM LICENSING, LLC)
- WAKR (1590 AM; 5 kW; AKRON, OH; Owner: RUBBER CITY RADIO GROUP, INC.)
- WJTB (1040 AM; daytime; 5 kW; NORTH RIDGEVILLE, OH; Owner: TAYLOR BROADCASTING CO)
- WWVA (1170 AM; 53 kW; WHEELING, WV; Owner: CAPSTAR TX LIMITED PARTNERSHIP)
Strongest FM radio stations in Twinsburg:
- WFHM-FM (95.5 FM; CLEVELAND, OH; Owner: SCA LICENSE CORPORATION)
- WMJI (105.7 FM; CLEVELAND, OH; Owner: CITICASTERS LICENSES, L.P.)
- WXTM (92.3 FM; CLEVELAND HEIGHTS, OH; Owner: INFINITY RADIO OPERATIONS INC.)
- WAKS (96.5 FM; AKRON, OH; Owner: CAPSTAR TX LIMITED PARTNERSHIP)
- WZAK (93.1 FM; CLEVELAND, OH; Owner: RADIO ONE LICENSES, LLC)
- WDOK (102.1 FM; CLEVELAND, OH; Owner: INFINITY RADIO OPERATIONS INC.)
- WQAL (104.1 FM; CLEVELAND, OH; Owner: INFINITY RADIO OPERATIONS INC.)
- WMVX (106.5 FM; CLEVELAND, OH; Owner: JACOR BROADCASTING CORPORATION)
- WENZ (107.9 FM; CLEVELAND, OH; Owner: RADIO ONE LICENSES, LLC)
- WCRF-FM (103.3 FM; CLEVELAND, OH; Owner: THE MOODY BIBLE INSTITUTE OF CHICAGO)
- WNCX (98.5 FM; CLEVELAND, OH; Owner: INFINITY RADIO OF CLEVELAND INC.)
- WKHR (91.5 FM; BAINBRIDGE, OH; Owner: KENSTON LOCAL SCHOOL DISTRICT)
- WMMS (100.7 FM; CLEVELAND, OH; Owner: CITICASTERS LICENSES, L.P.)
- WSTB (88.9 FM; STREETSBORO, OH; Owner: STREETSBORO CITY SCHOOL DISTRICT)
- WKSU-FM (89.7 FM; KENT, OH; Owner: KENT STATE UNIVERSITY)
- WONE-FM (97.5 FM; AKRON, OH; Owner: RUBBER CITY RADIO GROUP, INC.)
- WQMX (94.9 FM; MEDINA, OH; Owner: RUBBER CITY RADIO GROUP, INC)
- WZIP (88.1 FM; AKRON, OH; Owner: THE UNIVERSITY OF AKRON)
- WCPN (90.3 FM; CLEVELAND, OH; Owner: IDEASTREAM)
- WGAR-FM (99.5 FM; CLEVELAND, OH; Owner: CITICASTERS LICENSES, L.P.)
TV broadcast stations around Twinsburg:
- WKYC-TV (Channel 3; CLEVELAND, OH; Owner: WKYC-TV, INC.)
- WOIO (Channel 19; SHAKER HEIGHTS, OH; Owner: RAYCOM NATIONAL, INC.)
- WBNX-TV (Channel 55; AKRON, OH; Owner: WINSTON BROADCASTING NETWORK, INC.)
- W35AX (Channel 35; CLEVELAND, OH; Owner: MEDIA-COM TELEVISION, INC.)
- WQHS-TV (Channel 61; CLEVELAND, OH; Owner: UNIVISION CLEVELAND LLC)
- WEWS-TV (Channel 5; CLEVELAND, OH; Owner: SCRIPPS HOWARD BROADCASTING COMPANY)
- WXOX-LP (Channel 65; CLEVELAND, OH; Owner: VENTURE TECHNOLOGIES GROUP, LLC)
- W53AX (Channel 53; CLEVELAND, OH; Owner: WORD OF GOD FELLOWSHIP, INC.)
- WUAB (Channel 43; LORAIN, OH; Owner: RAYCOM NATIONAL, INC.)
- WJW (Channel 8; CLEVELAND, OH; Owner: WJW LICENSE, INC.)
- WVIZ (Channel 25; CLEVELAND, OH; Owner: IDEASTREAM)
- WRAP-CA (Channel 32; CLEVELAND, OH; Owner: COMMERCIAL BROADCASTING CORP.)
- WVPX (Channel 23; AKRON, OH; Owner: PAXSON AKRON LICENSE, INC.)
- WEAO (Channel 49; AKRON, OH; Owner: NORTHEASTERN EDUCATIONAL TELEVISION OF OHIO, INC.)
- W51BI (Channel 51; KIRTLAND, OH; Owner: TRINITY BROADCASTING NETWORK)
- WAKN-LP (Channel 11; AKRON, OH; Owner: AKRON TELEVISION, INC.)
- WOAC (Channel 67; CANTON, OH; Owner: WRAY, INC.)
- WDLI (Channel 17; CANTON, OH; Owner: TRINITY BROADCASTING NETWORK, INC.)
- WAOH-LP (Channel 29; AKRON, OH; Owner: MEDIA-COM TELEVISION, INC.)
- WKBN-TV (Channel 27; YOUNGSTOWN, OH; Owner: PIEDMONT TELEVISION OF YOUNGSTOWN LICENSE LLC)
- National Bridge Inventory (NBI) Statistics
- 24Number of bridges
- 308ft / 93.7mTotal length
- $180,000Total costs
- 369,533Total average daily traffic
- 31,046Total average daily truck traffic
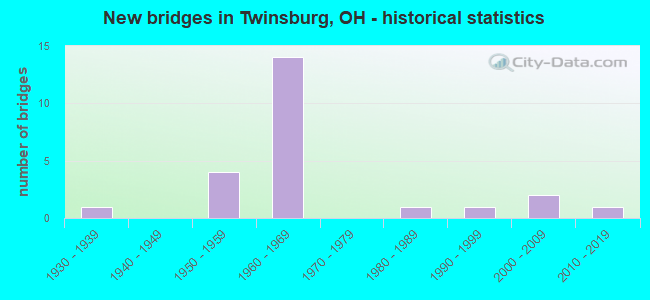
- New bridges - historical statistics
- 11930-1939
- 41950-1959
- 141960-1969
- 11980-1989
- 11990-1999
- 22000-2009
- 12010-2019
FCC Registered Antenna Towers:
72 (See the full list of FCC Registered Antenna Towers in Twinsburg)FCC Registered Private Land Mobile Towers:
3 (See the full list of FCC Registered Private Land Mobile Towers in Twinsburg, OH)FCC Registered Broadcast Land Mobile Towers:
24 (See the full list of FCC Registered Broadcast Land Mobile Towers)FCC Registered Microwave Towers:
16 (See the full list of FCC Registered Microwave Towers in this town)FCC Registered Paging Towers:
1 (See the full list of FCC Registered Paging Towers)FCC Registered Amateur Radio Licenses:
80 (See the full list of FCC Registered Amateur Radio Licenses in Twinsburg)FAA Registered Aircraft:
3- Aircraft: RAYTHEON AIRCRAFT COMPANY HAWKER 800XP (Category: Land, Engines: 2, Seats: 15, Weight: Up to 12,499 Pounds), Engine: HONEYWELL TFE-731-SER (4000 Pounds of Thrust) (Turbo-fan)
N-Number: 277RS, N277RS, N-277RS, Serial Number: 258693, Year manufactured: 2004, Airworthiness Date: 12/13/2004, Certificate Issue Date: 07/18/2019
Registrant (LLC): First Class Air LLC, 2181 Enterprise Pkwy, Twinsburg, OH 44087 - Aircraft: THOMAS SLED TITAN TORANADO II-S (Category: Land, Seats: 2, Weight: Up to 12,499 Pounds), Engine: JABIRU 2200A (85 HP) (4 Cycle)
N-Number: 5122T, N5122T, N-5122T, Serial Number: S09XXXS0HK0537, Year manufactured: 2014, Airworthiness Date: 04/12/2015, Certificate Issue Date: 02/03/2015
Registrant (Individual): Michael Carroll, 1769 Maplegrove Dr, Twinsburg, OH 44087 - Aircraft: PIPER J3C-65 (Category: Land, Seats: 2, Weight: Up to 12,499 Pounds, Speed: 67 mph), Engine: CONT MOTOR A&C65 SERIES (65 HP) (Reciprocating)
N-Number: 30672, N30672, N-30672, Serial Number: 5042, Year manufactured: 1940
Registrant (Partnership): Flying Club Universal, , Twinsburg, OH 44087
Deregistered: Cancel Date: 01/24/2017
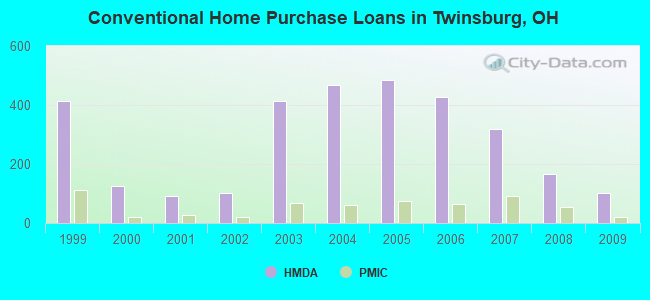
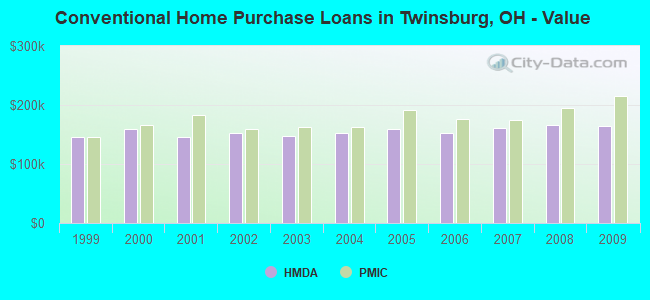
| Home Mortgage Disclosure Act Aggregated Statistics For Year 2009 (Based on 2 full and 2 partial tracts) | ||||||||||||||
| A) FHA, FSA/RHS & VA Home Purchase Loans | B) Conventional Home Purchase Loans | C) Refinancings | D) Home Improvement Loans | E) Loans on Dwellings For 5+ Families | F) Non-occupant Loans on < 5 Family Dwellings (A B C & D) | G) Loans On Manufactured Home Dwelling (A B C & D) | ||||||||
|---|---|---|---|---|---|---|---|---|---|---|---|---|---|---|
| Number | Average Value | Number | Average Value | Number | Average Value | Number | Average Value | Number | Average Value | Number | Average Value | Number | Average Value | |
| LOANS ORIGINATED | 80 | $176,205 | 103 | $163,913 | 441 | $168,663 | 4 | $35,215 | 0 | $0 | 7 | $93,344 | 3 | $175,667 |
| APPLICATIONS APPROVED, NOT ACCEPTED | 3 | $130,333 | 6 | $218,322 | 39 | $171,159 | 3 | $144,237 | 0 | $0 | 0 | $0 | 0 | $0 |
| APPLICATIONS DENIED | 9 | $195,983 | 10 | $130,221 | 145 | $179,906 | 12 | $63,000 | 0 | $0 | 2 | $154,775 | 0 | $0 |
| APPLICATIONS WITHDRAWN | 5 | $161,592 | 8 | $155,551 | 60 | $180,846 | 2 | $29,745 | 1 | $5,000,000 | 0 | $0 | 0 | $0 |
| FILES CLOSED FOR INCOMPLETENESS | 1 | $174,850 | 2 | $169,230 | 33 | $193,785 | 0 | $0 | 0 | $0 | 1 | $137,120 | 0 | $0 |
Detailed HMDA statistics for the following Tracts: 5301.02 , 5301.03, 5301.04
| Private Mortgage Insurance Companies Aggregated Statistics For Year 2009 (Based on 2 full and 2 partial tracts) | ||||
| A) Conventional Home Purchase Loans | B) Refinancings | |||
|---|---|---|---|---|
| Number | Average Value | Number | Average Value | |
| LOANS ORIGINATED | 19 | $215,194 | 8 | $189,834 |
| APPLICATIONS APPROVED, NOT ACCEPTED | 5 | $211,566 | 7 | $207,414 |
| APPLICATIONS DENIED | 4 | $171,492 | 4 | $217,138 |
| APPLICATIONS WITHDRAWN | 1 | $81,020 | 3 | $136,807 |
| FILES CLOSED FOR INCOMPLETENESS | 0 | $0 | 0 | $0 |
Detailed PMIC statistics for the following Tracts: 5301.02 , 5301.03, 5301.04
2002 - 2018 National Fire Incident Reporting System (NFIRS) incidents
- Fire incident types reported to NFIRS in Twinsburg, OH
- 74650.6%Structure Fires
- 46231.4%Outside Fires
- 26017.7%Mobile Property/Vehicle Fires
- 50.3%Other
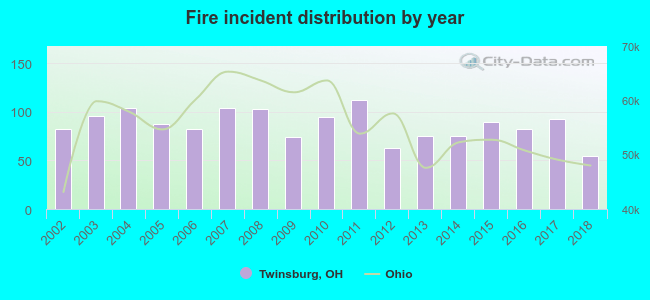 Based on the data from the years 2002 - 2018 the average number of fire incidents per year is 87. The highest number of reported fires - 112 took place in 2011, and the least - 55 in 2018. The data has a dropping trend.
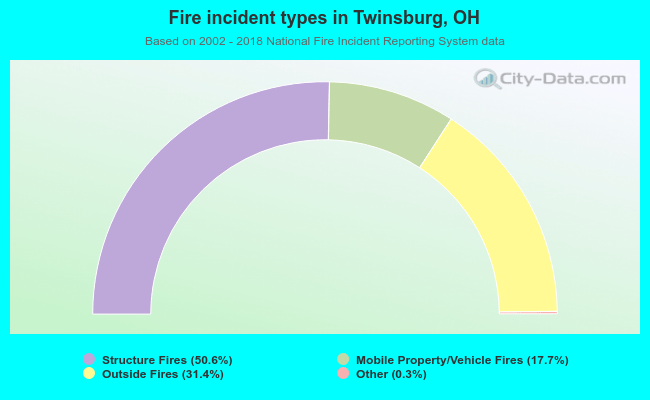 When looking into fire subcategories, the most reports belonged to: Structure Fires (50.6%), and Outside Fires (31.4%).
Fire-safe hotels and motels in Twinsburg, Ohio:
- Super 8 Motel Twinsburg, 8848 Twin HLS Dr, Twinsburg, Ohio 44087 , Phone: (330) 425-2889, Fax: (330) 963-6658
- Hilton Garden Inn Cleveland Twinsburg, 8971 Wilcox Dr, Twinsburg, Ohio 44087 , Phone: (330) 405-4488, Fax: (330) 405-4499
- Comfort Suites- Twinsburg, 2715 Creekside Dr, Twinsburg, Ohio 44087 , Phone: (330) 963-5909, Fax: (330) 963-5929
| Most common first names in Twinsburg, OH among deceased individuals | ||
| Name | Count | Lived (average) |
|---|---|---|
| John | 81 | 77.7 years |
| Mary | 71 | 82.9 years |
| William | 51 | 77.1 years |
| James | 46 | 75.9 years |
| Robert | 43 | 75.0 years |
| Helen | 43 | 79.5 years |
| George | 40 | 75.7 years |
| Margaret | 40 | 79.1 years |
| Joseph | 38 | 72.4 years |
| Charles | 36 | 75.7 years |
| Most common last names in Twinsburg, OH among deceased individuals | ||
| Last name | Count | Lived (average) |
|---|---|---|
| Johnson | 21 | 77.2 years |
| Smith | 17 | 71.6 years |
| Williams | 14 | 70.8 years |
| Miller | 12 | 77.4 years |
| Jones | 11 | 72.8 years |
| Moore | 10 | 64.8 years |
| Thomas | 10 | 78.9 years |
| Brown | 8 | 66.0 years |
| Allen | 6 | 67.8 years |
| Davis | 6 | 80.5 years |
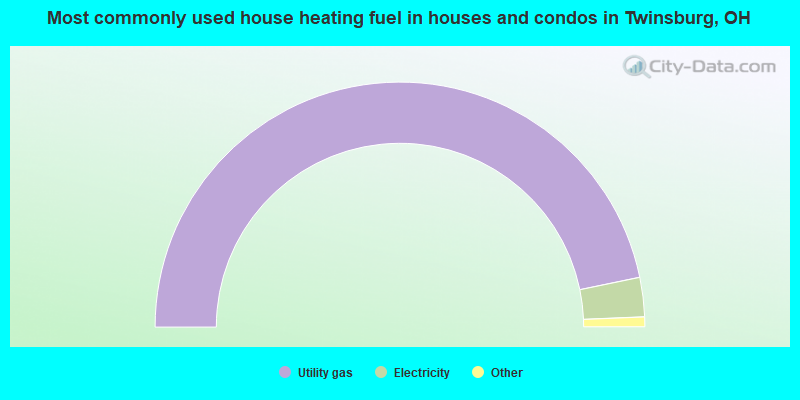
- 93.5%Utility gas
- 5.2%Electricity
- 0.8%Bottled, tank, or LP gas
- 0.3%Wood
- 0.2%Fuel oil, kerosene, etc.
- 0.1%No fuel used
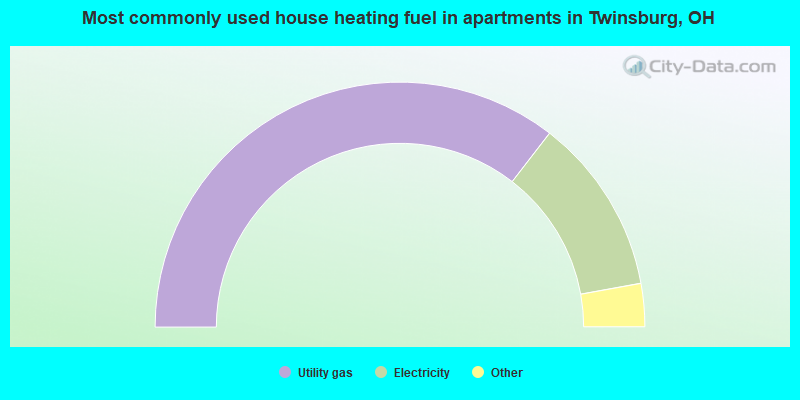
- 71.0%Utility gas
- 23.4%Electricity
- 3.9%Bottled, tank, or LP gas
- 1.7%Fuel oil, kerosene, etc.
Twinsburg compared to Ohio state average:
- Unemployed percentage significantly below state average.
- Foreign-born population percentage above state average.
- Length of stay since moving in significantly above state average.
- House age below state average.
- Percentage of population with a bachelor's degree or higher above state average.
Twinsburg on our top lists:
- #19 on the list of "Top 101 cities with largest percentage of males in industries: broadcasting, internet publishing, and telecommunications services (population 5,000+)"
- #19 on the list of "Top 101 cities with largest percentage of females in industries: broadcasting, internet publishing, and telecommunications services (population 5,000+)"
- #19 on the list of "Top 101 cities with largest percentage of males in industries: wholesale electronic markets and agents and brokers (population 5,000+)"
- #19 on the list of "Top 101 cities with largest percentage of females in industries: wholesale electronic markets and agents and brokers (population 5,000+)"
- #65 on the list of "Top 101 cities with the lowest number of burglaries per 100,000 residents (population 5,000+)"
- #37 (44087) on the list of "Top 101 zip codes with the largest percentage of Hungarian first ancestries (pop 5,000+)"
- #22 on the list of "Top 101 counties with the highest Sulfur Oxides Annual air pollution readings in 2012 (µg/m3)"
- #28 on the list of "Top 101 counties with the lowest percentage of residents relocating to foreign countries in 2011"
- #48 on the list of "Top 101 counties with the most Orthodox congregations"
- #53 on the list of "Top 101 counties with the highest number of infant deaths per 1000 residents 2007-2013 (pop. 50,000+)"
- #60 on the list of "Top 101 counties with the lowest percentage of residents that keep firearms around their homes"

|
|
Total of 486 patent applications in 2008-2024.