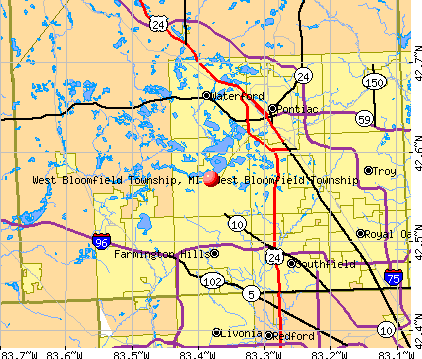
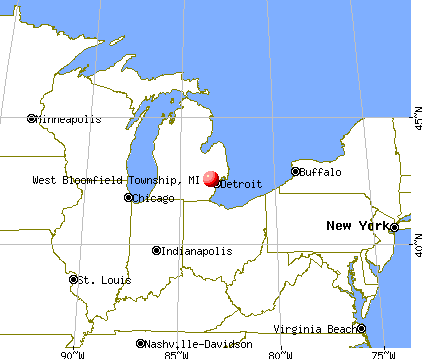
West Bloomfield Township, Michigan

West Bloomfield Township: Sunrise on middle Straits lake
West Bloomfield Township: Sunrise on middle Straits lake

West Bloomfield Township: Lazy Sunset on Green Lake

West Bloomfield Township: Sunrise on middle Straits lake
- add
your
Submit your own pictures of this place and show them to the world
- OSM Map
- General Map
- Google Map
- MSN Map
| Males: 32,049 | |
| Females: 33,100 |
| Median resident age: | 40.2 years |
| Michigan median age: | 35.5 years |
Zip codes: 48323.
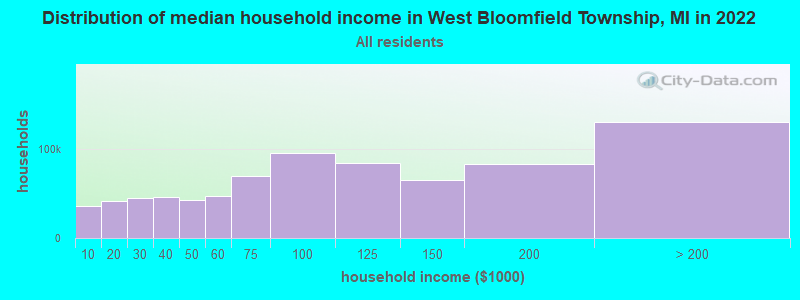
| West Bloomfield Township: | $134,136 |
| MI: | $66,986 |
Estimated per capita income in 2022: $73,056 (it was $44,885 in 2000)
West Bloomfield Township CDP income, earnings, and wages data
Estimated median house or condo value in 2022: $495,058 (it was $260,100 in 2000)
| West Bloomfield Township: | $495,058 |
| MI: | $224,400 |
Mean prices in 2022: all housing units: $385,845; detached houses: $411,064; townhouses or other attached units: $279,603; in 2-unit structures: $305,018; in 3-to-4-unit structures: $206,955; in 5-or-more-unit structures: $228,603; mobile homes: $52,080; occupied boats, rvs, vans, etc.: $331,049
West Bloomfield Township, MI residents, houses, and apartments details
Detailed information about poverty and poor residents in West Bloomfield Township, MI


Compare current foreclosures near West Bloomfield Township, MI:
| Photo | Address | Area | Beds / Baths | Price | Details |
|---|---|---|---|---|---|

|
#1
Montrose St
Detroit, MI 48227
|
1,310 sq. feet
|
1 baths 3 beds |
$95,500
|
show details |

|
#2
Desoto St
Detroit, MI 48238
|
1,500 sq. feet
|
1 baths 3 beds |
$71,250
|
show details |

|
#3
N Kane St
Detroit, MI 48223
|
954 sq. feet
|
1 baths 3 beds |
$125,000
|
show details |

|
#4
2nd Ave
Pontiac, MI 48340
|
959 sq. feet
|
1 baths 3 beds |
$52,500
|
show details |

|
#5
Pleasure St
Milford, MI 48381
|
1,182 sq. feet
|
1 baths 2 beds |
$268,500
|
show details |

|
#6
Kentfield St
Detroit, MI 48219
|
1,913 sq. feet
|
2 baths 5 beds |
$83,600
|
show details |

|
#7
Oak Hill Dr # 59
Waterford, MI 48329
|
1,024 sq. feet
|
1 baths 1 beds |
$164,500
|
show details |

|
#8
Danbury St
Highland Park, MI 48203
|
728 sq. feet
|
1 baths - beds |
$14,900
|
show details |

|
#9
Genella St
Waterford, MI 48328
|
1,013 sq. feet
|
1 baths 3 beds |
show details | |

|
#10
Cambridge Blvd
Southfield, MI 48076
|
2,211 sq. feet
|
2 baths 3 beds |
show details |
| Photo | Address | Area | Beds / Baths | Price | Details |
|---|---|---|---|---|---|

|
#11
Court St
Pontiac, MI 48342
|
900 sq. feet
|
1 baths 3 beds |
show details | |

|
#12
Glastonbury Ave
Detroit, MI 48223
|
1,279 sq. feet
|
1 baths 3 beds |
show details | |

|
#13
W Chicago St
Livonia, MI 48150
|
1,029 sq. feet
|
1 baths 3 beds |
show details | |

|
#14
Pinehurst St
Detroit, MI 48221
|
1,587 sq. feet
|
1 baths 3 beds |
show details | |

|
#15
Smithfield Rd
Farmington, MI 48335
|
2,390 sq. feet
|
3 baths 3 beds |
show details | |

|
#16
Bishop
Highland, MI 48357
|
- sq. feet
|
1 baths 3 beds |
show details | |

|
#17
Coral Gables Ave
Southfield, MI 48076
|
2,024 sq. feet
|
2 baths 3 beds |
show details | |

|
#18
Artesian St
Detroit, MI 48223
|
1,321 sq. feet
|
1 baths 3 beds |
show details | |

|
#19
Voorheis St
Pontiac, MI 48341
|
1,205 sq. feet
|
1 baths 2 beds |
show details | |

|
#20
Irving St
Livonia, MI 48152
|
1,610 sq. feet
|
2 baths 4 beds |
show details |
| Photo | Address | Area | Beds / Baths | Price | Details |
|---|---|---|---|---|---|

|
#21
Merriman Rd
Livonia, MI 48150
|
994 sq. feet
|
1 baths 3 beds |
show details | |

|
#22
7 Mile Rd
Livonia, MI 48152
|
2,114 sq. feet
|
2 baths 4 beds |
show details | |

|
#23
Mendota St
Detroit, MI 48221
|
879 sq. feet
|
1 baths 3 beds |
show details | |

|
#24
Beacon Dr
Farmington, MI 48336
|
1,231 sq. feet
|
1 baths 3 beds |
show details | |

|
#25
Hampshire St
Southfield, MI 48076
|
1,794 sq. feet
|
2 baths 3 beds |
show details | |

|
#26
Ivanhoe Ln
Southfield, MI 48034
|
3,345 sq. feet
|
2 baths 4 beds |
show details | |

|
#27
Oaklawn Dr
Pontiac, MI 48341
|
1,553 sq. feet
|
2 baths 3 beds |
show details | |

|
#28
Rutherford St
Detroit, MI 48227
|
1,186 sq. feet
|
1 baths 3 beds |
show details | |

|
#29
Ravinewood Dr
Commerce Township, MI 48382
|
2,336 sq. feet
|
3 baths 4 beds |
show details | |

|
#30
Saline Dr
Waterford, MI 48329
|
1,010 sq. feet
|
1 baths 3 beds |
show details |
| Photo | Address | Area | Beds / Baths | Price | Details |
|---|---|---|---|---|---|

|
#31
Plainview Ave
Detroit, MI 48228
|
900 sq. feet
|
1 baths 2 beds |
show details | |

|
#32
Huling St
Utica, MI 48317
|
1,050 sq. feet
|
1 baths 3 beds |
show details | |

|
#33
W Shevlin Ave
Hazel Park, MI 48030
|
967 sq. feet
|
1 baths 3 beds |
show details | |

|
#34
Indigo Dr
Sterling Heights, MI 48310
|
1,628 sq. feet
|
2 baths 3 beds |
show details | |

|
#35
Fox Club Dr
Farmington, MI 48331
|
3,441 sq. feet
|
4 baths 4 beds |
show details | |

|
#36
Lonesome Lake Ct
Lake Orion, MI 48362
|
2,313 sq. feet
|
3 baths 4 beds |
show details | |

|
#37
Saline Dr
Waterford, MI 48329
|
1,056 sq. feet
|
1 baths 3 beds |
show details | |

|
#38
Woodmont Ave
Detroit, MI 48227
|
3,235 sq. feet
|
2 baths 4 beds |
show details | |

|
#39
Mann Rd
Waterford, MI 48329
|
1,040 sq. feet
|
1 baths 3 beds |
show details | |

|
#40
Bel Aire Dr
Highland, MI 48357
|
2,380 sq. feet
|
2 baths 4 beds |
show details |
| Photo | Address | Area | Beds / Baths | Price | Details |
|---|---|---|---|---|---|

|
#41
W Oxhill Dr
White Lake, MI 48386
|
1,988 sq. feet
|
1 baths 3 beds |
show details | |

|
#42
Goodison Place Dr
Rochester, MI 48306
|
3,305 sq. feet
|
4 baths 5 beds |
show details | |

|
#43
Hidden Rivers
Southfield, MI 48075
|
1,342 sq. feet
|
2 baths 2 beds |
show details | |

|
#44
Hamilton Dr
Bloomfield Hills, MI 48302
|
3,702 sq. feet
|
3 baths 3 beds |
show details | |

|
#45
Pennington Dr
Detroit, MI 48221
|
1,038 sq. feet
|
1 baths 3 beds |
show details | |

|
#46
Henry Ruff Rd
Livonia, MI 48150
|
1,073 sq. feet
|
1 baths 3 beds |
show details | |

|
#47
Fortune Dr
Waterford, MI 48329
|
1,200 sq. feet
|
1 baths 2 beds |
show details | |

|
#48
W Hazelhurst St
Ferndale, MI 48220
|
2,112 sq. feet
|
2 baths 3 beds |
show details | |

|
#49
N Connecticut Ave
Royal Oak, MI 48067
|
1,121 sq. feet
|
1 baths 3 beds |
show details | |

|
Check over 1 million property listings on Foreclosure.com!
|
browse all offers | |||

- 53,96083.2%White alone
- 5,0507.8%Asian alone
- 3,3275.1%Black alone
- 1,4132.2%Two or more races
- 9051.4%Hispanic
- 1270.2%Other race alone
- 690.1%American Indian alone
- 110.02%Native Hawaiian and Other
Pacific Islander alone
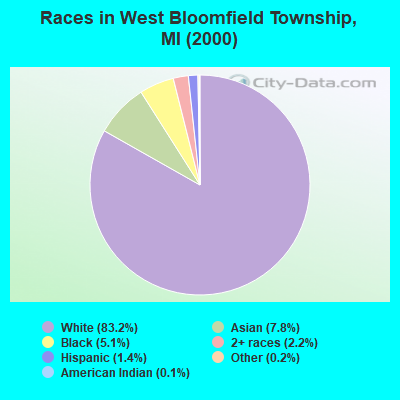
Races in West Bloomfield Township detailed stats: ancestries, foreign born residents, place of birth
According to our research of Michigan and other state lists, there were 22 registered sex offenders living in West Bloomfield Township, Michigan as of April 27, 2024.
The ratio of all residents to sex offenders in West Bloomfield Township is 2,961 to 1.
The ratio of registered sex offenders to all residents in this city is much lower than the state average.
The City-Data.com crime index weighs serious crimes and violent crimes more heavily. Higher means more crime, U.S. average is 246.1. It adjusts for the number of visitors and daily workers commuting into cities.
- means the value is smaller than the state average.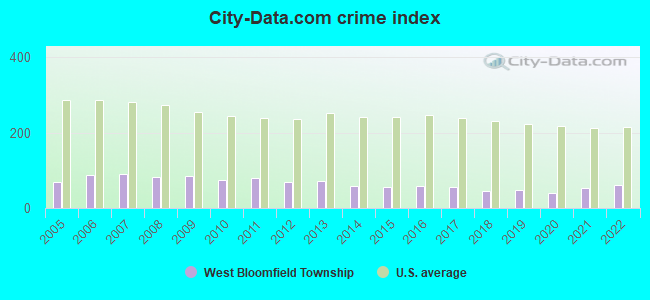
Crime rate in West Bloomfield Township detailed stats: murders, rapes, robberies, assaults, burglaries, thefts, arson
Full-time law enforcement employees in 2021, including police officers: 109 (78 officers - 70 male; 8 female).
| Officers per 1,000 residents here: | 1.19 |
| Michigan average: | 1.86 |
 Recent articles from our blog. Our writers, many of them Ph.D. graduates or candidates, create easy-to-read articles on a wide variety of topics.

 | Is Oakland County Michigan a nice place to live? Particularly on the far outskirts of Oakland County? (10 replies) |
| What Suburbs Are On The Rise? (70 replies) |
| Detroit suburbs (63 replies) |
| Trying to figure out Detroit suburbs... (93 replies) |
| Considering Farmington Hills.... (92 replies) |
| Looking for a suburb of Detroit - good place to raise kids, semi-upscale but not snobby (72 replies) |
Latest news from West Bloomfield Township, MI collected exclusively by city-data.com from local newspapers, TV, and radio stations
Ancestries: German (11.2%), Russian (9.4%), Polish (9.2%), English (7.5%), Irish (7.2%), United States (4.6%).
Current Local Time: EST time zone
Land area: 27.3 square miles.
Population density: 2,384 people per square mile (low).
12,241 residents are foreign born (11.2% Asia, 5.4% Europe).
| This place: | 18.9% |
| Michigan: | 5.3% |
| West Bloomfield Township CDP: | 1.3% ($3,492) |
| Michigan: | 1.3% ($1,461) |
Nearest city with pop. 200,000+: Detroit, MI  (19.0 miles , pop. 951,270).
Nearest city with pop. 1,000,000+: Chicago, IL (225.9 miles , pop. 2,896,016).
Nearest cities:
), ), ), )Latitude: 42.57 N, Longitude: 83.38 W
Daytime population change due to commuting: -17,613 (-27.2%)
Workers who live and work in this place: 4,388 (14.0%)
Area code commonly used in this area: 248
| Here: | 2.6% |
| Michigan: | 3.5% |
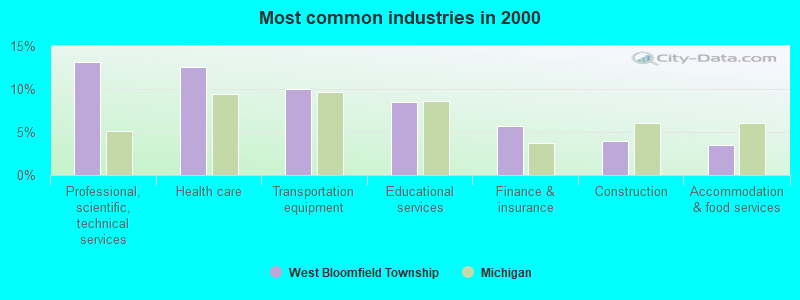
- Professional, scientific, technical services (13.2%)
- Health care (12.5%)
- Transportation equipment (10.0%)
- Educational services (8.5%)
- Finance & insurance (5.7%)
- Construction (4.0%)
- Accommodation & food services (3.5%)
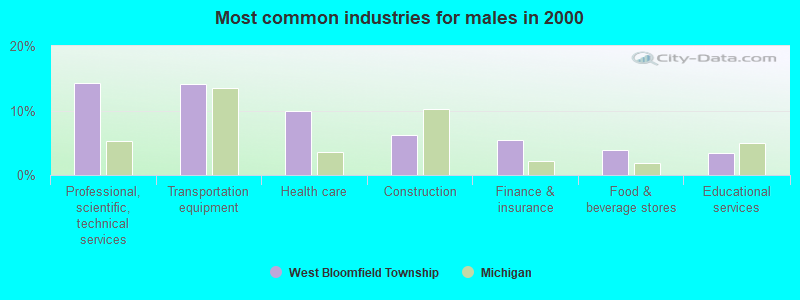
- Professional, scientific, technical services (14.3%)
- Transportation equipment (14.1%)
- Health care (9.9%)
- Construction (6.2%)
- Finance & insurance (5.4%)
- Food & beverage stores (3.9%)
- Educational services (3.5%)
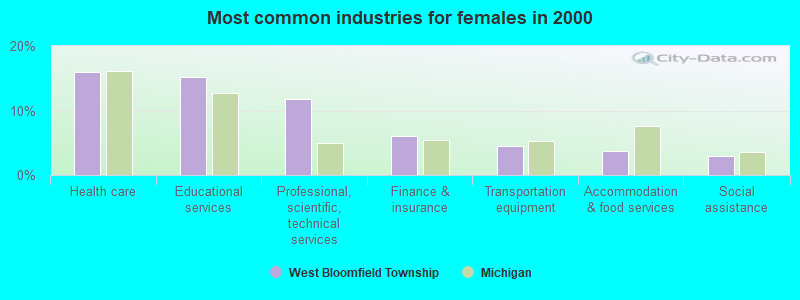
- Health care (16.0%)
- Educational services (15.2%)
- Professional, scientific, technical services (11.7%)
- Finance & insurance (6.1%)
- Transportation equipment (4.5%)
- Accommodation & food services (3.8%)
- Social assistance (3.0%)
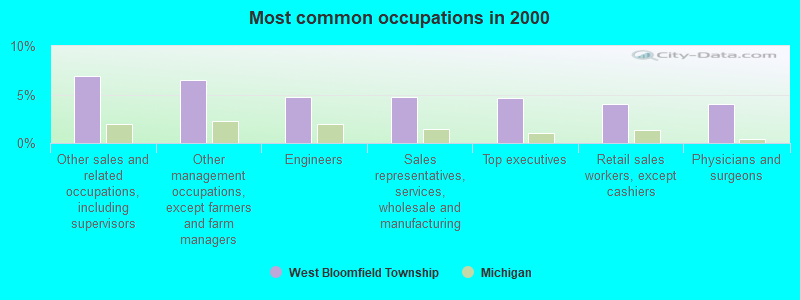
- Other sales and related occupations, including supervisors (6.9%)
- Other management occupations, except farmers and farm managers (6.5%)
- Engineers (4.8%)
- Sales representatives, services, wholesale and manufacturing (4.8%)
- Top executives (4.7%)
- Retail sales workers, except cashiers (4.1%)
- Physicians and surgeons (4.1%)
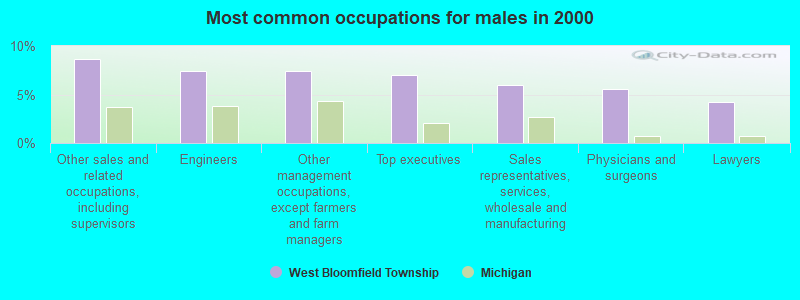
- Other sales and related occupations, including supervisors (8.6%)
- Engineers (7.5%)
- Other management occupations, except farmers and farm managers (7.4%)
- Top executives (7.0%)
- Sales representatives, services, wholesale and manufacturing (6.0%)
- Physicians and surgeons (5.6%)
- Lawyers (4.2%)
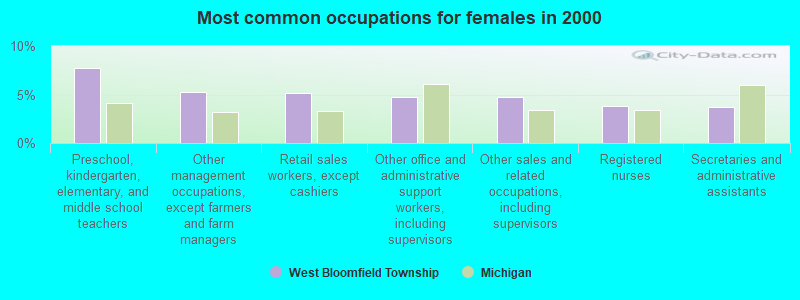
- Preschool, kindergarten, elementary, and middle school teachers (7.8%)
- Other management occupations, except farmers and farm managers (5.2%)
- Retail sales workers, except cashiers (5.2%)
- Other office and administrative support workers, including supervisors (4.8%)
- Other sales and related occupations, including supervisors (4.7%)
- Registered nurses (3.8%)
- Secretaries and administrative assistants (3.7%)
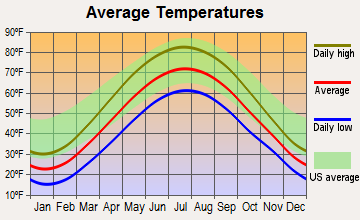
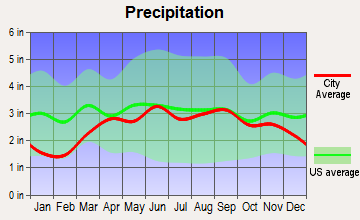
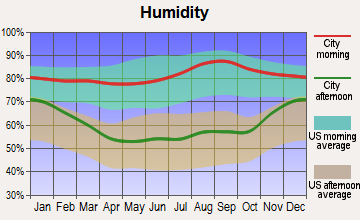
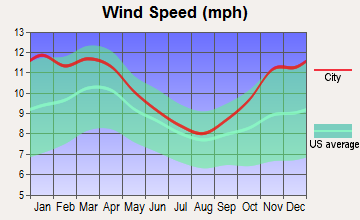
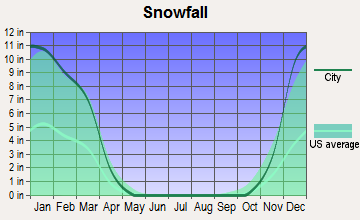
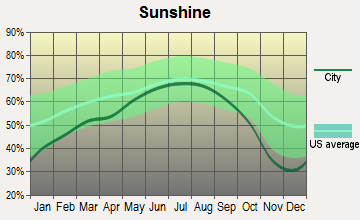
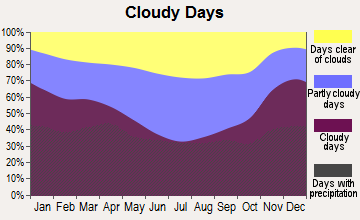
Average climate in West Bloomfield Township, Michigan
Based on data reported by over 4,000 weather stations
(lower is better)
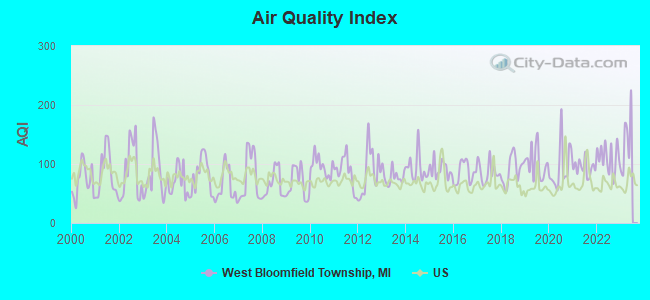
Air Quality Index (AQI) level in 2022 was 110. This is significantly worse than average.
| City: | 110 |
| U.S.: | 73 |
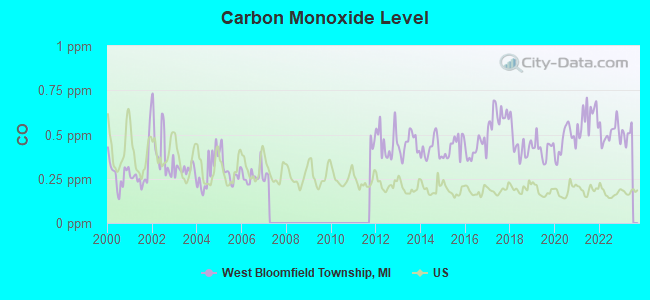
Carbon Monoxide (CO) [ppm] level in 2022 was 0.507. This is significantly worse than average. Closest monitor was 10.4 miles away from the city center.
| City: | 0.507 |
| U.S.: | 0.251 |
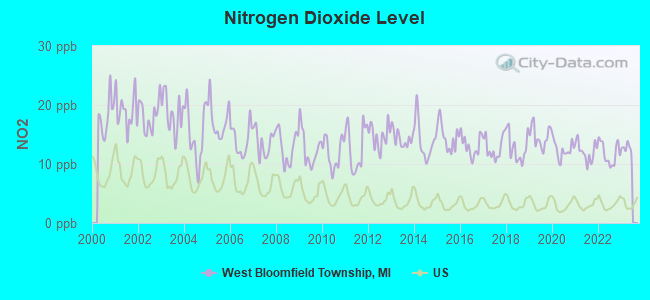
Nitrogen Dioxide (NO2) [ppb] level in 2022 was 11.8. This is significantly worse than average. Closest monitor was 8.2 miles away from the city center.
| City: | 11.8 |
| U.S.: | 5.1 |
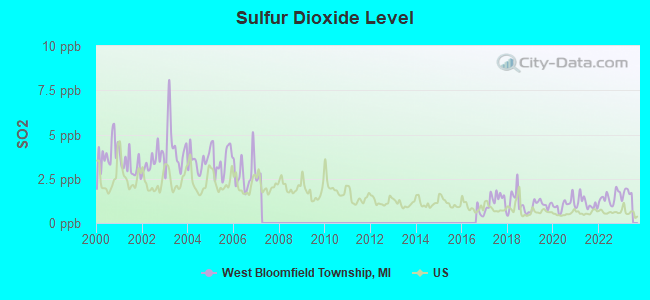
Sulfur Dioxide (SO2) [ppb] level in 2022 was 1.45. This is about average. Closest monitor was 8.2 miles away from the city center.
| City: | 1.45 |
| U.S.: | 1.51 |
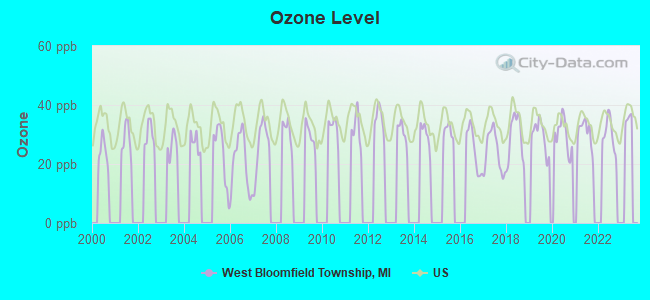
Ozone [ppb] level in 2022 was 30.1. This is about average. Closest monitor was 11.5 miles away from the city center.
| City: | 30.1 |
| U.S.: | 33.3 |
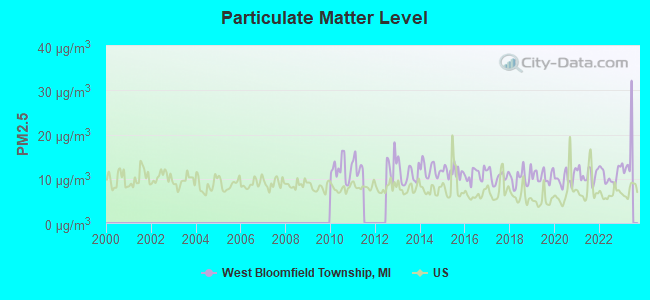
Particulate Matter (PM2.5) [µg/m3] level in 2022 was 10.7. This is worse than average. Closest monitor was 10.4 miles away from the city center.
| City: | 10.7 |
| U.S.: | 8.1 |
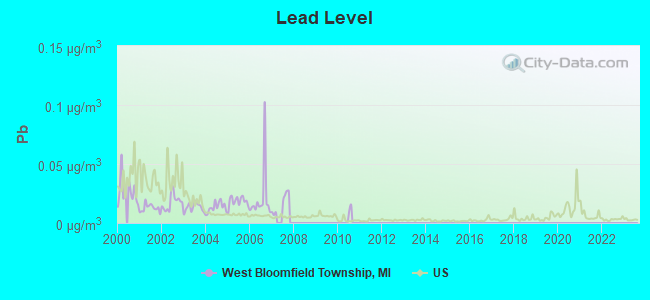
Lead (Pb) [µg/m3] level in 2007 was 0.0174. This is significantly worse than average. Closest monitor was 7.5 miles away from the city center.
| City: | 0.0174 |
| U.S.: | 0.0093 |
Tornado activity:
West Bloomfield Township-area historical tornado activity is above Michigan state average. It is 47% greater than the overall U.S. average.
On 3/20/1976, a category F4 (max. wind speeds 207-260 mph) tornado 2.9 miles away from the West Bloomfield Township place center killed one person and injured 55 people and caused between $5,000,000 and $50,000,000 in damages.
On 7/4/1957, a category F4 tornado 13.7 miles away from the place center injured 6 people and caused between $50,000 and $500,000 in damages.
Earthquake activity:
West Bloomfield Township-area historical earthquake activity is significantly above Michigan state average. It is 46% smaller than the overall U.S. average.On 9/25/1998 at 19:52:52, a magnitude 5.2 (4.8 MB, 4.3 MS, 5.2 LG, 4.5 MW, Depth: 3.1 mi, Class: Moderate, Intensity: VI - VII) earthquake occurred 170.5 miles away from West Bloomfield Township center
On 1/31/1986 at 16:46:43, a magnitude 5.0 (5.0 MB) earthquake occurred 132.2 miles away from the city center
On 7/12/1986 at 08:19:37, a magnitude 4.5 (4.5 MB, Class: Light, Intensity: IV - V) earthquake occurred 149.6 miles away from the city center
On 5/2/2015 at 16:23:07, a magnitude 4.2 (4.2 MW, Depth: 2.8 mi) earthquake occurred 107.1 miles away from the city center
On 7/27/1980 at 18:52:21, a magnitude 5.2 (5.1 MB, 4.7 MS, 5.0 UK, 5.2 UK) earthquake occurred 303.3 miles away from West Bloomfield Township center
On 8/23/2011 at 17:51:04, a magnitude 5.8 (5.8 MW, Depth: 3.7 mi) earthquake occurred 431.7 miles away from the city center
Magnitude types: regional Lg-wave magnitude (LG), body-wave magnitude (MB), surface-wave magnitude (MS), moment magnitude (MW)
Natural disasters:
The number of natural disasters in Oakland County (12) is smaller than the US average (15).Major Disasters (Presidential) Declared: 6
Emergencies Declared: 5
Causes of natural disasters: Storms: 6, Floods: 5, Tornadoes: 3, Winter Storms: 2, Blizzard: 1, Hurricane: 1, Power Outage: 1, Snowstorm: 1, Wind: 1, Other: 1 (Note: some incidents may be assigned to more than one category).

Hospitals and medical centers near West Bloomfield Township:
- OAKLAND HOME CARE, L L C (Home Health Center, about 2 miles away; W BLOOMFIELD, MI)
- ROYALCARE, INC (Home Health Center, about 2 miles away; W BLOOMFIELD, MI)
- TOTAL RENAL CARE, INC. (Dialysis Facility, about 2 miles away; WEST BLOOMFIELD, MI)
- WEST BLOOMFIELD NURSING AND CONV (Nursing Home, about 3 miles away; WEST BLOOMFIELD, MI)
- HENRY FORD WEST BLOOMFIELD HOSPITAL Acute Care Hospitals (about 3 miles away; W BLOOMFIELD, MI)
- BORTZ HEALTH CARE ON GREEN LAKE (Nursing Home, about 3 miles away; ORCHARD LAKE, MI)
- HEARTLAND-WEST BLOOMFIELD (Nursing Home, about 3 miles away; WEST BLOOMFIELD, MI)
Amtrak stations near West Bloomfield Township:
- 7 miles: PONTIAC (1600 WIDE TRACK DR.) . Services: partially wheelchair accessible, enclosed waiting area, public payphones, vending machines, free short-term parking, free long-term parking, call for taxi service, intercity bus service, public transit connection.
- 10 miles: BIRMINGHAM (449 S. ETON ST.) . Services: public payphones, free short-term parking, free long-term parking, call for taxi service, public transit connection.
- 14 miles: ROYAL OAK (201 S. SHERMAN DR.) . Services: enclosed waiting area, public payphones, vending machines, paid short-term parking, taxi stand, intercity bus service, public transit connection.
Colleges/universities with over 2000 students nearest to West Bloomfield Township:
- Oakland Community College (about 5 miles; Bloomfield Hills, MI; Full-time enrollment: 18,956)
- Baker College of Auburn Hills (about 10 miles; Auburn Hills, MI; FT enrollment: 2,284)
- Lawrence Technological University (about 10 miles; Southfield, MI; FT enrollment: 2,430)
- Schoolcraft College (about 11 miles; Livonia, MI; FT enrollment: 10,867)
- Oakland University (about 11 miles; Rochester Hills, MI; FT enrollment: 16,449)
- Madonna University (about 13 miles; Livonia, MI; FT enrollment: 3,212)
- University of Detroit Mercy (about 17 miles; Detroit, MI; FT enrollment: 3,406)
Points of interest:
Notable locations in West Bloomfield Township: Knollwood Country Club (A), Bay Pointe Golf Club (B), Bloomfield Avenue Shoppes (C), Twin Beach Country Club (D), Tam O'Shanter Country Club (E), Shenandoah Golf Club (F), Pine Lake Country Club (G), West Bloomfield Civic Center (H), West Bloomfield Medical Building (I), West Bloomfield Township Fire Station (J), West Bloomfield Township Hall (K), West Bloomfield Township Library (L), Sinai Maisel Women's Health Center (M), Henry Ford Medical Center - West Bloomfield (N), Holocaust Memorial Center (O), DMC-Sinai Health Center (P), West Bloomfield Fire Department Station 1 (Q), Providence Medical Center - West Bloomfield (R), Maple Grove Treatment Center (S), West Bloomfield Fire Department Station 2 (T). Display/hide their locations on the map
Shopping Centers: Knollwood Plaza Shopping Center (1), Orchard Mall Shopping Center (2), Gateway Center Shopping Center (3), Sylvan Shopping Center (4), Simbury Plaza Shopping Center (5), Westwind Lake Village Shops Shopping Center (6). Display/hide their locations on the map
Churches in West Bloomfield Township include: Church of Our Savior (A), Kirk in the Hills Presybterian Church (B), Saint Stephen Church (C). Display/hide their locations on the map
Cemeteries: Hosner Family Cemetery (1), Pine Lake Cemetery (2). Display/hide their locations on the map
Lakes and reservoirs: Quicksand Lake (A), Pleasant Lake (B), Pine Lake (C), Walnut Lake (D), Woodpecker Lake (E), Mud Lake (F), Morris Lake (G), Moon Lake (H). Display/hide their locations on the map
Parks in West Bloomfield Township include: Walter Flanders Historical Marker (1), Flanders Garage Historical Marker (2), Marshbank Metropolitan Park (3). Display/hide their locations on the map
Birthplace of: Melrose Bickerstaff - Female model, Corey Elkins - Ice hockey player.
| This place: | 2.7 people |
| Michigan: | 2.6 people |
| This place: | 77.7% |
| Whole state: | 68.5% |
| This place: | 2.3% |
| Whole state: | 5.3% |
Likely homosexual households (counted as self-reported same-sex unmarried-partner households)
- Lesbian couples: 0.2% of all households
- Gay men: 0.2% of all households
| This place: | 2.7% |
| Whole state: | 10.5% |
| This place: | 1.3% |
| Whole state: | 4.8% |
People in group quarters in West Bloomfield Township in 2000:
- 599 people in nursing homes
- 75 people in homes for the mentally retarded
- 51 people in other nonhousehold living situations
- 47 people in other group homes
- 6 people in homes for the mentally ill
Banks with branches in West Bloomfield Township (2011 data):
- Comerica Bank: Maple-Orchard Lake Road Branch at 5680 West Maple Road, branch established on 1967/09/25. Info updated 2011/07/29: Bank assets: $60,970.5 mil, Deposits: $48,300.9 mil, headquarters in Dallas, TX, positive income, Commercial Lending Specialization, 497 total offices, Holding Company: Comerica Incorporated
For population 15 years and over in West Bloomfield Township:
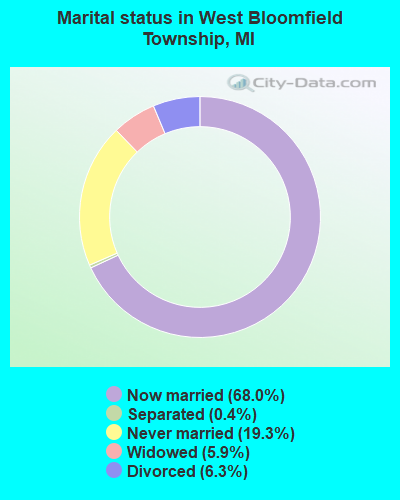
- Never married: 19.3%
- Now married: 68.0%
- Separated: 0.4%
- Widowed: 5.9%
- Divorced: 6.3%
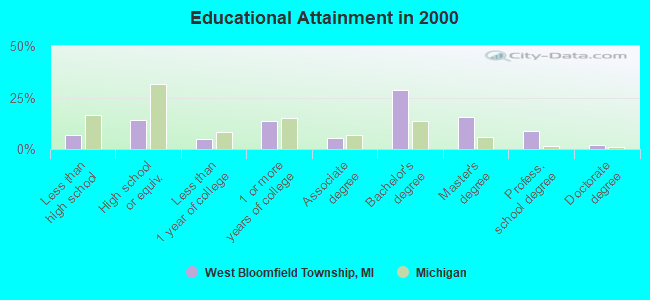
For population 25 years and over in West Bloomfield Township:
- High school or higher: 93.3%
- Bachelor's degree or higher: 55.3%
- Graduate or professional degree: 26.4%
- Unemployed: 2.5%
- Mean travel time to work (commute): 29.0 minutes
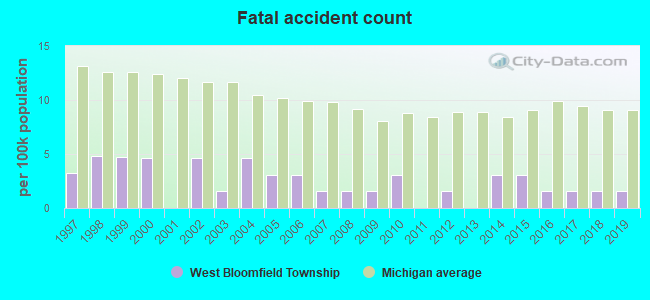
| Here: | 11.4 |
| Michigan average: | 11.3 |
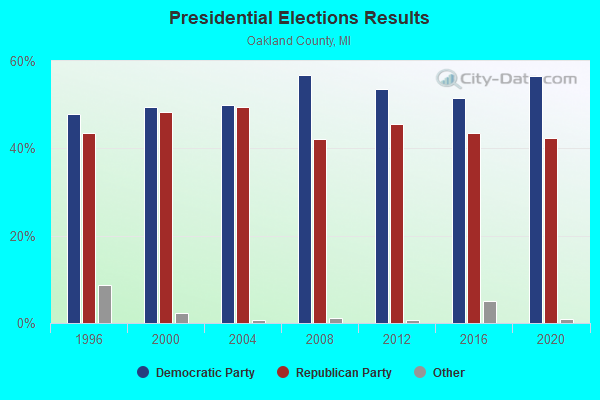
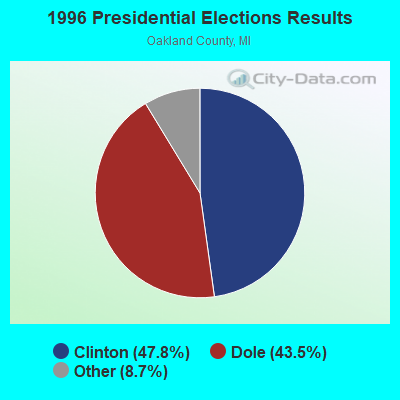
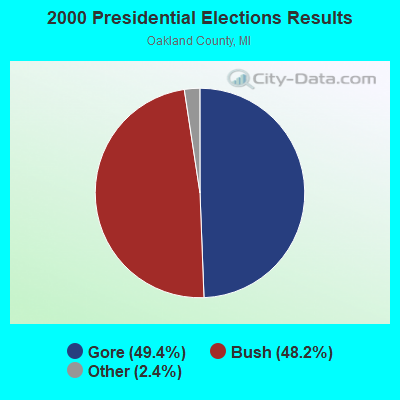
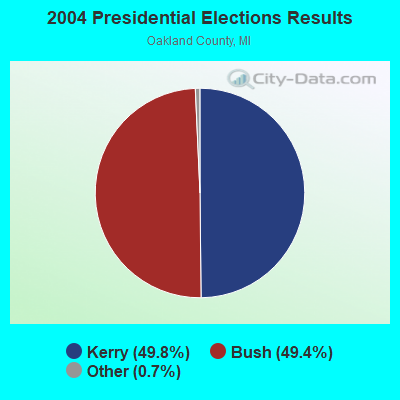
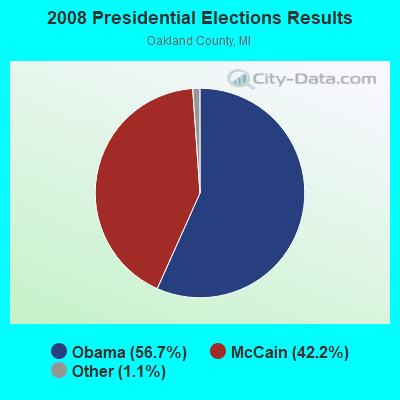
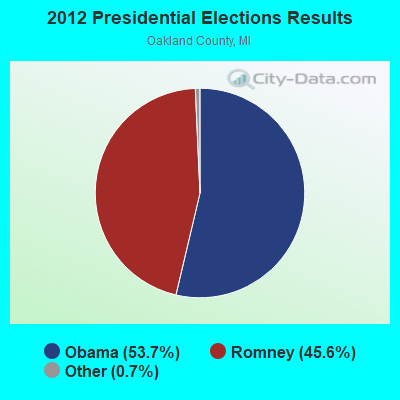
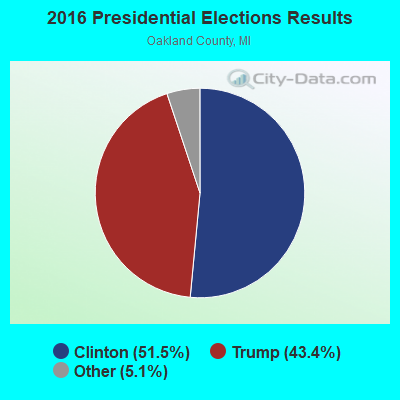
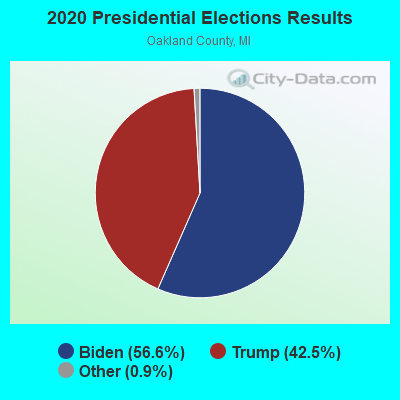
Graphs represent county-level data. Detailed 2008 Election Results
Political contributions by individuals in West Bloomfield Township, MI
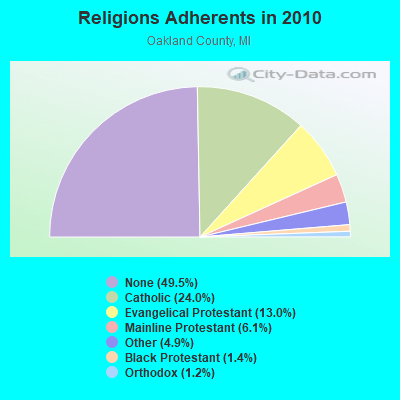
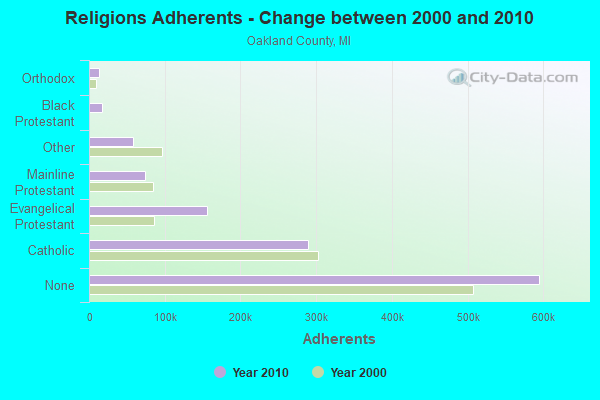
Religion statistics for West Bloomfield Township, MI (based on Oakland County data)
| Religion | Adherents | Congregations |
|---|---|---|
| Catholic | 289,116 | 64 |
| Evangelical Protestant | 155,826 | 319 |
| Mainline Protestant | 73,373 | 159 |
| Other | 58,590 | 117 |
| Black Protestant | 16,826 | 35 |
| Orthodox | 13,844 | 23 |
| None | 594,787 | - |
Food Environment Statistics:
| This county: | 2.44 / 10,000 pop. |
| State: | 2.34 / 10,000 pop. |
| This county: | 0.18 / 10,000 pop. |
| Michigan: | 0.18 / 10,000 pop. |
| This county: | 1.35 / 10,000 pop. |
| Michigan: | 1.52 / 10,000 pop. |
| Oakland County: | 2.43 / 10,000 pop. |
| State: | 2.99 / 10,000 pop. |
| This county: | 8.18 / 10,000 pop. |
| Michigan: | 6.80 / 10,000 pop. |
| Here: | 8.8% |
| State: | 9.7% |
| Oakland County: | 25.6% |
| State: | 29.7% |
| Oakland County: | 13.0% |
| Michigan: | 13.4% |
5.91% of this county's 2021 resident taxpayers lived in other counties in 2020 ($79,655 average adjusted gross income)
| Here: | 5.91% |
| Michigan average: | 5.83% |
0.01% of residents moved from foreign countries ($78 average AGI)
Oakland County: 0.01% Michigan average: 0.00%
Top counties from which taxpayers relocated into this county between 2020 and 2021:
| from Wayne County, MI | |
| from Macomb County, MI | |
| from Genesee County, MI |
6.21% of this county's 2020 resident taxpayers moved to other counties in 2021 ($89,748 average adjusted gross income)
| Here: | 6.21% |
| Michigan average: | 5.95% |
0.01% of residents moved to foreign countries ($55 average AGI)
Oakland County: 0.01% Michigan average: 0.00%
Top counties to which taxpayers relocated from this county between 2020 and 2021:
| to Wayne County, MI | |
| to Macomb County, MI | |
| to Genesee County, MI |
Businesses in West Bloomfield Township, MI
- CVS: 1
Strongest AM radio stations in West Bloomfield Township:
- WXYT (1270 AM; 50 kW; DETROIT, MI; Owner: INFINITY BROADCASTING CORP. OF DETROIT)
- WWJ (950 AM; 50 kW; DETROIT, MI; Owner: INFINITY BROADCASTING OPERATIONS, INC.)
- WJR (760 AM; 50 kW; DETROIT, MI; Owner: ABC, INC.)
- WCHB (1200 AM; 50 kW; TAYLOR, MI; Owner: RADIO ONE OF DETROIT, LLC)
- WFDF (910 AM; 50 kW; FLINT, MI; Owner: ABC, INC.)
- WDFN (1130 AM; 50 kW; DETROIT, MI; Owner: AMFM RADIO LICENSES, L.L.C.)
- WPON (1460 AM; 1 kW; WALLED LAKE, MI; Owner: FOREIGN RADIO PROGRAMS, INC.)
- WOAP (1080 AM; 50 kW; OWOSSO, MI)
- WDEO (990 AM; 9 kW; YPSILANTI, MI; Owner: WORD BROADCASTERS, INC.)
- WTKA (1050 AM; 10 kW; ANN ARBOR, MI; Owner: CAPSTAR TX LIMITED PARTNERSHIP)
- WUFL (1030 AM; daytime; 5 kW; STERLING HEIGHTS, MI; Owner: FAMILY LIFE BROADCASTING SYSTEM)
- WXDX (1310 AM; 5 kW; DEARBORN, MI; Owner: AMFM RADIO LICENSES, L.L.C.)
- WSDS (1480 AM; 4 kW; SALEM TOWNSHIP, MI; Owner: KOCH BROADCASTING CORP.)
Strongest FM radio stations in West Bloomfield Township:
- WRIF (101.1 FM; DETROIT, MI; Owner: GREATER BOSTON RADIO, INC.)
- WKRK-FM (97.1 FM; DETROIT, MI; Owner: INFINITY BROADCASTING OPERATIONS, INC.)
- WYCD (99.5 FM; DETROIT, MI; Owner: INFINITY BROADCASTING CORPORATION OF MICHIGAN)
- WMGC-FM (105.1 FM; DETROIT, MI; Owner: GREATER BOSTON RADIO, INC.)
- WCSX (94.7 FM; BIRMINGHAM, MI; Owner: GREATER BOSTON RADIO, INC.)
- WDTJ (105.9 FM; DETROIT, MI; Owner: RADIO ONE OF DETROIT, LLC)
- WBLD (89.3 FM; ORCHARD LAKE, MI; Owner: WEST BLOOMFIELD SCHOOL DISTRICT)
- WDRQ (93.1 FM; DETROIT, MI; Owner: ABC, INC.)
- WDVD (96.3 FM; DETROIT, MI; Owner: ABC, INC.)
- WBFH (88.1 FM; BLOOMFIELD HILLS, MI; Owner: BLOOMFIELD HILLS SCHOOL DISTRICT)
- WKQI (95.5 FM; DETROIT, MI; Owner: AMFM RADIO LICENSES, L.L.C.)
- WNIC (100.3 FM; DEARBORN, MI; Owner: AMFM RADIO LICENSES, L.L.C.)
- WMUZ (103.5 FM; DETROIT, MI; Owner: WMUZ RADIO, INC.)
- WMXD (92.3 FM; DETROIT, MI; Owner: AMFM RADIO LICENSES, L.L.C.)
- WVMV (98.7 FM; DETROIT, MI; Owner: INFINITY BROADCASTING OPERATIONS, INC.)
- WDTW (106.7 FM; DETROIT, MI; Owner: AMFM RADIO LICENSES, L.L.C.)
- WJLB (97.9 FM; DETROIT, MI; Owner: AMFM RADIO LICENSES, L.L.C.)
- WDTR-FM (90.9 FM; DETROIT, MI; Owner: BOARD OF EDUCATION, CITY OF DETROIT)
- WOMC (104.3 FM; DETROIT, MI; Owner: INFINITY BROADCASTING CORPORATION OF MICHIGAN)
- WXOU (88.3 FM; AUBURN HILLS, MI; Owner: OAKLAND UNIVERSITY)
TV broadcast stations around West Bloomfield Township:
- WKBD (Channel 50; DETROIT, MI; Owner: VIACOM STATIONS GROUP OF DETROIT INC.)
- WXYZ-TV (Channel 7; DETROIT, MI; Owner: CHANNEL 7 OF DETROIT, INC.)
- WJBK (Channel 2; DETROIT, MI; Owner: FOX TELEVISION STATIONS, INC.)
- WDIV-TV (Channel 4; DETROIT, MI; Owner: POST-NEWSWEEK STATIONS, MICHIGAN, INC.)
- WWJ-TV (Channel 62; DETROIT, MI; Owner: CBS BROADCASTING INC.)
- WDWB (Channel 20; DETROIT, MI; Owner: WXON LICENSE, INC.)
- WTVS (Channel 56; DETROIT, MI; Owner: DETROIT EDUC. TV FOUNDATION)
- WBXD-CA (Channel 5; DETROIT, MI; Owner: THE BOX WORLDWIDE LLC)
- WFUM (Channel 28; FLINT, MI; Owner: UNIVERSITY OF MICHIGAN)
- W33BY (Channel 68; DETROIT, MI; Owner: HIGHLAND PARK BROADCASTING, L.P.)
- WADL (Channel 38; MOUNT CLEMENS, MI; Owner: ADELL BROADCASTING CORPORATION)
- WPXD (Channel 31; ANN ARBOR, MI; Owner: PAXSON COMMUNICATIONS LICENSE COMPANY, LLC)
- WEYI-TV (Channel 25; SAGINAW, MI; Owner: WEYI BROADCASTING, LLC)
- WLPC-LP (Channel 26; DETROIT, MI; Owner: GLENN R. AND KARIN A. PLUMMER)
- WDWO-CA (Channel 18; DETROIT, MI; Owner: TCT OF MICHIGAN, INC.)
- National Bridge Inventory (NBI) Statistics
- 5Number of bridges
- 23ft / 7.4mTotal length
- $118,000Total costs
- 1,300Total average daily traffic
- 11Total average daily truck traffic
- 1,937Total future (year 2010) average daily traffic
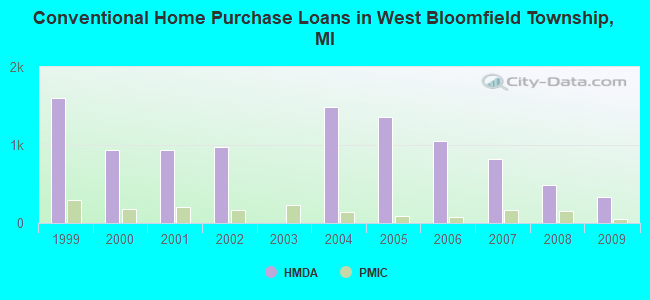
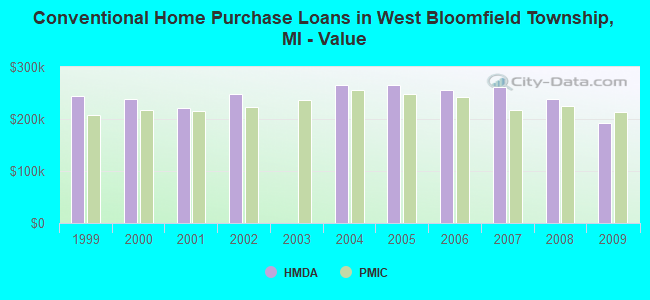
| Home Mortgage Disclosure Act Aggregated Statistics For Year 2009 (Based on 20 full tracts) | ||||||||||||
| A) FHA, FSA/RHS & VA Home Purchase Loans | B) Conventional Home Purchase Loans | C) Refinancings | D) Home Improvement Loans | F) Non-occupant Loans on < 5 Family Dwellings (A B C & D) | G) Loans On Manufactured Home Dwelling (A B C & D) | |||||||
|---|---|---|---|---|---|---|---|---|---|---|---|---|
| Number | Average Value | Number | Average Value | Number | Average Value | Number | Average Value | Number | Average Value | Number | Average Value | |
| LOANS ORIGINATED | 266 | $164,530 | 327 | $192,865 | 1,351 | $237,383 | 36 | $92,028 | 64 | $160,797 | 0 | $0 |
| APPLICATIONS APPROVED, NOT ACCEPTED | 20 | $166,650 | 41 | $226,024 | 159 | $263,704 | 8 | $129,875 | 10 | $96,300 | 0 | $0 |
| APPLICATIONS DENIED | 72 | $152,569 | 119 | $260,647 | 653 | $281,492 | 27 | $30,370 | 37 | $185,027 | 1 | $46,000 |
| APPLICATIONS WITHDRAWN | 53 | $172,962 | 41 | $218,561 | 264 | $255,572 | 9 | $164,667 | 12 | $190,083 | 0 | $0 |
| FILES CLOSED FOR INCOMPLETENESS | 6 | $189,000 | 14 | $343,000 | 87 | $260,391 | 1 | $96,000 | 5 | $125,400 | 0 | $0 |
Detailed mortgage data for all 20 tracts in West Bloomfield Township, MI
| Private Mortgage Insurance Companies Aggregated Statistics For Year 2009 (Based on 20 full tracts) | ||||||
| A) Conventional Home Purchase Loans | B) Refinancings | C) Non-occupant Loans on < 5 Family Dwellings (A & B) | ||||
|---|---|---|---|---|---|---|
| Number | Average Value | Number | Average Value | Number | Average Value | |
| LOANS ORIGINATED | 51 | $212,882 | 26 | $275,962 | 0 | $0 |
| APPLICATIONS APPROVED, NOT ACCEPTED | 24 | $230,750 | 18 | $250,722 | 1 | $315,000 |
| APPLICATIONS DENIED | 10 | $198,200 | 12 | $223,750 | 0 | $0 |
| APPLICATIONS WITHDRAWN | 5 | $208,200 | 7 | $223,857 | 0 | $0 |
| FILES CLOSED FOR INCOMPLETENESS | 0 | $0 | 1 | $220,000 | 0 | $0 |
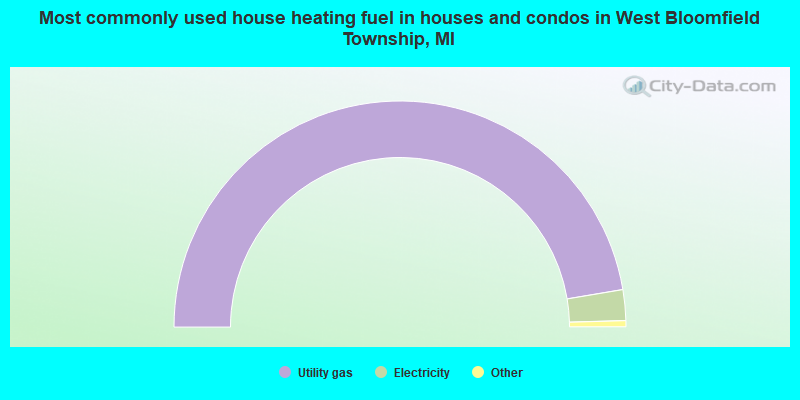
- 94.8%Utility gas
- 4.4%Electricity
- 0.5%Bottled, tank, or LP gas
- 0.3%Fuel oil, kerosene, etc.
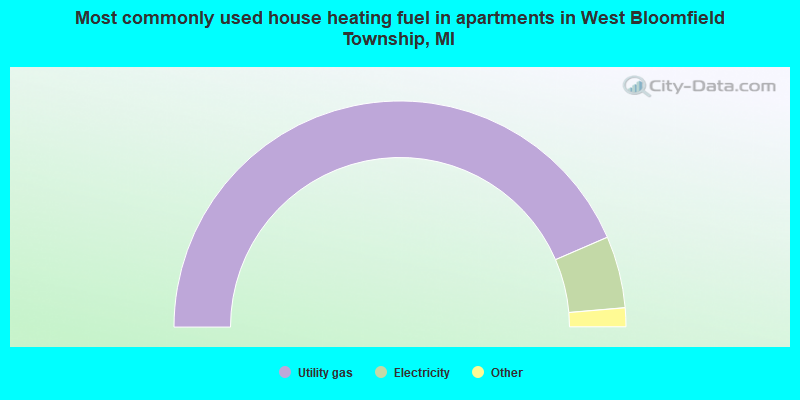
- 87.0%Utility gas
- 10.3%Electricity
- 2.1%Bottled, tank, or LP gas
- 0.4%Other fuel
- 0.3%Wood
West Bloomfield Township compared to Michigan state average:
- Median household income above state average.
- Median house value above state average.
- Unemployed percentage significantly below state average.
- Black race population percentage below state average.
- Hispanic race population percentage significantly below state average.
- Foreign-born population percentage significantly above state average.
- Renting percentage significantly below state average.
- Length of stay since moving in significantly above state average.
- Number of rooms per house significantly below state average.
- House age significantly below state average.
- Institutionalized population percentage significantly above state average.
- Percentage of population with a bachelor's degree or higher significantly above state average.
West Bloomfield Township on our top lists:
- #1 on the list of "Top 101 cities with largest percentage of females in occupations: other health diagnosing and treating practitioners and technical occupations (population 50,000+)"
- #1 on the list of "Top 101 cities with largest percentage of males in occupations: physicians and surgeons (population 50,000+)"
- #1 on the list of "Top 101 cities with largest percentage of males in occupations: other sales and related workers including supervisors (population 50,000+)"
- #1 on the list of "Top 101 cities with largest percentage of males in industries: other direct selling establishments (population 50,000+)"
- #1 on the list of "Top 101 cities with largest percentage of males in industries: health care (population 50,000+)"
- #1 on the list of "Top 101 cities with largest percentage of males in occupations: other health diagnosing and treating practitioners and technical occupations (population 50,000+)"
- #2 on the list of "Top 101 cities with largest percentage of males in industries: food and beverage stores (population 50,000+)"
- #2 on the list of "Top 101 cities with largest percentage of females in occupations: physicians and surgeons (population 50,000+)"
- #2 on the list of "Top 101 cities with largest percentage of females in occupations: therapists (population 50,000+)"
- #3 on the list of "Top 101 cities with the lowest percentage of single-parent households, population 50,000+"
- #3 on the list of "Top 101 cities with largest percentage of females in industries: jewelry, luggage, and leather goods stores (population 50,000+)"
- #3 on the list of "Top 101 cities with largest percentage of males in industries: hardware, plumbing and heating equipment, and supplies merchant wholesalers (population 50,000+)"
- #4 on the list of "Top 101 cities with largest percentage of males in industries: pharmacies and drug stores (population 50,000+)"
- #4 on the list of "Top 101 cities with largest percentage of males in industries: motor vehicles, parts and supplies merchant wholesalers (population 50,000+)"
- #5 on the list of "Top 101 cities with the smallest percentage of unmarried partner households (population 50,000+)"
- #5 on the list of "Top 101 cities with largest percentage of females in industries: metals and minerals, except petroleum, merchant wholesalers (population 50,000+)"
- #6 on the list of "Top 101 cities with the smallest percentage of likely homosexual households (counted as self-reported same-sex unmarried-partner households) (population 50,000+)"
- #6 on the list of "Top 101 cities with largest percentage of males in industries: transportation equipment (population 50,000+)"
- #7 on the list of "Top 101 cities with largest percentage of females in industries: personal and laundry services (population 50,000+)"
- #7 on the list of "Top 101 cities with largest percentage of females in industries: pharmacies and drug stores (population 50,000+)"
- #6 on the list of "Top 101 counties with the highest percentage of residents that visited a dentist within the past year"
- #12 on the list of "Top 101 counties with the most Orthodox congregations"
- #14 on the list of "Top 101 counties with the most Orthodox adherents"
- #38 on the list of "Top 101 counties with the most Mainline Protestant adherents"
- #39 on the list of "Top 101 counties with the most Catholic adherents"

|
Total of 5 patent applications in 2008-2024.