Yuma, Arizona
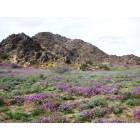
Yuma: Wildflowers Near Yuma, AZ
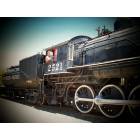
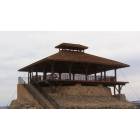
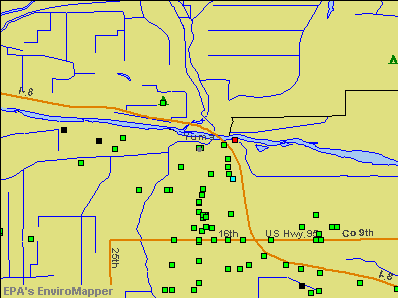
Yuma: Yuma Crossing
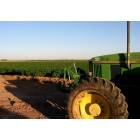
Yuma: Yuma Agriculture
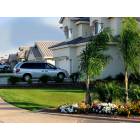
Yuma: Yuma Neighborhood
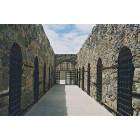
Yuma: Old Yuma Territorial Prison, Yuma, AZ
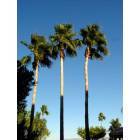
Yuma: 3 Palm Trees
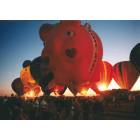
Yuma: Yuma hotair balloons
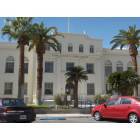
Yuma: Yuma County Courthouse, Yuma, AZ
Yuma: Yuma Prison
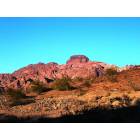
Yuma: Castle Dome, AZ
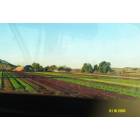
Yuma: Winter lettuce fields just outside Yuma, January 2005
- see
16
more - add
your
Submit your own pictures of this city and show them to the world
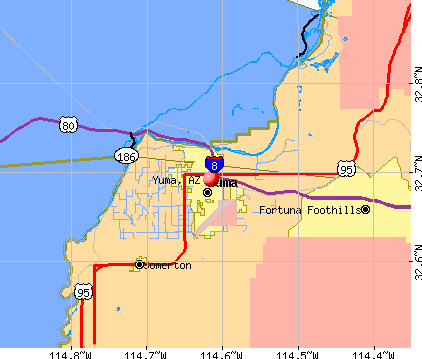
- OSM Map
- General Map
- Google Map
- MSN Map
Population change since 2000: +27.1%
| Males: 48,945 | |
| Females: 49,582 |
| Median resident age: | 33.6 years |
| Arizona median age: | 38.8 years |
Zip codes: 85365.
| Yuma: | $58,043 |
| AZ: | $74,568 |
Estimated per capita income in 2022: $31,467 (it was $16,730 in 2000)
Yuma city income, earnings, and wages data
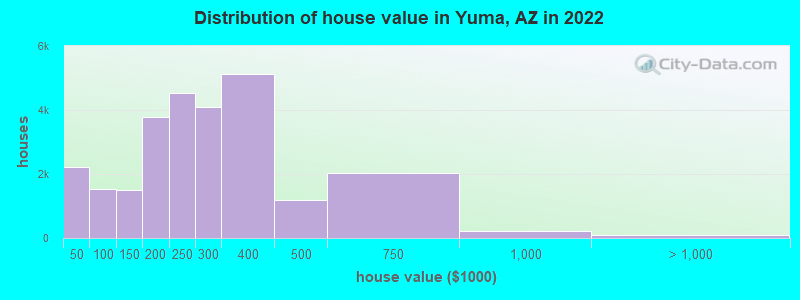
Estimated median house or condo value in 2022: $245,600 (it was $78,100 in 2000)
| Yuma: | $245,600 |
| AZ: | $402,800 |
Mean prices in 2022: all housing units: $242,438; detached houses: $278,737; townhouses or other attached units: $144,764; in 2-unit structures: $295,768; in 3-to-4-unit structures: $152,221; in 5-or-more-unit structures: $251,474; mobile homes: $90,239; occupied boats, rvs, vans, etc.: $39,875
Median gross rent in 2022: $943.
(9.3% for White Non-Hispanic residents, 18.5% for Black residents, 10.7% for Hispanic or Latino residents, 25.9% for American Indian residents, 15.0% for other race residents, 14.4% for two or more races residents)
Detailed information about poverty and poor residents in Yuma, AZ


Compare current foreclosures in Yuma, AZ:
| Photo | Address | Area | Beds / Baths | Price | Details |
|---|---|---|---|---|---|

|
#1
S Coconino Ln
Yuma, AZ 85364
|
1,008 sq. feet
|
1 baths 5 beds |
show details | |

|
#2
W 1st St
Yuma, AZ 85364
|
1,240 sq. feet
|
2 baths 3 beds |
show details | |

|
#3
Puestas Del Sol Ave
Yuma, AZ 85365
|
- sq. feet
|
2 baths 3 beds |
show details | |

|
#4
S 8th Ave
Yuma, AZ 85364
|
1,436 sq. feet
|
1 baths 2 beds |
show details | |

|
#5
W 21st Ln
Yuma, AZ 85364
|
1,089 sq. feet
|
2 baths 3 beds |
show details | |

|
#6
E San Marcos Dr
Yuma, AZ 85365
|
1,900 sq. feet
|
2 baths 3 beds |
show details | |

|
#7
S Recker Avenue
Yuma, AZ 85365
|
- sq. feet
|
2 baths 3 beds |
show details | |

|
#8
E 48th Dr
Yuma, AZ 85367
|
6,457 sq. feet
|
2 baths 2 beds |
show details | |

|
#9
S 23rd Ave
Yuma, AZ 85364
|
1,263 sq. feet
|
2 baths 4 beds |
show details | |

|
#10
N 8th Ave
Yuma, AZ 85364
|
- sq. feet
|
2 baths 3 beds |
show details |
| Photo | Address | Area | Beds / Baths | Price | Details |
|---|---|---|---|---|---|

|
#11
West 10th Lane
Yuma, AZ 85364
|
- sq. feet
|
2 baths 3 beds |
show details | |

|
#12
E County 16th St
Yuma, AZ 85365
|
4,565 sq. feet
|
4 baths 4 beds |
show details | |

|
#13
E 36th St
Yuma, AZ 85367
|
1,659 sq. feet
|
3 baths 4 beds |
show details | |

|
#14
S 34th Dr
Yuma, AZ 85364
|
2,857 sq. feet
|
3 baths 5 beds |
show details | |

|
#15
W Rosewood Dr
Yuma, AZ 85364
|
1,336 sq. feet
|
1 baths 3 beds |
show details | |

|
#16
S 12th Ave
Yuma, AZ 85364
|
914 sq. feet
|
1 baths 3 beds |
show details | |

|
#17
S 17th Ave
Yuma, AZ 85364
|
1,385 sq. feet
|
2 baths 3 beds |
show details | |

|
#18
S Puesta Del Sol Ave
Yuma, AZ 85365
|
1,280 sq. feet
|
2 baths 3 beds |
show details | |

|
#19
South Desert Willow Way
Yuma, AZ 85365
|
1,307 sq. feet
|
2 baths 4 beds |
show details | |

|
#20
W 29th Ln
Yuma, AZ 85364
|
1,601 sq. feet
|
2 baths 3 beds |
show details |
| Photo | Address | Area | Beds / Baths | Price | Details |
|---|---|---|---|---|---|

|
#21
S Madison Ave
Yuma, AZ 85364
|
1,344 sq. feet
|
1 baths 3 beds |
show details | |

|
#22
S Hummingbird Ln
Yuma, AZ 85365
|
1,056 sq. feet
|
2 baths 3 beds |
show details | |

|
#23
W 18th St
Yuma, AZ 85364
|
1,918 sq. feet
|
2 baths 3 beds |
show details | |

|
#24
W 20th Pl
Yuma, AZ 85364
|
972 sq. feet
|
2 baths 3 beds |
show details | |

|
#25
S 42nd Way
Yuma, AZ 85364
|
2,302 sq. feet
|
3 baths 4 beds |
show details | |

|
#26
E 53rd St
Yuma, AZ 85367
|
884 sq. feet
|
1 baths 1 beds |
show details | |

|
#27
E 26th St
Yuma, AZ 85367
|
2,045 sq. feet
|
2 baths 4 beds |
show details | |

|
#28
S 47th Ave
Yuma, AZ 85364
|
1,735 sq. feet
|
2 baths 4 beds |
show details | |

|
#29
S 46th Way
Yuma, AZ 85364
|
1,259 sq. feet
|
2 baths - beds |
show details | |

|
#30
W 4th St
Yuma, AZ 85364
|
- sq. feet
|
2 baths 4 beds |
show details |
| Photo | Address | Area | Beds / Baths | Price | Details |
|---|---|---|---|---|---|

|
#31
S 34th Dr
Yuma, AZ 85364
|
2,159 sq. feet
|
- baths - beds |
show details | |

|
#32
W 29th St
Yuma, AZ 85364
|
1,550 sq. feet
|
- baths - beds |
show details | |

|
#33
E 44th Pl
Yuma, AZ 85365
|
- sq. feet
|
- baths - beds |
show details | |

|
#34
S Del Golfo
Yuma, AZ 85367
|
- sq. feet
|
- baths - beds |
show details | |

|
#35
E 24th St Lot 127
Yuma, AZ 85365
|
- sq. feet
|
- baths - beds |
show details | |

|
#36
S 31st Dr
Yuma, AZ 85364
|
- sq. feet
|
- baths - beds |
show details | |

|
#37
E 32nd St, Lot #1116
Yuma, AZ 85365
|
- sq. feet
|
- baths - beds |
show details | |

|
#38
E 42nd Pl
Yuma, AZ 85365
|
- sq. feet
|
- baths - beds |
show details | |

|
#39
W 29th Ln
Yuma, AZ 85364
|
- sq. feet
|
- baths - beds |
show details | |

|
#40
W 8th St Apt 4
Yuma, AZ 85364
|
- sq. feet
|
- baths - beds |
show details |
| Photo | Address | Area | Beds / Baths | Price | Details |
|---|---|---|---|---|---|

|
#41
W Hillside Pl
Yuma, AZ 85364
|
1,150 sq. feet
|
- baths - beds |
show details | |

|
#42
S 5th Ave
Yuma, AZ 85364
|
1,104 sq. feet
|
- baths - beds |
show details | |

|
#43
W 19th St
Yuma, AZ 85364
|
1,106 sq. feet
|
- baths - beds |
show details | |

|
#44
S Avenue 3 3/4 E
Yuma, AZ 85365
|
- sq. feet
|
- baths - beds |
show details | |

|
#45
S Arizona Ave
Yuma, AZ 85364
|
- sq. feet
|
- baths - beds |
show details | |

|
#46
W 20th Pl
Yuma, AZ 85364
|
900 sq. feet
|
- baths - beds |
show details | |

|
#47
S 15th Ave
Yuma, AZ 85364
|
967 sq. feet
|
- baths - beds |
show details | |

|
#48
E Us Highway 95, Lot 189
Yuma, AZ 85365
|
- sq. feet
|
- baths - beds |
show details | |

|
#49
S Magnolia Ave, Trlr 12
Yuma, AZ 85364
|
- sq. feet
|
- baths - beds |
show details | |

|
Check over 1 million property listings on Foreclosure.com!
|
browse all offers | |||


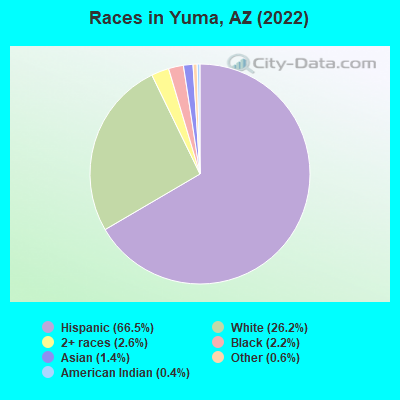
- 65,53366.5%Hispanic
- 25,85826.2%White alone
- 2,5672.6%Two or more races
- 2,1522.2%Black alone
- 1,4001.4%Asian alone
- 5830.6%Other race alone
- 4240.4%American Indian alone
According to our research of Arizona and other state lists, there were 152 registered sex offenders living in Yuma, Arizona as of April 26, 2024.
The ratio of all residents to sex offenders in Yuma is 624 to 1.
The ratio of registered sex offenders to all residents in this city is near the state average.
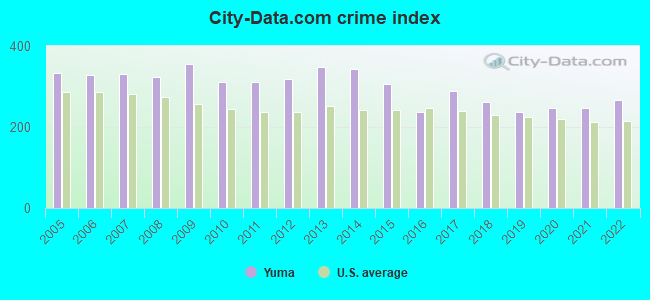
The City-Data.com crime index weighs serious crimes and violent crimes more heavily. Higher means more crime, U.S. average is 246.1. It adjusts for the number of visitors and daily workers commuting into cities.
- means the value is smaller than the state average.- means the value is about the same as the state average.
- means the value is bigger than the state average.
- means the value is much bigger than the state average.
Crime rate in Yuma detailed stats: murders, rapes, robberies, assaults, burglaries, thefts, arson
Full-time law enforcement employees in 2021, including police officers: 242 (132 officers - 114 male; 18 female).
| Officers per 1,000 residents here: | 1.31 |
| Arizona average: | 1.75 |
 Recent articles from our blog. Our writers, many of them Ph.D. graduates or candidates, create easy-to-read articles on a wide variety of topics.


Latest news from Yuma, AZ collected exclusively by city-data.com from local newspapers, TV, and radio stations
Ancestries: American (3.8%), German (3.8%), English (3.1%), Irish (1.9%).
Current Local Time: MST (no DST) time zone
Incorporated in 1914
Elevation: 152 feet
Land area: 106.7 square miles.
Population density: 924 people per square mile (low).
18,922 residents are foreign born (16.6% Latin America).
| This city: | 19.3% |
| Arizona: | 13.0% |
Median real estate property taxes paid for housing units with mortgages in 2022: $1,479 (0.6%)
Median real estate property taxes paid for housing units with no mortgage in 2022: $1,208 (0.5%)
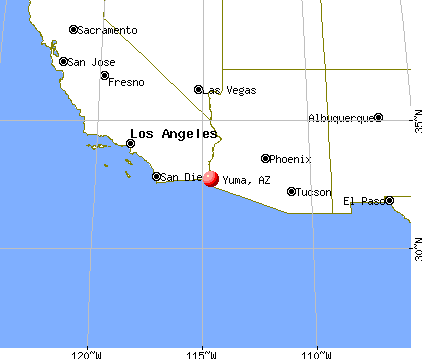
Nearest city with pop. 200,000+: San Diego, CA  (147.4 miles , pop. 1,223,400).
Nearest cities:
), ), ), ), ), )Latitude: 32.69 N, Longitude: 114.62 W
Daytime population change due to commuting: +10,924 (+11.1%)
Workers who live and work in this city: 30,030 (71.6%)
Area codes: 928, 520
Yuma tourist attractions:
- Lutes Casino - Yuma, AZ - Pool hall and eatery
- Cocopah Museum
- Imperial National Wildlife Refuge
- Mittry Lake Wildlife Area
- Quechan Indian Museum
- Yuma Valley Railway
- Arizona Historical Society Sanguinetti House Museum & Garden
- Picacho Peak State Park
- Yuma Art Center
- Yuma Crossing National Heritage Area
- Yuma Crossing State Historic Park
- Sunset Trail
- Hunter Trail
- Castle Dome
- Yuma Territorial Prison State Historic Park - Yuma, AZ - Historic site of an Old West prison
Yuma, Arizona accommodation & food services, waste management - Economy and Business Data
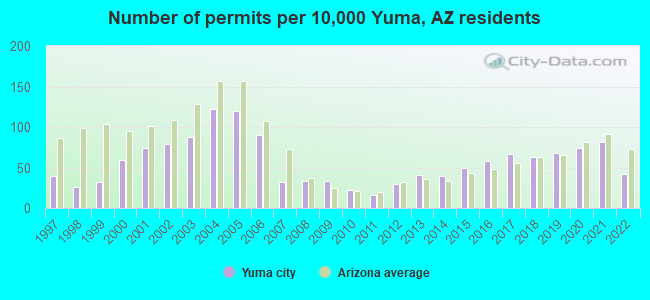
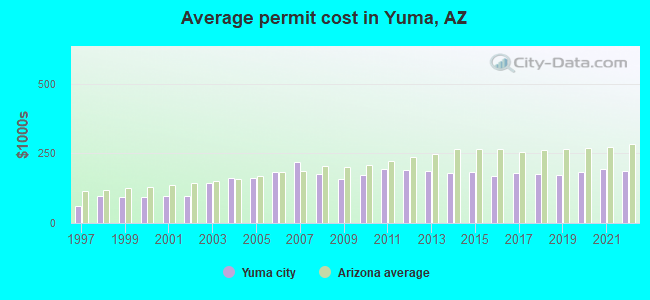
Single-family new house construction building permits:
- 2022: 323 buildings, average cost: $185,000
- 2021: 628 buildings, average cost: $194,900
- 2020: 577 buildings, average cost: $183,500
- 2019: 530 buildings, average cost: $170,600
- 2018: 485 buildings, average cost: $175,400
- 2017: 522 buildings, average cost: $177,700
- 2016: 449 buildings, average cost: $167,700
- 2015: 383 buildings, average cost: $181,800
- 2014: 300 buildings, average cost: $181,400
- 2013: 317 buildings, average cost: $186,200
- 2012: 230 buildings, average cost: $188,700
- 2011: 123 buildings, average cost: $194,400
- 2010: 172 buildings, average cost: $170,700
- 2009: 252 buildings, average cost: $158,100
- 2008: 256 buildings, average cost: $174,000
- 2007: 246 buildings, average cost: $217,900
- 2006: 699 buildings, average cost: $183,100
- 2005: 927 buildings, average cost: $160,200
- 2004: 945 buildings, average cost: $162,100
- 2003: 685 buildings, average cost: $143,000
- 2002: 616 buildings, average cost: $97,400
- 2001: 576 buildings, average cost: $95,600
- 2000: 461 buildings, average cost: $92,800
- 1999: 251 buildings, average cost: $92,000
- 1998: 202 buildings, average cost: $95,900
- 1997: 306 buildings, average cost: $61,000
| Here: | 11.5% |
| Arizona: | 3.8% |
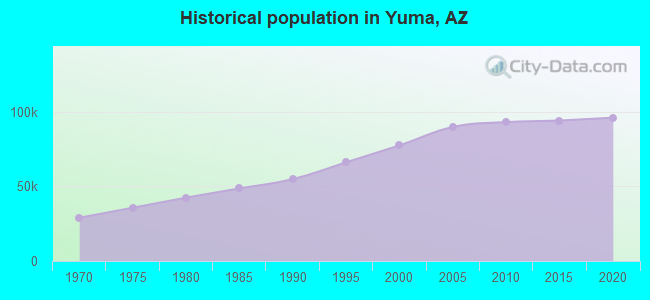
Population change in the 1990s: +17,138 (+28.4%).
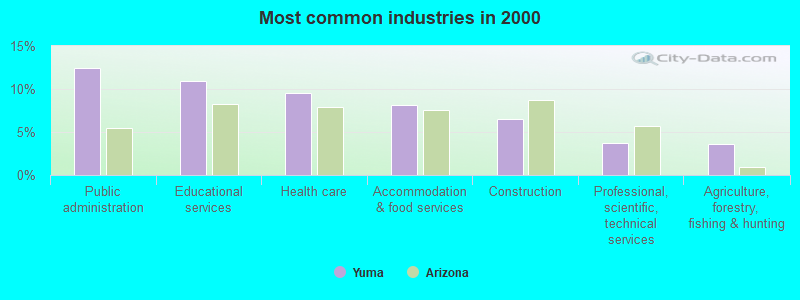
- Public administration (12.5%)
- Educational services (11.0%)
- Health care (9.5%)
- Accommodation & food services (8.1%)
- Construction (6.5%)
- Professional, scientific, technical services (3.7%)
- Agriculture, forestry, fishing & hunting (3.7%)
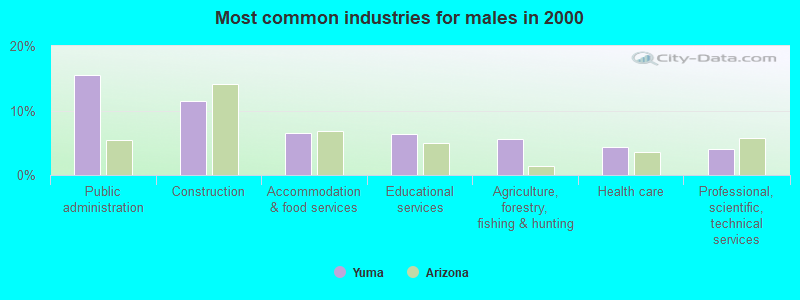
- Public administration (15.6%)
- Construction (11.4%)
- Accommodation & food services (6.5%)
- Educational services (6.3%)
- Agriculture, forestry, fishing & hunting (5.6%)
- Health care (4.3%)
- Professional, scientific, technical services (4.0%)
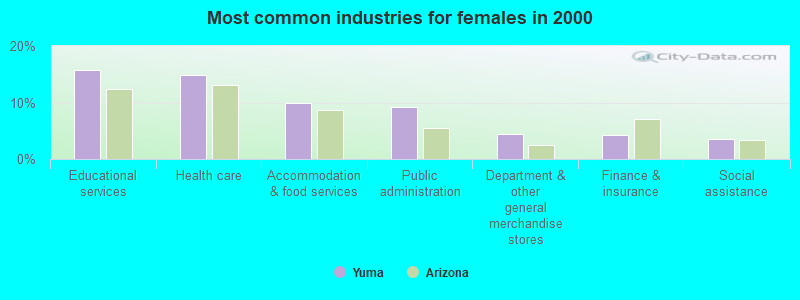
- Educational services (15.8%)
- Health care (14.9%)
- Accommodation & food services (9.8%)
- Public administration (9.2%)
- Department & other general merchandise stores (4.5%)
- Finance & insurance (4.3%)
- Social assistance (3.6%)
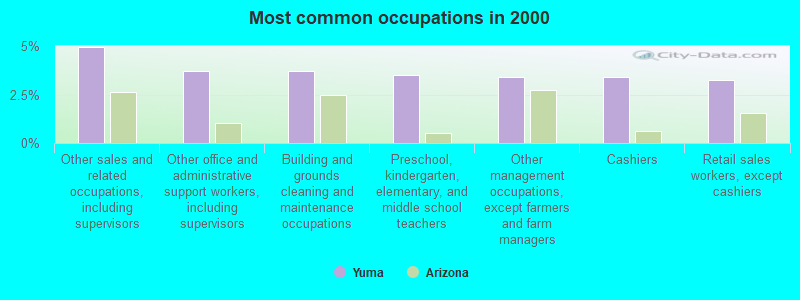
- Other sales and related occupations, including supervisors (4.9%)
- Other office and administrative support workers, including supervisors (3.7%)
- Building and grounds cleaning and maintenance occupations (3.7%)
- Preschool, kindergarten, elementary, and middle school teachers (3.5%)
- Other management occupations, except farmers and farm managers (3.4%)
- Cashiers (3.4%)
- Retail sales workers, except cashiers (3.3%)
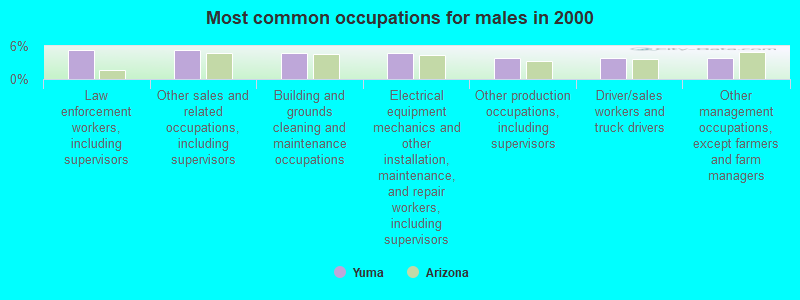
- Law enforcement workers, including supervisors (5.3%)
- Other sales and related occupations, including supervisors (5.2%)
- Building and grounds cleaning and maintenance occupations (4.8%)
- Electrical equipment mechanics and other installation, maintenance, and repair workers, including supervisors (4.7%)
- Other production occupations, including supervisors (3.9%)
- Driver/sales workers and truck drivers (3.8%)
- Other management occupations, except farmers and farm managers (3.8%)
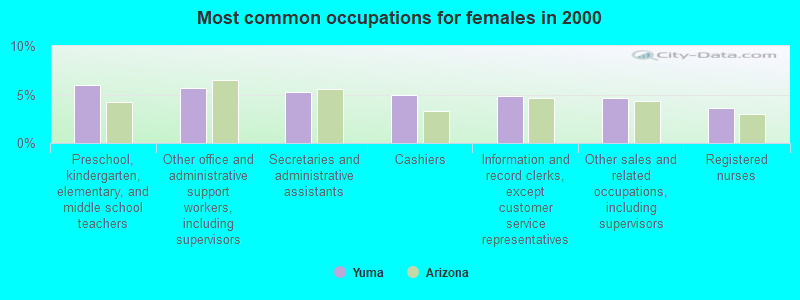
- Preschool, kindergarten, elementary, and middle school teachers (6.0%)
- Other office and administrative support workers, including supervisors (5.7%)
- Secretaries and administrative assistants (5.3%)
- Cashiers (5.0%)
- Information and record clerks, except customer service representatives (4.9%)
- Other sales and related occupations, including supervisors (4.7%)
- Registered nurses (3.6%)
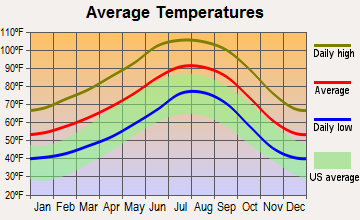
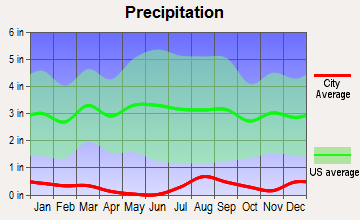
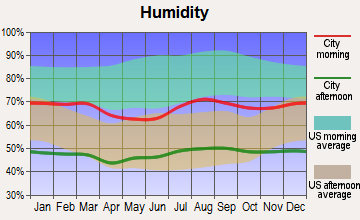
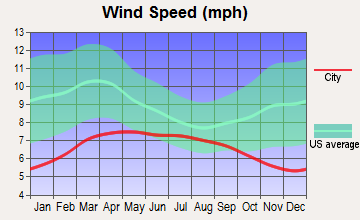
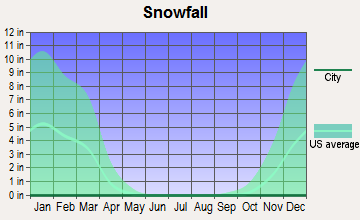
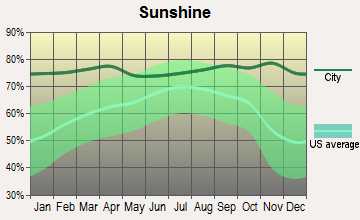
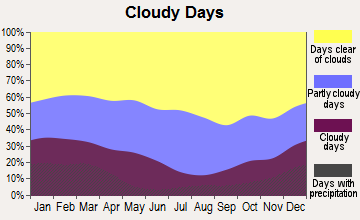
Average climate in Yuma, Arizona
Based on data reported by over 4,000 weather stations
|
|

(lower is better)
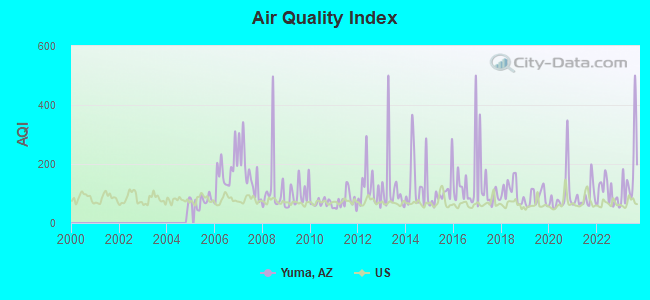
Air Quality Index (AQI) level in 2023 was 168. This is significantly worse than average.
| City: | 168 |
| U.S.: | 73 |
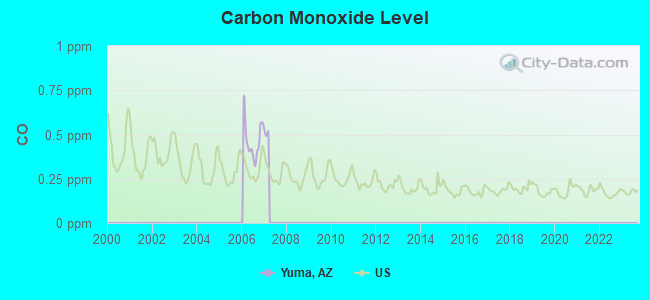
Carbon Monoxide (CO) [ppm] level in 2006 was 0.468. This is significantly worse than average. Closest monitor was 0.1 miles away from the city center.
| City: | 0.468 |
| U.S.: | 0.251 |
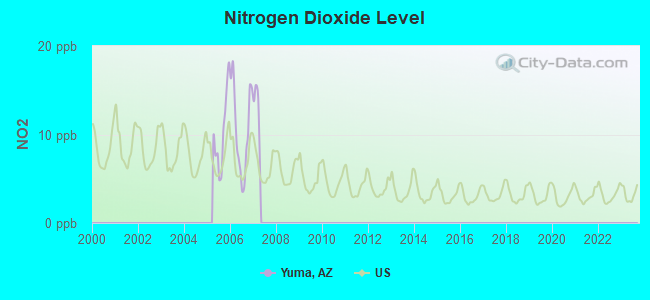
Nitrogen Dioxide (NO2) [ppb] level in 2006 was 10.6. This is significantly worse than average. Closest monitor was 8.2 miles away from the city center.
| City: | 10.6 |
| U.S.: | 5.1 |
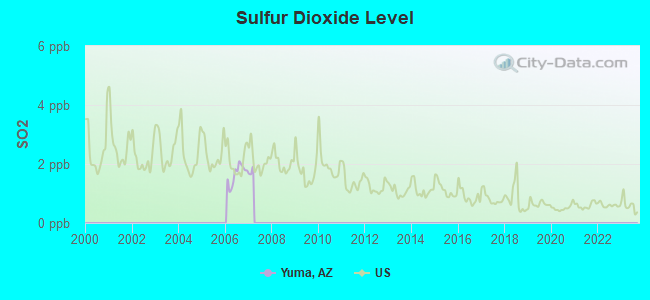
Sulfur Dioxide (SO2) [ppb] level in 2006 was 1.65. This is about average. Closest monitor was 0.1 miles away from the city center.
| City: | 1.65 |
| U.S.: | 1.51 |
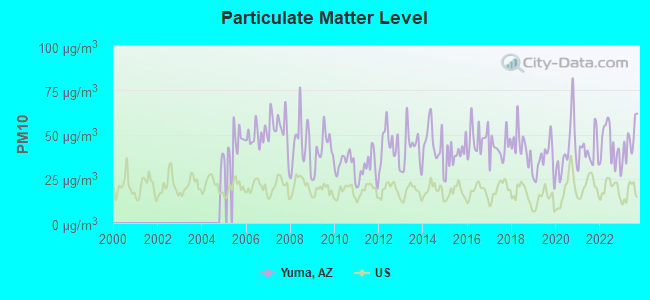
Particulate Matter (PM10) [µg/m3] level in 2023 was 46.8. This is significantly worse than average. Closest monitor was 0.1 miles away from the city center.
| City: | 46.8 |
| U.S.: | 19.2 |
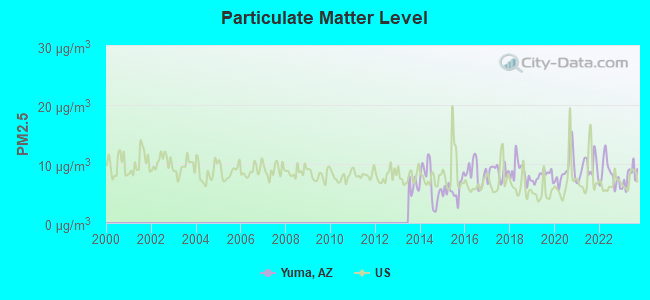
Particulate Matter (PM2.5) [µg/m3] level in 2023 was 7.97. This is about average. Closest monitor was 0.1 miles away from the city center.
| City: | 7.97 |
| U.S.: | 8.11 |
Earthquake activity:
Yuma-area historical earthquake activity is significantly above Arizona state average. It is 4266% greater than the overall U.S. average.On 6/28/1992 at 11:57:34, a magnitude 7.6 (6.2 MB, 7.6 MS, 7.3 MW, Depth: 0.7 mi, Class: Major, Intensity: VIII - XII) earthquake occurred 151.3 miles away from Yuma center, causing 3 deaths (1 shaking deaths, 2 other deaths) and 400 injuries, causing $100,000,000 total damage and $40,000,000 insured losses
On 5/19/1940 at 04:36:40, a magnitude 7.2 (7.2 UK) earthquake occurred 72.7 miles away from the city center, causing $33,000,000 total damage
On 12/31/1934 at 18:45:56, a magnitude 7.1 (7.1 UK) earthquake occurred 66.7 miles away from Yuma center
On 10/15/1979 at 23:16:54, a magnitude 7.0 (5.7 MB, 6.9 MS, 7.0 ML, 6.4 MW) earthquake occurred 60.1 miles away from the city center
On 10/16/1999 at 09:46:44, a magnitude 7.4 (6.3 MB, 7.4 MS, 7.2 MW, 7.3 ML) earthquake occurred 164.0 miles away from the city center
On 7/21/1952 at 11:52:14, a magnitude 7.7 (7.7 UK) earthquake occurred 298.2 miles away from the city center, causing $50,000,000 total damage
Magnitude types: body-wave magnitude (MB), local magnitude (ML), surface-wave magnitude (MS), moment magnitude (MW)
Natural disasters:
The number of natural disasters in Yuma County (5) is a lot smaller than the US average (15).Major Disasters (Presidential) Declared: 3
Emergencies Declared: 1
Causes of natural disasters: Floods: 2, Heavy Rain: 1, Hurricane: 1, Storm: 1, Tornado: 1, Wind: 1, Other: 1 (Note: some incidents may be assigned to more than one category).
Hospitals in Yuma:
- HOSPICE OF YUMA (1824 S. 8TH AVENUE)
- RTA HOSPICE AND PALLIATIVE CARE (1025 WEST 24TH STREET SUITE 15)
- YUMA REGIONAL MEDICAL CENTER (Voluntary non-profit - Private, 2400 SOUTH AVENUE A)
- YUMA REHABILITATION HOSPITAL (901 WEST 24TH STREET)
Nursing Homes in Yuma:
- LA MESA HEALTHCARE CENTER (2470 SOUTH ARIZONA AVENUE)
- LIFE CARE CENTER OF YUMA (2450 SOUTH 19TH AVENUE)
- PALM VIEW REHABILITATION AND CARE (2222 SOUTH AVENUE A)
- YUMA NURSING CENTER (1850 WEST 25TH STREET)
Dialysis Facilities in Yuma:
Home Health Centers in Yuma:
Airports and heliports located in Yuma:
- Yuma Mcas/Yuma International Airport (NYL) (Runways: 4, Commercial Ops: 18,814, Itinerant Ops: 13,546, Local Ops: 45,981, Military Ops: 109,158)
- Yuma Regional Medical Center Heliport (05AZ)
College/University in Yuma:
Other colleges/universities with over 2000 students near Yuma:
- Imperial Valley College (about 53 miles; Imperial, CA; Full-time enrollment: 5,313)
- College of the Desert (about 126 miles; Palm Desert, CA; FT enrollment: 5,686)
- Cuyamaca College (about 136 miles; El Cajon, CA; FT enrollment: 4,270)
- Southwestern College (about 139 miles; Chula Vista, CA; FT enrollment: 10,761)
- Grossmont College (about 140 miles; El Cajon, CA; FT enrollment: 10,461)
- Estrella Mountain Community College (about 143 miles; Avondale, AZ; FT enrollment: 4,932)
- San Diego State University (about 144 miles; San Diego, CA; FT enrollment: 27,516)
Private high school in Yuma:
Private elementary/middle schools in Yuma:
- YUMA LUTHERAN SCHOOL (Students: 317, Location: 2555 S ENGLER AVE, Grades: PK-8)
- ST FRANCIS OF ASSISI SCHOOL (Students: 215, Location: 700 W 18TH ST, Grades: KG-8)
- SOUTHWESTERN CHRISTIAN SCHOOL (Students: 199, Location: 3261 S AVENUE 6 E, Grades: KG-8)
- YUMA ADVENTIST CHRISTIAN SCHOOL (Students: 17, Location: 1681 S 6TH AVE, Grades: KG-6)
User-submitted facts and corrections:
- Yuma Catholic High School is the largest private high school in Yuma and has been accidentally omitted from your site.
- TV broadcast stations around Yuma: KSWT(Channel 13 Pappas Telacasting)
- TV broadcast stations around Yuma: KSWT-DT (Channel 16; Yuma AZ; Owner: Pappas Telecasting) KSWT (Channel 13; Yuma AZ; Owner: Pappas Telecasting)
- There is also a CBS affiliate TV station in Yuma: KSWT channel 13 added by jc
- Z93 93.1 is one of the most popular radio stations...besides KTTI
Points of interest:
Notable locations in Yuma: Patio (A), Arroyo Dunes Golf Course (B), Arizona Inspection Station (C), Yuma Municipal Golf Course (D), Cactus Gardens Recreational Vehicle Resort (E), Arizona West Recreational Vehicle Park (F), Bonita Mesa Recreational Vehicle Resort (G), Yuma Golf and Country Club (H), Ironwood Golf Course (I), East Yard (J), City of Yuma Jones and Main Water Treatment Plant (K), City of North Figueroa Water Pollution Control Facility (L), J C Silver Spur Rodeo Grounds (M), Yuma County Fairgrounds (N), Yuma Courthouse (O), Yuma Fire Department Station 1 (P), Yuma Railroad Station (Q), Yuma Territorial Prison (R), Yuma County Juvenile Home (S), North End Community Center (T). Display/hide their locations on the map
Shopping Centers: Big Curve Shopping Center (1), Southgate Mall (2). Display/hide their locations on the map
Churches in Yuma include: Prince of Peace Lutheran Church (A), Potter's House Christian Church (B), Oasis Church (C), Mount Zion Church (D), Morningside Southern Baptist Church (E), Maranatha Baptist Church (F), Immaculate Conception Church (G), Iglesia Ade Nazareno (H), Grace Bible Fellowship Church (I). Display/hide their locations on the map
Cemeteries: Yuma City Cemetery (1), Desert Lawn Memorial Park (2). Display/hide their locations on the map
Parks in Yuma include: Joe Henry Memorial Park (1), Kennedy Memorial Park (2), Sanguinetti Memorial Park (3), Sanguinetti Athletic Field (4), Yuma Territorial Prison State Historic Park (5), Riverside Park (6), Ray Smucker Park (7), Latino Americano Park (8), City Park (9). Display/hide their locations on the map
Tourist attractions: Arizona Historical Society-Sanguienetti HSE & GDNS (Museums; 240 South Madison Avenue) (1), State Farm Bank (Cultural Attractions- Events- & Facilities; 2435 South 8th Avenue) (2), Yuma Fine Arts Association (Cultural Attractions- Events- & Facilities; 234 South Main Street) (3), Yuma Conservation Garden (Nature Centers; 2520 East 32nd Street) (4), A A Amusement (Amusement & Theme Parks; 4220 East 30th Place) (5), Amf Bowling Centers - Amf Inca Lanes (Amusement & Theme Parks; 1250 West 16th Street) (6), Yuma Valley Railway Tourist Rail Road (100 North Second Avenue) (7), Yuma Park 'n Swap (4000 South 4th Avenue) (8), Golden Cue Billiard Parlor (Arcades & Amusements; 2680 South 4th Avenue) (9). Display/hide their approximate locations on the map
Hotels: Fairfield Inn by Marriott (1801 South Sunridge Drive) (1), Best Western InnSuites Hotel a (1450 Castle Dome Avenue) (2), Days Inn Yuma AZ (1671 East 16th Street) (3), Clarion Suites Yuma (2600 South 4th Avenue) (4), LA Fuente Inn (1513 East 16th Street) (5), Howard Johnson (3181 South 4th Avenue) (6), Howard Johnson Yuma AZ (3181 South 4th Avenue) (7), Desert Grove Motel (3500 South 4th Avenue) (8), Clarion Hotel (2600 South 4th Avenue) (9). Display/hide their approximate locations on the map
Courts: Yuma City - City Departments- Muncipal Court- Genereal Information (1515 South 2nd Avenue) (1), Yuma County - Clerk Of Superior Court- Child Support (168 South 2nd Avenue) (2), Yuma County - Courts- Juvenile Court (2440 West 28th Street) (3), Yuma Federal Magistrates Court Security (325 West 19th Street Suite A) (4), United States Government - Courts- United States Bankruptcy Court (325 West 19th Street) (5). Display/hide their approximate locations on the map
Birthplace of: Chris Jennings - Player of and football, Curley Culp - Football player, Irving Garcia - Soccer player, Jason DeCorse - Guitarist, Lionel C. McGarr - Recipient of the Purple Heart medal, Darrell Bevell - Football player and coach, Bobby Pacho - Boxer, Charles Brinley - Actor, Curtis Lee - Male singer, Elske McCain - Actor.
Drinking water stations with addresses in Yuma and their reported violations in the past:
FAR WEST WATER & SEWER INC (Address: 818 S 9TH AVE , Population served: 32,425, Surface water):Past health violations:ORANGE GROVE WATER COMPANY (Population served: 800, Groundwater):Past monitoring violations:
- MCL, Average - Between JAN-2010 and MAR-2010, Contaminant: TTHM. Follow-up actions: St Compliance achieved (NOV-05-2012)
- MCL, Monthly (TCR) - In FEB-2007, Contaminant: Coliform. Follow-up actions: St Compliance achieved (NOV-13-2007)
- MCL, Monthly (TCR) - In APR-2006, Contaminant: Coliform. Follow-up actions: St Compliance achieved (MAY-24-2007)
- MCL, Monthly (TCR) - In SEP-2005, Contaminant: Coliform. Follow-up actions: St Compliance achieved (JUN-15-2006)
- Monitoring and Reporting (DBP) - Between APR-2009 and JUN-2009, Contaminant: TTHM. Follow-up actions: St Compliance achieved (NOV-05-2012)
- Monitoring and Reporting (DBP) - Between APR-2009 and JUN-2009, Contaminant: Total Haloacetic Acids (HAA5). Follow-up actions: St Compliance achieved (NOV-05-2012)
- Monitoring, Repeat Major (TCR) - In FEB-2007, Contaminant: Coliform (TCR). Follow-up actions: St Compliance achieved (NOV-13-2007)
- Monitoring and Reporting (DBP) - Between JUL-2006 and SEP-2006, Contaminant: Chlorine. Follow-up actions: St Compliance achieved (OCT-25-2006)
- Monitoring, Repeat Major (TCR) - In SEP-2005, Contaminant: Coliform (TCR). Follow-up actions: St Compliance achieved (JUN-15-2006)
- 4 routine major monitoring violations
- 92 regular monitoring violations
- 9 other older monitoring violations
Past monitoring violations:FISHERS LANDING WATER & SEWER (Population served: 402, Groundwater):
- Monitoring and Reporting (DBP) - Between JUL-2008 and SEP-2008, Contaminant: Chlorine. Follow-up actions: St Violation/Reminder Notice (OCT-20-2008), St Compliance achieved (OCT-30-2008)
- Monitoring and Reporting (DBP) - Between APR-2008 and JUN-2008, Contaminant: Chlorine. Follow-up actions: St Compliance achieved (OCT-15-2008)
- Monitoring and Reporting (DBP) - Between JAN-2008 and MAR-2008, Contaminant: Chlorine. Follow-up actions: St Compliance achieved (2 times from OCT-15-2008 to OCT-30-2008)
- Monitoring, Repeat Major (TCR) - In MAR-2007, Contaminant: Coliform (TCR). Follow-up actions: St Compliance achieved (FEB-07-2008)
- Monitoring, Repeat Major (TCR) - In NOV-2006, Contaminant: Coliform (TCR). Follow-up actions: St Compliance achieved (JUL-05-2007)
- One routine major monitoring violation
Past monitoring violations:EL PRADO WATER COMPANY (Address: 4743 E 30TH PL , Population served: 350, Groundwater):
- Monitoring and Reporting (DBP) - Between JUL-2012 and SEP-2012, Contaminant: Chlorine. Follow-up actions: St Compliance achieved (MAR-15-2013)
- Monitoring and Reporting (DBP) - Between JAN-2011 and DEC-2011, Contaminant: Total Haloacetic Acids (HAA5). Follow-up actions: St Compliance achieved (NOV-06-2012)
- Monitoring and Reporting (DBP) - Between JAN-2011 and DEC-2011, Contaminant: TTHM. Follow-up actions: St Compliance achieved (NOV-06-2012)
- Follow-up Or Routine LCR Tap M/R - In OCT-01-2010, Contaminant: Lead and Copper Rule. Follow-up actions: St Violation/Reminder Notice (FEB-01-2011), St Compliance achieved (OCT-03-2011)
- Monitoring and Reporting (DBP) - Between JAN-2010 and DEC-2010, Contaminant: TTHM. Follow-up actions: St Compliance achieved (NOV-06-2012)
- 25 routine major monitoring violations
- One minor monitoring violation
- 7 regular monitoring violations
- 24 other older monitoring violations
Past health violations:SKP WATER COMPANY (Address: 3750 E CO 17TH , Population served: 300, Groundwater):Past monitoring violations:
- MCL, Monthly (TCR) - In SEP-2012, Contaminant: Coliform. Follow-up actions: St Violation/Reminder Notice (NOV-05-2012), St Compliance achieved (DEC-30-2012)
- MCL, Average - Between JUL-2012 and SEP-2012, Contaminant: Arsenic. Follow-up actions: St AO (w/o penalty) issued (NOV-20-2012), St Compliance achieved (2 times from JUN-18-2013 to JUN-24-2013)
- MCL, Average - Between APR-2012 and JUN-2012, Contaminant: Arsenic. Follow-up actions: St Formal NOV issued (DEC-18-2008), St AO (w/o penalty) issued (NOV-20-2012), St Compliance achieved (2 times from JUN-18-2013 to JUN-24-2013)
- MCL, Average - Between JAN-2012 and MAR-2012, Contaminant: Arsenic. Follow-up actions: St Formal NOV issued (DEC-18-2008), St AO (w/o penalty) issued (NOV-20-2012), St Compliance achieved (2 times from JUN-18-2013 to JUN-24-2013)
- MCL, Average - Between JUL-2011 and SEP-2011, Contaminant: Arsenic. Follow-up actions: St Formal NOV issued (DEC-18-2008), St AO (w/o penalty) issued (NOV-20-2012), St Compliance achieved (2 times from JUN-18-2013 to JUN-24-2013)
- MCL, Average - Between APR-2011 and JUN-2011, Contaminant: Arsenic. Follow-up actions: St Formal NOV issued (DEC-18-2008), St AO (w/o penalty) issued (NOV-20-2012), St Compliance achieved (2 times from JUN-18-2013 to JUN-24-2013)
- 9 other older health violations
- Initial Tap Sampling for Pb and Cu - In JAN-01-2011, Contaminant: Lead and Copper Rule. Follow-up actions: St Compliance achieved (MAR-19-2012)
- Initial Tap Sampling for Pb and Cu - In JAN-01-2010, Contaminant: Lead and Copper Rule. Follow-up actions: St Compliance achieved (MAR-02-2012)
- Monitoring, Repeat Major (TCR) - In JUL-2009, Contaminant: Coliform (TCR). Follow-up actions: St Violation/Reminder Notice (AUG-27-2009), St Compliance achieved (NOV-15-2010)
- Initial Tap Sampling for Pb and Cu - In JUL-01-2009, Contaminant: Lead and Copper Rule. Follow-up actions: St Compliance achieved (MAR-02-2012)
- Initial Tap Sampling for Pb and Cu - In JUL-01-2004, Contaminant: Lead and Copper Rule. Follow-up actions: St Violation/Reminder Notice (2 times from MAY-19-2008 to MAR-17-2009), St Compliance achieved (MAR-19-2012)
- 8 routine major monitoring violations
- One minor monitoring violation
- 10 regular monitoring violations
Past monitoring violations:RANCHO BONITO RV PARK (Address: 14555 S AVENUE 4E , Population served: 200, Groundwater):
- 4 routine major monitoring violations
Past health violations:SOUTHERN MESA RV PARK (Address: 18540 S AVE 3E , Population served: 200, Groundwater):Past monitoring violations:
- MCL, Monthly (TCR) - In APR-2007, Contaminant: Coliform. Follow-up actions: St Compliance achieved (MAR-17-2011)
- Monitoring, Source Water (GWR) - In JAN-20-2010, Contaminant: E. COLI. Follow-up actions: St Compliance achieved (MAR-15-2010)
- 5 routine major monitoring violations
- 2 minor monitoring violations
- 3 regular monitoring violations
Past health violations:LUCKY PARK DEL SUR (Address: 5790 W 8TH ST , Population served: 128, Groundwater):Past monitoring violations:
- MCL, Single Sample - Between APR-2010 and JUN-2010, Contaminant: Nitrate. Follow-up actions: St Compliance achieved (JUL-25-2011)
- MCL, Single Sample - Between JAN-2010 and MAR-2010, Contaminant: Nitrate. Follow-up actions: St Violation/Reminder Notice (JUN-08-2010), St Compliance achieved (JUL-25-2011)
- MCL, Single Sample - Between OCT-2009 and DEC-2009, Contaminant: Nitrate. Follow-up actions: St Compliance achieved (JUL-25-2011)
- MCL, Single Sample - Between JUL-2009 and SEP-2009, Contaminant: Nitrate. Follow-up actions: St Compliance achieved (JUL-25-2011)
- MCL, Single Sample - Between APR-2009 and JUN-2009, Contaminant: Nitrate. Follow-up actions: St Compliance achieved (JUL-25-2011)
- MCL, Single Sample - Between JAN-2009 and MAR-2009, Contaminant: Nitrate. Follow-up actions: St Compliance achieved (JUL-25-2011)
- 3 other older health violations
- 7 routine major monitoring violations
- 6 regular monitoring violations
Past monitoring violations:
- Follow-up Or Routine LCR Tap M/R - In OCT-01-2006, Contaminant: Lead and Copper Rule. Follow-up actions: St Compliance achieved (DEC-19-2007)
- Follow-up Or Routine LCR Tap M/R - In OCT-01-2004, Contaminant: Lead and Copper Rule. Follow-up actions: St Compliance achieved (DEC-19-2007)
- Follow-up Or Routine LCR Tap M/R - In OCT-01-2003, Contaminant: Lead and Copper Rule. Follow-up actions: St Compliance achieved (JUL-28-2008)
- Initial Tap Sampling for Pb and Cu - In JUL-01-2000, Contaminant: Lead and Copper Rule. Follow-up actions: St Compliance achieved (DEC-19-2007)
- 8 routine major monitoring violations
- 4 regular monitoring violations
Drinking water stations with addresses in Yuma that have no violations reported:
- SOUTH MESA CAMPGROUND (Serves CA, Population served: 25, Primary Water Source Type: Groundwater)
| This city: | 2.9 people |
| Arizona: | 2.6 people |
| This city: | 73.1% |
| Whole state: | 66.2% |
| This city: | 7.2% |
| Whole state: | 7.8% |
Likely homosexual households (counted as self-reported same-sex unmarried-partner households)
- Lesbian couples: 0.3% of all households
- Gay men: 0.3% of all households
People in group quarters in Yuma in 2010:
- 2,404 people in state prisons
- 1,147 people in military barracks and dormitories (nondisciplinary)
- 577 people in local jails and other municipal confinement facilities
- 308 people in nursing facilities/skilled-nursing facilities
- 257 people in college/university student housing
- 246 people in workers' group living quarters and job corps centers
- 63 people in other noninstitutional facilities
- 51 people in group homes intended for adults
- 50 people in emergency and transitional shelters (with sleeping facilities) for people experiencing homelessness
- 23 people in residential treatment centers for adults
- 2 people in mental (psychiatric) hospitals and psychiatric units in other hospitals
People in group quarters in Yuma in 2000:
- 1,576 people in military barracks, etc.
- 581 people in nursing homes
- 449 people in other types of correctional institutions
- 233 people in college dormitories (includes college quarters off campus)
- 92 people in homes for the physically handicapped
- 77 people in military transient quarters for temporary residents
- 43 people in other noninstitutional group quarters
- 33 people in homes for the mentally ill
- 30 people in short-term care, detention or diagnostic centers for delinquent children
- 15 people in other nonhousehold living situations
- 8 people in homes or halfway houses for drug/alcohol abuse
- 5 people in schools, hospitals, or wards for the intellectually disabled
- 2 people in religious group quarters
Banks with most branches in Yuma (2011 data):
- Wells Fargo Bank, National Association: Yuma 24th & Avenue B Branch, Yuma Foothills Branch, Yuma Main Branch, 8th Avenue And Catalina Branch, Yuma Branch, Cielo Verde Branch. Info updated 2011/04/05: Bank assets: $1,161,490.0 mil, Deposits: $905,653.0 mil, headquarters in Sioux Falls, SD, positive income, 6395 total offices, Holding Company: Wells Fargo & Company
- 1st Bank Yuma: Fortuna Branch, Yuma Kbc Branch, Yuma Midtown Branch, at 2799 South 4th Avenue. Info updated 2006/11/03: Bank assets: $143.9 mil, Deposits: $124.0 mil, local headquarters, positive income, Commercial Lending Specialization, 4 total offices, Holding Company: Western Arizona Bancorp, Inc.
- National Bank of Arizona: Yuma 32nd Street Branch, 24th Street Branch, Yuma 4th Ave. Branch, Yuma Foothills Branch. Info updated 2008/09/11: Bank assets: $4,485.6 mil, Deposits: $3,731.3 mil, headquarters in Tucson, AZ, positive income, Commercial Lending Specialization, 73 total offices, Holding Company: Zions Bancorporation
- The Foothills Bank: at 11689 South Foothills Boulevard, 4th Avenue Branch, 32nd Street Branch, Yuma Branch. Info updated 2011/07/18: Bank assets: $287.9 mil, Deposits: $253.5 mil, local headquarters, positive income, Commercial Lending Specialization, 5 total offices
- SunBank, National Association: Yuma/Pacific In-Store Branch 64, Yuma Branch, Yuma/Foothills In Store Branch. Info updated 2010/07/12: Bank assets: $31.4 mil, Deposits: $23.9 mil, headquarters in Phoenix, AZ, negative income in the last year, 16 total offices, Holding Company: Dickinson Financial Corporation Ii
- JPMorgan Chase Bank, National Association: 4th Avenue And 16th Street Branch, I8 & Fortuna Banking Center, Yuma West Branch. Info updated 2011/11/10: Bank assets: $1,811,678.0 mil, Deposits: $1,190,738.0 mil, headquarters in Columbus, OH, positive income, International Specialization, 5577 total offices, Holding Company: Jpmorgan Chase & Co.
- Bank of America, National Association: Yuma Fourth Avenue Branch at 1315 Fourth Avenue, branch established on 1954/02/05; Yuma And Catalina Branch at 100 East 32nd Street, branch established on 1995/08/08. Info updated 2009/11/18: Bank assets: $1,451,969.3 mil, Deposits: $1,077,176.8 mil, headquarters in Charlotte, NC, positive income, 5782 total offices, Holding Company: Bank Of America Corporation
- Armed Forces Bank, National Association: Yuma Branch at Bldg. 965 Quilter Street, branch established on 1956/07/23. Info updated 2010/12/16: Bank assets: $1,839.7 mil, Deposits: $1,387.5 mil, headquarters in Fort Leavenworth, KS, negative income in the last year, Commercial Lending Specialization, 78 total offices, Holding Company: Dickinson Financial Corporation Ii
- Mohave State Bank: Yuma Branch at 1800 S 4th Ave, branch established on 2007/09/04. Info updated 2010/07/22: Bank assets: $282.8 mil, Deposits: $243.7 mil, headquarters in Lake Havasu City, AZ, positive income, Commercial Lending Specialization, 6 total offices, Holding Company: State Bank Corp.
For population 15 years and over in Yuma:
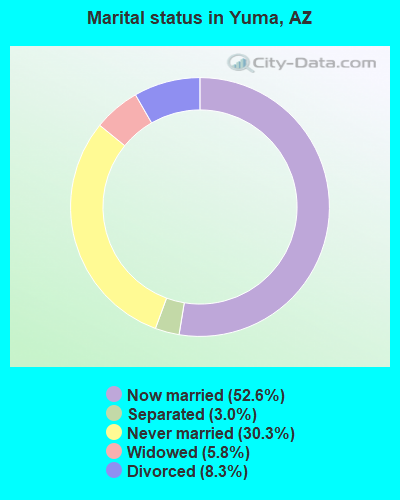
- Never married: 30.3%
- Now married: 52.6%
- Separated: 3.0%
- Widowed: 5.8%
- Divorced: 8.3%
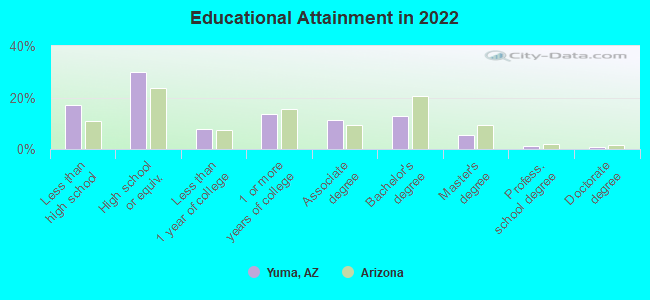
For population 25 years and over in Yuma:
- High school or higher: 83.1%
- Bachelor's degree or higher: 20.3%
- Graduate or professional degree: 7.3%
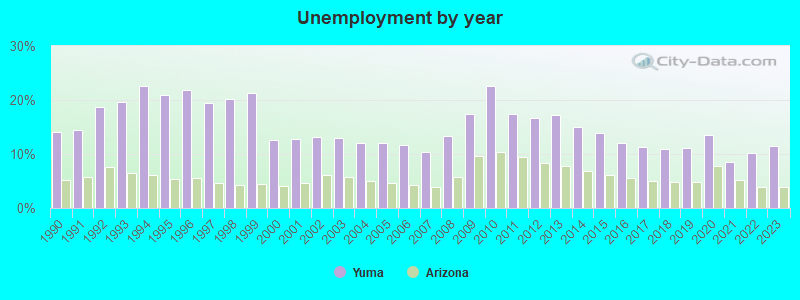
- Unemployed: 9.1%
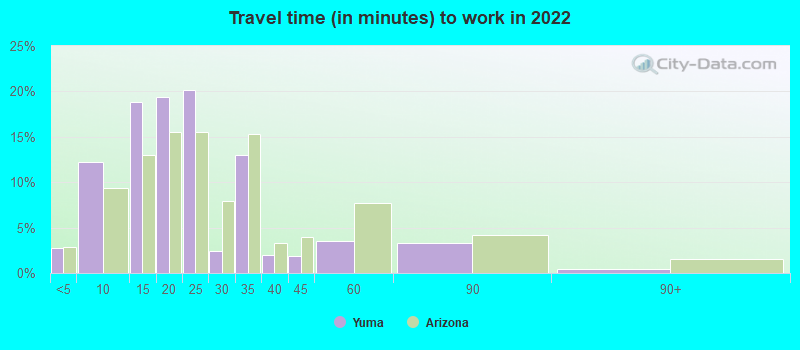
- Mean travel time to work (commute): 15.5 minutes
| Here: | 14.1 |
| Arizona average: | 12.2 |
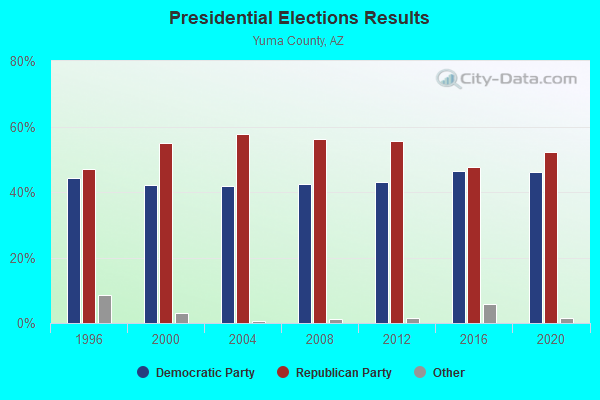
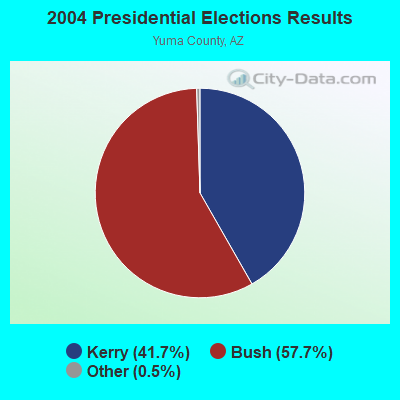
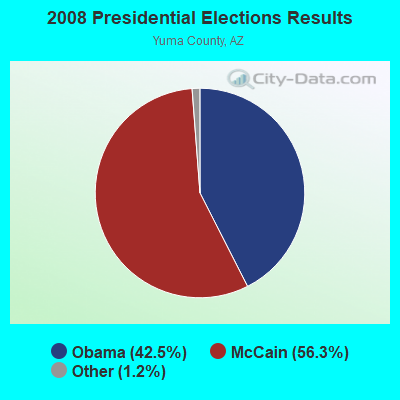
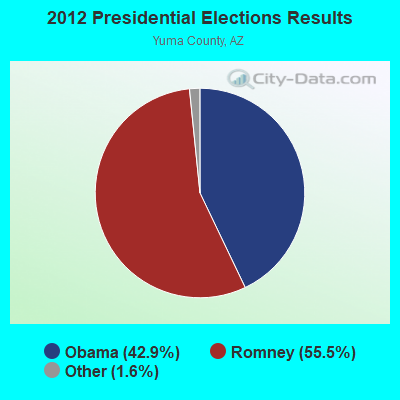
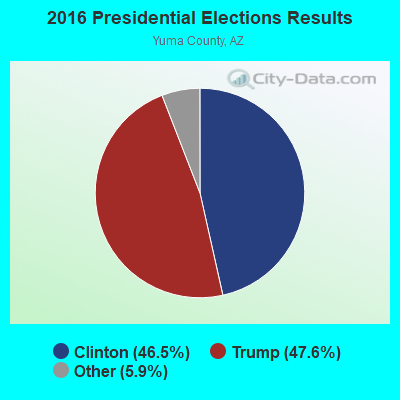
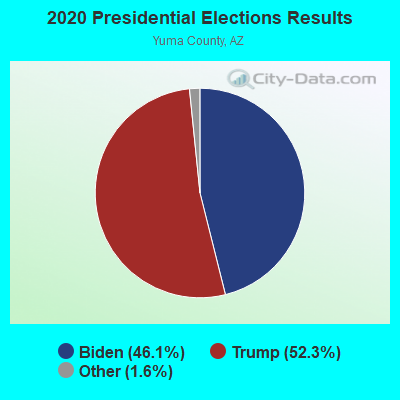
Graphs represent county-level data. Detailed 2008 Election Results
Neighborhoods in Yuma:
(Yuma, Arizona Neighborhood Map)- Adams Acres neighborhood
- Adobe Ridge neighborhood
- Arc Center neighborhood
- Arcadia Meadows neighborhood
- Arroyo De Fortuna neighborhood
- Arroyo Heights neighborhood
- Arthur Tongeland neighborhood
- Atmar neighborhood
- Bardeaux Oaks neighborhood
- Barkley Ranch neighborhood
- Bel Aire Estates neighborhood
- Bel-Aire Heights neighborhood
- Belleza neighborhood
- Big Curve neighborhood
- Brentwood Estates neighborhood
- Brookhurst neighborhood
- Buntin Estates neighborhood
- Camino Real neighborhood
- Carnes neighborhood
- Casa De Encanto neighborhood
- Casa Del Sol neighborhood
- Casa Manana neighborhood
- Casitas Del Valle neighborhood
- Castil Del Prado neighborhood
- Castle View neighborhood
- Chantal Estates neighborhood
- Cibola neighborhood
- Cibola Heights neighborhood
- Cielo Verde neighborhood
- Citrus Springs neighborhood
- Citrus View neighborhood
- College Acres neighborhood
- College Park neighborhood
- Country Estates neighborhood
- Country Life Mobile Estates neighborhood
- Country Meadows neighborhood
- Country Roads Rv Village neighborhood
- Crane neighborhood
- Cresta Gila Estates neighborhood
- Curtis neighborhood
- Daybreak neighborhood
- Debra Jean Estates neighborhood
- Del Nido Condominiums neighborhood
- Del Oro neighborhood
- Del Rey Estates neighborhood
- Del Rio neighborhood
- Del Sur Estates neighborhood
- Del Valle Terrace neighborhood
- Desert Air Mobile Estates neighborhood
- Desert Fairways neighborhood
- Desert Foothills Estates neighborhood
- Desert Grove Mobile Estates neighborhood
- Desert Lakes Mobile Home neighborhood
- Desert Ranchos neighborhood
- Desert Ridge neighborhood
- Desert Star Estates neighborhood
- Desert View neighborhood
- Donovan Estates neighborhood
- Dunes neighborhood
- Eden Acres neighborhood
- Edenwood West neighborhood
- Eighth Street West neighborhood
- El Camino Casitas neighborhood
- El Prado Mobile Estates neighborhood
- El Pueblocito neighborhood
- Eldorado Condominiums neighborhood
- Emerson Acres neighborhood
- Engler Estates neighborhood
- Estrella at Mesa Del Sol neighborhood
- Fair Acres neighborhood
- Fairgrounds neighborhood
- Fairway neighborhood
- Falls Ranch neighborhood
- Farmer neighborhood
- Foothills neighborhood
- Foothills Country Club Estates neighborhood
- Foothills Mobile Estates neighborhood
- Foothills Mountain Estates neighborhood
- Foothills North neighborhood
- Fortuna Heights neighborhood
- Fortuna Hills neighborhood
- Four Palms neighborhood
- Galahad Manor neighborhood
- Gateway Plaza neighborhood
- Gila Acres neighborhood
- Goldwater Ranch neighborhood
- Green Acres neighborhood
- Greentree neighborhood
- Greenwood Village neighborhood
- Hacienda Estates neighborhood
- Hazelwood Estates neighborhood
- Hettema Estates neighborhood
- Hettema Place neighborhood
- Hillside Manor neighborhood
- Holiday Park neighborhood
- Ironwood neighborhood
- Kachina Estates neighborhood
- King Ranch neighborhood
- Kofa Acres neighborhood
- Kryger Farms neighborhood
- La Jolla Del Valle neighborhood
- La Mesa Hermosa neighborhood
- La Mesa Linda neighborhood
- La Mesa Manor neighborhood
- La Mesa Park neighborhood
- La Mesa Vista neighborhood
- La Paloma Estates neighborhood
- La Quinta at Barkley Ranch neighborhood
- La Valencia neighborhood
- La Verne Terrace neighborhood
- Las Barrancas neighborhood
- Las Brisas neighborhood
- Las Casitas neighborhood
- Las Colinas at Mesa Del Sol neighborhood
- Loma Vista Estates neighborhood
- Loma Vista West neighborhood
- Los Altos neighborhood
- Los Amigos neighborhood
- Los Nidos neighborhood
- Lowell Manor neighborhood
- Lozano neighborhood
- Lucinda Homes neighborhood
- Magnolia Village neighborhood
- Marable neighborhood
- Marable Vaughn neighborhood
- Meadowbrook neighborhood
- Melody Park neighborhood
- Mesa Del Sol neighborhood
- Mesa Dunes Estates neighborhood
- Mesa Heights neighborhood
- Mesa View neighborhood
- Meyer Farms neighborhood
- Mirada Del Sol neighborhood
- Mountain Shadows neighborhood
- Mountain View neighborhood
- Mountain Vista Estates neighborhood
- Oasis Del Este neighborhood
- Old World Village neighborhood
- Orange Grove neighborhood
- Pacific Village Estates neighborhood
- Padre Ranchitos neighborhood
- Palm Desert Mobile Estates neighborhood
- Palm Drive neighborhood
- Palmcroft Estates neighborhood
- Palo Verde Estates neighborhood
- Parkway Place neighborhood
- Pavia Properties Inc. neighborhood
- Pecan Grove neighborhood
- Pecan Grove Gardens neighborhood
- Pfeifer Estates neighborhood
- Picacho Village neighborhood
- Picacho Vista neighborhood
- Pioneer Park neighborhood
- Pioneer Rancheros neighborhood
- Plaza Del Este neighborhood
- Plaza Del Rio neighborhood
- Plaza Del Sol neighborhood
- Ponderosa Valley Estates neighborhood
- Premier Storage Condominiums neighborhood
- Pritchard Rancheros neighborhood
- Puerta Bonita neighborhood
- Purple Mountain neighborhood
- R Circle J Estates neighborhood
- Rancheros Bonitos neighborhood
- Rancho Caballo neighborhood
- Rancho Del Oro neighborhood
- Rancho Desierto Grande neighborhood
- Rancho Peregrino neighborhood
- Rancho Serenade neighborhood
- Rancho Sereno neighborhood
- Rancho Verde neighborhood
- Rancho Viejo neighborhood
- Ranchos El Toreo neighborhood
- Riebe Ranchettes neighborhood
- Rio Colorado Estates neighborhood
- Ruby neighborhood
- Ruby's Yumesa neighborhood
- Saguaro Estates neighborhood
- San Carlos neighborhood
- San Marcos Casitas neighborhood
- San Marcos Villas neighborhood
- Sandpointe neighborhood
- Sanguinetti Manor neighborhood
- Santa Maria neighborhood
- Savant Estates neighborhood
- Schechert Estates neighborhood
- Scottsdale East Estates neighborhood
- Shangri La Village neighborhood
- Sheffield Estates neighborhood
- Sienna at Mesa Del Sol neighborhood
- Sierra Ridge Unit neighborhood
- Sierra Sands neighborhood
- Sierra Sunset neighborhood
- Siesta Acres neighborhood
- South Park Industrial Dist neighborhood
- Southern Sands Mobile neighborhood
- Su Casa Gardens neighborhood
- Sun Leisure Estates neighborhood
- Sun Valley Estates neighborhood
- Sunburst Estates neighborhood
- Suncrest neighborhood
- Sundance Village neighborhood
- Sunset Heights neighborhood
- Sunset Mesa neighborhood
- Sunset Mountain Villas neighborhood
- Syverson neighborhood
- Tamarack neighborhood
- The Bluffs neighborhood
- The Estates at Mesa Del Sol neighborhood
- The Links neighborhood
- The Palms Rv Resort neighborhood
- The Seasons Rv Village neighborhood
- The Terraces at the View neighborhood
- The Village neighborhood
- The Villas neighborhood
- Thomas neighborhood
- Tierra Bonita neighborhood
- Tierra Kino neighborhood
- Tierra Mesa Estates neighborhood
- Tillman Estates neighborhood
- Timmons neighborhood
- Townsend neighborhood
- Trail Estates neighborhood
- Triple S Industrial Park neighborhood
- Tuscan Ranch neighborhood
- Valle Sereno neighborhood
- Valle Verde Estates neighborhood
- Valley Citrus Estates neighborhood
- Valley Park Homes neighborhood
- Valley View neighborhood
- Verde Valley Acres neighborhood
- Victoria Meadows neighborhood
- Villa Chaparral neighborhood
- Villa Cordova neighborhood
- Villa De Coronado neighborhood
- Villa Del Rey Townhouses neighborhood
- Villa Hermosa neighborhood
- Villa Royale Townhouses neighborhood
- Villa Viejo Townhouses neighborhood
- Vista Del Sol neighborhood
- Vista Del Valle Estates neighborhood
- Vista Montana neighborhood
- West Crane neighborhood
- West View neighborhood
- Westmain Estates neighborhood
- Westridge Estates neighborhood
- Westridge North neighborhood
- Westridge South neighborhood
- Yuma Commerce Center neighborhood
- Yuma Corona neighborhood
- Yuma Country Club Estates neighborhood
- Yuma East neighborhood
- Yuma East Estates neighborhood
- Yuma Heights neighborhood
- Yuma Meadows neighborhood
- Yuma Mesa Vineyards neighborhood
- Yuma Neighborhood Center neighborhood
- Yuma North neighborhood
- Yuma Palms Regional Center neighborhood
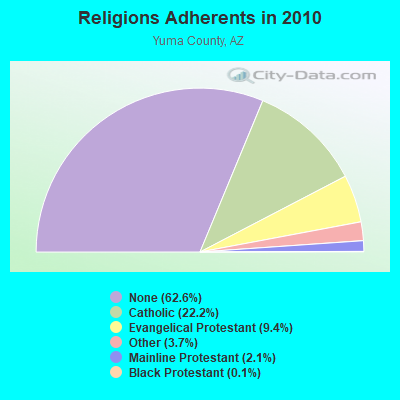
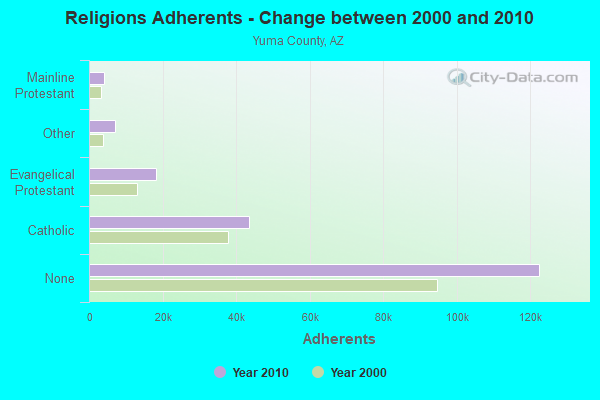
Religion statistics for Yuma, AZ (based on Yuma County data)
| Religion | Adherents | Congregations |
|---|---|---|
| Catholic | 43,401 | 7 |
| Evangelical Protestant | 18,341 | 92 |
| Other | 7,164 | 25 |
| Mainline Protestant | 4,078 | 14 |
| Black Protestant | 222 | 3 |
| None | 122,545 | - |
Food Environment Statistics:
| Yuma County: | 1.95 / 10,000 pop. |
| State: | 1.36 / 10,000 pop. |
| Yuma County: | 0.11 / 10,000 pop. |
| Arizona: | 0.14 / 10,000 pop. |
| This county: | 0.58 / 10,000 pop. |
| State: | 0.55 / 10,000 pop. |
| Here: | 2.53 / 10,000 pop. |
| Arizona: | 2.47 / 10,000 pop. |
| Here: | 4.11 / 10,000 pop. |
| State: | 6.21 / 10,000 pop. |
| This county: | 9.5% |
| State: | 8.0% |
| Yuma County: | 25.7% |
| Arizona: | 22.8% |
| Yuma County: | 18.3% |
| Arizona: | 14.2% |
Health and Nutrition:
| This city: | 48.6% |
| State: | 49.0% |
| This city: | 47.5% |
| Arizona: | 47.3% |
| Yuma: | 28.5 |
| Arizona: | 28.5 |
| Yuma: | 20.6% |
| State: | 20.8% |
| Yuma: | 10.9% |
| Arizona: | 10.2% |
| Yuma: | 6.8 |
| Arizona: | 6.8 |
| Yuma: | 33.4% |
| Arizona: | 33.5% |
| Yuma: | 55.7% |
| Arizona: | 56.1% |
| Yuma: | 80.0% |
| Arizona: | 79.4% |
More about Health and Nutrition of Yuma, AZ Residents
| Local government employment and payroll (March 2022) | |||||
| Function | Full-time employees | Monthly full-time payroll | Average yearly full-time wage | Part-time employees | Monthly part-time payroll |
|---|---|---|---|---|---|
| Police Protection - Officers | 182 | $1,115,389 | $73,542 | 1 | $1,623 |
| Firefighters | 124 | $867,973 | $83,997 | 1 | $1,990 |
| Parks and Recreation | 95 | $345,995 | $43,705 | 73 | $75,019 |
| Other and Unallocable | 77 | $318,184 | $49,587 | 14 | $23,239 |
| Water Supply | 74 | $375,599 | $60,908 | 2 | $3,518 |
| Streets and Highways | 62 | $298,745 | $57,822 | 13 | $24,698 |
| Financial Administration | 59 | $321,722 | $65,435 | 1 | $2,521 |
| Police - Other | 54 | $279,074 | $62,016 | 3 | $3,314 |
| Sewerage | 49 | $207,994 | $50,937 | 1 | $1,470 |
| Other Government Administration | 48 | $275,663 | $68,916 | 10 | $7,798 |
| Judicial and Legal | 32 | $181,714 | $68,143 | 2 | $1,692 |
| Solid Waste Management | 19 | $76,396 | $48,250 | 6 | $11,701 |
| Fire - Other | 6 | $38,359 | $76,718 | 1 | $3,559 |
| Totals for Government | 881 | $4,702,807 | $64,056 | 128 | $162,143 |
Yuma government finances - Expenditure in 2021 (per resident):
- Construction - Sewerage: $3,635,000 ($36.89)
Water Utilities: $3,338,000 ($33.88)
Regular Highways: $1,779,000 ($18.06)
Police Protection: $781,000 ($7.93)
General - Other: $55,000 ($0.56)
Parks and Recreation: $26,000 ($0.26)
General Public Buildings: $17,000 ($0.17)
Housing and Community Development: $15,000 ($0.15)
- Current Operations - Police Protection: $48,095,000 ($488.14)
Local Fire Protection: $29,391,000 ($298.30)
Water Utilities: $14,984,000 ($152.08)
Sewerage: $13,743,000 ($139.48)
Central Staff Services: $11,338,000 ($115.08)
General - Other: $10,194,000 ($103.46)
Financial Administration: $7,565,000 ($76.78)
Parks and Recreation: $5,371,000 ($54.51)
General Public Buildings: $5,041,000 ($51.16)
Solid Waste Management: $4,884,000 ($49.57)
Housing and Community Development: $3,544,000 ($35.97)
Protective Inspection and Regulation - Other: $3,218,000 ($32.66)
Regular Highways: $2,965,000 ($30.09)
Judicial and Legal Services: $2,050,000 ($20.81)
Health - Other: $1,067,000 ($10.83)
- General - Interest on Debt: $4,272,000 ($43.36)
- Other Capital Outlay - General - Other: $1,791,000 ($18.18)
Police Protection: $963,000 ($9.77)
Parks and Recreation: $335,000 ($3.40)
Regular Highways: $34,000 ($0.35)
Financial Administration: $11,000 ($0.11)
Judicial and Legal Services: $10,000 ($0.10)
Central Staff Services: $8,000 ($0.08)
Solid Waste Management: $4,000 ($0.04)
- Total Salaries and Wages: $53,219,000 ($540.15)
- Water Utilities - Interest on Debt: $3,806,000 ($38.63)
Yuma government finances - Revenue in 2021 (per resident):
- Charges - Sewerage: $17,456,000 ($177.17)
Other: $5,270,000 ($53.49)
Solid Waste Management: $3,820,000 ($38.77)
Parks and Recreation: $157,000 ($1.59)
- Federal Intergovernmental - Other: $1,415,000 ($14.36)
Housing and Community Development: $741,000 ($7.52)
Water Utilities: $12,000 ($0.12)
- Local Intergovernmental - Other: $54,000 ($0.55)
- Miscellaneous - General Revenue - Other: $962,000 ($9.76)
Fines and Forfeits: $931,000 ($9.45)
Rents: $404,000 ($4.10)
Special Assessments: $365,000 ($3.70)
Donations From Private Sources: $186,000 ($1.89)
Interest Earnings: $115,000 ($1.17)
Sale of Property: $38,000 ($0.39)
- Revenue - Water Utilities: $25,323,000 ($257.02)
- State Intergovernmental - Sewerage: $18,183,000 ($184.55)
General Local Government Support: $14,046,000 ($142.56)
Highways: $8,251,000 ($83.74)
Other: $442,000 ($4.49)
- Tax - General Sales and Gross Receipts: $53,899,000 ($547.05)
Property: $19,574,000 ($198.67)
Public Utilities Sales: $4,040,000 ($41.00)
Corporation Net Income: $3,220,000 ($32.68)
Other License: $2,487,000 ($25.24)
Occupation and Business License - Other: $282,000 ($2.86)
Alcoholic Beverage License: $41,000 ($0.42)
Yuma government finances - Debt in 2021 (per resident):
- Long Term Debt - Outstanding Nonguaranteed - Industrial Revenue: $241,659,000 ($2452.72)
Issue, Nonguaranteed - Public Debt for Private Purpose: $172,249,000 ($1748.24)
Beginning Outstanding - Unspecified Public Purpose: $102,206,000 ($1037.34)
Outstanding Unspecified Public Purpose: $91,496,000 ($928.64)
Beginning Outstanding - Public Debt for Private Purpose: $90,748,000 ($921.05)
Retired Nonguaranteed - Public Debt for Private Purpose: $21,338,000 ($216.57)
Retired Unspecified Public Purpose: $10,710,000 ($108.70)
- Short Term Debt Outstanding - Beginning: $387,135,000 ($3929.23)
End of Fiscal Year: $320,492,000 ($3252.83)
Yuma government finances - Cash and Securities in 2021 (per resident):
- Bond Funds - Cash and Securities: $47,754,000 ($484.68)
- Other Funds - Cash and Securities: $369,563,000 ($3750.88)
- Sinking Funds - Cash and Securities: $241,659,000 ($2452.72)
6.99% of this county's 2021 resident taxpayers lived in other counties in 2020 ($49,769 average adjusted gross income)
| Here: | 6.99% |
| Arizona average: | 6.85% |
0.12% of residents moved from foreign countries ($1,058 average AGI)
Yuma County: 0.12% Arizona average: 0.03%
Top counties from which taxpayers relocated into this county between 2020 and 2021:
| from Maricopa County, AZ | |
| from San Diego County, CA | |
| from Imperial County, CA |
6.14% of this county's 2020 resident taxpayers moved to other counties in 2021 ($50,736 average adjusted gross income)
| Here: | 6.14% |
| Arizona average: | 5.72% |
0.06% of residents moved to foreign countries ($618 average AGI)
Yuma County: 0.06% Arizona average: 0.03%
Top counties to which taxpayers relocated from this county between 2020 and 2021:
| to Maricopa County, AZ | |
| to San Diego County, CA | |
| to Pima County, AZ |
| Businesses in Yuma, AZ | ||||
| Name | Count | Name | Count | |
|---|---|---|---|---|
| 99 Cents Only Stores | 2 | Lane Bryant | 1 | |
| AMF Bowling | 1 | Lane Furniture | 1 | |
| AT&T | 1 | Little Caesars Pizza | 3 | |
| Albertsons | 2 | Long John Silver's | 1 | |
| American Eagle Outfitters | 1 | Lowe's | 1 | |
| Applebee's | 3 | Marriott | 2 | |
| Arby's | 2 | MasterBrand Cabinets | 2 | |
| Ashley Furniture | 1 | Mazda | 1 | |
| AutoZone | 2 | McDonald's | 7 | |
| Barnes & Noble | 1 | Microtel | 1 | |
| Bed Bath & Beyond | 1 | Motel 6 | 2 | |
| Best Western | 2 | Motherhood Maternity | 1 | |
| Big O Tires | 2 | New Balance | 1 | |
| Budget Car Rental | 1 | Nike | 10 | |
| Buffalo Wild Wings | 1 | Nissan | 1 | |
| Burger King | 4 | Old Navy | 1 | |
| Burlington Coat Factory | 1 | Outback | 1 | |
| CVS | 2 | Outback Steakhouse | 1 | |
| Carl\s Jr. | 3 | Pac Sun | 1 | |
| Chevrolet | 1 | Panda Express | 3 | |
| Chuck E. Cheese's | 1 | Payless | 2 | |
| Church's Chicken | 1 | Penske | 1 | |
| Circle K | 16 | PetSmart | 1 | |
| Clarion | 1 | Pier 1 Imports | 1 | |
| Cold Stone Creamery | 1 | Pizza Hut | 3 | |
| Comfort Inn | 1 | Quality | 1 | |
| Cracker Barrel | 1 | RadioShack | 2 | |
| Curves | 2 | Ramada | 1 | |
| Dairy Queen | 4 | Red Lobster | 1 | |
| Days Inn | 1 | SAS Shoes | 1 | |
| Dennys | 1 | SONIC Drive-In | 2 | |
| Discount Tire | 1 | Sam's Club | 1 | |
| Famous Footwear | 1 | Sears | 2 | |
| FedEx | 11 | Sephora | 1 | |
| Foot Locker | 1 | Sprint Nextel | 3 | |
| Ford | 1 | Staples | 2 | |
| GNC | 3 | Starbucks | 7 | |
| GameStop | 2 | Super 8 | 1 | |
| Goodwill | 1 | T-Mobile | 5 | |
| H&R Block | 6 | Target | 1 | |
| Holiday Inn | 3 | The Room Place | 2 | |
| Home Depot | 1 | Toyota | 1 | |
| HomeTown Buffet | 1 | Toys"R"Us | 1 | |
| Honda | 1 | Travelodge | 1 | |
| Hot Topic | 1 | True Value | 1 | |
| Howard Johnson | 1 | U-Haul | 7 | |
| JCPenney | 1 | UPS | 13 | |
| Jack In The Box | 9 | Vans | 3 | |
| Jones New York | 2 | Verizon Wireless | 1 | |
| Journeys | 1 | Walmart | 3 | |
| KFC | 3 | Wendy's | 1 | |
| Kohl's | 1 | Wingate | 1 | |
| Kroger | 2 | World Gym | 1 | |
| La-Z-Boy | 1 | YMCA | 1 | |
Strongest AM radio stations in Yuma:
- KBLU (560 AM; 1 kW; YUMA, AZ)
- KJOK (1400 AM; 1 kW; YUMA, AZ; Owner: MONSTERMEDIA, LLC)
- KAWC (1320 AM; 1 kW; YUMA, AZ; Owner: ARIZONA WESTERN COLLEGE)
- KFMB (760 AM; 50 kW; SAN DIEGO, CA; Owner: MIDWEST TELEVISION, INC.)
- KMIA (710 AM; 50 kW; BLACK CANYON CITY, AZ; Owner: ENTRAVISION HOLDINGS, LLC)
- KCBQ (1170 AM; 50 kW; SAN DIEGO, CA; Owner: RADIO 1210, INC.)
- KLAC (570 AM; 50 kW; LOS ANGELES, CA; Owner: AMFM RADIO LICENSES, L.L.C.)
- KPXQ (1360 AM; 50 kW; GLENDALE, AZ; Owner: COMMON GROUND BROADCASTING, INC.)
- KFI (640 AM; 50 kW; LOS ANGELES, CA; Owner: CAPSTAR TX LIMITED PARTNERSHIP)
- KFNX (1100 AM; 50 kW; CAVE CREEK, AZ; Owner: NORTH AMERICAN BROADCASTING CO., INC.)
- KPLS (830 AM; 50 kW; ORANGE, CA; Owner: CRN LICENSES, LLC)
- KFLT (830 AM; 50 kW; TUCSON, AZ; Owner: FAMILY LIFE B/CING SYSTEM, INC.)
- KDWN (720 AM; 50 kW; LAS VEGAS, NV; Owner: RADIO NEVADA CORP.)
Strongest FM radio stations in Yuma:
- K211DD (90.1 FM; YUMA, AZ; Owner: CALVARY CHAPEL OF TWIN FALLS, INC.)
- KTTI (95.1 FM; YUMA, AZ; Owner: CAPSTAR TX LIMITED PARTNERSHIP)
- KYRM (91.9 FM; YUMA, AZ; Owner: WORLD RADIO NETWORK INC)
- K220DU (91.9 FM; YUMA, AZ; Owner: NEW LIFE CHRISTIAN SCHOOL)
- KYJT (100.9 FM; YUMA, AZ; Owner: CAPSTAR TX LIMITED PARTNERSHIP)
- KCEC-FM (104.5 FM; WELLTON, AZ; Owner: FARMWORKERS EDUCATIONAL RADIO NETWORK INC.)
- KCFY (88.1 FM; YUMA, AZ; Owner: VOICE OF INTL. CHRISTN. EVANGELISM, INC.)
- K217AW (91.3 FM; YUMA, AZ; Owner: ADVANCED MINISTRIES, INC.)
- KAWC-FM (88.9 FM; YUMA, AZ; Owner: ARIZONA WESTERN COLLEGE)
TV broadcast stations around Yuma:
- KYUM-LP (Channel 16; YUMA, AZ; Owner: POWELL MEREDITH COMMUNICATIONS COMPANY)
- KBFY-LP (Channel 41; FORTUNA, AZ; Owner: POWELL MEREDITH COMMUNICATIONS COMPANY)
- KESE-LP (Channel 35; YUMA, AZ; Owner: GULF-CALIFORNIA BROADCAST COMPANY)
- KYMA (Channel 11; YUMA, AZ; Owner: YUMA BROADCASTING COMPANY)
- KVYE (Channel 7; EL CENTRO, CA; Owner: ENTRAVISION HOLDINGS, LLC)
- KAJB (Channel 54; CALIPATRIA, CA; Owner: CALIPATRIA BROADCASTING COMPANY, LLC)
- National Bridge Inventory (NBI) Statistics
- 84Number of bridges
- 630ft / 192mTotal length
- $1,926,000Total costs
- 805,375Total average daily traffic
- 98,892Total average daily truck traffic
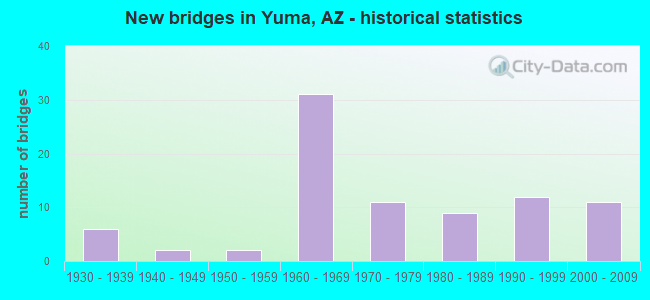
- New bridges - historical statistics
- 61930-1939
- 21940-1949
- 21950-1959
- 311960-1969
- 111970-1979
- 91980-1989
- 121990-1999
- 112000-2009
FCC Registered Antenna Towers: 481 (See the full list of FCC Registered Antenna Towers)
FCC Registered Commercial Land Mobile Towers: 7 (See the full list of FCC Registered Commercial Land Mobile Towers in Yuma, AZ)
FCC Registered Private Land Mobile Towers: 12 (See the full list of FCC Registered Private Land Mobile Towers)
FCC Registered Broadcast Land Mobile Towers: 92 (See the full list of FCC Registered Broadcast Land Mobile Towers)
FCC Registered Microwave Towers: 199 (See the full list of FCC Registered Microwave Towers in this town)
FCC Registered Paging Towers: 12 (See the full list of FCC Registered Paging Towers)
FCC Registered Maritime Coast & Aviation Ground Towers: 31 (See the full list of FCC Registered Maritime Coast & Aviation Ground Towers)
FCC Registered Amateur Radio Licenses: 951 (See the full list of FCC Registered Amateur Radio Licenses in Yuma)
FAA Registered Aircraft Manufacturers and Dealers: 1 (See the full list of FAA Registered Manufacturers and Dealers in Yuma)
FAA Registered Aircraft: 179 (See the full list of FAA Registered Aircraft)
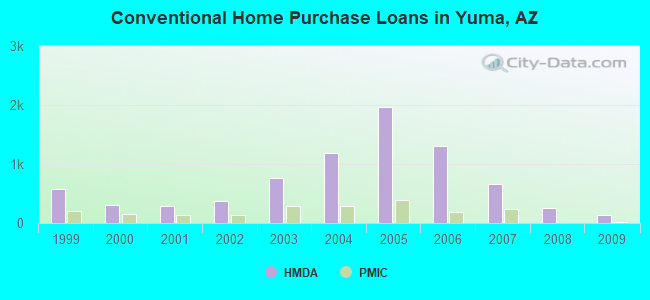
| Home Mortgage Disclosure Act Aggregated Statistics For Year 2009 (Based on 11 full and 9 partial tracts) | ||||||||||||||
| A) FHA, FSA/RHS & VA Home Purchase Loans | B) Conventional Home Purchase Loans | C) Refinancings | D) Home Improvement Loans | E) Loans on Dwellings For 5+ Families | F) Non-occupant Loans on < 5 Family Dwellings (A B C & D) | G) Loans On Manufactured Home Dwelling (A B C & D) | ||||||||
|---|---|---|---|---|---|---|---|---|---|---|---|---|---|---|
| Number | Average Value | Number | Average Value | Number | Average Value | Number | Average Value | Number | Average Value | Number | Average Value | Number | Average Value | |
| LOANS ORIGINATED | 438 | $145,272 | 140 | $136,683 | 783 | $144,552 | 48 | $65,595 | 0 | $0 | 68 | $118,918 | 56 | $84,782 |
| APPLICATIONS APPROVED, NOT ACCEPTED | 18 | $128,199 | 13 | $259,242 | 89 | $148,736 | 8 | $84,222 | 0 | $0 | 6 | $103,985 | 5 | $85,658 |
| APPLICATIONS DENIED | 62 | $134,913 | 38 | $118,273 | 432 | $152,285 | 56 | $39,619 | 0 | $0 | 50 | $107,772 | 24 | $56,606 |
| APPLICATIONS WITHDRAWN | 17 | $124,862 | 26 | $112,460 | 344 | $150,481 | 29 | $71,073 | 0 | $0 | 21 | $85,031 | 18 | $92,228 |
| FILES CLOSED FOR INCOMPLETENESS | 8 | $192,941 | 2 | $111,345 | 34 | $166,619 | 2 | $81,120 | 1 | $139,460 | 3 | $108,933 | 0 | $0 |
Detailed mortgage data for all 20 tracts in Yuma, AZ
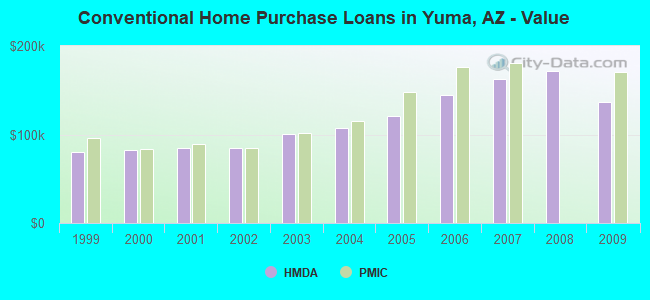
| Private Mortgage Insurance Companies Aggregated Statistics For Year 2009 (Based on 10 full and 8 partial tracts) | ||||||
| A) Conventional Home Purchase Loans | B) Refinancings | C) Non-occupant Loans on < 5 Family Dwellings (A & B) | ||||
|---|---|---|---|---|---|---|
| Number | Average Value | Number | Average Value | Number | Average Value | |
| LOANS ORIGINATED | 17 | $170,287 | 12 | $163,952 | 1 | $307,200 |
| APPLICATIONS APPROVED, NOT ACCEPTED | 10 | $154,803 | 12 | $178,617 | 0 | $0 |
| APPLICATIONS DENIED | 1 | $342,620 | 3 | $183,150 | 0 | $0 |
| APPLICATIONS WITHDRAWN | 0 | $0 | 3 | $174,597 | 0 | $0 |
| FILES CLOSED FOR INCOMPLETENESS | 1 | $81,270 | 0 | $0 | 0 | $0 |
2003 - 2018 National Fire Incident Reporting System (NFIRS) incidents
- Fire incident types reported to NFIRS in Yuma, AZ
- 2,10646.1%Outside Fires
- 1,18826.0%Structure Fires
- 1,04622.9%Mobile Property/Vehicle Fires
- 2254.9%Other
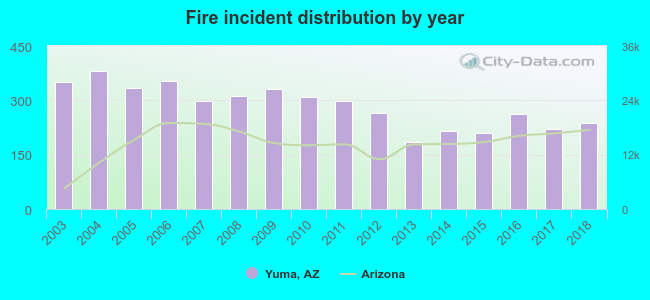 According to the data from the years 2003 - 2018 the average number of fire incidents per year is 285. The highest number of fires - 382 took place in 2004, and the least - 186 in 2013. The data has a decreasing trend.
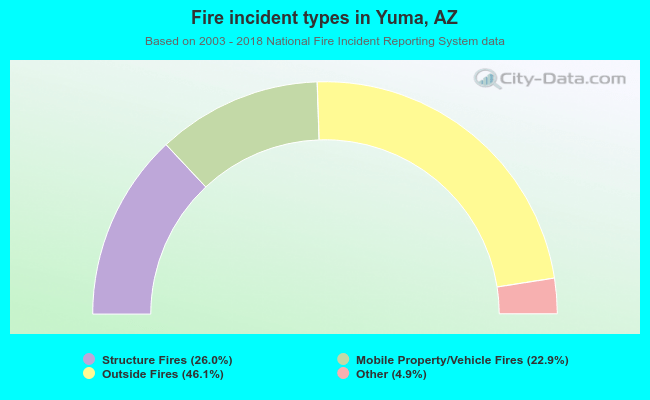 When looking into fire subcategories, the most incidents belonged to: Outside Fires (46.1%), and Structure Fires (26.0%).
Fire-safe hotels and motels in Yuma, Arizona:
- Americas Best Value Inn, 300 E 32ND St, Yuma, Arizona 85364 , Phone: (928) 344-1050, Fax: (928) 344-4877
- Howard Johnson, 3181 S 4TH Ave, Yuma, Arizona 85364 , Phone: (928) 344-1420, Fax: (928) 341-0158
- Motel 6 No 1031, 1445 E 16TH St, Yuma, Arizona 85365 , Phone: (928) 782-9521, Fax: (928) 343-4941
- La Fuente Inn & Suites, 1513 E 16TH St, Yuma, Arizona 85365 , Phone: (928) 329-1814, Fax: (928) 343-2671
- Super 8, 1688 S Riley Ave, Yuma, Arizona 85365 , Phone: (928) 782-2000, Fax: (928) 782-6657
- Hampton Inn & Suites Yuma, 1600 E 16th St, Yuma, Arizona 85365 , Phone: (928) 329-5600, Fax: (928) 329-5601
- Rodeway Inn, 2730 S 4th Avene, Yuma, Arizona 85364 , Phone: (928) 726-6110, Fax: (928) 726-7711
- Springhill Suites, 1825 E 18th St, Yuma, Arizona 85365 , Phone: (928) 783-7853, Fax: (928) 783-7854
- 14 other hotels and motels
| Most common first names in Yuma, AZ among deceased individuals | ||
| Name | Count | Lived (average) |
|---|---|---|
| William | 436 | 74.1 years |
| John | 432 | 74.3 years |
| Robert | 428 | 71.5 years |
| James | 382 | 71.8 years |
| Charles | 341 | 74.4 years |
| Mary | 322 | 77.9 years |
| George | 274 | 74.9 years |
| Frank | 189 | 74.4 years |
| Richard | 184 | 69.9 years |
| Dorothy | 180 | 78.1 years |
| Most common last names in Yuma, AZ among deceased individuals | ||
| Last name | Count | Lived (average) |
|---|---|---|
| Smith | 212 | 76.3 years |
| Johnson | 143 | 75.7 years |
| Brown | 116 | 75.8 years |
| Jones | 108 | 75.4 years |
| Miller | 95 | 78.0 years |
| Williams | 94 | 74.9 years |
| Davis | 92 | 73.4 years |
| Wilson | 77 | 71.0 years |
| Garcia | 73 | 69.9 years |
| Anderson | 73 | 76.8 years |
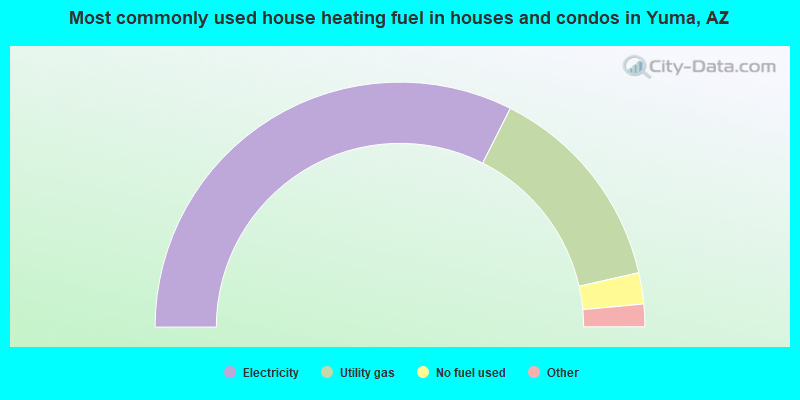
- 64.9%Electricity
- 28.0%Utility gas
- 4.1%No fuel used
- 1.2%Bottled, tank, or LP gas
- 1.1%Solar energy
- 0.4%Other fuel
- 0.2%Wood
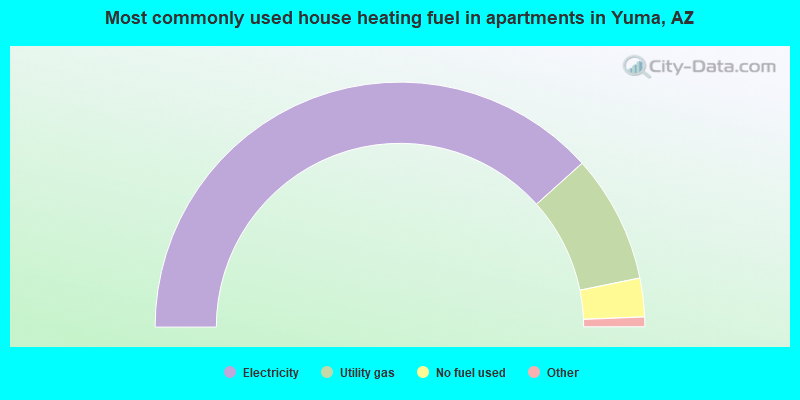
- 76.7%Electricity
- 16.9%Utility gas
- 5.1%No fuel used
- 1.1%Bottled, tank, or LP gas
- 0.3%Solar energy
Yuma compared to Arizona state average:
- Median house value below state average.
- Hispanic race population percentage above state average.
- Foreign-born population percentage above state average.
- Institutionalized population percentage above state average.
Yuma on our top lists:
- #1 on the list of "Top 101 cities with the smallest sunshine amount differences during a year (population 50,000+)"
- #3 on the list of "Top 101 cities with the lowest average yearly precipitation (population 50,000+)"
- #4 on the list of "Top 101 cities with largest percentage of males in occupations: law enforcement workers including supervisors (population 50,000+)"
- #4 on the list of "Top 101 cities with the smallest percentage of high school students in private schools (3,000+ students)"
- #5 on the list of "Top 101 cities with the smallest precipitation differences during a year (population 50,000+)"
- #7 on the list of "Top 101 cities with largest percentage of females in occupations: law enforcement workers including supervisors (population 50,000+)"
- #10 on the list of "Top 101 cities with largest percentage of males in industries: management of companies and enterprises (population 50,000+)"
- #10 on the list of "Top 101 cities with largest percentage of males in industries: public administration (population 50,000+)"
- #11 on the list of "Top 101 cities with the highest daily high temperatures (population 50,000+)"
- #13 on the list of "Top 101 cities with the hottest summers (population 50,000+)"
- #19 on the list of "Top 101 cities with largest percentage of females in occupations: material moving occupations (population 50,000+)"
- #23 on the list of "Top 101 cities with largest percentage of males in occupations: farming, fishing, and forestry occupations (population 50,000+)"
- #23 on the list of "Top 101 cities with largest percentage of males in industries: agriculture, forestry, fishing and hunting (population 50,000+)"
- #35 on the list of "Top 100 cities with shortest commuting times (pop. 50,000+)"
- #37 on the list of "Top 101 cities with the largest differences between daily high and daily low temperatures (population 50,000+)"
- #38 on the list of "Top 101 cities with largest percentage of females in occupations: farming, fishing, and forestry occupations (population 50,000+)"
- #41 on the list of "Top 101 cities with the most people taking a motorcycle to work (population 5,000+)"
- #42 on the list of "Top 101 cities with largest percentage of females in industries: agriculture, forestry, fishing and hunting (population 50,000+)"
- #42 on the list of "Top 101 cities with the lowest maximum monthly morning or afternoon humidity (population 50,000+)"
- #45 on the list of "Top 101 cities with the smallest percentage of elementary and middle school students in private schools (5,000+ students)"
- #5 on the list of "Top 101 counties with the highest Particulate Matter (PM10) Annual air pollution readings in 2012 (µg/m3)"
- #7 on the list of "Top 101 counties with the lowest percentage of residents that visited a dentist within the past year"
- #38 on the list of "Top 101 counties with the highest number of births per 1000 residents 2007-2013"
- #47 on the list of "Top 101 counties with the worst general health status score of residents (1-5), 3 years of data"
- #61 on the list of "Top 101 counties with the lowest percentage of residents that smoked 100+ cigarettes in their lives"

|
|
Total of 92 patent applications in 2008-2024.