Zeeland, Michigan
Submit your own pictures of this city and show them to the world
- OSM Map
- General Map
- Google Map
- MSN Map
Population change since 2000: -2.3%
 |
| Males: 2,670 | |
| Females: 3,001 |
| Median resident age: | 43.2 years |
| Michigan median age: | 40.3 years |
Zip codes: 49464.
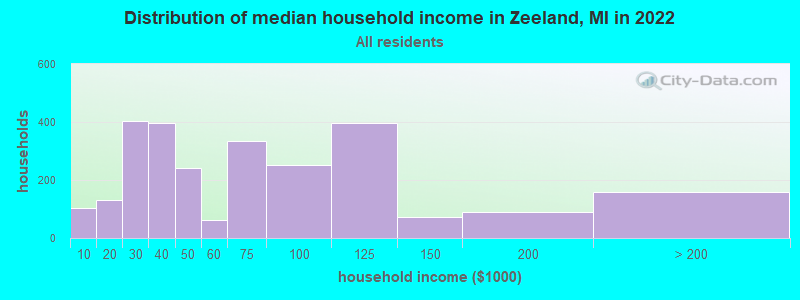
| Zeeland: | $61,745 |
| MI: | $66,986 |
Estimated per capita income in 2022: $40,770 (it was $20,801 in 2000)
Zeeland city income, earnings, and wages data
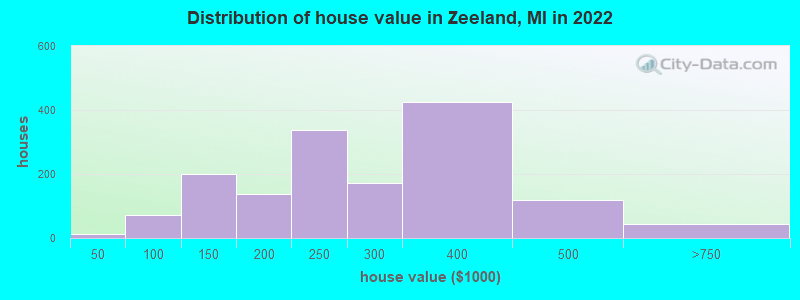
Estimated median house or condo value in 2022: $266,940 (it was $112,800 in 2000)
| Zeeland: | $266,940 |
| MI: | $224,400 |
Mean prices in 2022: all housing units: $262,460; detached houses: $288,072; townhouses or other attached units: $153,973; in 2-unit structures: $306,035; in 3-to-4-unit structures: $230,211; in 5-or-more-unit structures: $96,652
Median gross rent in 2022: $938.
(8.8% for White Non-Hispanic residents, 4.3% for Hispanic or Latino residents, 18.3% for two or more races residents)
Detailed information about poverty and poor residents in Zeeland, MI


Compare current foreclosures near Zeeland, MI:
| Photo | Address | Area | Beds / Baths | Price | Details |
|---|---|---|---|---|---|

|
#1
108th Ave
Zeeland, MI 49464
|
- sq. feet
|
2 baths 3 beds |
show details | |

|
#2
S Division St
Zeeland, MI 49464
|
1,234 sq. feet
|
2 baths 4 beds |
show details | |

|
#3
W Wind Dr # 55
Zeeland, MI 49464
|
- sq. feet
|
- baths - beds |
show details | |

|
#4
N Harvest Ct
Zeeland, MI 49464
|
- sq. feet
|
- baths - beds |
show details | |

|
#5
W Wind Dr
Zeeland, MI 49464
|
- sq. feet
|
- baths - beds |
show details | |

|
#6
Harrow Ln
Zeeland, MI 49464
|
- sq. feet
|
- baths - beds |
show details | |

|
#7
Chicago Dr # 8
Zeeland, MI 49464
|
- sq. feet
|
- baths - beds |
show details | |

|
#8
Mesa View Dr
Zeeland, MI 49464
|
- sq. feet
|
- baths - beds |
show details | |

|
#9
Gay Paree Dr
Zeeland, MI 49464
|
- sq. feet
|
- baths - beds |
show details | |

|
#10
Gordon St
Zeeland, MI 49464
|
- sq. feet
|
- baths - beds |
show details |
| Photo | Address | Area | Beds / Baths | Price | Details |
|---|---|---|---|---|---|

|
#11
S State St
Zeeland, MI 49464
|
- sq. feet
|
- baths - beds |
show details | |

|
#12
152nd Ave
Holland, MI 49424
|
1,757 sq. feet
|
2 baths 2 beds |
show details | |

|
#13
Erin Isle Dr
Holland, MI 49424
|
2,704 sq. feet
|
4 baths 7 beds |
show details | |

|
#14
Port Sheldon St
Hudsonville, MI 49426
|
1,025 sq. feet
|
1 baths 3 beds |
show details | |

|
#15
135th Ave
Hamilton, MI 49419
|
1,860 sq. feet
|
2 baths 4 beds |
show details | |

|
#16
Maple Ave
Jenison, MI 49428
|
1,124 sq. feet
|
1 baths 3 beds |
show details | |

|
#17
Byron Center Ave SW
Wyoming, MI 49519
|
1,089 sq. feet
|
4 baths 3 beds |
show details | |

|
#18
Porter Ct SW # 67
Grandville, MI 49418
|
904 sq. feet
|
1 baths 1 beds |
show details | |

|
#19
4th Ave
Holland, MI 49424
|
884 sq. feet
|
1 baths 3 beds |
show details | |

|
#20
Nevada Ridge Dr SW
Byron Center, MI 49315
|
979 sq. feet
|
1 baths 2 beds |
show details |
| Photo | Address | Area | Beds / Baths | Price | Details |
|---|---|---|---|---|---|

|
#21
Red Pine Dr
Dorr, MI 49323
|
1,140 sq. feet
|
1 baths 2 beds |
show details | |

|
#22
Fairway Dr
Jenison, MI 49428
|
- sq. feet
|
2 baths 3 beds |
show details | |

|
#23
Joan Dr
Dorr, MI 49323
|
864 sq. feet
|
1 baths 3 beds |
show details | |

|
#24
W 32nd St
Holland, MI 49423
|
1,522 sq. feet
|
1 baths 3 beds |
show details | |

|
#25
W 32nd St
Holland, MI 49423
|
1,008 sq. feet
|
1 baths 2 beds |
show details | |

|
#26
Sandy Dr
Dorr, MI 49323
|
1,630 sq. feet
|
2 baths 4 beds |
show details | |

|
#27
Port Sheldon St
Hudsonville, MI 49426
|
- sq. feet
|
2 baths 3 beds |
show details | |

|
#28
E 40th St
Holland, MI 49423
|
1,216 sq. feet
|
1 baths 3 beds |
show details | |

|
#29
Aniline Ave N
Holland, MI 49424
|
1,078 sq. feet
|
2 baths - beds |
show details | |

|
#30
Blue Star Hwy
Fennville, MI 49408
|
1,248 sq. feet
|
1 baths 1 beds |
show details |
| Photo | Address | Area | Beds / Baths | Price | Details |
|---|---|---|---|---|---|

|
#31
138th Ave
Hamilton, MI 49419
|
1,800 sq. feet
|
2 baths - beds |
show details | |

|
#32
Litchfield Dr
Dorr, MI 49323
|
900 sq. feet
|
1 baths - beds |
show details | |

|
#33
River Ridge Ct
Dorr, MI 49323
|
2,314 sq. feet
|
2 baths - beds |
show details | |

|
#34
21st St
Dorr, MI 49323
|
1,404 sq. feet
|
1 baths - beds |
show details | |

|
#35
Casper Ave # 191
Allendale, MI 49401
|
- sq. feet
|
- baths - beds |
show details | |

|
#36
Maple Ct
Allendale, MI 49401
|
- sq. feet
|
- baths - beds |
show details | |

|
#37
Lincoln Ave # 9
Holland, MI 49423
|
- sq. feet
|
- baths - beds |
show details | |

|
#38
Kuiper Dr SW
Grandville, MI 49418
|
- sq. feet
|
- baths - beds |
show details | |

|
#39
Kistler Dr
Allendale, MI 49401
|
- sq. feet
|
- baths - beds |
show details | |

|
#40
Mt Moritz Ln
Allendale, MI 49401
|
- sq. feet
|
- baths - beds |
show details |
| Photo | Address | Area | Beds / Baths | Price | Details |
|---|---|---|---|---|---|

|
#41
Boyne Blvd
Allendale, MI 49401
|
- sq. feet
|
- baths - beds |
show details | |

|
#42
Twin Home St
Jenison, MI 49428
|
- sq. feet
|
- baths - beds |
show details | |

|
#43
Mountain Ash Ave NW
Grand Rapids, MI 49534
|
- sq. feet
|
- baths - beds |
show details | |

|
#44
48th Ave Apt J4
Allendale, MI 49401
|
- sq. feet
|
- baths - beds |
show details | |

|
#45
Mt St Ann St, # 297
Allendale, MI 49401
|
- sq. feet
|
- baths - beds |
show details | |

|
#46
Silverbrook Dr
Grand Haven, MI 49417
|
- sq. feet
|
- baths - beds |
show details | |

|
#47
144th Ave
Dorr, MI 49323
|
- sq. feet
|
- baths - beds |
show details | |

|
#48
Northern Shrs
Holland, MI 49424
|
- sq. feet
|
- baths - beds |
show details | |

|
#49
Pinewood Dr
Grand Haven, MI 49417
|
- sq. feet
|
- baths - beds |
show details | |

|
Check over 1 million property listings on Foreclosure.com!
|
browse all offers | |||


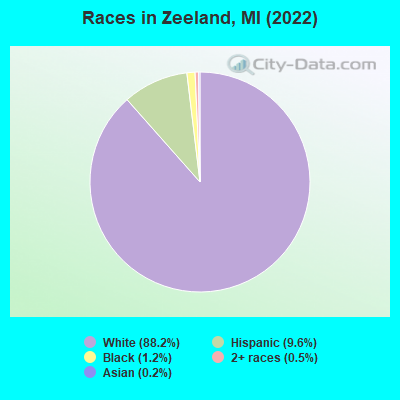
- 5,10688.2%White alone
- 5579.6%Hispanic
- 671.2%Black alone
- 300.5%Two or more races
- 100.2%Asian alone
Races in Zeeland detailed stats: ancestries, foreign born residents, place of birth
According to our research of Michigan and other state lists, there were 62 registered sex offenders living in Zeeland, Michigan as of April 27, 2024.
The ratio of all residents to sex offenders in Zeeland is 92 to 1.
Type |
2009 |
2010 |
2011 |
2012 |
2013 |
2014 |
2015 |
2016 |
2017 |
2018 |
2019 |
2020 |
2021 |
2022 |
|---|---|---|---|---|---|---|---|---|---|---|---|---|---|---|
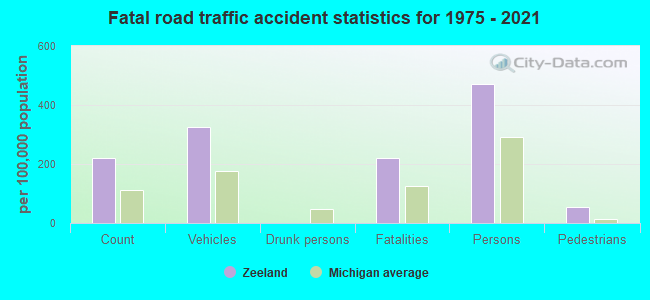
| Murders (per 100,000) | 0 (0.0) | 0 (0.0) | 0 (0.0) | 0 (0.0) | 0 (0.0) | 0 (0.0) | 0 (0.0) | 0 (0.0) | 0 (0.0) | 0 (0.0) | 1 (17.9) | 0 (0.0) | 0 (0.0) | 0 (0.0) |
| Rapes (per 100,000) | 1 (18.5) | 2 (36.3) | 3 (54.5) | 4 (71.9) | 1 (17.9) | 2 (35.5) | 4 (70.7) | 7 (123.9) | 3 (53.6) | 5 (89.8) | 4 (71.8) | 4 (72.2) | 5 (90.5) | 2 (35.3) |
| Robberies (per 100,000) | 0 (0.0) | 0 (0.0) | 0 (0.0) | 0 (0.0) | 1 (17.9) | 0 (0.0) | 0 (0.0) | 0 (0.0) | 1 (17.9) | 0 (0.0) | 0 (0.0) | 0 (0.0) | 0 (0.0) | 0 (0.0) |
| Assaults (per 100,000) | 5 (92.4) | 9 (163.5) | 2 (36.4) | 7 (125.9) | 2 (35.9) | 18 (319.7) | 7 (123.8) | 8 (141.6) | 10 (178.8) | 6 (107.8) | 6 (107.7) | 7 (126.4) | 15 (271.5) | 12 (211.6) |
| Burglaries (per 100,000) | 20 (369.7) | 20 (363.4) | 31 (563.6) | 39 (701.4) | 57 (1,022) | 65 (1,155) | 75 (1,326) | 38 (672.6) | 27 (482.7) | 18 (323.3) | 15 (269.2) | 4 (72.2) | 4 (72.4) | 2 (35.3) |
| Thefts (per 100,000) | 59 (1,091) | 79 (1,435) | 96 (1,745) | 61 (1,097) | 63 (1,130) | 70 (1,243) | 70 (1,238) | 59 (1,044) | 68 (1,216) | 77 (1,383) | 32 (574.3) | 25 (451.3) | 38 (687.9) | 30 (529.1) |
| Auto thefts (per 100,000) | 3 (55.5) | 3 (54.5) | 0 (0.0) | 2 (36.0) | 2 (35.9) | 1 (17.8) | 2 (35.4) | 1 (17.7) | 3 (53.6) | 2 (35.9) | 2 (35.9) | 4 (72.2) | 0 (0.0) | 4 (70.5) |
| Arson (per 100,000) | 0 (0.0) | 0 (0.0) | 2 (36.4) | 2 (36.0) | 2 (35.9) | 0 (0.0) | 2 (35.4) | 0 (0.0) | 1 (17.9) | 0 (0.0) | 0 (0.0) | 0 (0.0) | 0 (0.0) | 0 (0.0) |
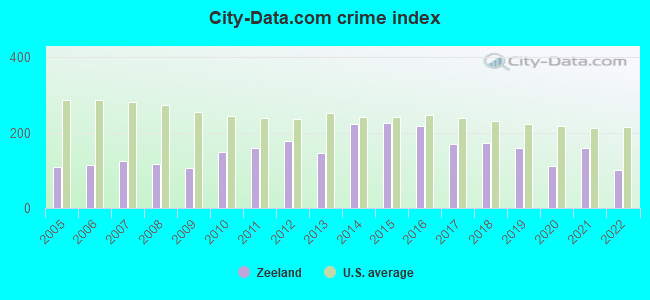
| City-Data.com crime index | 107.2 | 149.0 | 160.2 | 178.6 | 146.5 | 224.3 | 226.5 | 217.7 | 170.7 | 174.2 | 159.5 | 111.9 | 159.3 | 99.8 |
The City-Data.com crime index weighs serious crimes and violent crimes more heavily. Higher means more crime, U.S. average is 246.1. It adjusts for the number of visitors and daily workers commuting into cities.
Crime rate in Zeeland detailed stats: murders, rapes, robberies, assaults, burglaries, thefts, arson
Full-time law enforcement employees in 2021, including police officers: 11 (10 officers - 10 male; 0 female).
| Officers per 1,000 residents here: | 1.81 |
| Michigan average: | 1.86 |
 Recent articles from our blog. Our writers, many of them Ph.D. graduates or candidates, create easy-to-read articles on a wide variety of topics.

 | Grand Rapids for Dummies (16 replies) |
| Holland (32 replies) |
| Top city's in MI (36 replies) |
| Best upscale area with acreage and good schools? (8 replies) |
| Michiganders, I need compare contrast on Kent County vs. Ottawa County burbs surrounding Grand Rapids (7 replies) |
| Southern California to Grand rapids area (15 replies) |
Latest news from Zeeland, MI collected exclusively by city-data.com from local newspapers, TV, and radio stations
Ancestries: Dutch (57.4%), German (8.5%), American (4.4%), Swedish (2.8%), European (1.6%), English (1.0%).
Current Local Time: EST time zone
Elevation: 646 feet
Land area: 3.01 square miles.
Population density: 1,883 people per square mile (low).
69 residents are foreign born
| This city: | 1.2% |
| Michigan: | 6.9% |
Median real estate property taxes paid for housing units with mortgages in 2022: $2,929 (1.1%)
Median real estate property taxes paid for housing units with no mortgage in 2022: $2,639 (1.0%)
Nearest city with pop. 50,000+: Wyoming, MI  (17.3 miles , pop. 69,368).
Nearest city with pop. 200,000+: Milwaukee, WI (99.6 miles , pop. 596,974).
Nearest city with pop. 1,000,000+: Chicago, IL (108.3 miles , pop. 2,896,016).
Nearest cities:
Latitude: 42.81 N, Longitude: 86.02 W
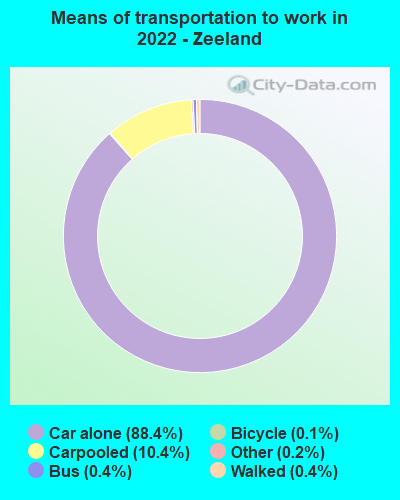
Daytime population change due to commuting: +9,572 (+165.3%)
Workers who live and work in this city: 609 (20.0%)
Area code: 616
Zeeland, Michigan accommodation & food services, waste management - Economy and Business Data
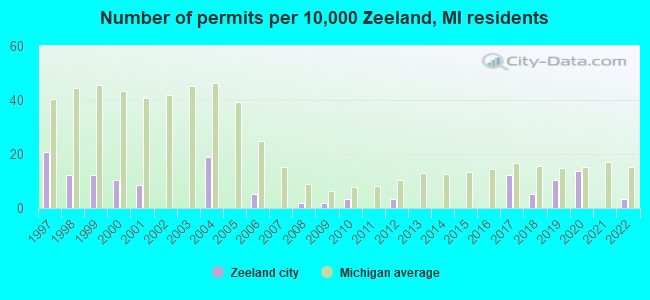
Single-family new house construction building permits:
- 2022: 2 buildings, average cost: $262,500
- 2020: 8 buildings, average cost: $174,100
- 2019: 6 buildings, average cost: $136,800
- 2018: 3 buildings, average cost: $136,700
- 2017: 7 buildings, average cost: $150,000
- 2012: 2 buildings, average cost: $144,000
- 2010: 2 buildings, average cost: $160,000
- 2009: 1 building, cost: $200,000
- 2008: 1 building, cost: $120,000
- 2006: 3 buildings, average cost: $101,700
- 2004: 11 buildings, average cost: $162,700
- 2001: 5 buildings, average cost: $114,200
- 2000: 6 buildings, average cost: $94,700
- 1999: 7 buildings, average cost: $138,900
- 1998: 7 buildings, average cost: $110,100
- 1997: 12 buildings, average cost: $111,900
| Here: | 2.7% |
| Michigan: | 3.5% |
Population change in the 1990s: +348 (+6.4%).
- Health care (9.5%)
- Furniture & related product manufacturing (9.5%)
- Educational services (7.8%)
- Transportation equipment (6.7%)
- Construction (5.7%)
- Finance & insurance (3.5%)
- Social assistance (3.3%)
- Furniture & related product manufacturing (12.7%)
- Construction (9.5%)
- Transportation equipment (8.6%)
- Educational services (7.0%)
- Metal & metal products (5.1%)
- Nonmetallic mineral products (3.3%)
- Wood products (3.3%)
- Health care (17.2%)
- Educational services (8.5%)
- Furniture & related product manufacturing (6.2%)
- Social assistance (6.1%)
- Administrative & support & waste management services (4.9%)
- Transportation equipment (4.7%)
- Accommodation & food services (4.7%)
- Other production occupations, including supervisors (9.4%)
- Sales representatives, services, wholesale and manufacturing (4.1%)
- Preschool, kindergarten, elementary, and middle school teachers (4.1%)
- Assemblers and fabricators (3.9%)
- Metal workers and plastic workers (3.6%)
- Other office and administrative support workers, including supervisors (3.5%)
- Secretaries and administrative assistants (3.5%)
- Other production occupations, including supervisors (15.0%)
- Metal workers and plastic workers (5.6%)
- Electrical equipment mechanics and other installation, maintenance, and repair workers, including supervisors (5.2%)
- Driver/sales workers and truck drivers (5.1%)
- Sales representatives, services, wholesale and manufacturing (4.7%)
- Preschool, kindergarten, elementary, and middle school teachers (3.5%)
- Material recording, scheduling, dispatching, and distributing workers (3.4%)
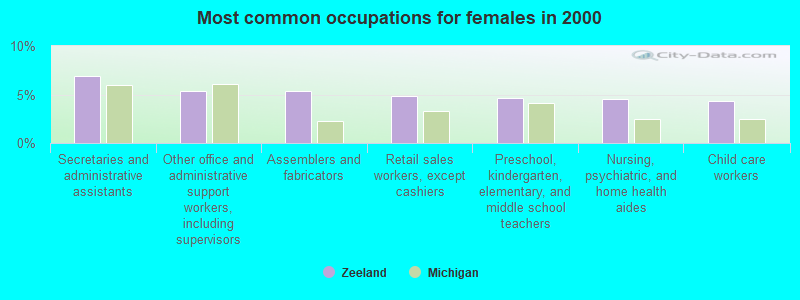
- Secretaries and administrative assistants (6.9%)
- Other office and administrative support workers, including supervisors (5.3%)
- Assemblers and fabricators (5.3%)
- Retail sales workers, except cashiers (4.9%)
- Preschool, kindergarten, elementary, and middle school teachers (4.6%)
- Nursing, psychiatric, and home health aides (4.6%)
- Child care workers (4.3%)
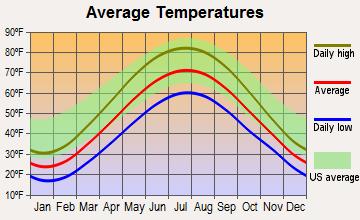
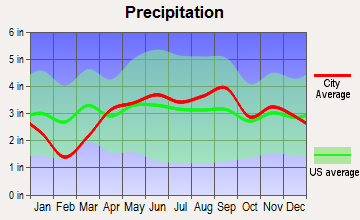
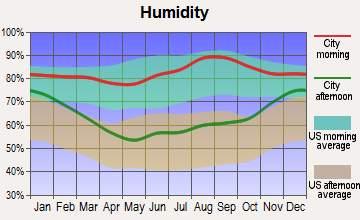
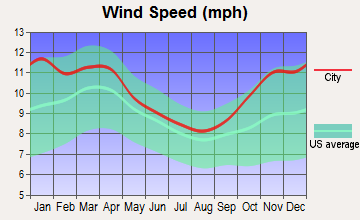
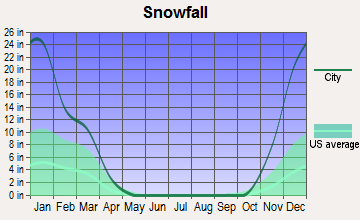
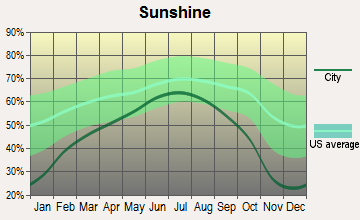
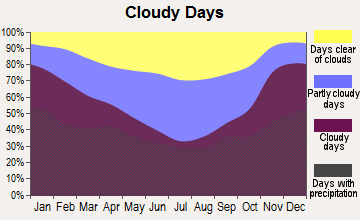
Average climate in Zeeland, Michigan
Based on data reported by over 4,000 weather stations
|
|

(lower is better)
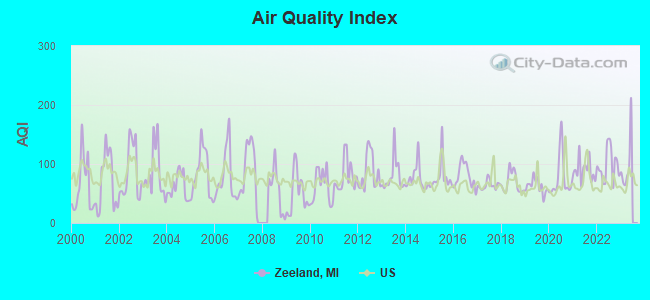
Air Quality Index (AQI) level in 2022 was 97.7. This is worse than average.
| City: | 97.7 |
| U.S.: | 72.6 |
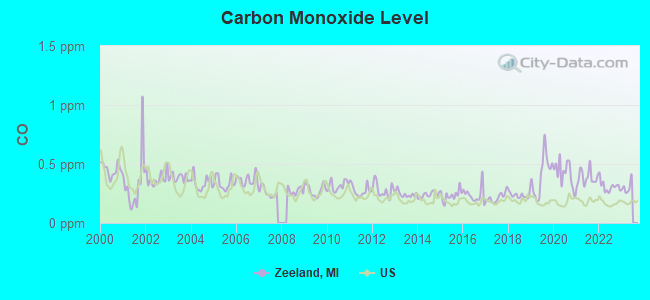
Carbon Monoxide (CO) [ppm] level in 2022 was 0.310. This is worse than average. Closest monitor was 20.7 miles away from the city center.
| City: | 0.310 |
| U.S.: | 0.251 |
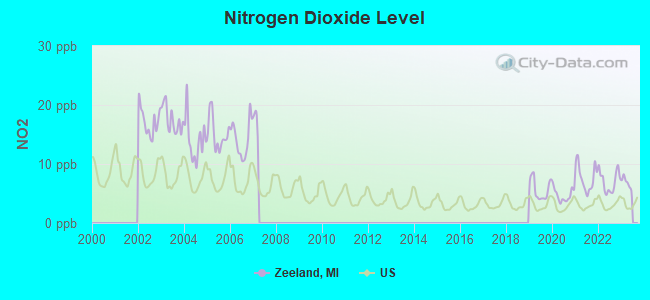
Nitrogen Dioxide (NO2) [ppb] level in 2022 was 7.01. This is worse than average. Closest monitor was 7.3 miles away from the city center.
| City: | 7.01 |
| U.S.: | 5.11 |
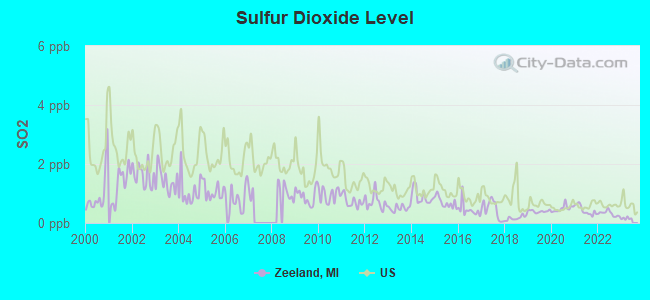
Sulfur Dioxide (SO2) [ppb] level in 2022 was 0.321. This is significantly better than average. Closest monitor was 3.5 miles away from the city center.
| City: | 0.321 |
| U.S.: | 1.515 |
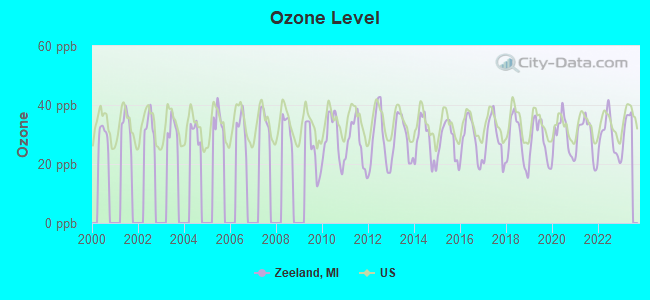
Ozone [ppb] level in 2022 was 29.4. This is about average. Closest monitor was 10.2 miles away from the city center.
| City: | 29.4 |
| U.S.: | 33.3 |
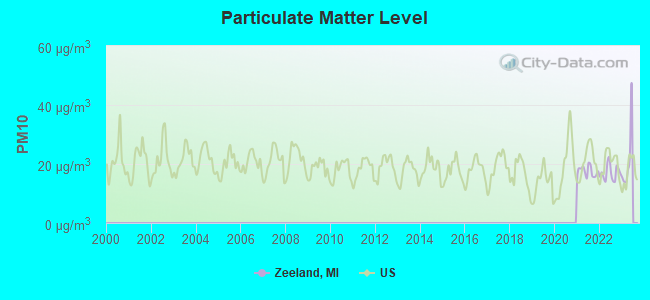
Particulate Matter (PM10) [µg/m3] level in 2022 was 17.0. This is about average. Closest monitor was 1.4 miles away from the city center.
| City: | 17.0 |
| U.S.: | 19.2 |
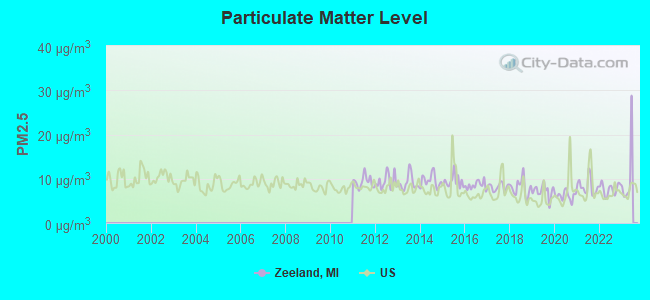
Particulate Matter (PM2.5) [µg/m3] level in 2022 was 7.70. This is about average. Closest monitor was 7.3 miles away from the city center.
| City: | 7.70 |
| U.S.: | 8.11 |
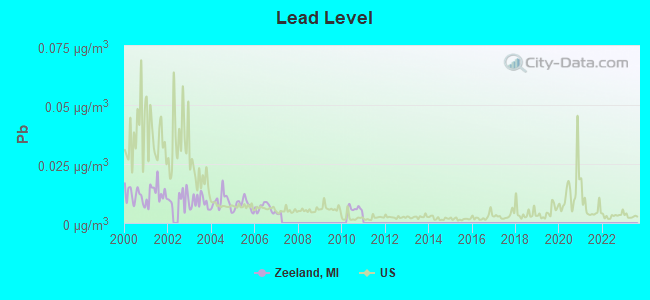
Lead (Pb) [µg/m3] level in 2010 was 0.00613. This is significantly better than average. Closest monitor was 4.8 miles away from the city center.
| City: | 0.00613 |
| U.S.: | 0.00931 |
Tornado activity:
Zeeland-area historical tornado activity is near Michigan state average. It is 7% smaller than the overall U.S. average.
On 4/3/1956, a category F5 (max. wind speeds 261-318 mph) tornado 14.2 miles away from the Zeeland city center killed 18 people and injured 340 people and caused between $50,000 and $500,000 in damages.
On 4/11/1965, a category F4 (max. wind speeds 207-260 mph) tornado 15.3 miles away from the city center killed 5 people and injured 142 people and caused between $500,000 and $5,000,000 in damages.
Earthquake activity:
Zeeland-area historical earthquake activity is significantly above Michigan state average. It is 19% smaller than the overall U.S. average.On 5/2/2015 at 16:23:07, a magnitude 4.2 (4.2 MW, Depth: 2.8 mi, Class: Light, Intensity: IV - V) earthquake occurred 49.9 miles away from Zeeland center
On 4/18/2008 at 09:36:59, a magnitude 5.4 (5.1 MB, 4.8 MS, 5.4 MW, 5.2 MW, Class: Moderate, Intensity: VI - VII) earthquake occurred 317.0 miles away from Zeeland center
On 1/31/1986 at 16:46:43, a magnitude 5.0 (5.0 MB) earthquake occurred 262.5 miles away from the city center
On 9/25/1998 at 19:52:52, a magnitude 5.2 (4.8 MB, 4.3 MS, 5.2 LG, 4.5 MW, Depth: 3.1 mi) earthquake occurred 302.3 miles away from the city center
On 7/12/1986 at 08:19:37, a magnitude 4.5 (4.5 MB) earthquake occurred 178.8 miles away from Zeeland center
On 6/10/1987 at 23:48:54, a magnitude 5.1 (4.9 MB, 4.4 MS, 4.6 MS, 5.1 LG) earthquake occurred 292.8 miles away from the city center
Magnitude types: regional Lg-wave magnitude (LG), body-wave magnitude (MB), surface-wave magnitude (MS), moment magnitude (MW)
Natural disasters:
The number of natural disasters in Ottawa County (15) is near the US average (15).Major Disasters (Presidential) Declared: 9
Emergencies Declared: 5
Causes of natural disasters: Storms: 8, Floods: 7, Tornadoes: 4, Snowstorms: 2, Winds: 2, Winter Storms: 2, Blizzard: 1, Hurricane: 1, Other: 1 (Note: some incidents may be assigned to more than one category).
Main business address for: MILLER HERMAN INC (OFFICE FURNITURE), GENTEX CORP (MOTOR VEHICLE PARTS & ACCESSORIES).
Hospitals and medical centers in Zeeland:
Airports located in Zeeland:
- Ottawa Executive Airport (Z98) (Runways: 1, Itinerant Ops: 5,000, Local Ops: 5,000)
- Curt's Place Airport (6MI3) (Runways: 1)
- Dewind Field Airport (85MI) (Runways: 1)
- J P's Field Airport (6MI7) (Runways: 1)
Amtrak stations near Zeeland:
- 5 miles: HOLLAND (171 LINCOLN AVE.) . Services: enclosed waiting area, public payphones, vending machines, free short-term parking, free long-term parking, call for taxi service, intercity bus service.
- 20 miles: GRAND RAPIDS (MARKET & WEALTHY STS.) . Services: enclosed waiting area, public restrooms, public payphones, free short-term parking, free long-term parking, call for taxi service, public transit connection.
Colleges/universities with over 2000 students nearest to Zeeland:
- Hope College (about 5 miles; Holland, MI; Full-time enrollment: 3,535)
- Grand Valley State University (about 13 miles; Allendale, MI; FT enrollment: 21,982)
- Grand Rapids Community College (about 21 miles; Grand Rapids, MI; FT enrollment: 11,296)
- Calvin College (about 24 miles; Grand Rapids, MI; FT enrollment: 4,117)
- Cornerstone University (about 25 miles; Grand Rapids, MI; FT enrollment: 2,573)
- Davenport University (about 25 miles; Grand Rapids, MI; FT enrollment: 6,955)
- Baker College of Muskegon (about 32 miles; Muskegon, MI; FT enrollment: 3,293)
Public high schools in Zeeland:
- ZEELAND EAST HIGH SCHOOL (Students: 958, Location: 3333 96TH AVE, Grades: 9-12)
- ZEELAND WEST HIGH SCHOOL (Students: 774, Location: 3390 100TH AVE, Grades: 9-12)
- INNOCADEMY (Location: 8485 HOMESTEAD DR, Grades: KG-12, Charter school)
- ICADEMY GLOBAL (Location: 8485 HOMESTEAD DR, Grades: KG-12, Charter school)
- VENTURE ACADEMY (Location: 3333 96TH AVE, Grades: 9-12)
Public elementary/middle schools in Zeeland:
- CITYSIDE MIDDLE SCHOOL (Students: 754, Location: 320 EAST MAIN AVE, Grades: 6-8)
- QUINCY ELEMENTARY SCHOOL (Students: 522, Location: 10155 QUINCY ST, Grades: PK-5)
- WOODBRIDGE ELEMENTARY SCHOOL (Students: 412, Location: 9110 WOODBRIDGE ST, Grades: KG-5)
- CREEKSIDE MIDDLE SCHOOL (Students: 408, Location: 179 WEST ROOSEVELT AVE, Grades: 6-8)
- NEW GRONINGEN SCHOOL (Students: 394, Location: 10542 CHICAGO DR, Grades: KG-5)
- ROOSEVELT ELEMENTARY SCHOOL (Students: 363, Location: 175 WEST ROOSEVELT AVE, Grades: PK-5)
- LINCOLN ELEMENTARY SCHOOL (Location: 60 EAST LINCOLN AVE, Grades: PK-5)
- ZEELAND QUEST (Location: 175 W ROOSEVELT AVE, Grades: KG-8)
- ADAMS ELEMENTARY SCHOOL (Location: 7447 ADAMS ST, Grades: KG-5)
Private elementary/middle schools in Zeeland:
Points of interest:
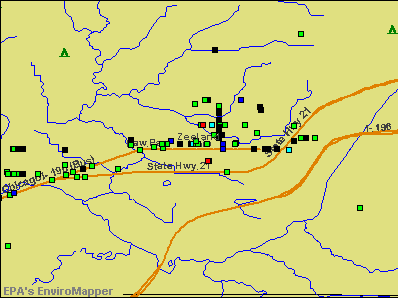
Notable locations in Zeeland: Zeeland Fire Department Roosevelt Station (A), Zeeland Fire Department (B), Zeeland Historical Museum (C), Howard Miller Public Library (D), Zeeland City Hall (E). Display/hide their locations on the map
Main business address in Zeeland include: MILLER HERMAN INC (A), GENTEX CORP (B). Display/hide their locations on the map
Churches in Zeeland include: First Christian Reformed Church (A), North Street Christian Church (B), Third Christian Reformed Church (C), Second Reformed Church (D), First Reformed Church (E), First Baptist Church (F), Faith Reformed Church (G), Haven Christian Reformed Church (H), Bethel Christian Reformed Church (I). Display/hide their locations on the map
Cemetery: Zeeland Cemetery (1). Display/hide its location on the map
Parks in Zeeland include: First Reformed Church Historical Marker (1), Zeeland Cemetery Historical Marker (2), Hoagland Park (3), Lawrence Park (4), Huizenga Park (5). Display/hide their locations on the map
Tourist attractions: Dekker HUIS (Museums; 37 East Main Avenue), Critter (Cultural Attractions- Events- & Facilities; 9275 Adams Street).
Birthplace of: Jim Kaat - Baseball player and coach, Bill Huizenga - Politician, Chris Kapenga - Politician, Dan Redder - College basketball player (Eastern Michigan Eagles), Eugene van Tamelen - Chemist, Ron Essink - Football player, Ron Schipper - Football coaches, Tyson DeVree - College football player (Colorado Buffaloes).
Drinking water stations with addresses in Zeeland and their reported violations in the past:
THE PHEASANT GOLF COURSE (Population served: 100, Groundwater):Past health violations:PLEASANT ACRES TRAILER PARK (Population served: 50, Groundwater):Past monitoring violations:
- MCL, Monthly (TCR) - In SEP-2008, Contaminant: Coliform. Follow-up actions: St Violation/Reminder Notice (OCT-15-2008), St Unresolved (JAN-08-2009), St Compliance achieved (MAY-19-2009)
- One routine major monitoring violation
Past monitoring violations:HOLLAND CADET CAMPGROUND (Population served: 30, Groundwater):
- One routine major monitoring violation
Past monitoring violations:
- 3 routine major monitoring violations
- One regular monitoring violation
Drinking water stations with addresses in Zeeland that have no violations reported:
- PARADISE COVE CONDOMINIUM RESORT/WEST WELL (Population served: 150, Primary Water Source Type: Groundwater)
- PARADISE COVE CONDOMINIUM RESORT - EAST WELL (Population served: 150, Primary Water Source Type: Groundwater)
- SCALLEY LAKE PARK (Population served: 50, Primary Water Source Type: Groundwater)
- NORTH POLE ICE CREAM SHOPPE (Population served: 30, Primary Water Source Type: Groundwater)
| This city: | 2.4 people |
| Michigan: | 2.5 people |
| This city: | 63.5% |
| Whole state: | 66.0% |
| This city: | 3.4% |
| Whole state: | 6.4% |
Likely homosexual households (counted as self-reported same-sex unmarried-partner households)
- Lesbian couples: 0.2% of all households
- Gay men: 0.1% of all households
11 people in group homes intended for adults in 2010
199 people in nursing homes in 2000
12 people in homes for the mentally retarded in 2000
Banks with branches in Zeeland (2011 data):
- The Huntington National Bank: 7 branches. Info updated 2012/04/02: Bank assets: $54,183.4 mil, Deposits: $44,300.3 mil, headquarters in Columbus, OH, positive income, Commercial Lending Specialization, 878 total offices, Holding Company: Huntington Bancshares Incorporated
- Macatawa Bank: 815 East Main Street Branch, Royal Park Place Branch, Zeeland State Street Branch. Info updated 2011/07/20: Bank assets: $1,506.0 mil, Deposits: $1,225.8 mil, headquarters in Holland, MI, positive income, Commercial Lending Specialization, 30 total offices, Holding Company: Macatawa Bank Corporation
- Chemical Bank: Zeeland Branch at 9581 Riley, branch established on 1998/03/16; Zeeland Branch at 501 West Main Street, branch established on 1976/11/17. Info updated 2010/07/30: Bank assets: $5,331.9 mil, Deposits: $4,367.1 mil, headquarters in Midland, MI, positive income, Commercial Lending Specialization, 146 total offices, Holding Company: Chemical Financial Corporation
- Fifth Third Bank: Zeeland West Branch at 523 West Main St., branch established on 1934/01/01. Info updated 2009/10/05: Bank assets: $114,540.4 mil, Deposits: $89,689.1 mil, headquarters in Cincinnati, OH, positive income, Commercial Lending Specialization, 1378 total offices, Holding Company: Fifth Third Bancorp
- West Michigan Community Bank: Zeeland Branch at 59 West Washington Street, Unit K, branch established on 2012/02/20. Info updated 2011/07/12: Bank assets: $119.3 mil, Deposits: $103.3 mil, headquarters in Hudsonville, MI, negative income in the last year, Commercial Lending Specialization, 6 total offices
- PNC Bank, National Association: Zeeland Branch at 250 South State Street, branch established on 1994/05/19. Info updated 2012/03/20: Bank assets: $263,309.6 mil, Deposits: $197,343.0 mil, headquarters in Wilmington, DE, positive income, Commercial Lending Specialization, 3085 total offices, Holding Company: Pnc Financial Services Group, Inc., The
For population 15 years and over in Zeeland:
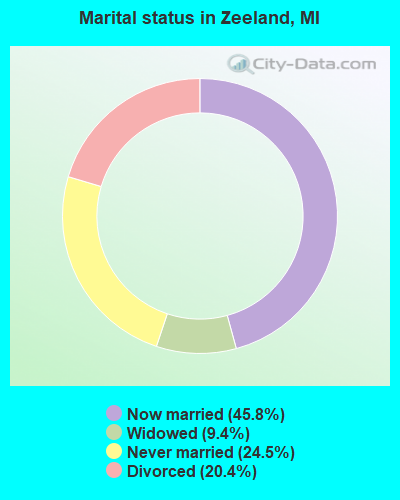
- Never married: 24.5%
- Now married: 45.8%
- Separated: 0.0%
- Widowed: 9.4%
- Divorced: 20.4%
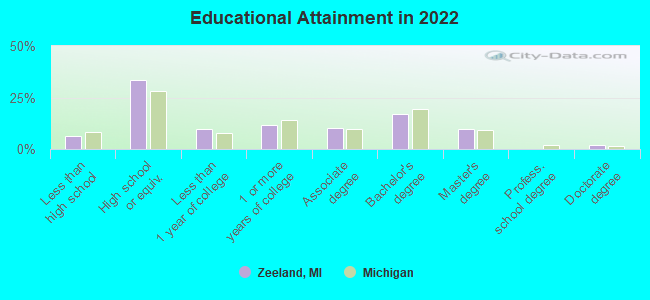
For population 25 years and over in Zeeland:
- High school or higher: 93.9%
- Bachelor's degree or higher: 27.5%
- Graduate or professional degree: 11.1%
- Unemployed: 1.3%
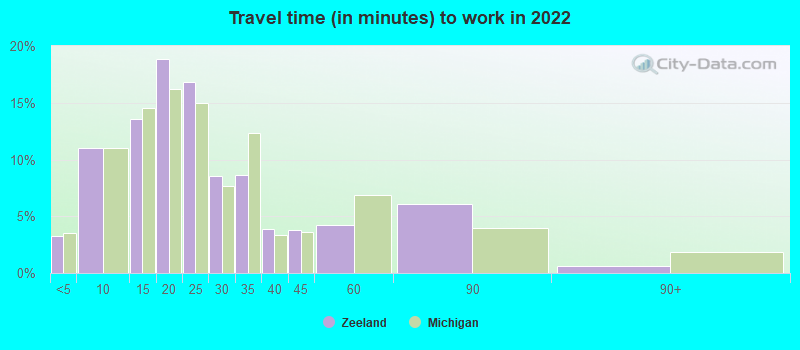
- Mean travel time to work (commute): 14.7 minutes
| Here: | 11.0 |
| Michigan average: | 11.0 |
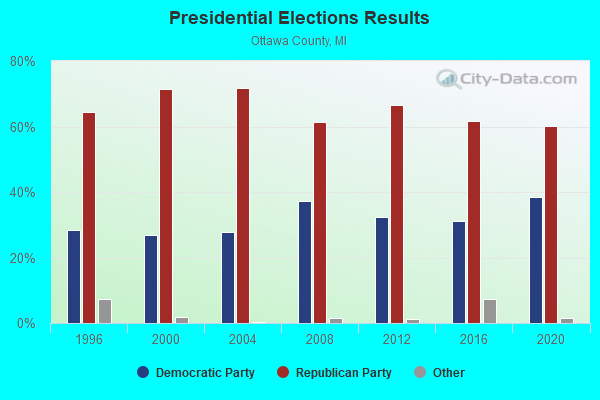
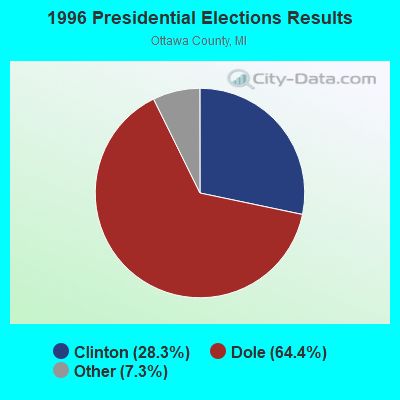

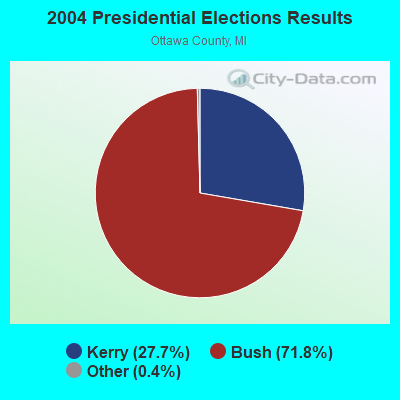
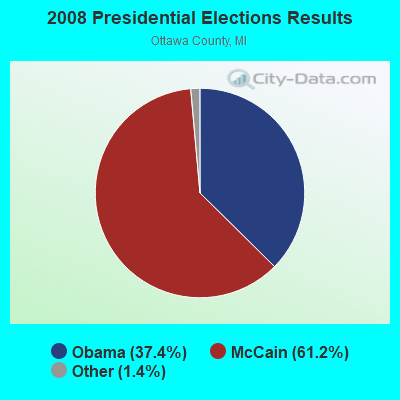
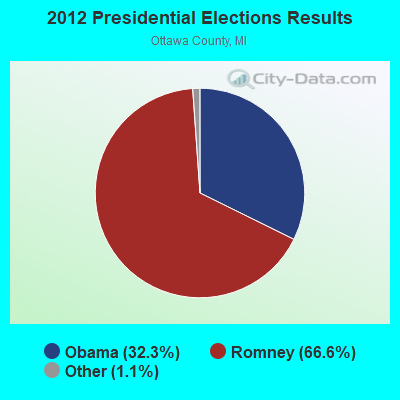
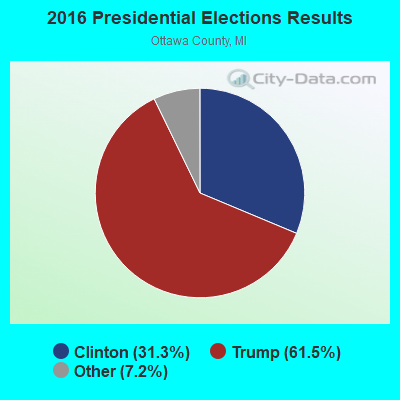

Graphs represent county-level data. Detailed 2008 Election Results
Religion statistics for Zeeland, MI (based on Ottawa County data)
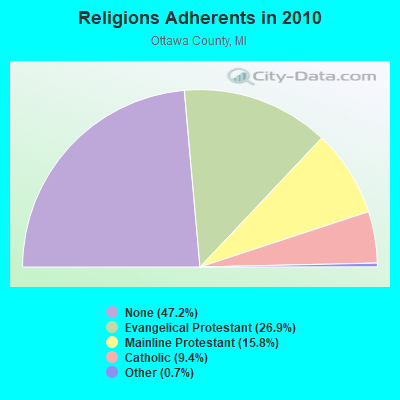
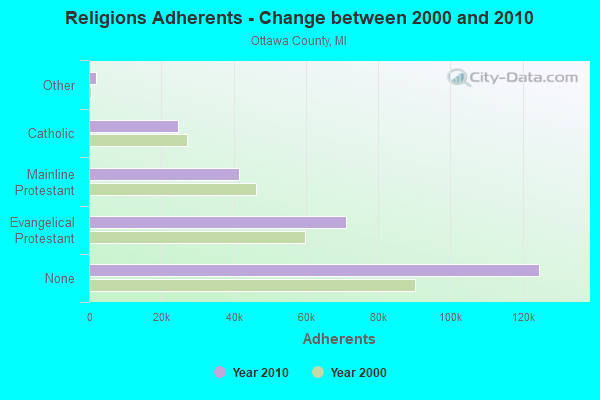
| Religion | Adherents | Congregations |
|---|---|---|
| Evangelical Protestant | 71,034 | 194 |
| Mainline Protestant | 41,597 | 64 |
| Catholic | 24,710 | 11 |
| Other | 1,845 | 12 |
| None | 124,615 | - |
Food Environment Statistics:
| Ottawa County: | 1.35 / 10,000 pop. |
| Michigan: | 2.34 / 10,000 pop. |
| Here: | 0.23 / 10,000 pop. |
| Michigan: | 0.18 / 10,000 pop. |
| Here: | 0.62 / 10,000 pop. |
| State: | 1.52 / 10,000 pop. |
| Here: | 2.24 / 10,000 pop. |
| Michigan: | 2.99 / 10,000 pop. |
| This county: | 5.18 / 10,000 pop. |
| Michigan: | 6.80 / 10,000 pop. |
| Here: | 8.3% |
| Michigan: | 9.7% |
| Ottawa County: | 26.1% |
| State: | 29.7% |
| Here: | 10.7% |
| State: | 13.4% |
Health and Nutrition:
| Zeeland: | 50.3% |
| Michigan: | 50.3% |
| This city: | 46.4% |
| Michigan: | 47.9% |
| Zeeland: | 28.9 |
| Michigan: | 28.7 |
| This city: | 19.0% |
| Michigan: | 20.6% |
| Zeeland: | 12.8% |
| Michigan: | 10.4% |
| This city: | 6.9 |
| Michigan: | 6.8 |
| Zeeland: | 34.4% |
| Michigan: | 34.1% |
| Zeeland: | 55.7% |
| Michigan: | 57.0% |
| Zeeland: | 76.6% |
| Michigan: | 79.6% |
More about Health and Nutrition of Zeeland, MI Residents
| Local government employment and payroll (March 2022) | |||||
| Function | Full-time employees | Monthly full-time payroll | Average yearly full-time wage | Part-time employees | Monthly part-time payroll |
|---|---|---|---|---|---|
| Electric Power | 21 | $162,602 | $92,915 | 2 | $5,569 |
| Police Protection - Officers | 10 | $63,793 | $76,552 | 0 | $0 |
| Other Government Administration | 7 | $44,713 | $76,651 | 0 | $0 |
| Financial Administration | 6 | $42,421 | $84,842 | 0 | $0 |
| Streets and Highways | 5 | $25,562 | $61,349 | 0 | $0 |
| Water Supply | 5 | $30,832 | $73,997 | 2 | $2,932 |
| Sewerage | 5 | $33,631 | $80,714 | 0 | $0 |
| Local Libraries | 4 | $19,492 | $58,476 | 15 | $18,759 |
| Other and Unallocable | 4 | $20,090 | $60,270 | 7 | $14,958 |
| Parks and Recreation | 4 | $20,582 | $61,746 | 1 | $1,170 |
| Firefighters | 1 | $7,591 | $91,092 | 29 | $20,498 |
| Police - Other | 1 | $4,592 | $55,104 | 6 | $11,277 |
| Totals for Government | 73 | $475,900 | $78,230 | 62 | $75,163 |
Zeeland government finances - Expenditure in 2021 (per resident):
- Construction - Regular Highways: $3,732,000 ($658.08)
- Current Operations - General - Other: $27,565,000 ($4860.69)
Sewerage: $4,339,000 ($765.12)
Police Protection: $1,486,000 ($262.03)
Regular Highways: $1,342,000 ($236.64)
Libraries: $1,112,000 ($196.09)
Local Fire Protection: $961,000 ($169.46)
Central Staff Services: $535,000 ($94.34)
Financial Administration: $327,000 ($57.66)
Parks and Recreation: $295,000 ($52.02)
Protective Inspection and Regulation - Other: $269,000 ($47.43)
Air Transportation: $77,000 ($13.58)
Transit Utilities: $34,000 ($6.00)
Judicial and Legal Services: $8,000 ($1.41)
- General - Interest on Debt: $77,000 ($13.58)
- Intergovernmental to Local - Other - Transit Utilities: $34,000 ($6.00)
- Other Capital Outlay - Parks and Recreation: $127,000 ($22.39)
Police Protection: $114,000 ($20.10)
General - Other: $54,000 ($9.52)
Local Fire Protection: $20,000 ($3.53)
Libraries: $10,000 ($1.76)
- Total Salaries and Wages: $5,914,000 ($1042.85)
- Water Utilities - Interest on Debt: $6,000 ($1.06)
Zeeland government finances - Revenue in 2021 (per resident):
- Charges - Sewerage: $2,999,000 ($528.83)
Other: $133,000 ($23.45)
- Federal Intergovernmental - Other: $224,000 ($39.50)
- Local Intergovernmental - Other: $426,000 ($75.12)
- Miscellaneous - Interest Earnings: $4,963,000 ($875.15)
Donations From Private Sources: $285,000 ($50.26)
Rents: $119,000 ($20.98)
General Revenue - Other: $76,000 ($13.40)
Sale of Property: $35,000 ($6.17)
Fines and Forfeits: $31,000 ($5.47)
- Revenue - Electric Utilities: $29,847,000 ($5263.09)
Water Utilities: $5,209,000 ($918.53)
- State Intergovernmental - Highways: $738,000 ($130.14)
General Local Government Support: $561,000 ($98.92)
Other: $186,000 ($32.80)
- Tax - Property: $8,056,000 ($1420.56)
Other License: $230,000 ($40.56)
Zeeland government finances - Debt in 2021 (per resident):
- Long Term Debt - Beginning Outstanding - Unspecified Public Purpose: $3,380,000 ($596.01)
Outstanding Unspecified Public Purpose: $2,810,000 ($495.50)
Retired Unspecified Public Purpose: $570,000 ($100.51)
Zeeland government finances - Cash and Securities in 2021 (per resident):
- Other Funds - Cash and Securities: $70,859,000 ($12494.97)
| Businesses in Zeeland, MI | ||||
| Name | Count | Name | Count | |
|---|---|---|---|---|
| 7-Eleven | 1 | Jimmy John's | 1 | |
| Ace Hardware | 1 | MasterBrand Cabinets | 9 | |
| Advance Auto Parts | 1 | McDonald's | 1 | |
| Blockbuster | 1 | Pizza Hut | 1 | |
| Burger King | 1 | Sprint Nextel | 1 | |
| Curves | 1 | Subway | 1 | |
| Decora Cabinetry | 2 | U-Haul | 1 | |
| FedEx | 1 | UPS | 4 | |
| H&R Block | 1 | |||
Strongest AM radio stations in Zeeland:
- WMFN (640 AM; 1 kW; ZEELAND, MI; Owner: BIRACH BROADCASTING CORPORATION)
- WPNW (1260 AM; 10 kW; ZEELAND, MI; Owner: LANSER BROADCASTING CORPORATION)
- WOOD (1300 AM; 20 kW; GRAND RAPIDS, MI; Owner: CLEAR CHANNEL BROADCASTING LICENSES, INC.)
- WHTC (1450 AM; 1 kW; HOLLAND, MI; Owner: MIDWEST COMMUNICATIONS, INC.)
- WGVU (1480 AM; 5 kW; KENTWOOD, MI; Owner: GRAND VALLEY STATE UNIVERSITY B OF C)
- WTMJ (620 AM; 50 kW; MILWAUKEE, WI; Owner: JOURNAL BROADCAST CORPORATION)
- WOAP (1080 AM; 50 kW; OWOSSO, MI)
- WKZO (590 AM; 5 kW; KALAMAZOO, MI; Owner: FAIRFIELD BROADCASTING COMPANY)
- WJNZ (1140 AM; daytime; 5 kW; KENTWOOD, MI; Owner: GOODRICH RADIO, LLC)
- WGN (720 AM; 50 kW; CHICAGO, IL; Owner: WGN CONTINENTAL BROADCASTING CO.)
- WSCR (670 AM; 50 kW; CHICAGO, IL; Owner: INFINITY BROADCASTING OPERATIONS, INC.)
- WBBM (780 AM; 50 kW; CHICAGO, IL; Owner: INFINITY BROADCASTING OPERATIONS, INC.)
- WMJH (810 AM; daytime; 4 kW; ROCKFORD, MI)
Strongest FM radio stations in Zeeland:
- WJQK (99.3 FM; ZEELAND, MI; Owner: BEACON BC/ING CO. OF WEST MICHIGAN)
- WGNB (89.3 FM; ZEELAND, MI; Owner: THE MOODY BIBLE INSTITUTE OF CHICAGO)
- WKLQ (94.5 FM; HOLLAND, MI; Owner: CITADEL BROADCASTING COMPANY)
- WVTI (96.1 FM; HOLLAND, MI; Owner: CLEAR CHANNEL BROADCASTING LICENSES, INC.)
- WTHS (89.9 FM; HOLLAND, MI; Owner: HOPE COLLEGE)
- WYVN (92.7 FM; SAUGATUCK, MI; Owner: MIDWEST COMMUNICATIONS, INC.)
- WGRD-FM (97.9 FM; GRAND RAPIDS, MI; Owner: REGENT BROADCASTING OF GRAND RAPIDS, INC.)
- WCSG (91.3 FM; GRAND RAPIDS, MI; Owner: CORNERSTONE UNIVERSITY.)
- WZUU (92.3 FM; ALLEGAN, MI; Owner: FORUM COMMUNICATIONS, INC.)
- WFUR-FM (102.9 FM; GRAND RAPIDS, MI; Owner: FURNITURE CITY BROADCASTING CORP.)
- WOOD-FM (105.7 FM; GRAND RAPIDS, MI; Owner: CLEAR CHANNEL BROADCASTING LICENSES, INC.)
- WBCT (93.7 FM; GRAND RAPIDS, MI; Owner: CLEAR CHANNEL BROADCASTING LICENSES, INC.)
- WVGR (104.1 FM; GRAND RAPIDS, MI; Owner: REGENTS OF THE UNIVERSITY OF MICHIGAN)
- WLHT-FM (95.7 FM; GRAND RAPIDS, MI; Owner: REGENT BROADCASTING OF GRAND RAPIDS, INC.)
- WFGR (98.7 FM; GRAND RAPIDS, MI; Owner: REGENT BROADCASTING OF GRAND RAPIDS, INC.)
- WSNX-FM (104.5 FM; MUSKEGON, MI; Owner: CLEAR CHANNEL BROADCASTING LICENSES, INC.)
- WBFX (101.3 FM; GRAND RAPIDS, MI; Owner: CLEAR CHANNEL BROADCASTING LICENSES, INC.)
- WGVU-FM (88.5 FM; ALLENDALE, MI; Owner: BD OF CONTROL,GRAND VALLEY ST UNIV.)
- WTRV (100.5 FM; WALKER, MI; Owner: REGENT BROADCASTING OF GRAND RAPIDS, INC.)
- WBLU-FM (88.9 FM; GRAND RAPIDS, MI; Owner: BLUE LAKE FINE ARTS CAMP)
TV broadcast stations around Zeeland:
- WTLJ (Channel 54; MUSKEGON, MI; Owner: TCT OF MICHIGAN, INC.)
- WGVU-TV (Channel 35; GRAND RAPIDS, MI; Owner: GRAND VALLEY STATE UNIVERSITY)
- WWMT (Channel 3; KALAMAZOO, MI; Owner: FREEDOM BROADCASTING OF MICHIGAN, INC.)
- WXMI (Channel 17; GRAND RAPIDS, MI; Owner: TRIBUNE TELEVISION HOLDINGS, INC.)
- WOOD-TV (Channel 8; GRAND RAPIDS, MI; Owner: WOOD LICENSE COMPANY, LLC)
- WUHQ-LP (Channel 29; GRAND RAPIDS, MI; Owner: P & P CABLE HOLDINGS, L.L.C.)
- WLLA (Channel 64; KALAMAZOO, MI; Owner: CHRISTIAN FAITH BROADCAST, INC.)
- WOTV (Channel 41; BATTLE CREEK, MI; Owner: WOOD LICENSE COMPANY, LLC)
- WZZM-TV (Channel 13; GRAND RAPIDS, MI; Owner: COMBINED COMMUNICATIONS CORP. OF OKLAHOMA, INC.)
- W44BQ (Channel 44; MOUNT PLEASANT, MI; Owner: NTN/SAGINAW, INC.)
- WXSP-CA (Channel 15; GRAND RAPIDS, MI; Owner: WOOD LICENSE COMPANY, LLC)
- W48CL (Channel 48; GRAND RAPIDS, MI; Owner: THREE ANGELS BROADCASTING NETWORK)
- WOGC-CA (Channel 25; GRAND RAPIDS, MI; Owner: WOOD LICENSE COMPANY, LLC)
- WOMS-CA (Channel 29; MUSKEGON, MI; Owner: WOOD LICENSE COMPANY, LLC)
- National Bridge Inventory (NBI) Statistics
- 45Number of bridges
- 285ft / 87.3mTotal length
- $942,000Total costs
- 385,755Total average daily traffic
- 35,688Total average daily truck traffic
- New bridges - historical statistics
- 11920-1929
- 31950-1959
- 21960-1969
- 301970-1979
- 21980-1989
- 21990-1999
- 22000-2009
- 32010-2019
FCC Registered Antenna Towers: 109 (See the full list of FCC Registered Antenna Towers)
FCC Registered Commercial Land Mobile Towers: 2 (See the full list of FCC Registered Commercial Land Mobile Towers in Zeeland, MI)
FCC Registered Private Land Mobile Towers: 3 (See the full list of FCC Registered Private Land Mobile Towers)
FCC Registered Broadcast Land Mobile Towers: 36 (See the full list of FCC Registered Broadcast Land Mobile Towers)
FCC Registered Microwave Towers: 22 (See the full list of FCC Registered Microwave Towers in this town)
FCC Registered Paging Towers: 7 (See the full list of FCC Registered Paging Towers)
FCC Registered Amateur Radio Licenses: 167 (See the full list of FCC Registered Amateur Radio Licenses in Zeeland)
FAA Registered Aircraft: 46 (See the full list of FAA Registered Aircraft in Zeeland)
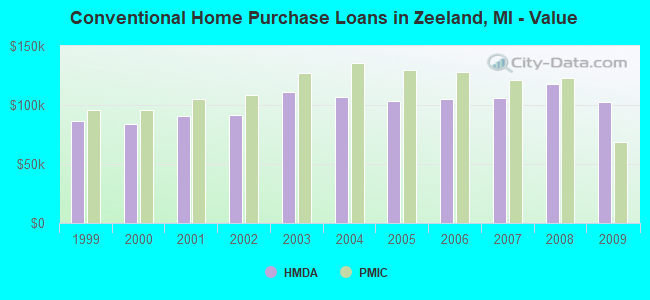
| Home Mortgage Disclosure Act Aggregated Statistics For Year 2009 (Based on 1 partial tract) | ||||||||||
| A) FHA, FSA/RHS & VA Home Purchase Loans | B) Conventional Home Purchase Loans | C) Refinancings | D) Home Improvement Loans | F) Non-occupant Loans on < 5 Family Dwellings (A B C & D) | ||||||
|---|---|---|---|---|---|---|---|---|---|---|
| Number | Average Value | Number | Average Value | Number | Average Value | Number | Average Value | Number | Average Value | |
| LOANS ORIGINATED | 22 | $88,560 | 22 | $102,508 | 100 | $113,584 | 8 | $41,826 | 4 | $69,390 |
| APPLICATIONS APPROVED, NOT ACCEPTED | 3 | $65,533 | 3 | $82,753 | 5 | $96,838 | 1 | $3,080 | 1 | $58,600 |
| APPLICATIONS DENIED | 3 | $95,860 | 4 | $87,315 | 34 | $116,217 | 4 | $29,490 | 4 | $99,460 |
| APPLICATIONS WITHDRAWN | 5 | $70,932 | 2 | $75,170 | 25 | $115,187 | 1 | $6,170 | 0 | $0 |
| FILES CLOSED FOR INCOMPLETENESS | 1 | $35,470 | 1 | $70,930 | 4 | $104,470 | 0 | $0 | 0 | $0 |
Detailed HMDA statistics for the following Tracts: 0229.00
| Private Mortgage Insurance Companies Aggregated Statistics For Year 2009 (Based on 1 partial tract) | ||||||
| A) Conventional Home Purchase Loans | B) Refinancings | C) Non-occupant Loans on < 5 Family Dwellings (A & B) | ||||
|---|---|---|---|---|---|---|
| Number | Average Value | Number | Average Value | Number | Average Value | |
| LOANS ORIGINATED | 2 | $68,620 | 4 | $145,720 | 0 | $0 |
| APPLICATIONS APPROVED, NOT ACCEPTED | 2 | $84,425 | 1 | $186,580 | 1 | $65,530 |
| APPLICATIONS DENIED | 0 | $0 | 0 | $0 | 0 | $0 |
| APPLICATIONS WITHDRAWN | 0 | $0 | 2 | $108,325 | 0 | $0 |
| FILES CLOSED FOR INCOMPLETENESS | 0 | $0 | 0 | $0 | 0 | $0 |
Detailed PMIC statistics for the following Tracts: 0229.00
2002 - 2018 National Fire Incident Reporting System (NFIRS) incidents
- Fire incident types reported to NFIRS in Zeeland, MI
- 38350.7%Structure Fires
- 19926.3%Outside Fires
- 13217.5%Mobile Property/Vehicle Fires
- 425.6%Other
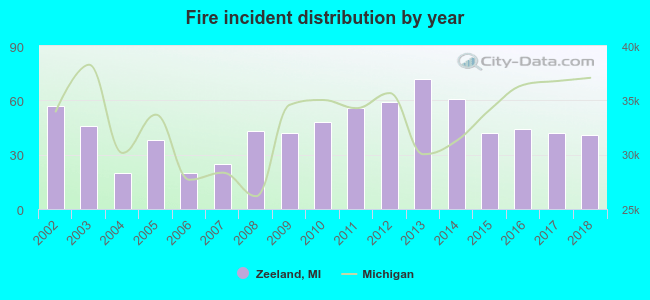 According to the data from the years 2002 - 2018 the average number of fires per year is 44. The highest number of fires - 72 took place in 2013, and the least - 20 in 2004. The data has a dropping trend.
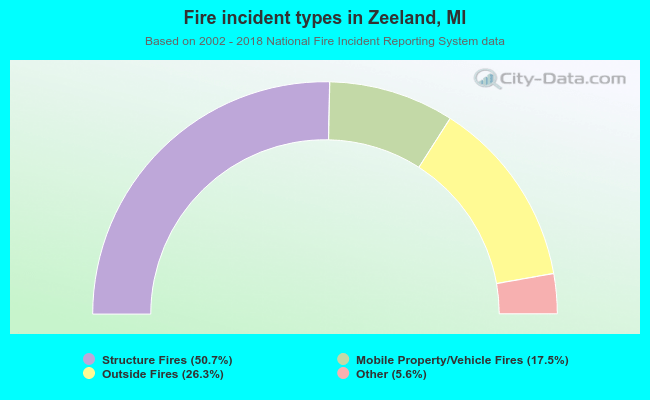 When looking into fire subcategories, the most reports belonged to: Structure Fires (50.7%), and Outside Fires (26.3%).
| Most common first names in Zeeland, MI among deceased individuals | ||
| Name | Count | Lived (average) |
|---|---|---|
| John | 160 | 77.9 years |
| Henry | 86 | 81.1 years |
| Jennie | 60 | 85.2 years |
| Gertrude | 56 | 83.6 years |
| William | 54 | 80.1 years |
| Gerrit | 53 | 80.7 years |
| Anna | 41 | 81.6 years |
| George | 39 | 80.2 years |
| Henrietta | 38 | 80.0 years |
| James | 35 | 71.5 years |
| Most common last names in Zeeland, MI among deceased individuals | ||
| Last name | Count | Lived (average) |
|---|---|---|
| Vandenbosch | 31 | 79.2 years |
| Walters | 24 | 73.6 years |
| Devries | 24 | 81.2 years |
| Dejonge | 22 | 80.3 years |
| Brower | 21 | 79.2 years |
| Timmer | 19 | 77.7 years |
| Nykamp | 19 | 74.2 years |
| Smith | 18 | 75.8 years |
| Bos | 17 | 78.0 years |
| Vanhaitsma | 16 | 79.7 years |
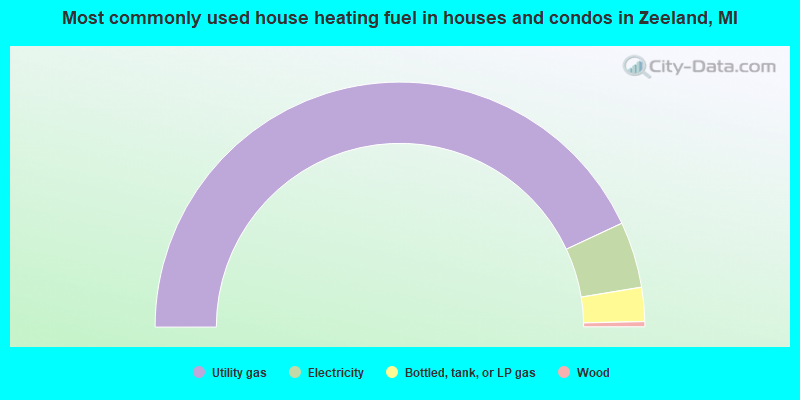
- 86.1%Utility gas
- 8.7%Electricity
- 4.5%Bottled, tank, or LP gas
- 0.7%Wood
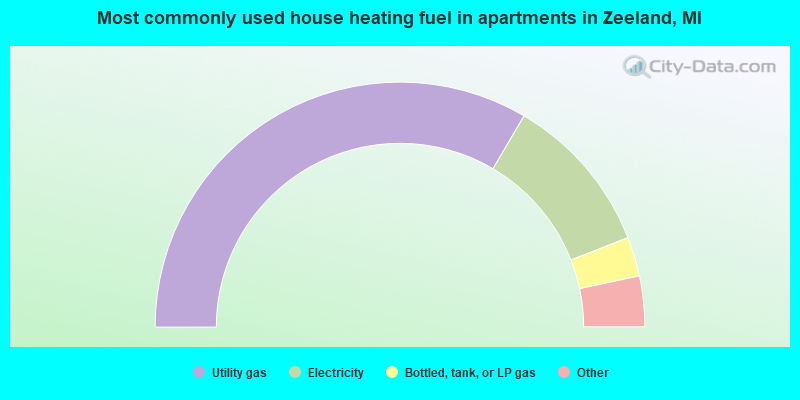
- 67.0%Utility gas
- 21.2%Electricity
- 5.2%Bottled, tank, or LP gas
- 2.3%No fuel used
- 2.2%Other fuel
- 2.1%Solar energy
Zeeland compared to Michigan state average:
- Unemployed percentage significantly below state average.
- Black race population percentage significantly below state average.
- Foreign-born population percentage significantly below state average.
- Institutionalized population percentage above state average.
Zeeland on our top lists:
- #37 on the list of "Top 101 cities with the most residents born in Netherlands (population 500+)"
- #71 on the list of "Top 101 cities that people commute into (largest positive percentage daily daytime population change due to commuting) (population 5,000+)"
- #72 on the list of "Top 101 cities with largest percentage of females in industries: manufacturing (population 5,000+)"
- #75 on the list of "Top 101 cities with the most full-time local library workers per 1000 residents (population 5,000+)"
- #90 on the list of "Top 101 cities with largest percentage of males in occupations: architecture and engineering occupations (population 5,000+)"
- #25 (49464) on the list of "Top 101 zip codes with the largest percentage of Dutch first ancestries"
- #48 on the list of "Top 101 counties with the lowest percentage of residents relocating from foreign countries between 2010 and 2011"
- #73 on the list of "Top 101 counties with the highest Sulfur Oxides Annual air pollution readings in 2012 (µg/m3)"
- #80 on the list of "Top 101 counties with the largest number of children under 18 without health insurance coverage in 2000 (pop. 50,000+)"
- #82 on the list of "Top 101 counties with the lowest ground withdrawal of fresh water for public supply (pop. 50,000+)"
- #98 on the list of "Top 101 counties with the largest number of people without health insurance coverage in 2000 (pop. 50,000+)"

|
|
Total of 565 patent applications in 2008-2024.