According to our research of Michigan and other state lists, there was 1 registered sex offender living in Beechwood, Michigan as of April 27, 2024. The ratio of all residents to sex offenders in Beechwood is 3,524 to 1. The ratio of registered sex offenders to all residents in this city is much lower than the state average.
Recent articles from our blog. Our writers, many of them Ph.D. graduates or candidates, create easy-to-read articles on a wide variety of topics.
Latest news from Beechwood, MI collected exclusively by city-data.com from local newspapers, TV, and radio stations
Ancestries: Dutch (24.8%), American (19.5%), Canadian (18.2%), Arab (8.4%), Polish (4.4%), Irish (2.6%).
Current Local Time: EST time zone
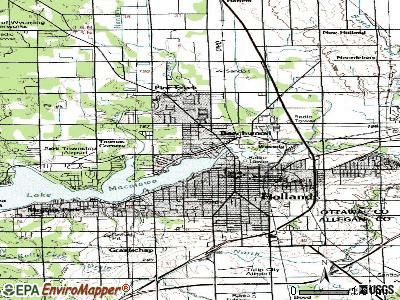
Land area: 1.83 square miles.
Population density: 1,645 people per square mile (low).
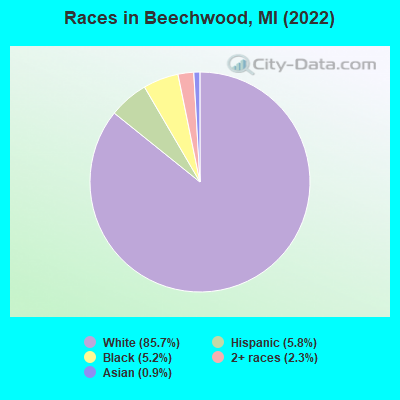
151 residents are foreign born (4.7% Asia, 0.6% Europe).
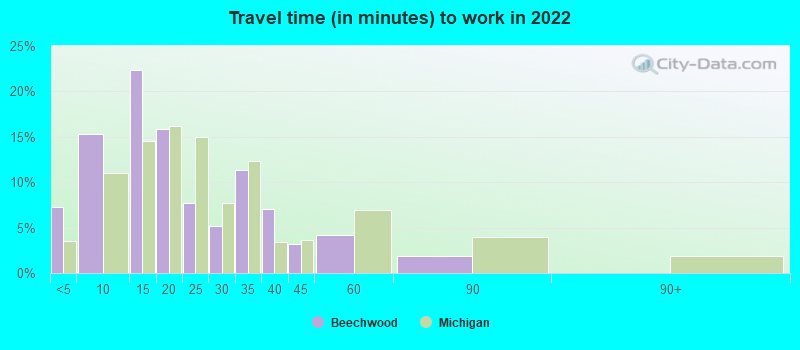
This place:
5.3%
Michigan:
6.9%
Median real estate property taxes paid for housing units with mortgages in 2022: $2,708 (1.1%) Median real estate property taxes paid for housing units with no mortgage in 2022: $2,556 (1.1%)
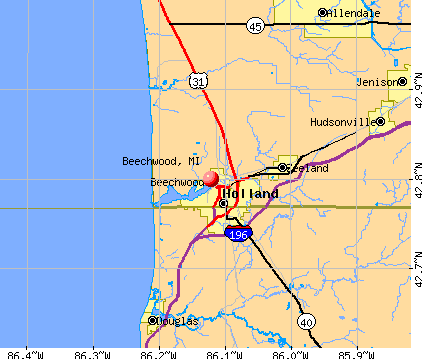
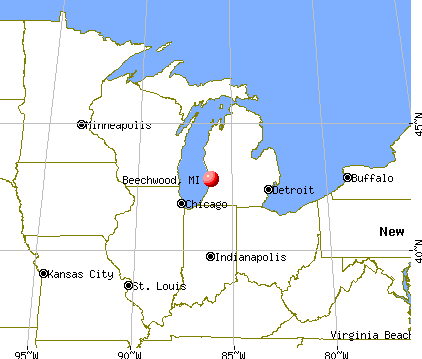
Nearest city with pop. 50,000+: Wyoming, MI (22.5 miles , pop. 69,368).
Nearest city with pop. 200,000+: Milwaukee, WI (94.5 miles , pop. 596,974).
Nearest city with pop. 1,000,000+: Chicago, IL (103.7 miles , pop. 2,896,016).
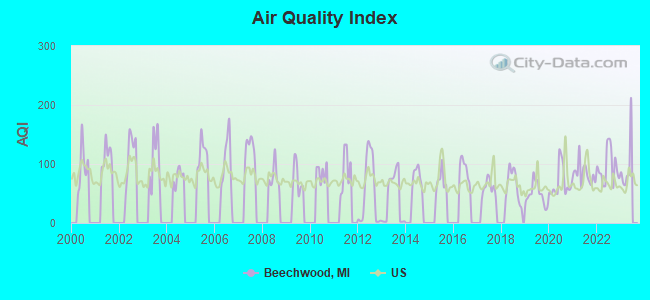
Air Quality Index (AQI) level in 2022 was 94.5. This is worse than average.
City:
94.5
U.S.:
72.6
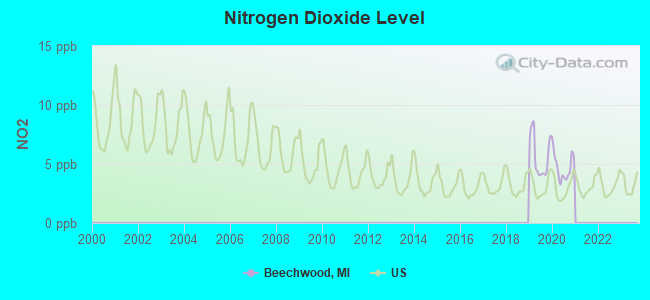
Nitrogen Dioxide (NO2) [ppb] level in 2020 was 4.71. This is about average.Closest monitor was 2.6 miles away from the city center.
City:
4.71
U.S.:
5.11
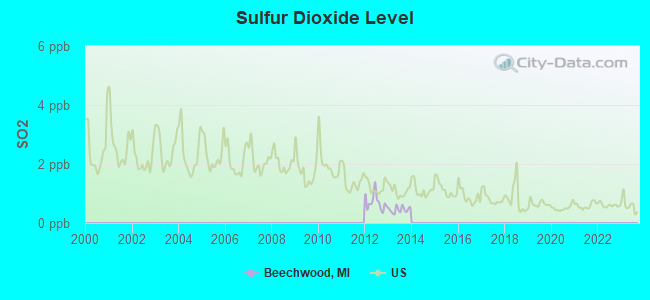
Sulfur Dioxide (SO2) [ppb] level in 2013 was 0.452. This is significantly better than average.Closest monitor was 0.7 miles away from the city center.
City:
0.452
U.S.:
1.515
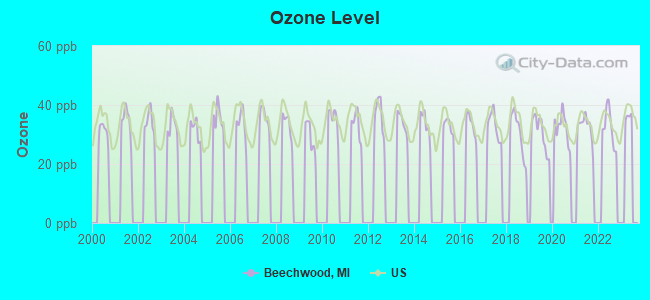
Ozone [ppb] level in 2022 was 32.5. This is about average.Closest monitor was 15.1 miles away from the city center.
City:
32.5
U.S.:
33.3
Particulate Matter (PM10) [µg/m3] level in 2022 was 16.7. This is about average.Closest monitor was 0.6 miles away from the city center.
City:
16.7
U.S.:
19.2
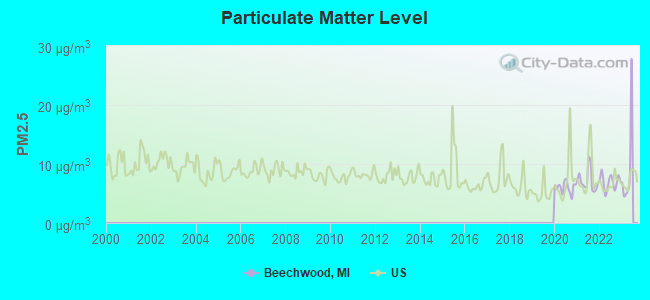
Particulate Matter (PM2.5) [µg/m3] level in 2022 was 6.95. This is about average.Closest monitor was 2.6 miles away from the city center.
City:
6.95
U.S.:
8.11
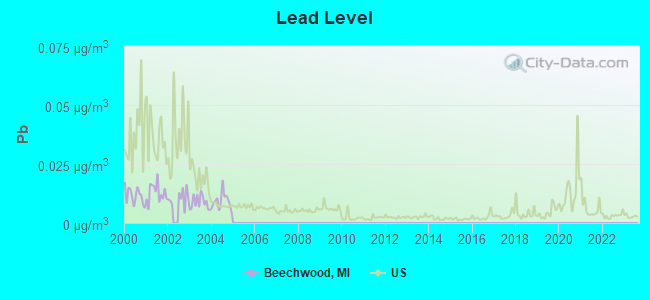
Lead (Pb) [µg/m3] level in 2004 was 0.00932. This is about average.Closest monitor was 0.6 miles away from the city center.
City:
0.00932
U.S.:
0.00931
Tornado activity:
Beechwood-area historical tornado activity is slightly below Michigan state average. It is 12% smaller than the overall U.S. average.
On 4/3/1956, a category F5 (max. wind speeds 261-318 mph) tornado 10.3 miles away from the Beechwood place center killed 18 peopleand injured 340 peopleand causedbetween $50,000 and $500,000 in damages.
On 4/11/1965, a category F4 (max. wind speeds 207-260 mph) tornado 18.4 miles away from the place center killed 5 peopleand injured 142 peopleand causedbetween $500,000 and $5,000,000 in damages.
Earthquake activity:
Beechwood-area historical earthquake activity is significantly above Michigan state average. It is 17% smaller than the overall U.S. average.
On 5/2/2015 at 16:23:07, a magnitude 4.2 (4.2 MW, Depth: 2.8 mi, Class: Light, Intensity: IV - V) earthquake occurred 52.6 miles away from the city center On 4/18/2008 at 09:36:59, a magnitude 5.4 (5.1 MB, 4.8 MS, 5.4 MW, 5.2 MW, Class: Moderate, Intensity: VI - VII) earthquake occurred 314.6 miles away from the city center On 1/31/1986 at 16:46:43, a magnitude 5.0 (5.0 MB) earthquake occurred 267.3 miles away from Beechwood center On 9/25/1998 at 19:52:52, a magnitude 5.2 (4.8 MB, 4.3 MS, 5.2 LG, 4.5 MW, Depth: 3.1 mi) earthquake occurred 307.2 miles away from the city center On 6/10/1987 at 23:48:54, a magnitude 5.1 (4.9 MB, 4.4 MS, 4.6 MS, 5.1 LG) earthquake occurred 290.2 miles away from Beechwood center On 7/12/1986 at 08:19:37, a magnitude 4.5 (4.5 MB) earthquake occurred 180.7 miles away from Beechwood center Magnitude types: regional Lg-wave magnitude (LG), body-wave magnitude (MB), surface-wave magnitude (MS), moment magnitude (MW)
Natural disasters:
The number of natural disasters in Ottawa County (15) is near the US average (15). Major Disasters (Presidential) Declared: 9 Emergencies Declared: 5
Causes of natural disasters: Storms: 8, Floods: 7, Tornadoes: 4, Snowstorms: 2, Winds: 2, Winter Storms: 2, Blizzard: 1, Hurricane: 1, Other: 1 (Note: some incidents may be assigned to more than one category).
Hospitals and medical centers near Beechwood:
INN AT FREEDOM VILLAGE, THE (Nursing Home, about 2 miles away; HOLLAND, MI)
HOLLAND COMMUNITY HOSPITAL Acute Care Hospitals (about 2 miles away; HOLLAND, MI)
HOSPICE OF HOLLAND INC (Hospital, about 3 miles away; HOLLAND, MI)
HEARTLAND OF HOLLAND (Nursing Home, about 3 miles away; HOLLAND, MI)
RESTHAVEN HOME CARE (Home Health Center, about 3 miles away; HOLLAND, MI)
RENAL ADVANTAGE - HOLLAND (Dialysis Facility, about 3 miles away; HOLLAND, MI)
MEADOWBROOK CARE CTR (Nursing Home, about 3 miles away; HOLLAND, MI)
Amtrak station near Beechwood:
2 miles: HOLLAND (171 LINCOLN AVE.) . Services: enclosed waiting area, public payphones, vending machines, free short-term parking, free long-term parking, call for taxi service, intercity bus service.
Colleges/universities with over 2000 students nearest to Beechwood:
Hope College (about 2 miles; Holland, MI; Full-time enrollment: 3,535)
Grand Valley State University (about 17 miles; Allendale, MI; FT enrollment: 21,982)
Grand Rapids Community College (about 26 miles; Grand Rapids, MI; FT enrollment: 11,296)
Calvin College (about 29 miles; Grand Rapids, MI; FT enrollment: 4,117)
Cornerstone University (about 30 miles; Grand Rapids, MI; FT enrollment: 2,573)
Davenport University (about 31 miles; Grand Rapids, MI; FT enrollment: 6,955)
Baker College of Muskegon (about 31 miles; Muskegon, MI; FT enrollment: 3,293)
Ottawa County has a predicted average indoor radon screening level less than 2 pCi/L (pico curies per liter) - Low Potential
Average household size:
This place:
2.7 people
Michigan:
2.5 people
Percentage of family households:
This place:
72.4%
Whole state:
66.0%
Percentage of households with unmarried partners:
This place:
8.0%
Whole state:
6.4%
Likely homosexual households (counted as self-reported same-sex unmarried-partner households)
Lesbian couples: 0.2% of all households
Gay men: 0.2% of all households
12 people in group homes intended for adults in 2010
11 people in residential treatment centers for adults in 2010
10 people in other group homes in 2000
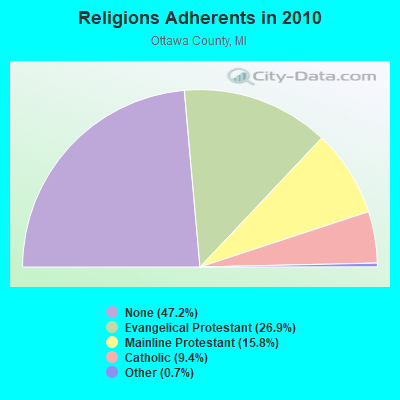
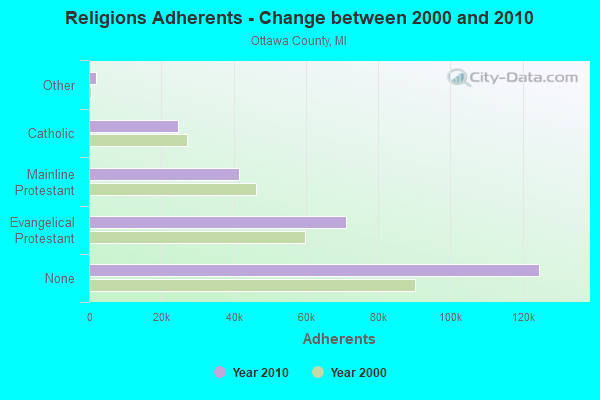
Religion statistics for Beechwood, MI (based on Ottawa County data)
Religion
Adherents
Congregations
Evangelical Protestant
71,034
194
Mainline Protestant
41,597
64
Catholic
24,710
11
Other
1,845
12
None
124,615
-
Source: Clifford Grammich, Kirk Hadaway, Richard Houseal, Dale E.Jones, Alexei Krindatch, Richie Stanley and Richard H.Taylor. 2012. 2010 U.S.Religion Census: Religious Congregations & Membership Study. Association of Statisticians of American Religious Bodies. Jones, Dale E., et al. 2002. Congregations and Membership in the United States 2000. Nashville, TN: Glenmary Research Center. Graphs represent county-level data
Guy C Stout, North Of Greenly St (Lat: 42.835694 Lon: -86.164778), Type: 60.7, Structure height: 26139 m, Overall height: 59.4 m, Registrant: Stout And Company, LLC, Guy@stoutandcompany.Com, , Natch-ez, Phone: (601) 445-0504
Guy C Stout, North Of Greenly St (Lat: 42.835694 Lon: -86.164778), Type: 60.7, Structure height: 26139 m, Overall height: 59.4 m, Registrant: Stout And Company, LLC, Guy@stoutandcompany.Com, , Natch-ez, Phone: (601) 445-0504
Guy Stout, North Of Greenly St (Lat: 42.835694 Lon: -86.164778), Type: 60.7, Structure height: 26139 m, Overall height: 59.4 m, Registrant: Stout And Company, LLC, Guy@stoutandcompany.Com, , Natch-ez, Phone: (601) 445-0504
Guy Stout, North Of Greenly St (Lat: 42.835694 Lon: -86.164778), Type: 60.7, Structure height: 26139 m, Overall height: 59.4 m, Licensee ID: L, Registrant: Stout And Company, LLC, Guy.Stout@stoutandcompany.Com, , Natch-ez, Phone: (601) 445-0504
Guy Stout, North Of Greenly St (Lat: 42.835694 Lon: -86.164778), Type: 60.7, Structure height: 26139 m, Overall height: 59.4 m, Registrant: Stout And Company, LLC, Guy.Stout@stoutandcompany.Com, , Natch-ez, Phone: (601) 445-0504
Jacob T Chapman, North Of Greenly St (Lat: 42.835694 Lon: -86.164778), Type: 60.7, Structure height: 26139 m, Overall height: 59.4 m, Registrant: American Towers, LLC, Faa-Fcc@americantower.Com, , Wobur-n, Phone: (781) 926-4500
Home Mortgage Disclosure Act Aggregated Statistics For Year 2009 (Based on 2 partial tracts)
A) FHA, FSA/RHS & VA Home Purchase Loans
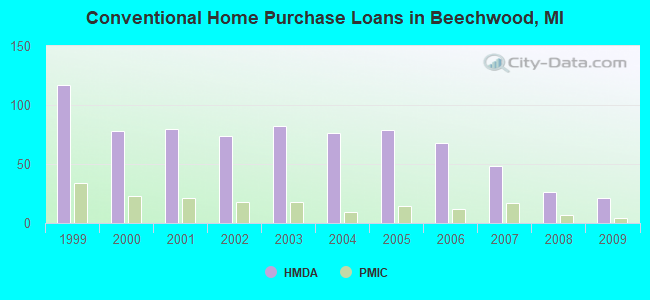
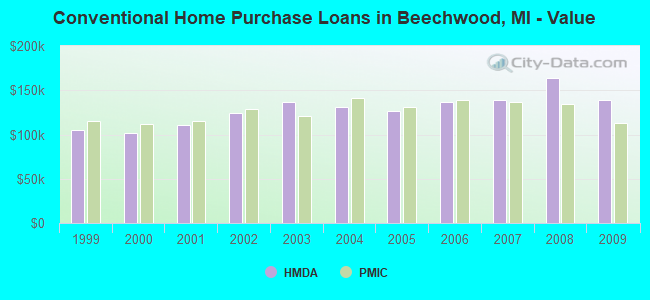
B) Conventional Home Purchase Loans
C) Refinancings
D) Home Improvement Loans
F) Non-occupant Loans on < 5 Family Dwellings (A B C & D)
G) Loans On Manufactured Home Dwelling (A B C & D)
Number
Average Value
Number
Average Value
Number
Average Value
Number
Average Value
Number
Average Value
Number
Average Value
LOANS ORIGINATED
19
$99,564
21
$138,835
104
$158,624
4
$44,795
13
$226,018
2
$39,290
APPLICATIONS APPROVED, NOT ACCEPTED
1
$139,670
3
$147,333
8
$144,044
0
$0
2
$216,970
1
$18,130
APPLICATIONS DENIED
5
$80,826
5
$74,930
35
$137,979
5
$14,018
3
$132,620
2
$10,075
APPLICATIONS WITHDRAWN
2
$87,890
1
$134,150
19
$146,191
0
$0
1
$191,150
0
$0
FILES CLOSED FOR INCOMPLETENESS
1
$39,290
1
$103,200
6
$134,747
0
$0
0
$0
0
$0
Aggregated Statistics For Year 2008 (Based on 2 partial tracts)
A) FHA, FSA/RHS & VA Home Purchase Loans
B) Conventional Home Purchase Loans
C) Refinancings
D) Home Improvement Loans
E) Loans on Dwellings For 5+ Families
F) Non-occupant Loans on < 5 Family Dwellings (A B C & D)
G) Loans On Manufactured Home Dwelling (A B C & D)
Number
Average Value
Number
Average Value
Number
Average Value
Number
Average Value
Number
Average Value
Number
Average Value
Number
Average Value
LOANS ORIGINATED
16
$103,804
26
$163,978
63
$154,608
7
$56,780
1
$224,650
14
$214,058
2
$27,450
APPLICATIONS APPROVED, NOT ACCEPTED
1
$101,570
1
$791,030
7
$160,687
2
$40,105
0
$0
2
$113,410
0
$0
APPLICATIONS DENIED
2
$113,860
7
$106,360
30
$134,056
9
$23,981
0
$0
2
$286,400
2
$9,820
APPLICATIONS WITHDRAWN
1
$64,240
1
$75,380
16
$150,752
2
$13,095
0
$0
1
$65,120
0
$0
FILES CLOSED FOR INCOMPLETENESS
0
$0
1
$47,850
4
$163,798
1
$5,040
0
$0
0
$0
0
$0
Aggregated Statistics For Year 2007 (Based on 2 partial tracts)
A) FHA, FSA/RHS & VA Home Purchase Loans
B) Conventional Home Purchase Loans
C) Refinancings
D) Home Improvement Loans
E) Loans on Dwellings For 5+ Families
F) Non-occupant Loans on < 5 Family Dwellings (A B C & D)
G) Loans On Manufactured Home Dwelling (A B C & D)
Number
Average Value
Number
Average Value
Number
Average Value
Number
Average Value
Number
Average Value
Number
Average Value
Number
Average Value
LOANS ORIGINATED
4
$128,770
48
$138,475
80
$138,794
9
$66,797
1
$654,810
11
$250,329
2
$5,540
APPLICATIONS APPROVED, NOT ACCEPTED
1
$40,800
4
$107,972
14
$122,429
3
$47,340
0
$0
2
$183,260
1
$15,110
APPLICATIONS DENIED
2
$105,530
10
$81,975
51
$139,462
12
$48,287
0
$0
3
$229,237
5
$18,738
APPLICATIONS WITHDRAWN
1
$69,510
6
$98,523
24
$141,838
1
$59,360
0
$0
1
$540,620
0
$0
FILES CLOSED FOR INCOMPLETENESS
0
$0
1
$238,310
6
$154,177
1
$2,520
0
$0
1
$207,800
0
$0
Aggregated Statistics For Year 2006 (Based on 2 partial tracts)
A) FHA, FSA/RHS & VA Home Purchase Loans
B) Conventional Home Purchase Loans
C) Refinancings
D) Home Improvement Loans
F) Non-occupant Loans on < 5 Family Dwellings (A B C & D)
G) Loans On Manufactured Home Dwelling (A B C & D)
Number
Average Value
Number
Average Value
Number
Average Value
Number
Average Value
Number
Average Value
Number
Average Value
LOANS ORIGINATED
6
$135,913
68
$136,946
94
$112,574
17
$35,631
16
$210,142
3
$61,640
APPLICATIONS APPROVED, NOT ACCEPTED
0
$0
8
$183,736
15
$126,908
1
$31,480
2
$146,300
1
$46,340
APPLICATIONS DENIED
1
$126,130
11
$103,159
58
$136,233
9
$29,751
3
$111,147
2
$20,880
APPLICATIONS WITHDRAWN
1
$64,470
9
$118,447
36
$126,049
2
$50,025
2
$103,970
0
$0
FILES CLOSED FOR INCOMPLETENESS
0
$0
3
$71,410
10
$104,981
0
$0
0
$0
0
$0
Aggregated Statistics For Year 2005 (Based on 2 partial tracts)
A) FHA, FSA/RHS & VA Home Purchase Loans
B) Conventional Home Purchase Loans
C) Refinancings
D) Home Improvement Loans
F) Non-occupant Loans on < 5 Family Dwellings (A B C & D)
G) Loans On Manufactured Home Dwelling (A B C & D)
Number
Average Value
Number
Average Value
Number
Average Value
Number
Average Value
Number
Average Value
Number
Average Value
LOANS ORIGINATED
3
$127,773
79
$126,054
114
$140,168
11
$59,302
16
$169,937
3
$10,360
APPLICATIONS APPROVED, NOT ACCEPTED
0
$0
9
$103,919
24
$123,837
2
$46,745
2
$200,000
1
$4,030
APPLICATIONS DENIED
1
$73,040
22
$100,964
63
$120,086
10
$46,959
2
$134,060
6
$22,583
APPLICATIONS WITHDRAWN
1
$54,900
12
$120,762
52
$129,248
2
$145,675
4
$109,208
0
$0
FILES CLOSED FOR INCOMPLETENESS
0
$0
2
$139,690
7
$137,603
1
$62,960
0
$0
0
$0
Aggregated Statistics For Year 2004 (Based on 2 partial tracts)
A) FHA, FSA/RHS & VA Home Purchase Loans
B) Conventional Home Purchase Loans
C) Refinancings
D) Home Improvement Loans
E) Loans on Dwellings For 5+ Families
F) Non-occupant Loans on < 5 Family Dwellings (A B C & D)
G) Loans On Manufactured Home Dwelling (A B C & D)
Number
Average Value
Number
Average Value
Number
Average Value
Number
Average Value
Number
Average Value
Number
Average Value
Number
Average Value
LOANS ORIGINATED
4
$123,920
76
$130,808
139
$125,582
13
$39,482
1
$223,640
16
$193,680
2
$15,945
APPLICATIONS APPROVED, NOT ACCEPTED
1
$126,430
11
$114,301
32
$117,376
2
$26,625
1
$491,110
5
$97,702
0
$0
APPLICATIONS DENIED
2
$101,515
10
$145,621
78
$125,359
11
$48,839
0
$0
5
$113,498
2
$14,105
APPLICATIONS WITHDRAWN
1
$170,230
6
$244,598
34
$121,838
3
$42,830
0
$0
2
$162,025
0
$0
FILES CLOSED FOR INCOMPLETENESS
0
$0
1
$121,640
19
$136,745
1
$16,610
0
$0
1
$44,570
0
$0
Aggregated Statistics For Year 2003 (Based on 2 partial tracts)
A) FHA, FSA/RHS & VA Home Purchase Loans
B) Conventional Home Purchase Loans
C) Refinancings
D) Home Improvement Loans
E) Loans on Dwellings For 5+ Families
F) Non-occupant Loans on < 5 Family Dwellings (A B C & D)
Number
Average Value
Number
Average Value
Number
Average Value
Number
Average Value
Number
Average Value
Number
Average Value
LOANS ORIGINATED
12
$115,194
82
$136,696
339
$126,191
12
$17,490
1
$125,920
34
$156,974
APPLICATIONS APPROVED, NOT ACCEPTED
0
$0
5
$103,208
30
$120,728
1
$11,770
0
$0
2
$131,375
APPLICATIONS DENIED
1
$120,380
13
$101,134
62
$117,092
6
$19,408
0
$0
3
$92,870
APPLICATIONS WITHDRAWN
0
$0
2
$156,145
42
$119,966
1
$26,190
0
$0
3
$147,073
FILES CLOSED FOR INCOMPLETENESS
0
$0
2
$140,485
13
$125,826
1
$17,630
0
$0
1
$232,280
Aggregated Statistics For Year 2002 (Based on 2 partial tracts)
A) FHA, FSA/RHS & VA Home Purchase Loans
B) Conventional Home Purchase Loans
C) Refinancings
D) Home Improvement Loans
E) Loans on Dwellings For 5+ Families
F) Non-occupant Loans on < 5 Family Dwellings (A B C & D)
Number
Average Value
Number
Average Value
Number
Average Value
Number
Average Value
Number
Average Value
Number
Average Value
LOANS ORIGINATED
15
$114,580
74
$124,124
279
$126,663
12
$22,467
1
$126,430
22
$181,748
APPLICATIONS APPROVED, NOT ACCEPTED
1
$115,850
5
$124,494
26
$111,910
2
$38,885
0
$0
0
$0
APPLICATIONS DENIED
2
$93,775
15
$47,112
49
$115,127
7
$19,951
0
$0
1
$59,730
APPLICATIONS WITHDRAWN
2
$86,890
4
$89,638
29
$115,277
2
$27,410
0
$0
2
$131,480
FILES CLOSED FOR INCOMPLETENESS
0
$0
1
$114,370
8
$153,202
0
$0
0
$0
2
$132,165
Aggregated Statistics For Year 2001 (Based on 2 partial tracts)
A) FHA, FSA/RHS & VA Home Purchase Loans
B) Conventional Home Purchase Loans
C) Refinancings
D) Home Improvement Loans
F) Non-occupant Loans on < 5 Family Dwellings (A B C & D)
Number
Average Value
Number
Average Value
Number
Average Value
Number
Average Value
Number
Average Value
LOANS ORIGINATED
18
$119,076
80
$110,369
253
$121,218
21
$20,947
14
$128,176
APPLICATIONS APPROVED, NOT ACCEPTED
0
$0
8
$69,196
23
$101,753
4
$24,228
0
$0
APPLICATIONS DENIED
1
$74,790
29
$32,678
63
$102,380
15
$17,901
5
$96,944
APPLICATIONS WITHDRAWN
0
$0
5
$136,264
35
$108,113
3
$33,077
0
$0
FILES CLOSED FOR INCOMPLETENESS
0
$0
0
$0
5
$131,536
0
$0
0
$0
Aggregated Statistics For Year 2000 (Based on 2 partial tracts)
A) FHA, FSA/RHS & VA Home Purchase Loans
B) Conventional Home Purchase Loans
C) Refinancings
D) Home Improvement Loans
F) Non-occupant Loans on < 5 Family Dwellings (A B C & D)
Number
Average Value
Number
Average Value
Number
Average Value
Number
Average Value
Number
Average Value
LOANS ORIGINATED
18
$104,770
78
$101,544
62
$91,955
18
$28,431
9
$138,177
APPLICATIONS APPROVED, NOT ACCEPTED
1
$129,150
17
$63,378
9
$65,177
10
$20,889
1
$18,690
APPLICATIONS DENIED
2
$88,785
80
$42,053
30
$55,722
12
$18,055
4
$51,370
APPLICATIONS WITHDRAWN
2
$124,160
8
$118,242
14
$82,434
1
$54,700
1
$179,610
FILES CLOSED FOR INCOMPLETENESS
0
$0
3
$110,967
4
$113,975
0
$0
0
$0
Aggregated Statistics For Year 1999 (Based on 2 partial tracts)
A) FHA, FSA/RHS & VA Home Purchase Loans
B) Conventional Home Purchase Loans
C) Refinancings
D) Home Improvement Loans
F) Non-occupant Loans on < 5 Family Dwellings (A B C & D)


 Recent articles from our blog. Our writers, many of them Ph.D. graduates or candidates, create easy-to-read articles on a wide variety of topics.

 (22.5 miles