Zionsville, Indiana Submit your own pictures of this town and show them to the world
OSM Map
General Map
Google Map
MSN Map
OSM Map
General Map
Google Map
MSN Map
OSM Map
General Map
Google Map
MSN Map
OSM Map
General Map
Google Map
MSN Map
Please wait while loading the map...
Population in 2022: 31,982 (100% urban, 0% rural). Population change since 2000: +264.5%Males: 16,049 Females: 15,933
March 2022 cost of living index in Zionsville: 89.4 (less than average, U.S. average is 100) Percentage of residents living in poverty in 2022: 4.2%for White Non-Hispanic residents , 8.1% for Black residents , 3.1% for other race residents , 2.0% for two or more races residents )
Profiles of local businesses
Business Search - 14 Million verified businesses
Data:
Median household income ($)
Median household income (% change since 2000)
Household income diversity
Ratio of average income to average house value (%)
Ratio of average income to average rent
Median household income ($) - White
Median household income ($) - Black or African American
Median household income ($) - Asian
Median household income ($) - Hispanic or Latino
Median household income ($) - American Indian and Alaska Native
Median household income ($) - Multirace
Median household income ($) - Other Race
Median household income for houses/condos with a mortgage ($)
Median household income for apartments without a mortgage ($)
Races - White alone (%)
Races - White alone (% change since 2000)
Races - Black alone (%)
Races - Black alone (% change since 2000)
Races - American Indian alone (%)
Races - American Indian alone (% change since 2000)
Races - Asian alone (%)
Races - Asian alone (% change since 2000)
Races - Hispanic (%)
Races - Hispanic (% change since 2000)
Races - Native Hawaiian and Other Pacific Islander alone (%)
Races - Native Hawaiian and Other Pacific Islander alone (% change since 2000)
Races - Two or more races (%)
Races - Two or more races (% change since 2000)
Races - Other race alone (%)
Races - Other race alone (% change since 2000)
Racial diversity
Unemployment (%)
Unemployment (% change since 2000)
Unemployment (%) - White
Unemployment (%) - Black or African American
Unemployment (%) - Asian
Unemployment (%) - Hispanic or Latino
Unemployment (%) - American Indian and Alaska Native
Unemployment (%) - Multirace
Unemployment (%) - Other Race
Population density (people per square mile)
Population - Males (%)
Population - Females (%)
Population - Males (%) - White
Population - Males (%) - Black or African American
Population - Males (%) - Asian
Population - Males (%) - Hispanic or Latino
Population - Males (%) - American Indian and Alaska Native
Population - Males (%) - Multirace
Population - Males (%) - Other Race
Population - Females (%) - White
Population - Females (%) - Black or African American
Population - Females (%) - Asian
Population - Females (%) - Hispanic or Latino
Population - Females (%) - American Indian and Alaska Native
Population - Females (%) - Multirace
Population - Females (%) - Other Race
Coronavirus confirmed cases (Apr 28, 2024)
Deaths caused by coronavirus (Apr 28, 2024)
Coronavirus confirmed cases (per 100k population) (Apr 28, 2024)
Deaths caused by coronavirus (per 100k population) (Apr 28, 2024)
Daily increase in number of cases (Apr 28, 2024)
Weekly increase in number of cases (Apr 28, 2024)
Cases doubled (in days) (Apr 28, 2024)
Hospitalized patients (Apr 18, 2022)
Negative test results (Apr 18, 2022)
Total test results (Apr 18, 2022)
COVID Vaccine doses distributed (per 100k population) (Sep 19, 2023)
COVID Vaccine doses administered (per 100k population) (Sep 19, 2023)
COVID Vaccine doses distributed (Sep 19, 2023)
COVID Vaccine doses administered (Sep 19, 2023)
Likely homosexual households (%)
Likely homosexual households (% change since 2000)
Likely homosexual households - Lesbian couples (%)
Likely homosexual households - Lesbian couples (% change since 2000)
Likely homosexual households - Gay men (%)
Likely homosexual households - Gay men (% change since 2000)
Cost of living index
Median gross rent ($)
Median contract rent ($)
Median monthly housing costs ($)
Median house or condo value ($)
Median house or condo value ($ change since 2000)
Mean house or condo value by units in structure - 1, detached ($)
Mean house or condo value by units in structure - 1, attached ($)
Mean house or condo value by units in structure - 2 ($)
Mean house or condo value by units in structure by units in structure - 3 or 4 ($)
Mean house or condo value by units in structure - 5 or more ($)
Mean house or condo value by units in structure - Boat, RV, van, etc. ($)
Mean house or condo value by units in structure - Mobile home ($)
Median house or condo value ($) - White
Median house or condo value ($) - Black or African American
Median house or condo value ($) - Asian
Median house or condo value ($) - Hispanic or Latino
Median house or condo value ($) - American Indian and Alaska Native
Median house or condo value ($) - Multirace
Median house or condo value ($) - Other Race
Median resident age
Resident age diversity
Median resident age - Males
Median resident age - Females
Median resident age - White
Median resident age - Black or African American
Median resident age - Asian
Median resident age - Hispanic or Latino
Median resident age - American Indian and Alaska Native
Median resident age - Multirace
Median resident age - Other Race
Median resident age - Males - White
Median resident age - Males - Black or African American
Median resident age - Males - Asian
Median resident age - Males - Hispanic or Latino
Median resident age - Males - American Indian and Alaska Native
Median resident age - Males - Multirace
Median resident age - Males - Other Race
Median resident age - Females - White
Median resident age - Females - Black or African American
Median resident age - Females - Asian
Median resident age - Females - Hispanic or Latino
Median resident age - Females - American Indian and Alaska Native
Median resident age - Females - Multirace
Median resident age - Females - Other Race
Commute - mean travel time to work (minutes)
Travel time to work - Less than 5 minutes (%)
Travel time to work - Less than 5 minutes (% change since 2000)
Travel time to work - 5 to 9 minutes (%)
Travel time to work - 5 to 9 minutes (% change since 2000)
Travel time to work - 10 to 19 minutes (%)
Travel time to work - 10 to 19 minutes (% change since 2000)
Travel time to work - 20 to 29 minutes (%)
Travel time to work - 20 to 29 minutes (% change since 2000)
Travel time to work - 30 to 39 minutes (%)
Travel time to work - 30 to 39 minutes (% change since 2000)
Travel time to work - 40 to 59 minutes (%)
Travel time to work - 40 to 59 minutes (% change since 2000)
Travel time to work - 60 to 89 minutes (%)
Travel time to work - 60 to 89 minutes (% change since 2000)
Travel time to work - 90 or more minutes (%)
Travel time to work - 90 or more minutes (% change since 2000)
Marital status - Never married (%)
Marital status - Now married (%)
Marital status - Separated (%)
Marital status - Widowed (%)
Marital status - Divorced (%)
Median family income ($)
Median family income (% change since 2000)
Median non-family income ($)
Median non-family income (% change since 2000)
Median per capita income ($)
Median per capita income (% change since 2000)
Median family income ($) - White
Median family income ($) - Black or African American
Median family income ($) - Asian
Median family income ($) - Hispanic or Latino
Median family income ($) - American Indian and Alaska Native
Median family income ($) - Multirace
Median family income ($) - Other Race
Median year house/condo built
Median year apartment built
Year house built - Built 2005 or later (%)
Year house built - Built 2000 to 2004 (%)
Year house built - Built 1990 to 1999 (%)
Year house built - Built 1980 to 1989 (%)
Year house built - Built 1970 to 1979 (%)
Year house built - Built 1960 to 1969 (%)
Year house built - Built 1950 to 1959 (%)
Year house built - Built 1940 to 1949 (%)
Year house built - Built 1939 or earlier (%)
Average household size
Household density (households per square mile)
Average household size - White
Average household size - Black or African American
Average household size - Asian
Average household size - Hispanic or Latino
Average household size - American Indian and Alaska Native
Average household size - Multirace
Average household size - Other Race
Occupied housing units (%)
Vacant housing units (%)
Owner occupied housing units (%)
Renter occupied housing units (%)
Vacancy status - For rent (%)
Vacancy status - For sale only (%)
Vacancy status - Rented or sold, not occupied (%)
Vacancy status - For seasonal, recreational, or occasional use (%)
Vacancy status - For migrant workers (%)
Vacancy status - Other vacant (%)
Residents with income below the poverty level (%)
Residents with income below 50% of the poverty level (%)
Children below poverty level (%)
Poor families by family type - Married-couple family (%)
Poor families by family type - Male, no wife present (%)
Poor families by family type - Female, no husband present (%)
Poverty status for native-born residents (%)
Poverty status for foreign-born residents (%)
Poverty among high school graduates not in families (%)
Poverty among people who did not graduate high school not in families (%)
Residents with income below the poverty level (%) - White
Residents with income below the poverty level (%) - Black or African American
Residents with income below the poverty level (%) - Asian
Residents with income below the poverty level (%) - Hispanic or Latino
Residents with income below the poverty level (%) - American Indian and Alaska Native
Residents with income below the poverty level (%) - Multirace
Residents with income below the poverty level (%) - Other Race
Air pollution - Air Quality Index (AQI)
Air pollution - CO
Air pollution - NO2
Air pollution - SO2
Air pollution - Ozone
Air pollution - PM10
Air pollution - PM25
Air pollution - Pb
Crime - Murders per 100,000 population
Crime - Rapes per 100,000 population
Crime - Robberies per 100,000 population
Crime - Assaults per 100,000 population
Crime - Burglaries per 100,000 population
Crime - Thefts per 100,000 population
Crime - Auto thefts per 100,000 population
Crime - Arson per 100,000 population
Crime - City-data.com crime index
Crime - Violent crime index
Crime - Property crime index
Crime - Murders per 100,000 population (5 year average)
Crime - Rapes per 100,000 population (5 year average)
Crime - Robberies per 100,000 population (5 year average)
Crime - Assaults per 100,000 population (5 year average)
Crime - Burglaries per 100,000 population (5 year average)
Crime - Thefts per 100,000 population (5 year average)
Crime - Auto thefts per 100,000 population (5 year average)
Crime - Arson per 100,000 population (5 year average)
Crime - City-data.com crime index (5 year average)
Crime - Violent crime index (5 year average)
Crime - Property crime index (5 year average)
1996 Presidential Elections Results (%) - Democratic Party (Clinton)
1996 Presidential Elections Results (%) - Republican Party (Dole)
1996 Presidential Elections Results (%) - Other
2000 Presidential Elections Results (%) - Democratic Party (Gore)
2000 Presidential Elections Results (%) - Republican Party (Bush)
2000 Presidential Elections Results (%) - Other
2004 Presidential Elections Results (%) - Democratic Party (Kerry)
2004 Presidential Elections Results (%) - Republican Party (Bush)
2004 Presidential Elections Results (%) - Other
2008 Presidential Elections Results (%) - Democratic Party (Obama)
2008 Presidential Elections Results (%) - Republican Party (McCain)
2008 Presidential Elections Results (%) - Other
2012 Presidential Elections Results (%) - Democratic Party (Obama)
2012 Presidential Elections Results (%) - Republican Party (Romney)
2012 Presidential Elections Results (%) - Other
2016 Presidential Elections Results (%) - Democratic Party (Clinton)
2016 Presidential Elections Results (%) - Republican Party (Trump)
2016 Presidential Elections Results (%) - Other
2020 Presidential Elections Results (%) - Democratic Party (Biden)
2020 Presidential Elections Results (%) - Republican Party (Trump)
2020 Presidential Elections Results (%) - Other
Ancestries Reported - Arab (%)
Ancestries Reported - Czech (%)
Ancestries Reported - Danish (%)
Ancestries Reported - Dutch (%)
Ancestries Reported - English (%)
Ancestries Reported - French (%)
Ancestries Reported - French Canadian (%)
Ancestries Reported - German (%)
Ancestries Reported - Greek (%)
Ancestries Reported - Hungarian (%)
Ancestries Reported - Irish (%)
Ancestries Reported - Italian (%)
Ancestries Reported - Lithuanian (%)
Ancestries Reported - Norwegian (%)
Ancestries Reported - Polish (%)
Ancestries Reported - Portuguese (%)
Ancestries Reported - Russian (%)
Ancestries Reported - Scotch-Irish (%)
Ancestries Reported - Scottish (%)
Ancestries Reported - Slovak (%)
Ancestries Reported - Subsaharan African (%)
Ancestries Reported - Swedish (%)
Ancestries Reported - Swiss (%)
Ancestries Reported - Ukrainian (%)
Ancestries Reported - United States (%)
Ancestries Reported - Welsh (%)
Ancestries Reported - West Indian (%)
Ancestries Reported - Other (%)
Educational Attainment - No schooling completed (%)
Educational Attainment - Less than high school (%)
Educational Attainment - High school or equivalent (%)
Educational Attainment - Less than 1 year of college (%)
Educational Attainment - 1 or more years of college (%)
Educational Attainment - Associate degree (%)
Educational Attainment - Bachelor's degree (%)
Educational Attainment - Master's degree (%)
Educational Attainment - Professional school degree (%)
Educational Attainment - Doctorate degree (%)
School Enrollment - Nursery, preschool (%)
School Enrollment - Kindergarten (%)
School Enrollment - Grade 1 to 4 (%)
School Enrollment - Grade 5 to 8 (%)
School Enrollment - Grade 9 to 12 (%)
School Enrollment - College undergrad (%)
School Enrollment - Graduate or professional (%)
School Enrollment - Not enrolled in school (%)
School enrollment - Public schools (%)
School enrollment - Private schools (%)
School enrollment - Not enrolled (%)
Median number of rooms in houses and condos
Median number of rooms in apartments
Housing units lacking complete plumbing facilities (%)
Housing units lacking complete kitchen facilities (%)
Density of houses
Urban houses (%)
Rural houses (%)
Households with people 60 years and over (%)
Households with people 65 years and over (%)
Households with people 75 years and over (%)
Households with one or more nonrelatives (%)
Households with no nonrelatives (%)
Population in households (%)
Family households (%)
Nonfamily households (%)
Population in families (%)
Family households with own children (%)
Median number of bedrooms in owner occupied houses
Mean number of bedrooms in owner occupied houses
Median number of bedrooms in renter occupied houses
Mean number of bedrooms in renter occupied houses
Median number of vehichles in owner occupied houses
Mean number of vehichles in owner occupied houses
Median number of vehichles in renter occupied houses
Mean number of vehichles in renter occupied houses
Mortgage status - with mortgage (%)
Mortgage status - with second mortgage (%)
Mortgage status - with home equity loan (%)
Mortgage status - with both second mortgage and home equity loan (%)
Mortgage status - without a mortgage (%)
Average family size
Average family size - White
Average family size - Black or African American
Average family size - Asian
Average family size - Hispanic or Latino
Average family size - American Indian and Alaska Native
Average family size - Multirace
Average family size - Other Race
Geographical mobility - Same house 1 year ago (%)
Geographical mobility - Moved within same county (%)
Geographical mobility - Moved from different county within same state (%)
Geographical mobility - Moved from different state (%)
Geographical mobility - Moved from abroad (%)
Place of birth - Born in state of residence (%)
Place of birth - Born in other state (%)
Place of birth - Native, outside of US (%)
Place of birth - Foreign born (%)
Housing units in structures - 1, detached (%)
Housing units in structures - 1, attached (%)
Housing units in structures - 2 (%)
Housing units in structures - 3 or 4 (%)
Housing units in structures - 5 to 9 (%)
Housing units in structures - 10 to 19 (%)
Housing units in structures - 20 to 49 (%)
Housing units in structures - 50 or more (%)
Housing units in structures - Mobile home (%)
Housing units in structures - Boat, RV, van, etc. (%)
House/condo owner moved in on average (years ago)
Renter moved in on average (years ago)
Year householder moved into unit - Moved in 1999 to March 2000 (%)
Year householder moved into unit - Moved in 1995 to 1998 (%)
Year householder moved into unit - Moved in 1990 to 1994 (%)
Year householder moved into unit - Moved in 1980 to 1989 (%)
Year householder moved into unit - Moved in 1970 to 1979 (%)
Year householder moved into unit - Moved in 1969 or earlier (%)
Means of transportation to work - Drove car alone (%)
Means of transportation to work - Carpooled (%)
Means of transportation to work - Public transportation (%)
Means of transportation to work - Bus or trolley bus (%)
Means of transportation to work - Streetcar or trolley car (%)
Means of transportation to work - Subway or elevated (%)
Means of transportation to work - Railroad (%)
Means of transportation to work - Ferryboat (%)
Means of transportation to work - Taxicab (%)
Means of transportation to work - Motorcycle (%)
Means of transportation to work - Bicycle (%)
Means of transportation to work - Walked (%)
Means of transportation to work - Other means (%)
Working at home (%)
Industry diversity
Most Common Industries - Agriculture, forestry, fishing and hunting, and mining (%)
Most Common Industries - Agriculture, forestry, fishing and hunting (%)
Most Common Industries - Mining, quarrying, and oil and gas extraction (%)
Most Common Industries - Construction (%)
Most Common Industries - Manufacturing (%)
Most Common Industries - Wholesale trade (%)
Most Common Industries - Retail trade (%)
Most Common Industries - Transportation and warehousing, and utilities (%)
Most Common Industries - Transportation and warehousing (%)
Most Common Industries - Utilities (%)
Most Common Industries - Information (%)
Most Common Industries - Finance and insurance, and real estate and rental and leasing (%)
Most Common Industries - Finance and insurance (%)
Most Common Industries - Real estate and rental and leasing (%)
Most Common Industries - Professional, scientific, and management, and administrative and waste management services (%)
Most Common Industries - Professional, scientific, and technical services (%)
Most Common Industries - Management of companies and enterprises (%)
Most Common Industries - Administrative and support and waste management services (%)
Most Common Industries - Educational services, and health care and social assistance (%)
Most Common Industries - Educational services (%)
Most Common Industries - Health care and social assistance (%)
Most Common Industries - Arts, entertainment, and recreation, and accommodation and food services (%)
Most Common Industries - Arts, entertainment, and recreation (%)
Most Common Industries - Accommodation and food services (%)
Most Common Industries - Other services, except public administration (%)
Most Common Industries - Public administration (%)
Occupation diversity
Most Common Occupations - Management, business, science, and arts occupations (%)
Most Common Occupations - Management, business, and financial occupations (%)
Most Common Occupations - Management occupations (%)
Most Common Occupations - Business and financial operations occupations (%)
Most Common Occupations - Computer, engineering, and science occupations (%)
Most Common Occupations - Computer and mathematical occupations (%)
Most Common Occupations - Architecture and engineering occupations (%)
Most Common Occupations - Life, physical, and social science occupations (%)
Most Common Occupations - Education, legal, community service, arts, and media occupations (%)
Most Common Occupations - Community and social service occupations (%)
Most Common Occupations - Legal occupations (%)
Most Common Occupations - Education, training, and library occupations (%)
Most Common Occupations - Arts, design, entertainment, sports, and media occupations (%)
Most Common Occupations - Healthcare practitioners and technical occupations (%)
Most Common Occupations - Health diagnosing and treating practitioners and other technical occupations (%)
Most Common Occupations - Health technologists and technicians (%)
Most Common Occupations - Service occupations (%)
Most Common Occupations - Healthcare support occupations (%)
Most Common Occupations - Protective service occupations (%)
Most Common Occupations - Fire fighting and prevention, and other protective service workers including supervisors (%)
Most Common Occupations - Law enforcement workers including supervisors (%)
Most Common Occupations - Food preparation and serving related occupations (%)
Most Common Occupations - Building and grounds cleaning and maintenance occupations (%)
Most Common Occupations - Personal care and service occupations (%)
Most Common Occupations - Sales and office occupations (%)
Most Common Occupations - Sales and related occupations (%)
Most Common Occupations - Office and administrative support occupations (%)
Most Common Occupations - Natural resources, construction, and maintenance occupations (%)
Most Common Occupations - Farming, fishing, and forestry occupations (%)
Most Common Occupations - Construction and extraction occupations (%)
Most Common Occupations - Installation, maintenance, and repair occupations (%)
Most Common Occupations - Production, transportation, and material moving occupations (%)
Most Common Occupations - Production occupations (%)
Most Common Occupations - Transportation occupations (%)
Most Common Occupations - Material moving occupations (%)
People in Group quarters - Institutionalized population (%)
People in Group quarters - Correctional institutions (%)
People in Group quarters - Federal prisons and detention centers (%)
People in Group quarters - Halfway houses (%)
People in Group quarters - Local jails and other confinement facilities (including police lockups) (%)
People in Group quarters - Military disciplinary barracks (%)
People in Group quarters - State prisons (%)
People in Group quarters - Other types of correctional institutions (%)
People in Group quarters - Nursing homes (%)
People in Group quarters - Hospitals/wards, hospices, and schools for the handicapped (%)
People in Group quarters - Hospitals/wards and hospices for chronically ill (%)
People in Group quarters - Hospices or homes for chronically ill (%)
People in Group quarters - Military hospitals or wards for chronically ill (%)
People in Group quarters - Other hospitals or wards for chronically ill (%)
People in Group quarters - Hospitals or wards for drug/alcohol abuse (%)
People in Group quarters - Mental (Psychiatric) hospitals or wards (%)
People in Group quarters - Schools, hospitals, or wards for the mentally retarded (%)
People in Group quarters - Schools, hospitals, or wards for the physically handicapped (%)
People in Group quarters - Institutions for the deaf (%)
People in Group quarters - Institutions for the blind (%)
People in Group quarters - Orthopedic wards and institutions for the physically handicapped (%)
People in Group quarters - Wards in general hospitals for patients who have no usual home elsewhere (%)
People in Group quarters - Wards in military hospitals for patients who have no usual home elsewhere (%)
People in Group quarters - Juvenile institutions (%)
People in Group quarters - Long-term care (%)
People in Group quarters - Homes for abused, dependent, and neglected children (%)
People in Group quarters - Residential treatment centers for emotionally disturbed children (%)
People in Group quarters - Training schools for juvenile delinquents (%)
People in Group quarters - Short-term care, detention or diagnostic centers for delinquent children (%)
People in Group quarters - Type of juvenile institution unknown (%)
People in Group quarters - Noninstitutionalized population (%)
People in Group quarters - College dormitories (includes college quarters off campus) (%)
People in Group quarters - Military quarters (%)
People in Group quarters - On base (%)
People in Group quarters - Barracks, unaccompanied personnel housing (UPH), (Enlisted/Officer), ;and similar group living quarters for military personnel (%)
People in Group quarters - Transient quarters for temporary residents (%)
People in Group quarters - Military ships (%)
People in Group quarters - Group homes (%)
People in Group quarters - Homes or halfway houses for drug/alcohol abuse (%)
People in Group quarters - Homes for the mentally ill (%)
People in Group quarters - Homes for the mentally retarded (%)
People in Group quarters - Homes for the physically handicapped (%)
People in Group quarters - Other group homes (%)
People in Group quarters - Religious group quarters (%)
People in Group quarters - Dormitories (%)
People in Group quarters - Agriculture workers' dormitories on farms (%)
People in Group quarters - Job Corps and vocational training facilities (%)
People in Group quarters - Other workers' dormitories (%)
People in Group quarters - Crews of maritime vessels (%)
People in Group quarters - Other nonhousehold living situations (%)
People in Group quarters - Other noninstitutional group quarters (%)
Residents speaking English at home (%)
Residents speaking English at home - Born in the United States (%)
Residents speaking English at home - Native, born elsewhere (%)
Residents speaking English at home - Foreign born (%)
Residents speaking Spanish at home (%)
Residents speaking Spanish at home - Born in the United States (%)
Residents speaking Spanish at home - Native, born elsewhere (%)
Residents speaking Spanish at home - Foreign born (%)
Residents speaking other language at home (%)
Residents speaking other language at home - Born in the United States (%)
Residents speaking other language at home - Native, born elsewhere (%)
Residents speaking other language at home - Foreign born (%)
Class of Workers - Employee of private company (%)
Class of Workers - Self-employed in own incorporated business (%)
Class of Workers - Private not-for-profit wage and salary workers (%)
Class of Workers - Local government workers (%)
Class of Workers - State government workers (%)
Class of Workers - Federal government workers (%)
Class of Workers - Self-employed workers in own not incorporated business and Unpaid family workers (%)
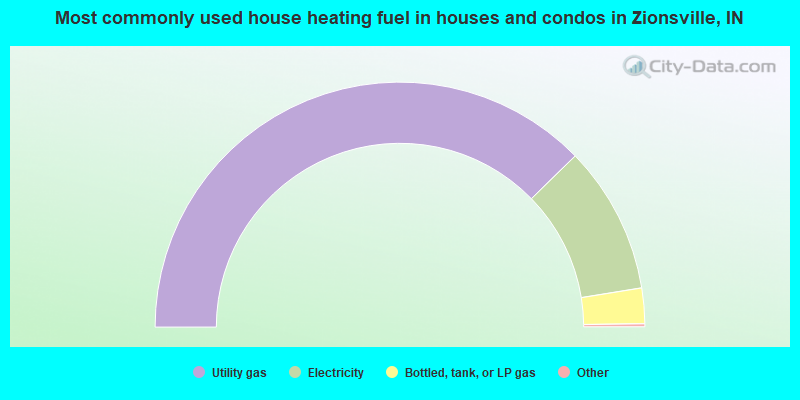
House heating fuel used in houses and condos - Utility gas (%)
House heating fuel used in houses and condos - Bottled, tank, or LP gas (%)
House heating fuel used in houses and condos - Electricity (%)
House heating fuel used in houses and condos - Fuel oil, kerosene, etc. (%)
House heating fuel used in houses and condos - Coal or coke (%)
House heating fuel used in houses and condos - Wood (%)
House heating fuel used in houses and condos - Solar energy (%)
House heating fuel used in houses and condos - Other fuel (%)
House heating fuel used in houses and condos - No fuel used (%)
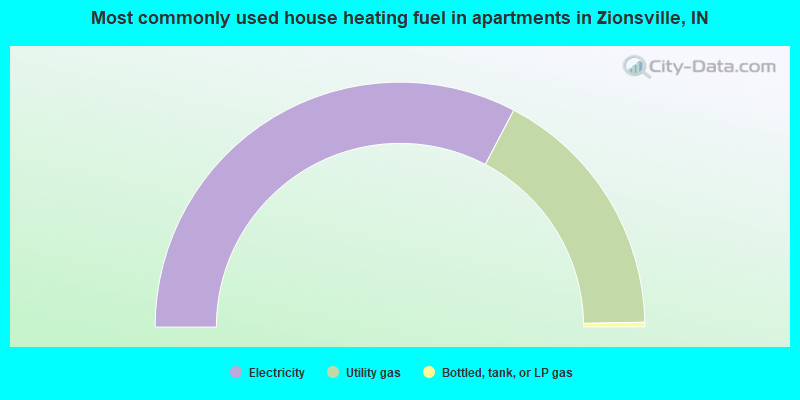
House heating fuel used in apartments - Utility gas (%)
House heating fuel used in apartments - Bottled, tank, or LP gas (%)
House heating fuel used in apartments - Electricity (%)
House heating fuel used in apartments - Fuel oil, kerosene, etc. (%)
House heating fuel used in apartments - Coal or coke (%)
House heating fuel used in apartments - Wood (%)
House heating fuel used in apartments - Solar energy (%)
House heating fuel used in apartments - Other fuel (%)
House heating fuel used in apartments - No fuel used (%)
Armed forces status - In Armed Forces (%)
Armed forces status - Civilian (%)
Armed forces status - Civilian - Veteran (%)
Armed forces status - Civilian - Nonveteran (%)
Fatal accidents locations in years 2005-2021
Fatal accidents locations in 2005
Fatal accidents locations in 2006
Fatal accidents locations in 2007
Fatal accidents locations in 2008
Fatal accidents locations in 2009
Fatal accidents locations in 2010
Fatal accidents locations in 2011
Fatal accidents locations in 2012
Fatal accidents locations in 2013
Fatal accidents locations in 2014
Fatal accidents locations in 2015
Fatal accidents locations in 2016
Fatal accidents locations in 2017
Fatal accidents locations in 2018
Fatal accidents locations in 2019
Fatal accidents locations in 2020
Fatal accidents locations in 2021
Alcohol use - People drinking some alcohol every month (%)
Alcohol use - People not drinking at all (%)
Alcohol use - Average days/month drinking alcohol
Alcohol use - Average drinks/week
Alcohol use - Average days/year people drink much
Audiometry - Average condition of hearing (%)
Audiometry - People that can hear a whisper from across a quiet room (%)
Audiometry - People that can hear normal voice from across a quiet room (%)
Audiometry - Ears ringing, roaring, buzzing (%)
Audiometry - Had a job exposure to loud noise (%)
Audiometry - Had off-work exposure to loud noise (%)
Blood Pressure & Cholesterol - Has high blood pressure (%)
Blood Pressure & Cholesterol - Checking blood pressure at home (%)
Blood Pressure & Cholesterol - Frequently checking blood cholesterol (%)
Blood Pressure & Cholesterol - Has high cholesterol level (%)
Consumer Behavior - Money monthly spent on food at supermarket/grocery store
Consumer Behavior - Money monthly spent on food at other stores
Consumer Behavior - Money monthly spent on eating out
Consumer Behavior - Money monthly spent on carryout/delivered foods
Consumer Behavior - Income spent on food at supermarket/grocery store (%)
Consumer Behavior - Income spent on food at other stores (%)
Consumer Behavior - Income spent on eating out (%)
Consumer Behavior - Income spent on carryout/delivered foods (%)
Current Health Status - General health condition (%)
Current Health Status - Blood donors (%)
Current Health Status - Has blood ever tested for HIV virus (%)
Current Health Status - Left-handed people (%)
Dermatology - People using sunscreen (%)
Diabetes - Diabetics (%)
Diabetes - Had a blood test for high blood sugar (%)
Diabetes - People taking insulin (%)
Diet Behavior & Nutrition - Diet health (%)
Diet Behavior & Nutrition - Milk product consumption (# of products/month)
Diet Behavior & Nutrition - Meals not home prepared (#/week)
Diet Behavior & Nutrition - Meals from fast food or pizza place (#/week)
Diet Behavior & Nutrition - Ready-to-eat foods (#/month)
Diet Behavior & Nutrition - Frozen meals/pizza (#/month)
Drug Use - People that ever used marijuana or hashish (%)
Drug Use - Ever used hard drugs (%)
Drug Use - Ever used any form of cocaine (%)
Drug Use - Ever used heroin (%)
Drug Use - Ever used methamphetamine (%)
Health Insurance - People covered by health insurance (%)
Kidney Conditions-Urology - Avg. # of times urinating at night
Medical Conditions - People with asthma (%)
Medical Conditions - People with anemia (%)
Medical Conditions - People with psoriasis (%)
Medical Conditions - People with overweight (%)
Medical Conditions - Elderly people having difficulties in thinking or remembering (%)
Medical Conditions - People who ever received blood transfusion (%)
Medical Conditions - People having trouble seeing even with glass/contacts (%)
Medical Conditions - People with arthritis (%)
Medical Conditions - People with gout (%)
Medical Conditions - People with congestive heart failure (%)
Medical Conditions - People with coronary heart disease (%)
Medical Conditions - People with angina pectoris (%)
Medical Conditions - People who ever had heart attack (%)
Medical Conditions - People who ever had stroke (%)
Medical Conditions - People with emphysema (%)
Medical Conditions - People with thyroid problem (%)
Medical Conditions - People with chronic bronchitis (%)
Medical Conditions - People with any liver condition (%)
Medical Conditions - People who ever had cancer or malignancy (%)
Mental Health - People who have little interest in doing things (%)
Mental Health - People feeling down, depressed, or hopeless (%)
Mental Health - People who have trouble sleeping or sleeping too much (%)
Mental Health - People feeling tired or having little energy (%)
Mental Health - People with poor appetite or overeating (%)
Mental Health - People feeling bad about themself (%)
Mental Health - People who have trouble concentrating on things (%)
Mental Health - People moving or speaking slowly or too fast (%)
Mental Health - People having thoughts they would be better off dead (%)
Oral Health - Average years since last visit a dentist
Oral Health - People embarrassed because of mouth (%)
Oral Health - People with gum disease (%)
Oral Health - General health of teeth and gums (%)
Oral Health - Average days a week using dental floss/device
Oral Health - Average days a week using mouthwash for dental problem
Oral Health - Average number of teeth
Pesticide Use - Households using pesticides to control insects (%)
Pesticide Use - Households using pesticides to kill weeds (%)
Physical Activity - People doing vigorous-intensity work activities (%)
Physical Activity - People doing moderate-intensity work activities (%)
Physical Activity - People walking or bicycling (%)
Physical Activity - People doing vigorous-intensity recreational activities (%)
Physical Activity - People doing moderate-intensity recreational activities (%)
Physical Activity - Average hours a day doing sedentary activities
Physical Activity - Average hours a day watching TV or videos
Physical Activity - Average hours a day using computer
Physical Functioning - People having limitations keeping them from working (%)
Physical Functioning - People limited in amount of work they can do (%)
Physical Functioning - People that need special equipment to walk (%)
Physical Functioning - People experiencing confusion/memory problems (%)
Physical Functioning - People requiring special healthcare equipment (%)
Prescription Medications - Average number of prescription medicines taking
Preventive Aspirin Use - Adults 40+ taking low-dose aspirin (%)
Reproductive Health - Vaginal deliveries (%)
Reproductive Health - Cesarean deliveries (%)
Reproductive Health - Deliveries resulted in a live birth (%)
Reproductive Health - Pregnancies resulted in a delivery (%)
Reproductive Health - Women breastfeeding newborns (%)
Reproductive Health - Women that had a hysterectomy (%)
Reproductive Health - Women that had both ovaries removed (%)
Reproductive Health - Women that have ever taken birth control pills (%)
Reproductive Health - Women taking birth control pills (%)
Reproductive Health - Women that have ever used Depo-Provera or injectables (%)
Reproductive Health - Women that have ever used female hormones (%)
Sexual Behavior - People 18+ that ever had sex (vaginal, anal, or oral) (%)
Sexual Behavior - Males 18+ that ever had vaginal sex with a woman (%)
Sexual Behavior - Males 18+ that ever performed oral sex on a woman (%)
Sexual Behavior - Males 18+ that ever had anal sex with a woman (%)
Sexual Behavior - Males 18+ that ever had any sex with a man (%)
Sexual Behavior - Females 18+ that ever had vaginal sex with a man (%)
Sexual Behavior - Females 18+ that ever performed oral sex on a man (%)
Sexual Behavior - Females 18+ that ever had anal sex with a man (%)
Sexual Behavior - Females 18+ that ever had any kind of sex with a woman (%)
Sexual Behavior - Average age people first had sex
Sexual Behavior - Average number of female sex partners in lifetime (males 18+)
Sexual Behavior - Average number of female vaginal sex partners in lifetime (males 18+)
Sexual Behavior - Average age people first performed oral sex on a woman (18+)
Sexual Behavior - Average number of woman performed oral sex on in lifetime (18+)
Sexual Behavior - Average number of male sex partners in lifetime (males 18+)
Sexual Behavior - Average number of male anal sex partners in lifetime (males 18+)
Sexual Behavior - Average age people first performed oral sex on a man (18+)
Sexual Behavior - Average number of male oral sex partners in lifetime (18+)
Sexual Behavior - People using protection when performing oral sex (%)
Sexual Behavior - Average number of times people have vaginal or anal sex a year
Sexual Behavior - People having sex without condom (%)
Sexual Behavior - Average number of male sex partners in lifetime (females 18+)
Sexual Behavior - Average number of male vaginal sex partners in lifetime (females 18+)
Sexual Behavior - Average number of female sex partners in lifetime (females 18+)
Sexual Behavior - Circumcised males 18+ (%)
Sleep Disorders - Average hours sleeping at night
Sleep Disorders - People that has trouble sleeping (%)
Smoking-Cigarette Use - People smoking cigarettes (%)
Taste & Smell - People 40+ having problems with smell (%)
Taste & Smell - People 40+ having problems with taste (%)
Taste & Smell - People 40+ that ever had wisdom teeth removed (%)
Taste & Smell - People 40+ that ever had tonsils teeth removed (%)
Taste & Smell - People 40+ that ever had a loss of consciousness because of a head injury (%)
Taste & Smell - People 40+ that ever had a broken nose or other serious injury to face or skull (%)
Taste & Smell - People 40+ that ever had two or more sinus infections (%)
Weight - Average height (inches)
Weight - Average weight (pounds)
Weight - Average BMI
Weight - People that are obese (%)
Weight - People that ever were obese (%)
Weight - People trying to lose weight (%)
According to our research of Indiana and other state lists, there was 1 registered sex offender living in Zionsville, Indiana as of April 28, 2024 . The ratio of all residents to sex offenders in Zionsville is 25,878 to 1.The ratio of registered sex offenders to all residents in this city is much lower than the state average.
Officers per 1,000 residents here:
1.21Indiana average:
2.12
Latest news from Zionsville, IN collected exclusively by city-data.com from local newspapers, TV, and radio stations
Ancestries: American (23.6%), German (22.1%), English (10.7%), Irish (5.9%), European (3.1%), Polish (2.3%).
Current Local Time:
Land area: 5.80 square miles.
Population density: 5,514 people per square mile (average).
1,855 residents are foreign born (3.2% Asia , 0.6% Europe , 0.6% Latin America , 0.6% North America ).
This town:
5.8%Indiana:
5.6%
Median real estate property taxes paid for housing units with mortgages in 2022: $4,058 (0.8%)Median real estate property taxes paid for housing units with no mortgage in 2022: $5,995 (0.9%)
Nearest city with pop. 50,000+: Indianapolis, IN
Nearest city with pop. 1,000,000+: Chicago, IL
Nearest cities:
North Crows Nest, IN (2.9 miles),
Crows Nest, IN (2.9 miles),
Latitude: 39.95 N, Longitude: 86.27 W
Daytime population change due to commuting: -4,037 (-12.6%)Workers who live and work in this town: 6,099 (38.5%)
Single-family new house construction building permits:
2022: 179 buildings , average cost: $1,126,7002021: 292 buildings , average cost: $793,0002020: 298 buildings , average cost: $531,8002019: 217 buildings , average cost: $390,0002018: 209 buildings , average cost: $445,5002017: 176 buildings , average cost: $429,6002016: 122 buildings , average cost: $502,3002015: 134 buildings , average cost: $515,8002014: 190 buildings , average cost: $369,8002013: 261 buildings , average cost: $274,1002012: 184 buildings , average cost: $308,8002011: 203 buildings , average cost: $195,1002010: 170 buildings , average cost: $182,4002009: 60 buildings , average cost: $262,3002008: 52 buildings , average cost: $201,9002007: 86 buildings , average cost: $175,0002006: 132 buildings , average cost: $170,4002005: 171 buildings , average cost: $181,9002004: 185 buildings , average cost: $206,1002003: 105 buildings , average cost: $221,5002002: 102 buildings , average cost: $222,7002001: 112 buildings , average cost: $241,4002000: 98 buildings , average cost: $249,1001999: 124 buildings , average cost: $245,9001998: 72 buildings , average cost: $259,8001997: 46 buildings , average cost: $312,700Unemployment in December 2023:
Most common occupations in Zionsville, IN (%)
Both Males Females
Other management occupations, except farmers and farm managers (10.1%)
Other sales and related occupations, including supervisors (5.9%)
Top executives (5.8%)
Advertising, marketing, promotions, public relations, and sales managers (5.2%)
Preschool, kindergarten, elementary, and middle school teachers (4.7%)
Sales representatives, services, wholesale and manufacturing (3.4%)
Information and record clerks, except customer service representatives (3.3%)
Other management occupations, except farmers and farm managers (12.8%)
Top executives (9.9%)
Advertising, marketing, promotions, public relations, and sales managers (7.8%)
Supervisors, construction and extraction workers (5.2%)
Other sales and related occupations, including supervisors (5.1%)
Sales representatives, services, wholesale and manufacturing (4.8%)
Engineers (4.4%)
Preschool, kindergarten, elementary, and middle school teachers (10.5%)
Secretaries and administrative assistants (7.2%)
Other sales and related occupations, including supervisors (6.8%)
Other management occupations, except farmers and farm managers (6.7%)
Registered nurses (5.3%)
Information and record clerks, except customer service representatives (4.9%)
Retail sales workers, except cashiers (2.9%)
Tornado activity:
Zionsville-area historical tornado activity is slightly above Indiana state average. It is 123% greater than the overall U.S. average.
On 5/14/1972, a category F4 (max. wind speeds 207-260 mph) tornado 16.2 miles away from the Zionsville town center injured 20 people and caused between $50,000 and $500,000 in damages.
On 4/11/1965, a category F4 tornado 20.0 miles away from the town center killed 28 people and injured 123 people and caused between $5,000,000 and $50,000,000 in damages.
Earthquake activity:
Zionsville-area historical earthquake activity is significantly above Indiana state average. It is 78% greater than the overall U.S. average. On 4/18/2008 at 09:36:59, a magnitude 5.4 (5.1 MB, 4.8 MS, 5.4 MW, 5.2 MW, Class: Moderate, Intensity: VI - VII) earthquake occurred 135.2 miles away from Zionsville center On 4/18/2008 at 09:36:59, a magnitude 5.2 (5.2 MW, Depth: 8.9 mi) earthquake occurred 135.3 miles away from Zionsville center On 6/10/1987 at 23:48:54, a magnitude 5.1 (4.9 MB, 4.4 MS, 4.6 MS, 5.1 LG) earthquake occurred 116.6 miles away from the city center On 7/27/1980 at 18:52:21, a magnitude 5.2 (5.1 MB, 4.7 MS, 5.0 UK, 5.2 UK) earthquake occurred 173.8 miles away from the city center On 6/18/2002 at 17:37:15, a magnitude 5.0 (4.3 MB, 4.6 MW, 5.0 LG) earthquake occurred 158.4 miles away from the city center On 4/18/2008 at 15:14:16, a magnitude 4.8 (4.5 MB, 4.8 MW, 4.6 MW, Class: Light, Intensity: IV - V) earthquake occurred 132.6 miles away from the city center Magnitude types: regional Lg-wave magnitude (LG), body-wave magnitude (MB), surface-wave magnitude (MS), moment magnitude (MW) Natural disasters: The number of natural disasters in Boone County (14) is near the US average (15).Major Disasters (Presidential) Declared: 9Emergencies Declared: 4Storms: 6, Floods: 5, Tornadoes: 4, Winter Storms: 3, Snowstorms: 2, Blizzard: 1, Hurricane: 1, Ice Storm: 1, Snow: 1, Other: 1 (Note: some incidents may be assigned to more than one category). Hospitals and medical centers in Zionsville: ZIONSVILLE MEADOWS (675 S FORD RD)
Other hospitals and medical centers near Zionsville: INDIANA ORTHOPAEDIC HOSPITAL (about 4 miles away; INDIANAPOLIS, IN)
AMEDISYS OF INDIANAPOLIS (Home Health Center, about 4 miles away; INDIANAPOLIS, IN)
AXIS HOME HEALTH CARE, INC (Home Health Center, about 4 miles away; INDIANAPOLIS, IN)
PEDIATRIC NURSING SPECIALISTS OF INDIANA (Home Health Center, about 4 miles away; INDIANAPOLIS, IN)
ADVENTA HOSPICE (Hospital, about 4 miles away; INDIANAPOLIS, IN)
ASERACARE HOSPICE (Hospital, about 4 miles away; INDIANAPOLIS, IN)
ST VINCENT HOME CARE (Home Health Center, about 4 miles away; INDIANAPOLIS, IN)
Heliports located in Zionsville: Amtrak station near Zionsville: 15 miles: INDIANAPOLIS (350 S. ILLINOIS ST.) Services: ticket office, partially wheelchair accessible, public payphones, full-service food facilities, free short-term parking, paid long-term parking, call for car rental service, taxi stand, intercity bus service.
Colleges/universities with over 2000 students nearest to Zionsville:
ITT Technical Institute-Indianapolis (about 4 miles; Indianapolis, IN ; Full-time enrollment: 4,765)
Butler University (about 10 miles; Indianapolis, IN ; FT enrollment: 4,388)
Marian University (about 11 miles; Indianapolis, IN ; FT enrollment: 2,476)
Ivy Tech Community College (about 12 miles; Indianapolis, IN ; FT enrollment: 71,493)
Indiana University-Purdue University-Indianapolis (about 14 miles; Indianapolis, IN ; FT enrollment: 22,751)
American College of Education (about 14 miles; Indianapolis, IN ; FT enrollment: 2,718)
Harrison College-Indianapolis (about 15 miles; Indianapolis, IN ; FT enrollment: 4,244)
Public high school in Zionsville:
Private high school in Zionsville: STERLING SOUTH - INDIANAPOLIS CAMPUS Students: 10, Location: 5299 W OLD 106TH ST, Grades: 3-9)
Public elementary/middle schools in Zionsville: ZIONSVILLE MIDDLE SCHOOL Students: 1,244, Location: 900 N FORD RD, Grades: 5-8)STONEGATE ELEMENTARY Students: 457, Location: 7312 W STONEGATE DR, Grades: KG-4)EAGLE ELEMENTARY SCHOOL Students: 393, Location: 350 N 6TH ST, Grades: KG-4)UNION ELEMENTARY SCHOOL Students: 127, Location: 11750 E 300 S, Grades: PK-4)ZIONSVILLE PLEASANT VIEW ELEM SCH Location: 4700 S 975 E, Grades: PK-4)
See full list of schools located in Zionsville Library in Zionsville: HUSSEY-MAYFIELD MEMORIAL PUBLIC LIBRARY Operating income: $1,948,095; Location: 250 NORTH FIFTH STREET; 105,989 books ; 9,338 audio materials ; 9,647 video materials ; 4 local licensed databases ; 37 state licensed databases ; 1 other licensed databases ; 270 print serial subscriptions )
Notable locations in Zionsville: (A) , Zionsville Fire Department Station 91 (B) , Munce Art Center (C) , Sullivan Museum (D) . Display/hide their locations on the map
Shopping Center: (1) . Display/hide its location on the map
Churches in Zionsville include: (A) , Saint Francis Episcopal Church (B) , Zionsville Christian Church (C) . Display/hide their locations on the map
Cemetery: (1) . Display/hide its location on the map
Streams, rivers, and creeks: (A) , Lost Drain (B) , Crazy Creek (C) , Cross Branch (D) , Cox Creek (E) , Lost Run (F) , Long Branch (G) . Display/hide their locations on the map
Parks in Zionsville include: (1) , Nancy Burton Memorial Park (2) . Display/hide their locations on the map
Tourist attractions:
Hotels:
Birthplace of: John-Michael Liles - NHL player (Colorado Avalanche, born : Nov 25, 1980).
Boone County has a predicted average indoor radon screening level greater than 4 pCi/L (pico curies per liter) - Highest Potential Drinking water stations with addresses in Zionsville and their reported violations in the past:
PALOMINO BALLROOM, INC. (Population served: 50, Groundwater):
Past monitoring violations:
One routine major monitoring violation
Average household size: This town:
2.8 peopleIndiana:
2.5 people
Percentage of family households: This town:
75.5%Whole state:
66.9%
Percentage of households with unmarried partners: This town:
2.4%Whole state:
6.9%
Likely homosexual households (counted as self-reported same-sex unmarried-partner households)
Lesbian couples: 0.2% of all households Gay men: 0.2% of all households
74 people in nursing facilities/skilled-nursing facilities in 2010people in nursing homes in 2000
Banks with branches in Zionsville (2011 data):
Old National Bank: Zionsville Branch, Zionsville/Marsh Branch, 106 & Michigan Rd./Marsh Branch. Info updated 2011/08/01: Bank assets: $8,467.9 mil, Deposits: $6,653.1 mil, headquarters in Evansville, IN, positive income , 195 total offices , Holding Company: Old National Bancorp
The Huntington National Bank: Zionsville Branch at 1207 West Oak Street, branch established on 1997/04/21; West Carmel Branch at 10925 North Michigan Road, branch established on 2007/04/02. Info updated 2012/04/02: Bank assets: $54,183.4 mil, Deposits: $44,300.3 mil, headquarters in Columbus, OH, positive income , Commercial Lending Specialization, 878 total offices , Holding Company: Huntington Bancshares Incorporated
PNC Bank, National Association: Boone Village Branch at 1395 West Oak Street, branch established on 1972/12/20; South Main Branch at 390 South Main Street, branch established on 1986/11/12. Info updated 2012/03/20: Bank assets: $263,309.6 mil, Deposits: $197,343.0 mil, headquarters in Wilmington, DE, positive income , Commercial Lending Specialization, 3085 total offices , Holding Company: Pnc Financial Services Group, Inc., The
KeyBank National Association: Zionsville Branch at 1610 West Oak Street, branch established on 2009/10/19; Eagle Village Branch at 11622 North Michigan Road, branch established on 1975/10/20. Info updated 2008/03/03: Bank assets: $86,198.8 mil, Deposits: $64,214.8 mil, headquarters in Cleveland, OH, positive income , Commercial Lending Specialization, 1067 total offices , Holding Company: Keycorp
JPMorgan Chase Bank, National Association: Zionsville Branch at 1414 West Oak Street, branch established on 1985/12/09. Info updated 2011/11/10: Bank assets: $1,811,678.0 mil, Deposits: $1,190,738.0 mil, headquarters in Columbus, OH, positive income , International Specialization, 5577 total offices , Holding Company: Jpmorgan Chase & Co.
State Bank of Lizton: Marketplace Branch at 6529 East State Road 334, branch established on 2007/07/31. Info updated 2006/11/03: Bank assets: $376.5 mil, Deposits: $337.0 mil, headquarters in Lizton, IN, positive income , Commercial Lending Specialization, 10 total offices , Holding Company: Lizton Financial Corporation
BMO Harris Bank National Association: Zionsville Branch at 1350 West Oak, branch established on 1934/07/01. Info updated 2011/07/14: Bank assets: $97,264.0 mil, Deposits: $75,624.6 mil, headquarters in Chicago, IL, positive income , 717 total offices , Holding Company: Bank Of Montreal
Flagstar Bank, FSB: Zionsville Branch at 50 N Ford Rd, branch established on 2005/12/21. Info updated 2011/07/21: Bank assets: $13,623.5 mil, Deposits: $7,802.8 mil, headquarters in Troy, MI, negative income in the last year , Mortgage Lending Specialization, 135 total offices
For population 15 years and over in Zionsville:
Never married: 19.2%Now married: 69.0%Separated: 0.6%Widowed: 4.1%Divorced: 7.1% For population 25 years and over in Zionsville:
High school or higher: 98.0%Bachelor's degree or higher: 69.2%Graduate or professional degree: 29.5%Unemployed: 1.4%Mean travel time to work (commute): 19.7 minutes
Education Gini index (Inequality in education) Here:
9.9Indiana average:
11.3
Religion statistics for Zionsville, IN (based on Boone County data)
Religion Adherents Congregations Evangelical Protestant 13,919 36 Mainline Protestant 9,955 22 Catholic 9,333 2 Other 340 3 None 23,093 -
Source: Clifford Grammich, Kirk Hadaway, Richard Houseal, Dale E.Jones, Alexei Krindatch, Richie Stanley and Richard H.Taylor. 2012. 2010 U.S.Religion Census: Religious Congregations & Membership Study. Association of Statisticians of American Religious Bodies. Jones, Dale E., et al. 2002. Congregations and Membership in the United States 2000. Nashville, TN: Glenmary Research Center. Graphs represent county-level data
Food Environment Statistics: Number of grocery stores : 10Boone County :
1.85 / 10,000 pop.Indiana :
1.73 / 10,000 pop.
Number of convenience stores (no gas) : 2Boone County :
0.37 / 10,000 pop.Indiana :
0.50 / 10,000 pop.
Number of convenience stores (with gas) : 11This county :
2.04 / 10,000 pop.Indiana :
3.57 / 10,000 pop.
Number of full-service restaurants : 38This county :
7.04 / 10,000 pop.Indiana :
6.78 / 10,000 pop.
Adult diabetes rate : Boone County :
9.3%State :
9.2%
Adult obesity rate : Boone County :
30.3%Indiana :
29.0%
Low-income preschool obesity rate : Boone County :
11.2%Indiana :
14.3%
Health and Nutrition:
Average overall health of teeth and gums : Zionsville:
54.9%Indiana:
46.2%
Average BMI : Zionsville:
28.5Indiana:
28.7
People feeling badly about themselves : This city:
19.0%State:
21.3%
People not drinking alcohol at all : Zionsville:
6.9%State:
10.6%
Average hours sleeping at night : Overweight people : This city:
37.3%Indiana:
33.9%
General health condition : Zionsville:
61.0%Indiana:
56.1%
Average condition of hearing : Zionsville:
80.8%Indiana:
78.7%
More about Health and Nutrition of Zionsville, IN Residents
Local government employment and payroll (March 2022)
Function
Full-time employees
Monthly full-time payroll
Average yearly full-time wage
Part-time employees
Monthly part-time payroll
Firefighters
72 $449,188 $74,865 3 $2,780 Police Protection - Officers
32 $200,274 $75,103 0 $0 Sewerage
14 $70,284 $60,243 0 $0 Streets and Highways
13 $70,588 $65,158 0 $0 Other Government Administration
13 $82,454 $76,111 9 $7,458 Police - Other
8 $40,031 $60,047 0 $0 Financial Administration
7 $39,470 $67,663 0 $0 Parks and Recreation
6 $34,826 $69,652 17 $6,454 Welfare
1 $4,864 $58,368 0 $0 Fire - Other
0 $0 9 $6,215 Judicial and Legal
0 $0 2 $1,752
Totals for Government
166 $991,979 $71,709 40 $24,659
Zionsville government finances - Expenditure in 2021 (per resident):
Construction - Sewerage: $2,841,000 ($88.83)
Parks and Recreation: $686,000 ($21.45)Current Operations - General - Other: $9,595,000 ($300.01)
Police Protection: $8,974,000 ($280.60)Local Fire Protection: $6,001,000 ($187.64)Central Staff Services: $5,052,000 ($157.96)Health - Other: $2,688,000 ($84.05)Sewerage: $1,529,000 ($47.81)Regular Highways: $1,070,000 ($33.46)Solid Waste Management: $671,000 ($20.98)Parks and Recreation: $224,000 ($7.00)Judicial and Legal Services: $61,000 ($1.91)General Public Buildings: $59,000 ($1.84)General - Interest on Debt: $945,000 ($29.55)
Other Capital Outlay - Local Fire Protection: $165,000 ($5.16)
Central Staff Services: $91,000 ($2.85)Sewerage: $25,000 ($0.78)
Zionsville government finances - Revenue in 2021 (per resident):
Charges - Sewerage: $4,968,000 ($155.34)
Parks and Recreation: $532,000 ($16.63)Other: $85,000 ($2.66)Federal Intergovernmental - Other: $100,000 ($3.13)
Local Intergovernmental - Other: $465,000 ($14.54)
Miscellaneous - General Revenue - Other: $216,000 ($6.75)
Interest Earnings: $161,000 ($5.03)Donations From Private Sources: $36,000 ($1.13)Rents: $6,000 ($0.19)Fines and Forfeits: $6,000 ($0.19)State Intergovernmental - Other: $16,657,000 ($520.82)
Highways: $2,993,000 ($93.58)General Local Government Support: $916,000 ($28.64)Tax - Property: $13,000,000 ($406.48)
Other License: $2,024,000 ($63.29)Other Selective Sales: $319,000 ($9.97)Public Utilities Sales: $100,000 ($3.13)
Zionsville government finances - Debt in 2021 (per resident):
Long Term Debt - Beginning Outstanding - Unspecified Public Purpose: $33,161,000 ($1036.86)
Outstanding Unspecified Public Purpose: $33,161,000 ($1036.86)
Zionsville government finances - Cash and Securities in 2021 (per resident):
Bond Funds - Cash and Securities: $16,688,000 ($521.79)
Other Funds - Cash and Securities: $37,015,000 ($1157.37)
Sinking Funds - Cash and Securities: $1,667,000 ($52.12)
Businesses in Zionsville, IN
Name Count Name Count
Bentleymotors.Com 1 McDonald's 1 CVS 2 New Balance 1 Dairy Queen 1 Nike 4 Domino's Pizza 1 Papa John's Pizza 1 FedEx 2 SAS Shoes 1 Firestone Complete Auto Care 1 Starbucks 1 Ford 1 Subway 1 Kincaid 1 True Value 1 Lowe's 1 UPS 4 MasterBrand Cabinets 1
Strongest AM radio stations in Zionsville:
WIBC (1070 AM; 50 kW; INDIANAPOLIS, IN; Owner: EMMIS RADIO LICENSE CORPORATION)
WXLW (950 AM; 5 kW; INDIANAPOLIS, IN)
WXNT (1430 AM; 5 kW; INDIANAPOLIS, IN; Owner: MYSTAR COMMUNICATIONS CORPORATION)
WBRI (1500 AM; daytime; 5 kW; INDIANAPOLIS, IN)
WNDE (1260 AM; 5 kW; INDIANAPOLIS, IN; Owner: CAPSTAR TX LIMITED PARTNERSHIP)
WTLC (1310 AM; 5 kW; INDIANAPOLIS, IN; Owner: RADIO ONE OF INDIANA, LLC)
WNTS (1590 AM; 5 kW; BEECH GROVE, IN; Owner: S + M BROADCASTING CO., INC.)
WOWO (1190 AM; 50 kW; FORT WAYNE, IN; Owner: PATHFINDER COMMUNICATIONS CORPORATION)
WLW (700 AM; 50 kW; CINCINNATI, OH; Owner: JACOR BROADCASTING CORPORATION)
WHAS (840 AM; 50 kW; LOUISVILLE, KY; Owner: CLEAR CHANNEL BROADCASTING LICENSES, INC.)
WIOU (1350 AM; 5 kW; KOKOMO, IN; Owner: MID-AMERICA RADIO GROUP, INC.)
WBAA (920 AM; 5 kW; WEST LAFAYETTE, IN; Owner: PURDUE UNIVERSITY)
WLS (890 AM; 50 kW; CHICAGO, IL; Owner: WLS, INC.)
Strongest FM radio stations in Zionsville:
WRZX (103.3 FM; INDIANAPOLIS, IN; Owner: CAPSTAR TX LIMITED PARTNERSHIP)
WFBQ (94.7 FM; INDIANAPOLIS, IN; Owner: CAPSTAR TX LIMITED PARTNERSHIP)
WTPI (107.9 FM; INDIANAPOLIS, IN; Owner: MYSTAR COMMUNICATIONS CORPORATION)
WFYI-FM (90.1 FM; INDIANAPOLIS, IN; Owner: METROPOLITAN IN. PUBLIC B/CING, INC.)
WYJZ (100.9 FM; LEBANON, IN; Owner: RADIO ONE OF INDIANA, LLC)
WHHH (96.3 FM; INDIANAPOLIS, IN; Owner: RADIO ONE OF INDIANA, LLC)
WNOU (93.1 FM; INDIANAPOLIS, IN; Owner: EMMIS RADIO LICENSE CORPORATION)
WFMS (95.5 FM; INDIANAPOLIS, IN; Owner: WFMS LICO, INC)
WYXB (105.7 FM; INDIANAPOLIS, IN; Owner: EMMIS RADIO LICENSE CORPORATION)
WZPL (99.5 FM; GREENFIELD, IN; Owner: MYSTAR COMMUNICATIONS CORPORATION)
WENS (97.1 FM; SHELBYVILLE, IN; Owner: EMMIS RADIO LICENSE CORPORATION)
WGLD (104.5 FM; INDIANAPOLIS, IN; Owner: INDY LICO, INC)
WGRL (93.9 FM; NOBLESVILLE, IN; Owner: INDY LICO, INC.)
WEDJ (107.1 FM; DANVILLE, IN; Owner: CONTINENTAL BROADCAST GROUP, LLC)
WIRE (91.1 FM; LEBANON, IN; Owner: HOOSIER BROADCASTING CORPORATION)
WKLU (101.9 FM; BROWNSBURG, IN; Owner: QUINN BROADCASTING, INC.)
WTTS (92.3 FM; BLOOMINGTON, IN; Owner: SARKES TARZIAN, INC.)
WRDZ-FM (98.3 FM; PLAINFIELD, IN; Owner: ABC, INC.)
WJEL (89.3 FM; INDIANAPOLIS, IN; Owner: MET. SCH. DIST. OF WASH. TWP.)
WTLC-FM (106.7 FM; GREENWOOD, IN; Owner: RADIO ONE OF INDIANA, LLC)
TV broadcast stations around Zionsville:
WTHR (Channel 13; INDIANAPOLIS, IN; Owner: VIDEOINDIANA, INC.)
WRTV (Channel 6; INDIANAPOLIS, IN; Owner: MCGRAW-HILL BROADCASTING COMPANY, INC.)
WHMB-TV (Channel 40; INDIANAPOLIS, IN; Owner: LESEA BROADCASTING CORPORATION)
WISH-TV (Channel 8; INDIANAPOLIS, IN; Owner: INDIANA BROADCASTING, LLC)
WALV-CA (Channel 50; INDIANAPOLIS, IN; Owner: VIDEOHIO, INC..)
WXIN (Channel 59; INDIANAPOLIS, IN; Owner: TRIBUNE TELEVISION COMPANY)
WFYI (Channel 20; INDIANAPOLIS, IN; Owner: METROPOLITAN INDIANAPOLIS PUBLIC BROADCASTING, INC.)
WBXI-CA (Channel 47; INDIANAPOLIS, IN; Owner: THE BOX WORLDWIDE LLC)
WIIH-CA (Channel 11; INDIANAPOLIS, IN; Owner: INDIANA BROADCASTING, LLC)
WTBU-TV (Channel 69; INDIANAPOLIS, IN; Owner: BUTLER UNIVERSITY)
WKOG-LP (Channel 31; INDIANAPOLIS, IN; Owner: KINGDOM OF GOD MINISTRIES, INC.)
WDNI-LP (Channel 65; INDIANAPOLIS, IN; Owner: RADIO ONE OF INDIANA, LLC)
WIPX-LP (Channel 51; INDIANAPOLIS, IN; Owner: PAXSON COMMUNICATIONS LICENSE COMPANY, LLC)
WNDY-TV (Channel 23; MARION, IN; Owner: UPN STATIONS GROUP INC.)
WTTK (Channel 29; KOKOMO, IN; Owner: TRIBUNE BROADCAST HOLDINGS, INC.)
WTTV (Channel 4; BLOOMINGTON, IN; Owner: TRIBUNE BROADCAST HOLDINGS, INC.)
WIPX (Channel 63; BLOOMINGTON, IN; Owner: PAXSON INDIANAPOLIS LICENSE, INC.)
WCLJ (Channel 42; BLOOMINGTON, IN; Owner: TRINITY BROADCASTING OF INDIANA, INC.)
WLFI-TV (Channel 18; LAFAYETTE, IN; Owner: PRIMELAND TELEVISION, INC.)
National Bridge Inventory (NBI) Statistics 102 Number of bridges846ft / 258m Total length $6,413,000 Total costs873,191 Total average daily traffic100,208 Total average daily truck traffic
New bridges - historical statistics
1 Before 1900 1 1900-1909 2 1920-1929 6 1930-1939 2 1940-1949 10 1950-1959 22 1960-1969 24 1970-1979 9 1980-1989 12 1990-1999 6 2000-2009 7 2010-2019
See full National Bridge Inventory statistics for Zionsville, IN
Home Mortgage Disclosure Act Aggregated Statistics For Year 2009(Based on 1 partial tract) A) FHA, FSA/RHS & VA B) Conventional C) Refinancings D) Home Improvement Loans F) Non-occupant Loans on Number Average Value Number Average Value Number Average Value Number Average Value Number Average Value
LOANS ORIGINATED 12 $203,352 53 $266,046 243 $260,918 6 $180,680 6 $161,048 APPLICATIONS APPROVED, NOT ACCEPTED 1 $187,070 4 $404,048 12 $296,193 1 $26,330 0 $0 APPLICATIONS DENIED 1 $216,630 4 $331,760 48 $286,551 1 $45,730 1 $182,910 APPLICATIONS WITHDRAWN 3 $198,463 5 $320,744 31 $248,979 1 $249,890 2 $166,745 FILES CLOSED FOR INCOMPLETENESS 0 $0 1 $419,870 5 $377,002 0 $0 0 $0
Aggregated Statistics For Year 2008(Based on 1 partial tract) A) FHA, FSA/RHS & VA B) Conventional C) Refinancings D) Home Improvement Loans F) Non-occupant Loans on G) Loans On Manufactured Number Average Value Number Average Value Number Average Value Number Average Value Number Average Value Number Average Value
LOANS ORIGINATED 8 $198,040 67 $295,595 96 $265,439 7 $75,554 8 $221,019 0 $0 APPLICATIONS APPROVED, NOT ACCEPTED 0 $0 6 $269,595 8 $253,352 3 $78,217 0 $0 0 $0 APPLICATIONS DENIED 3 $279,910 11 $249,468 24 $382,858 5 $46,282 1 $425,870 1 $46,190 APPLICATIONS WITHDRAWN 2 $196,540 7 $376,580 15 $219,649 0 $0 0 $0 0 $0 FILES CLOSED FOR INCOMPLETENESS 0 $0 1 $314,550 6 $487,843 0 $0 1 $838,350 0 $0
Aggregated Statistics For Year 2007(Based on 1 partial tract) A) FHA, FSA/RHS & VA B) Conventional C) Refinancings D) Home Improvement Loans F) Non-occupant Loans on Number Average Value Number Average Value Number Average Value Number Average Value Number Average Value
LOANS ORIGINATED 2 $257,510 115 $251,981 82 $265,761 13 $113,059 11 $189,127 APPLICATIONS APPROVED, NOT ACCEPTED 0 $0 15 $263,807 13 $382,915 6 $46,498 0 $0 APPLICATIONS DENIED 0 $0 6 $334,570 31 $267,306 5 $85,728 1 $251,740 APPLICATIONS WITHDRAWN 0 $0 18 $221,353 19 $299,141 1 $545,970 3 $258,357 FILES CLOSED FOR INCOMPLETENESS 0 $0 4 $266,978 6 $300,082 0 $0 1 $70,670
Aggregated Statistics For Year 2006(Based on 1 partial tract) A) FHA, FSA/RHS & VA B) Conventional C) Refinancings D) Home Improvement Loans F) Non-occupant Loans on Number Average Value Number Average Value Number Average Value Number Average Value Number Average Value
LOANS ORIGINATED 4 $256,122 182 $245,238 91 $229,498 11 $77,011 16 $187,041 APPLICATIONS APPROVED, NOT ACCEPTED 0 $0 30 $230,965 13 $192,435 5 $43,050 2 $158,665 APPLICATIONS DENIED 0 $0 20 $196,330 34 $204,594 6 $51,425 5 $202,404 APPLICATIONS WITHDRAWN 0 $0 19 $222,271 16 $269,808 2 $75,060 2 $266,055 FILES CLOSED FOR INCOMPLETENESS 0 $0 3 $172,133 11 $171,659 0 $0 0 $0
Aggregated Statistics For Year 2005(Based on 1 partial tract) A) FHA, FSA/RHS & VA B) Conventional C) Refinancings D) Home Improvement Loans F) Non-occupant Loans on Number Average Value Number Average Value Number Average Value Number Average Value Number Average Value
LOANS ORIGINATED 1 $230,030 127 $240,537 125 $244,674 12 $112,665 13 $171,720 APPLICATIONS APPROVED, NOT ACCEPTED 0 $0 10 $189,425 13 $325,071 0 $0 3 $149,347 APPLICATIONS DENIED 0 $0 13 $163,726 31 $276,857 4 $69,515 5 $120,648 APPLICATIONS WITHDRAWN 0 $0 12 $240,997 17 $258,392 4 $84,298 2 $185,685 FILES CLOSED FOR INCOMPLETENESS 0 $0 3 $134,103 13 $276,287 0 $0 1 $357,050
Aggregated Statistics For Year 2004(Based on 1 partial tract) A) FHA, FSA/RHS & VA B) Conventional C) Refinancings D) Home Improvement Loans F) Non-occupant Loans on Number Average Value Number Average Value Number Average Value Number Average Value Number Average Value
LOANS ORIGINATED 1 $225,410 158 $249,514 147 $223,651 9 $96,537 7 $169,979 APPLICATIONS APPROVED, NOT ACCEPTED 0 $0 13 $229,458 11 $264,291 2 $36,950 1 $127,020 APPLICATIONS DENIED 2 $123,095 9 $259,229 31 $243,213 6 $53,427 1 $64,670 APPLICATIONS WITHDRAWN 0 $0 13 $227,895 15 $209,579 1 $163,970 1 $237,880 FILES CLOSED FOR INCOMPLETENESS 0 $0 1 $268,830 9 $265,490 1 $53,120 0 $0
Aggregated Statistics For Year 2003(Based on 1 partial tract) A) FHA, FSA/RHS & VA B) Conventional C) Refinancings D) Home Improvement Loans F) Non-occupant Loans on Number Average Value Number Average Value Number Average Value Number Average Value Number Average Value
LOANS ORIGINATED 6 $143,652 182 $239,094 436 $225,333 11 $77,641 21 $136,766 APPLICATIONS APPROVED, NOT ACCEPTED 0 $0 16 $247,405 38 $222,466 3 $188,300 4 $135,105 APPLICATIONS DENIED 0 $0 12 $178,871 43 $245,613 4 $48,152 3 $185,377 APPLICATIONS WITHDRAWN 0 $0 12 $247,271 32 $275,408 0 $0 2 $135,105 FILES CLOSED FOR INCOMPLETENESS 0 $0 3 $219,093 7 $172,487 0 $0 0 $0
Aggregated Statistics For Year 2002(Based on 1 partial tract) A) FHA, FSA/RHS & VA B) Conventional C) Refinancings D) Home Improvement Loans F) Non-occupant Loans on Number Average Value Number Average Value Number Average Value Number Average Value Number Average Value
LOANS ORIGINATED 5 $137,092 138 $228,871 357 $225,423 12 $47,307 9 $119,889 APPLICATIONS APPROVED, NOT ACCEPTED 0 $0 17 $175,332 23 $207,273 2 $36,030 1 $141,800 APPLICATIONS DENIED 0 $0 5 $117,876 32 $258,534 3 $29,407 0 $0 APPLICATIONS WITHDRAWN 0 $0 12 $201,542 22 $175,900 0 $0 0 $0 FILES CLOSED FOR INCOMPLETENESS 0 $0 3 $245,270 11 $192,738 0 $0 1 $121,940
Aggregated Statistics For Year 2001(Based on 1 partial tract) A) FHA, FSA/RHS & VA B) Conventional C) Refinancings D) Home Improvement Loans F) Non-occupant Loans on Number Average Value Number Average Value Number Average Value Number Average Value Number Average Value
LOANS ORIGINATED 8 $163,109 136 $213,377 247 $198,290 14 $70,110 6 $116,938 APPLICATIONS APPROVED, NOT ACCEPTED 0 $0 8 $181,122 24 $181,411 7 $36,689 1 $184,760 APPLICATIONS DENIED 0 $0 8 $206,931 35 $177,501 5 $16,628 2 $79,215 APPLICATIONS WITHDRAWN 1 $151,500 8 $187,242 17 $181,391 2 $39,030 1 $137,650 FILES CLOSED FOR INCOMPLETENESS 1 $223,560 3 $131,950 11 $179,385 0 $0 1 $126,560
Aggregated Statistics For Year 2000(Based on 1 partial tract) A) FHA, FSA/RHS & VA B) Conventional C) Refinancings D) Home Improvement Loans F) Non-occupant Loans on Number Average Value Number Average Value Number Average Value Number Average Value Number Average Value
LOANS ORIGINATED 6 $126,483 138 $224,483 48 $151,484 15 $41,879 5 $81,480 APPLICATIONS APPROVED, NOT ACCEPTED 1 $181,060 16 $207,682 7 $169,187 6 $51,963 1 $223,100 APPLICATIONS DENIED 2 $163,745 11 $162,925 16 $142,236 5 $27,622 0 $0 APPLICATIONS WITHDRAWN 0 $0 9 $202,312 11 $134,119 1 $83,600 0 $0 FILES CLOSED FOR INCOMPLETENESS 0 $0 2 $163,050 7 $189,774 0 $0 0 $0
Aggregated Statistics For Year 1999(Based on 1 partial tract) A) FHA, FSA/RHS & VA B) Conventional C) Refinancings D) Home Improvement Loans F) Non-occupant Loans on Number Average Value Number Average Value Number Average Value Number Average Value Number Average Value
LOANS ORIGINATED 13 $122,679 129 $213,879 87 $159,490 13 $38,315 6 $144,663 APPLICATIONS APPROVED, NOT ACCEPTED 0 $0 11 $222,844 15 $136,669 3 $21,830 1 $184,480 APPLICATIONS DENIED 0 $0 13 $149,322 18 $121,167 6 $39,587 0 $0 APPLICATIONS WITHDRAWN 1 $104,230 7 $250,300 16 $113,945 0 $0 0 $0 FILES CLOSED FOR INCOMPLETENESS 0 $0 4 $245,472 6 $182,712 0 $0 0 $0
Detailed HMDA statistics for the following Tracts:
8106.02
Private Mortgage Insurance Companies Aggregated Statistics For Year 2009(Based on 1 partial tract) A) Conventional B) Refinancings Number Average Value Number Average Value
LOANS ORIGINATED 13 $255,822 5 $282,220 APPLICATIONS APPROVED, NOT ACCEPTED 1 $454,510 3 $345,657 APPLICATIONS DENIED 0 $0 0 $0 APPLICATIONS WITHDRAWN 0 $0 1 $284,990 FILES CLOSED FOR INCOMPLETENESS 0 $0 0 $0
Aggregated Statistics For Year 2008(Based on 1 partial tract) A) Conventional B) Refinancings Number Average Value Number Average Value
LOANS ORIGINATED 11 $244,681 4 $276,332 APPLICATIONS APPROVED, NOT ACCEPTED 3 $345,657 2 $325,180 APPLICATIONS DENIED 1 $287,760 0 $0 APPLICATIONS WITHDRAWN 0 $0 0 $0 FILES CLOSED FOR INCOMPLETENESS 0 $0 0 $0
Aggregated Statistics For Year 2007(Based on 1 partial tract) A) Conventional B) Refinancings C) Non-occupant Loans on Number Average Value Number Average Value Number Average Value
LOANS ORIGINATED 13 $234,005 6 $270,058 1 $201,390 APPLICATIONS APPROVED, NOT ACCEPTED 2 $238,800 1 $159,360 0 $0 APPLICATIONS DENIED 0 $0 0 $0 0 $0 APPLICATIONS WITHDRAWN 0 $0 0 $0 0 $0 FILES CLOSED FOR INCOMPLETENESS 0 $0 0 $0 0 $0
Aggregated Statistics For Year 2006(Based on 1 partial tract) A) Conventional B) Refinancings C) Non-occupant Loans on Number Average Value Number Average Value Number Average Value
LOANS ORIGINATED 13 $283,785 5 $253,306 1 $191,690 APPLICATIONS APPROVED, NOT ACCEPTED 1 $323,330 3 $276,370 0 $0 APPLICATIONS DENIED 0 $0 0 $0 0 $0 APPLICATIONS WITHDRAWN 0 $0 0 $0 0 $0 FILES CLOSED FOR INCOMPLETENESS 0 $0 0 $0 0 $0
Aggregated Statistics For Year 2005(Based on 1 partial tract) A) Conventional B) Refinancings C) Non-occupant Loans on Number Average Value Number Average Value Number Average Value
LOANS ORIGINATED 9 $215,399 6 $204,390 1 $128,410 APPLICATIONS APPROVED, NOT ACCEPTED 0 $0 3 $224,177 0 $0 APPLICATIONS DENIED 0 $0 0 $0 0 $0 APPLICATIONS WITHDRAWN 0 $0 1 $218,940 0 $0 FILES CLOSED FOR INCOMPLETENESS 0 $0 0 $0 0 $0
Aggregated Statistics For Year 2004(Based on 1 partial tract) A) Conventional B) Refinancings Number Average Value Number Average Value
LOANS ORIGINATED 9 $244,346 7 $291,789 APPLICATIONS APPROVED, NOT ACCEPTED 1 $180,140 1 $273,910 APPLICATIONS DENIED 0 $0 0 $0 APPLICATIONS WITHDRAWN 1 $189,840 1 $151,970 FILES CLOSED FOR INCOMPLETENESS 0 $0 0 $0
Aggregated Statistics For Year 2003(Based on 1 partial tract) A) Conventional B) Refinancings C) Non-occupant Loans on Number Average Value Number Average Value Number Average Value
LOANS ORIGINATED 19 $218,114 12 $219,210 4 $146,308 APPLICATIONS APPROVED, NOT ACCEPTED 4 $231,758 3 $202,927 1 $189,840 APPLICATIONS DENIED 0 $0 0 $0 0 $0 APPLICATIONS WITHDRAWN 1 $272,980 1 $567,680 0 $0 FILES CLOSED FOR INCOMPLETENESS 0 $0 0 $0 0 $0
Aggregated Statistics For Year 2002(Based on 1 partial tract) A) Conventional B) Refinancings C) Non-occupant Loans on Number Average Value Number Average Value Number Average Value
LOANS ORIGINATED 20 $227,301 17 $203,127 1 $121,940 APPLICATIONS APPROVED, NOT ACCEPTED 1 $201,850 5 $243,422 0 $0 APPLICATIONS DENIED 0 $0 0 $0 0 $0 APPLICATIONS WITHDRAWN 2 $143,420 0 $0 1 $78,980 FILES CLOSED FOR INCOMPLETENESS 0 $0 0 $0 0 $0
Aggregated Statistics For Year 2001(Based on 1 partial tract) A) Conventional B) Refinancings Number Average Value Number Average Value
LOANS ORIGINATED 20 $231,620 15 $196,585 APPLICATIONS APPROVED, NOT ACCEPTED 3 $161,973 3 $200,620 APPLICATIONS DENIED 0 $0 0 $0 APPLICATIONS WITHDRAWN 0 $0 0 $0 FILES CLOSED FOR INCOMPLETENESS 0 $0 0 $0
Aggregated Statistics For Year 2000(Based on 1 partial tract) A) Conventional B) Refinancings Number Average Value Number Average Value
LOANS ORIGINATED 30 $223,868 1 $159,360 APPLICATIONS APPROVED, NOT ACCEPTED 6 $197,000 1 $257,280 APPLICATIONS DENIED 1 $162,130 0 $0 APPLICATIONS WITHDRAWN 0 $0 0 $0 FILES CLOSED FOR INCOMPLETENESS 0 $0 0 $0
Aggregated Statistics For Year 1999(Based on 1 partial tract) A) Conventional B) Refinancings Number Average Value Number Average Value
LOANS ORIGINATED 44 $184,092 8 $224,489 APPLICATIONS APPROVED, NOT ACCEPTED 6 $181,790 2 $106,535 APPLICATIONS DENIED 1 $222,760 1 $216,760 APPLICATIONS WITHDRAWN 2 $169,260 0 $0 FILES CLOSED FOR INCOMPLETENESS 0 $0 0 $0
Detailed PMIC statistics for the following Tracts:
8106.02
Most common first names in Zionsville, IN among deceased individuals Name Count Lived (average)
Mary 93 81.3 years Robert 68 74.0 years William 50 78.5 years James 50 75.9 years Charles 50 74.8 years John 49 75.0 years George 38 79.6 years Helen 35 86.2 years Dorothy 32 83.6 years Ruth 31 85.4 years
Most common last names in Zionsville, IN among deceased individuals Last name Count Lived (average)
Smith 48 80.2 years Moore 21 80.5 years Miller 20 80.0 years Martin 19 76.6 years Johnson 18 84.2 years Jones 14 81.1 years Reynolds 13 73.9 years Brown 13 77.6 years Wilson 12 77.6 years Harvey 12 87.2 years
Zionsville compared to Indiana state average:
Median household income significantly above state average. Median house value significantly above state average. Unemployed percentage significantly below state average. Foreign-born population percentage significantly above state average. Number of rooms per house significantly above state average. House age significantly below state average. Percentage of population with a bachelor's degree or higher significantly above state average. Zionsville on our top lists :
#27 on the list of "Top 101 cities with the largest percentage population increase from 2000 (population 5,000+)"
#83 on the list of "Top 101 cities with largest percentage of males in occupations: health diagnosing and treating practitioners and other technical occupations (population 5,000+)"
#53 on the list of "Top 101 counties with the highest Ozone (1-hour) air pollution readings in 2012 (ppm)"
Top Patent Applicants
Ghassan S. Kassab (122)
Peter J. Lynch (67)
Ronald Ross, Jr. (45)
Kenneth Narva (39)
Thomas L. Siddall (38)
Holger Tank (37)
Thomas Meade (33)
Qiang Yang (31)
Kang N. Lee (31)
Patrick B. Jonte (28)
Total of 1568 patent applications in 2008-2024.


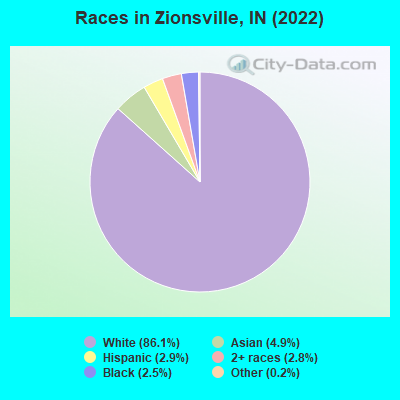
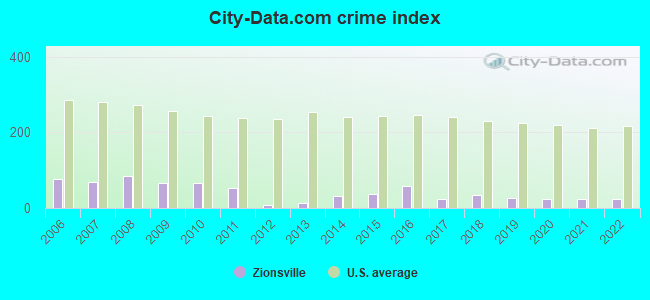
 Recent articles from our blog. Our writers, many of them Ph.D. graduates or candidates, create easy-to-read articles on a wide variety of topics.

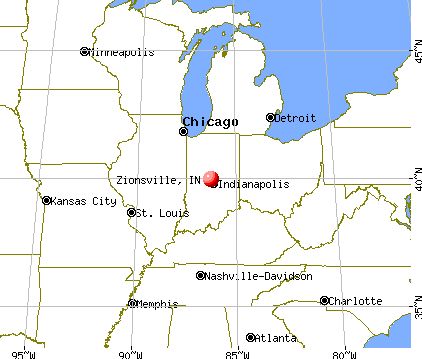
 (12.9 miles
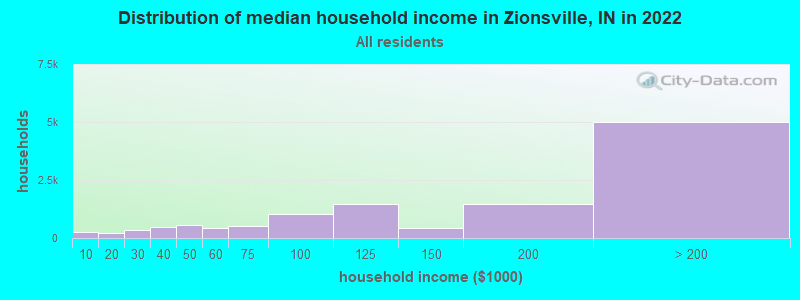
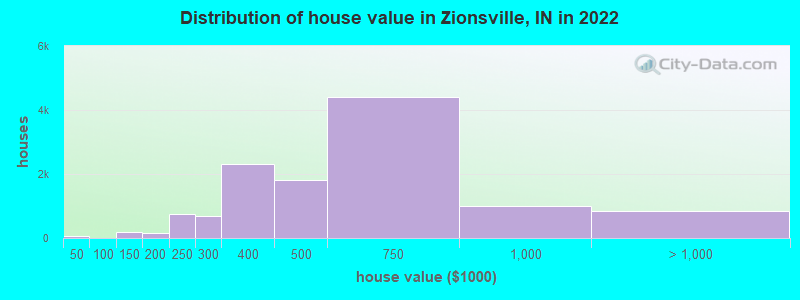
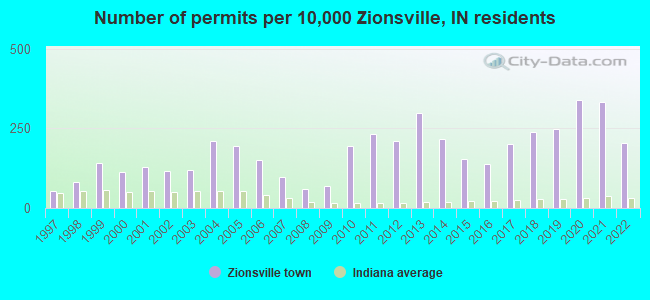
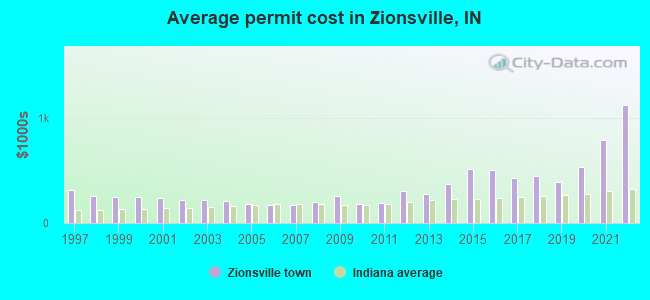
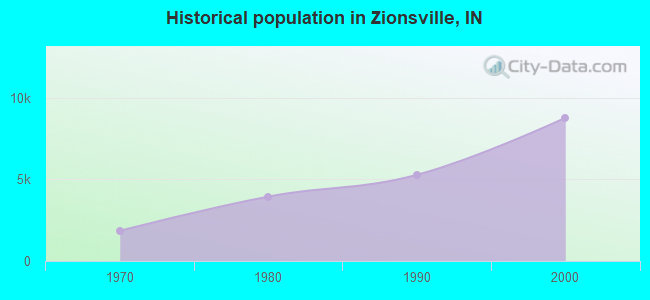
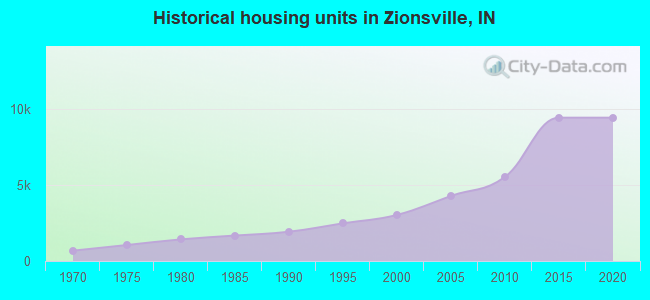
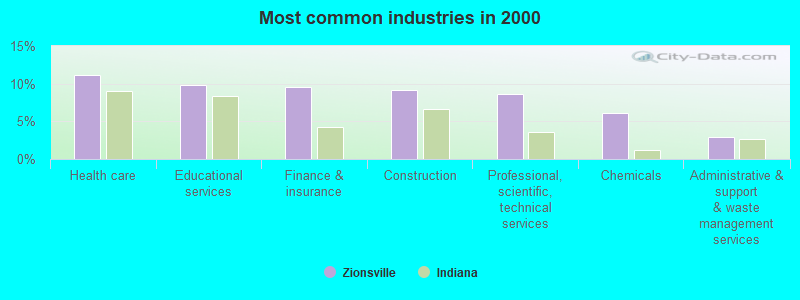
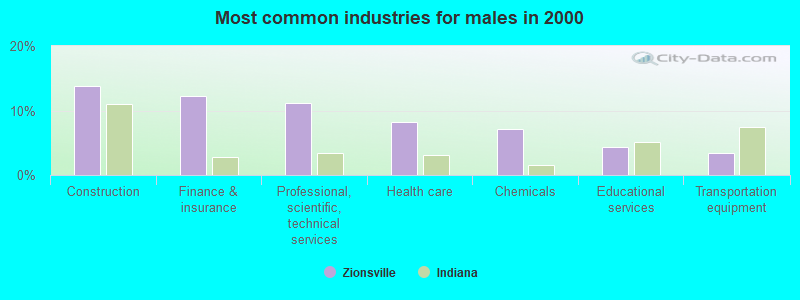
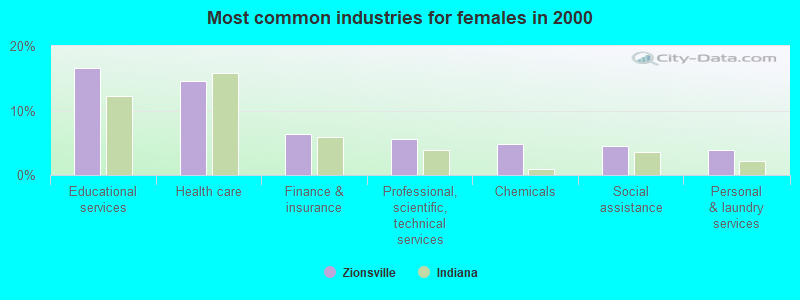
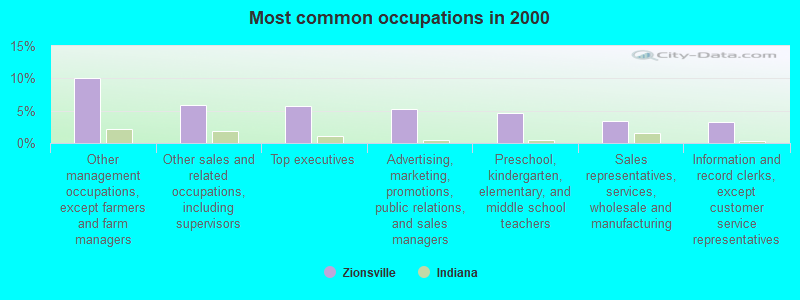
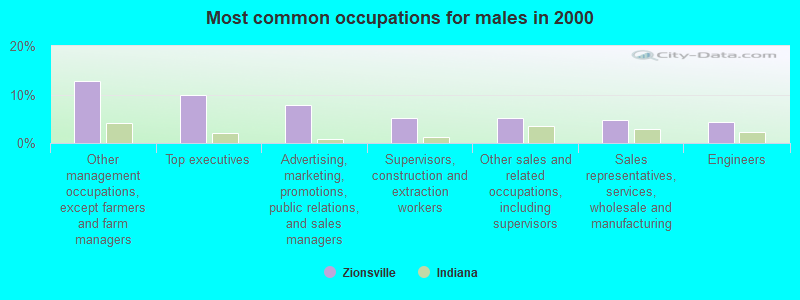
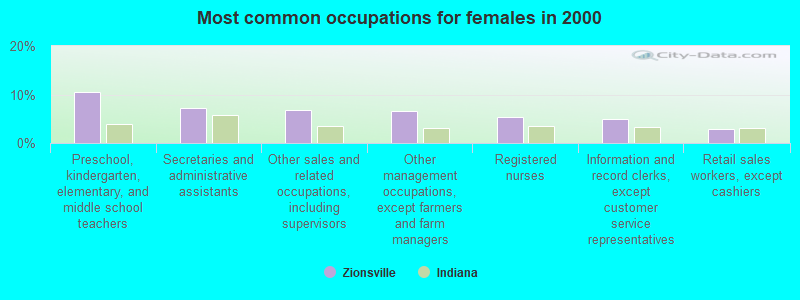
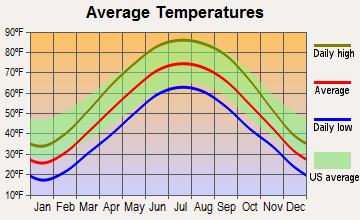
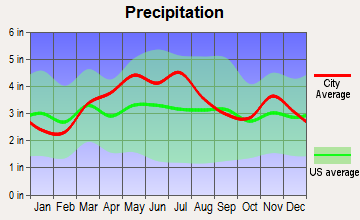
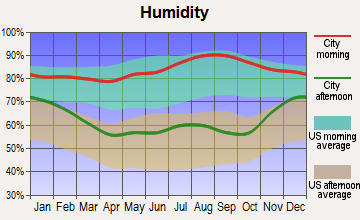
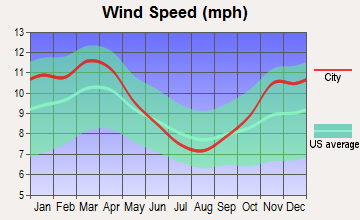
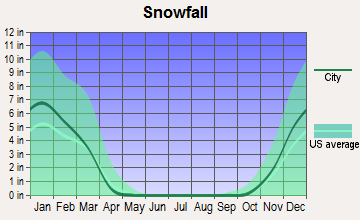
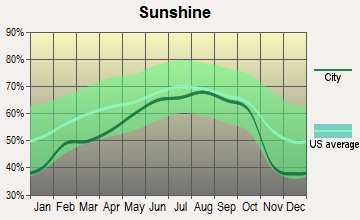
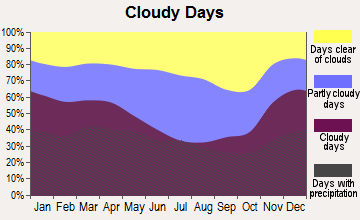
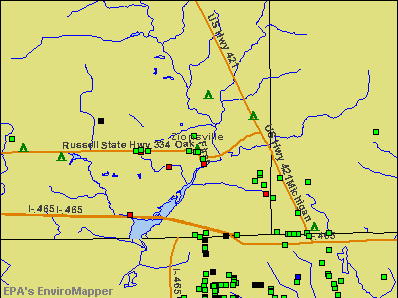

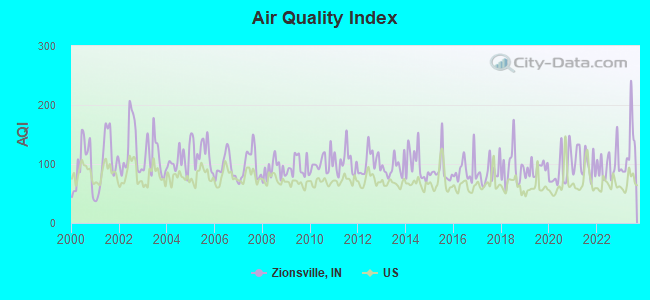
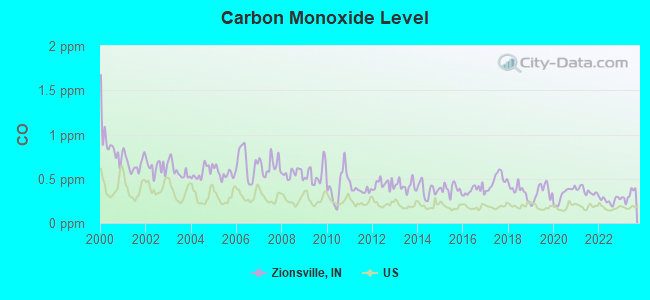
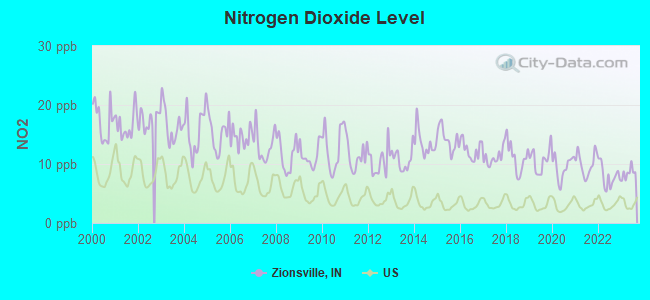
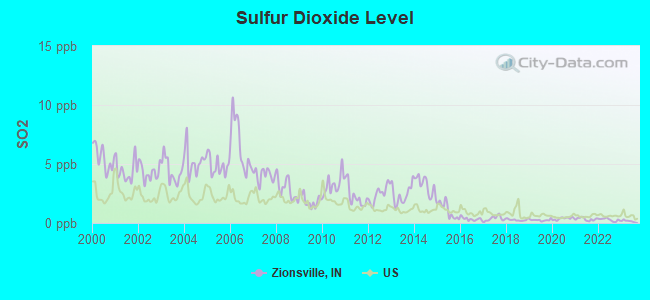
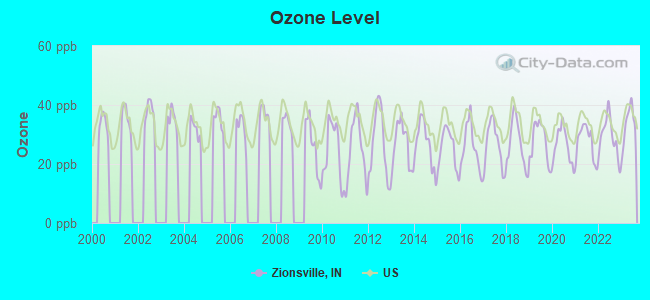
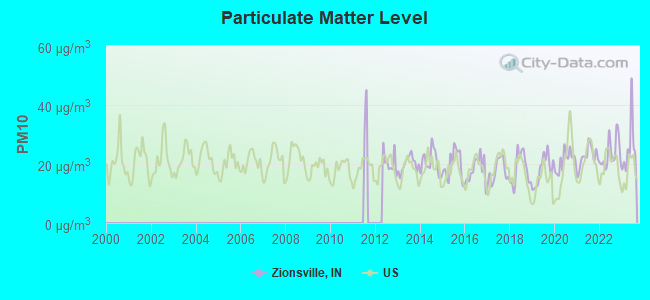
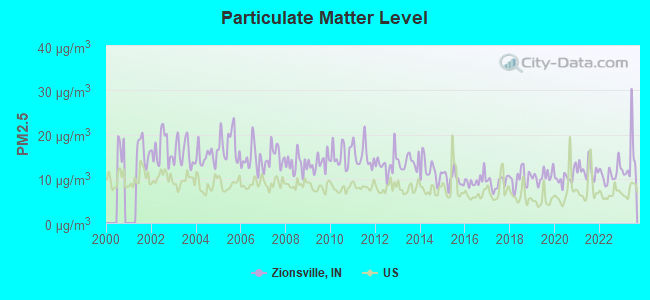
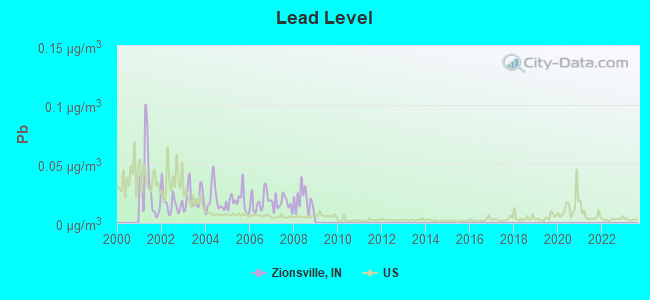

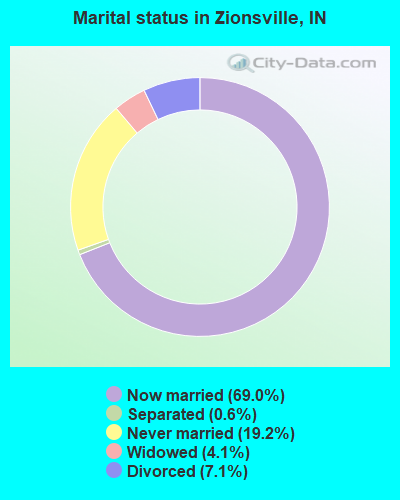
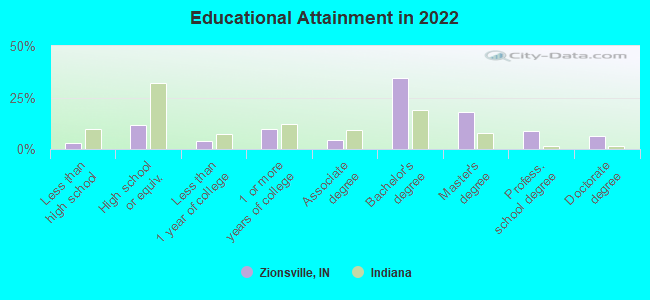
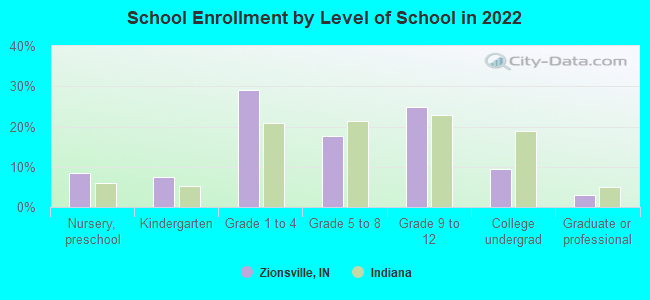
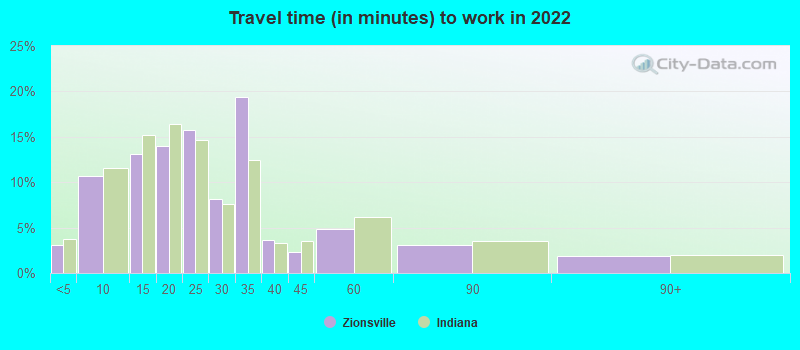
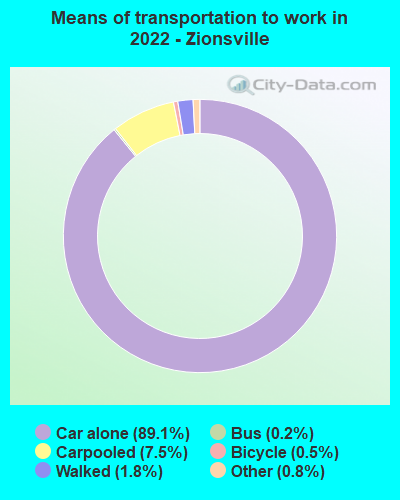
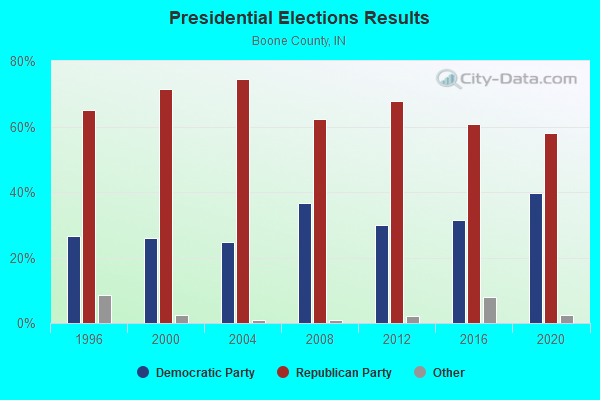
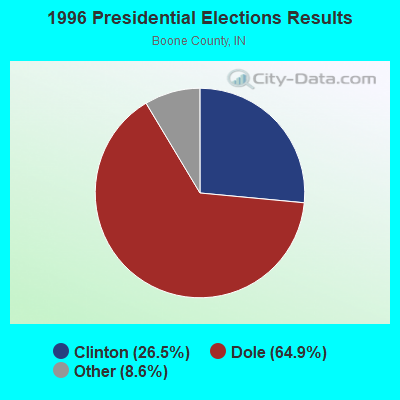
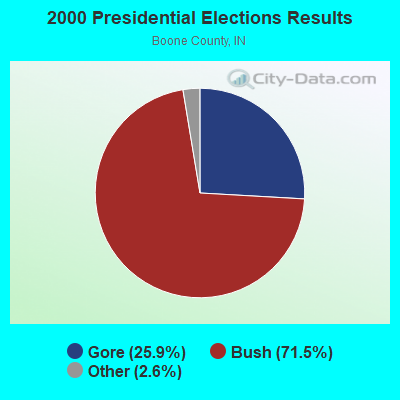
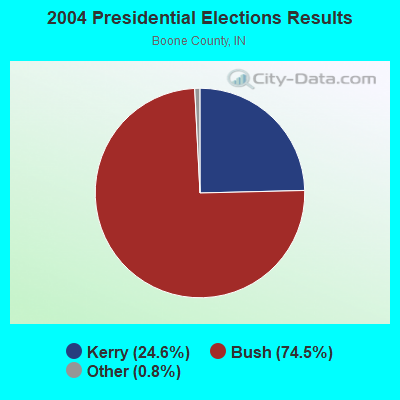
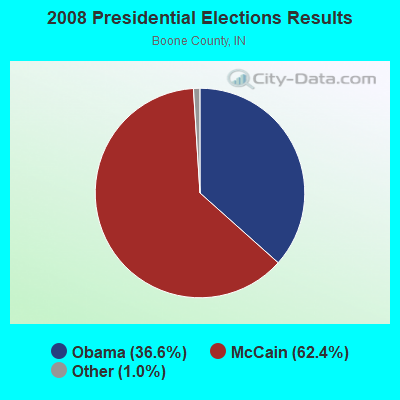
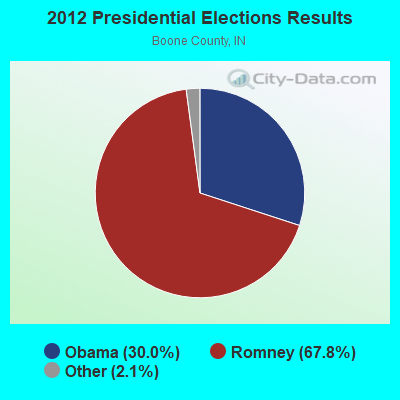
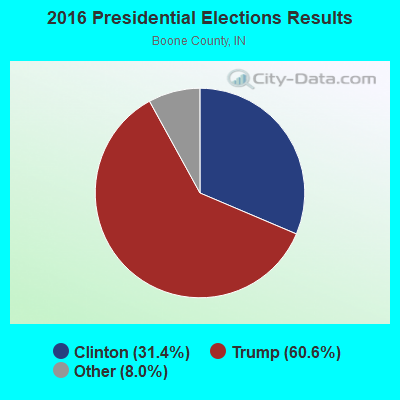
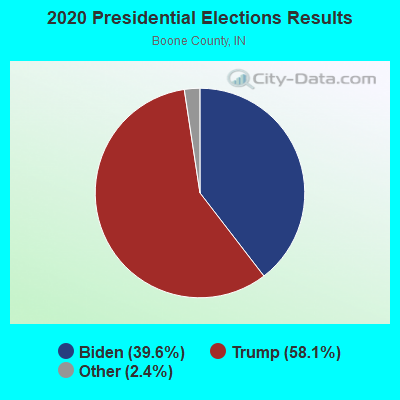
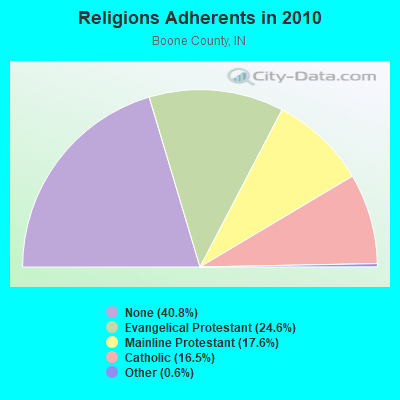
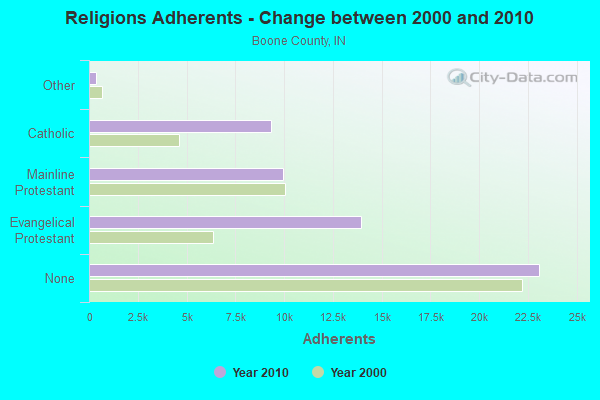
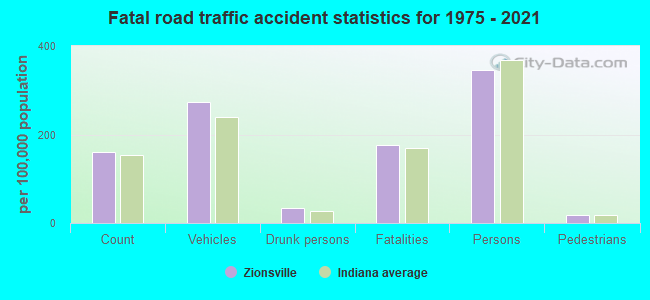
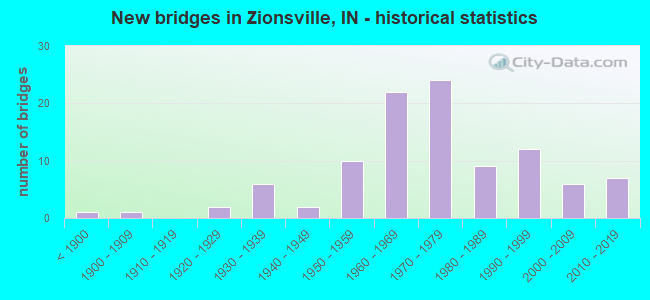
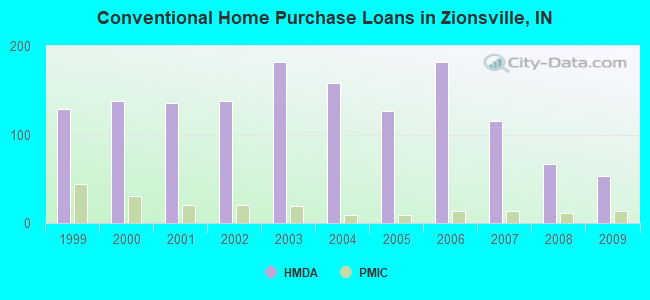
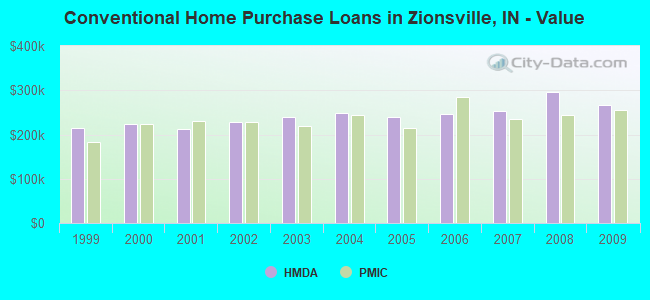
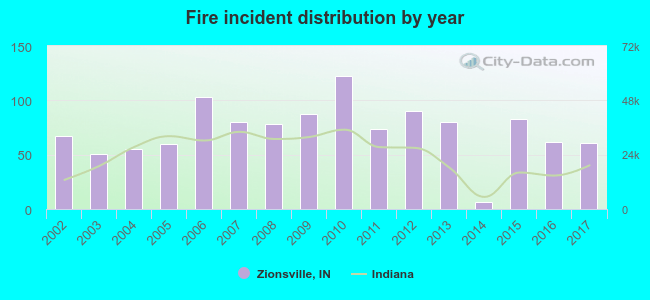 Based on the data from the years 2002 - 2017 the average number of fire incidents per year is 72. The highest number of reported fire incidents - 122 took place in 2010, and the least - 6 in 2014. The data has a dropping trend.
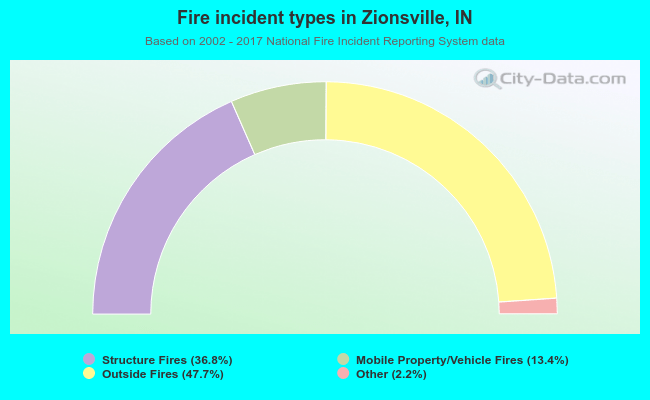 When looking into fire subcategories, the most reports belonged to: Outside Fires (47.7%), and Structure Fires (36.8%).