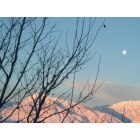
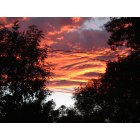
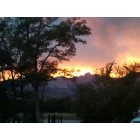
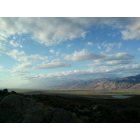
Bishop, California Submit your own pictures of this city and show them to the world
OSM Map
General Map
Google Map
MSN Map
OSM Map
General Map
Google Map
MSN Map
OSM Map
General Map
Google Map
MSN Map
OSM Map
General Map
Google Map
MSN Map
Please wait while loading the map...
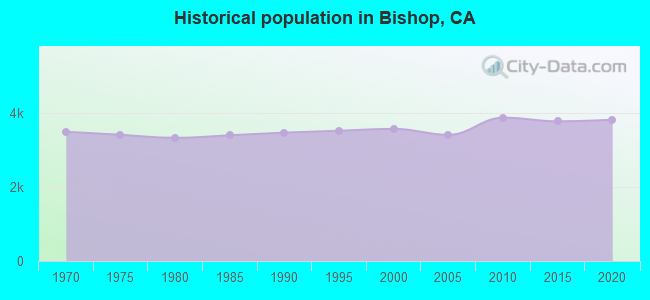
Population in 2022: 3,771 (99% urban, 1% rural). Population change since 2000: +5.5%Males: 1,546 Females: 2,225
March 2022 cost of living index in Bishop: 96.7 (near average, U.S. average is 100) Percentage of residents living in poverty in 2022: 7.3%for White Non-Hispanic residents , 5.1% for Hispanic or Latino residents , 6.7% for two or more races residents )
Profiles of local businesses
Business Search - 14 Million verified businesses
Data:
Median household income ($)
Median household income (% change since 2000)
Household income diversity
Ratio of average income to average house value (%)
Ratio of average income to average rent
Median household income ($) - White
Median household income ($) - Black or African American
Median household income ($) - Asian
Median household income ($) - Hispanic or Latino
Median household income ($) - American Indian and Alaska Native
Median household income ($) - Multirace
Median household income ($) - Other Race
Median household income for houses/condos with a mortgage ($)
Median household income for apartments without a mortgage ($)
Races - White alone (%)
Races - White alone (% change since 2000)
Races - Black alone (%)
Races - Black alone (% change since 2000)
Races - American Indian alone (%)
Races - American Indian alone (% change since 2000)
Races - Asian alone (%)
Races - Asian alone (% change since 2000)
Races - Hispanic (%)
Races - Hispanic (% change since 2000)
Races - Native Hawaiian and Other Pacific Islander alone (%)
Races - Native Hawaiian and Other Pacific Islander alone (% change since 2000)
Races - Two or more races (%)
Races - Two or more races (% change since 2000)
Races - Other race alone (%)
Races - Other race alone (% change since 2000)
Racial diversity
Unemployment (%)
Unemployment (% change since 2000)
Unemployment (%) - White
Unemployment (%) - Black or African American
Unemployment (%) - Asian
Unemployment (%) - Hispanic or Latino
Unemployment (%) - American Indian and Alaska Native
Unemployment (%) - Multirace
Unemployment (%) - Other Race
Population density (people per square mile)
Population - Males (%)
Population - Females (%)
Population - Males (%) - White
Population - Males (%) - Black or African American
Population - Males (%) - Asian
Population - Males (%) - Hispanic or Latino
Population - Males (%) - American Indian and Alaska Native
Population - Males (%) - Multirace
Population - Males (%) - Other Race
Population - Females (%) - White
Population - Females (%) - Black or African American
Population - Females (%) - Asian
Population - Females (%) - Hispanic or Latino
Population - Females (%) - American Indian and Alaska Native
Population - Females (%) - Multirace
Population - Females (%) - Other Race
Coronavirus confirmed cases (Apr 26, 2024)
Deaths caused by coronavirus (Apr 26, 2024)
Coronavirus confirmed cases (per 100k population) (Apr 26, 2024)
Deaths caused by coronavirus (per 100k population) (Apr 26, 2024)
Daily increase in number of cases (Apr 26, 2024)
Weekly increase in number of cases (Apr 26, 2024)
Cases doubled (in days) (Apr 26, 2024)
Hospitalized patients (Apr 18, 2022)
Negative test results (Apr 18, 2022)
Total test results (Apr 18, 2022)
COVID Vaccine doses distributed (per 100k population) (Sep 19, 2023)
COVID Vaccine doses administered (per 100k population) (Sep 19, 2023)
COVID Vaccine doses distributed (Sep 19, 2023)
COVID Vaccine doses administered (Sep 19, 2023)
Likely homosexual households (%)
Likely homosexual households (% change since 2000)
Likely homosexual households - Lesbian couples (%)
Likely homosexual households - Lesbian couples (% change since 2000)
Likely homosexual households - Gay men (%)
Likely homosexual households - Gay men (% change since 2000)
Cost of living index
Median gross rent ($)
Median contract rent ($)
Median monthly housing costs ($)
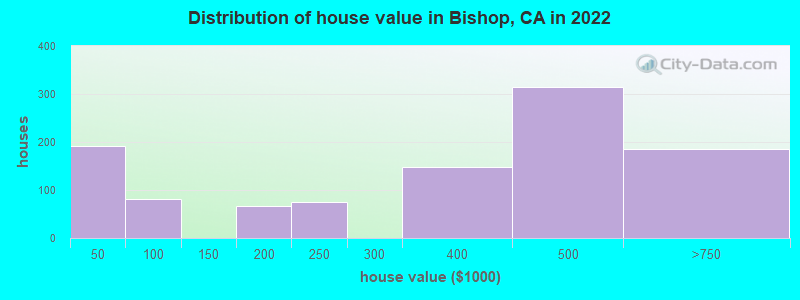
Median house or condo value ($)
Median house or condo value ($ change since 2000)
Mean house or condo value by units in structure - 1, detached ($)
Mean house or condo value by units in structure - 1, attached ($)
Mean house or condo value by units in structure - 2 ($)
Mean house or condo value by units in structure by units in structure - 3 or 4 ($)
Mean house or condo value by units in structure - 5 or more ($)
Mean house or condo value by units in structure - Boat, RV, van, etc. ($)
Mean house or condo value by units in structure - Mobile home ($)
Median house or condo value ($) - White
Median house or condo value ($) - Black or African American
Median house or condo value ($) - Asian
Median house or condo value ($) - Hispanic or Latino
Median house or condo value ($) - American Indian and Alaska Native
Median house or condo value ($) - Multirace
Median house or condo value ($) - Other Race
Median resident age
Resident age diversity
Median resident age - Males
Median resident age - Females
Median resident age - White
Median resident age - Black or African American
Median resident age - Asian
Median resident age - Hispanic or Latino
Median resident age - American Indian and Alaska Native
Median resident age - Multirace
Median resident age - Other Race
Median resident age - Males - White
Median resident age - Males - Black or African American
Median resident age - Males - Asian
Median resident age - Males - Hispanic or Latino
Median resident age - Males - American Indian and Alaska Native
Median resident age - Males - Multirace
Median resident age - Males - Other Race
Median resident age - Females - White
Median resident age - Females - Black or African American
Median resident age - Females - Asian
Median resident age - Females - Hispanic or Latino
Median resident age - Females - American Indian and Alaska Native
Median resident age - Females - Multirace
Median resident age - Females - Other Race
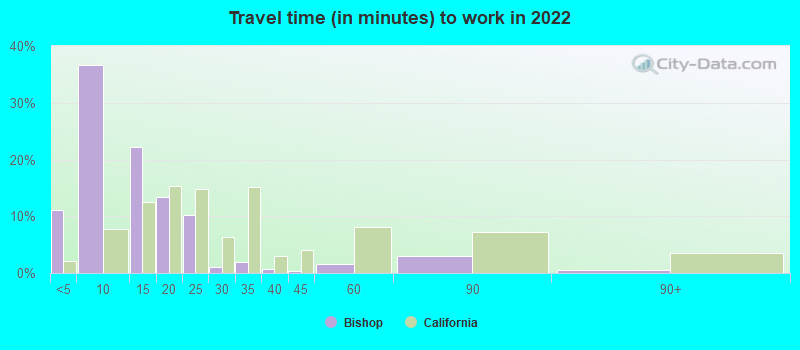
Commute - mean travel time to work (minutes)
Travel time to work - Less than 5 minutes (%)
Travel time to work - Less than 5 minutes (% change since 2000)
Travel time to work - 5 to 9 minutes (%)
Travel time to work - 5 to 9 minutes (% change since 2000)
Travel time to work - 10 to 19 minutes (%)
Travel time to work - 10 to 19 minutes (% change since 2000)
Travel time to work - 20 to 29 minutes (%)
Travel time to work - 20 to 29 minutes (% change since 2000)
Travel time to work - 30 to 39 minutes (%)
Travel time to work - 30 to 39 minutes (% change since 2000)
Travel time to work - 40 to 59 minutes (%)
Travel time to work - 40 to 59 minutes (% change since 2000)
Travel time to work - 60 to 89 minutes (%)
Travel time to work - 60 to 89 minutes (% change since 2000)
Travel time to work - 90 or more minutes (%)
Travel time to work - 90 or more minutes (% change since 2000)
Marital status - Never married (%)
Marital status - Now married (%)
Marital status - Separated (%)
Marital status - Widowed (%)
Marital status - Divorced (%)
Median family income ($)
Median family income (% change since 2000)
Median non-family income ($)
Median non-family income (% change since 2000)
Median per capita income ($)
Median per capita income (% change since 2000)
Median family income ($) - White
Median family income ($) - Black or African American
Median family income ($) - Asian
Median family income ($) - Hispanic or Latino
Median family income ($) - American Indian and Alaska Native
Median family income ($) - Multirace
Median family income ($) - Other Race
Median year house/condo built
Median year apartment built
Year house built - Built 2005 or later (%)
Year house built - Built 2000 to 2004 (%)
Year house built - Built 1990 to 1999 (%)
Year house built - Built 1980 to 1989 (%)
Year house built - Built 1970 to 1979 (%)
Year house built - Built 1960 to 1969 (%)
Year house built - Built 1950 to 1959 (%)
Year house built - Built 1940 to 1949 (%)
Year house built - Built 1939 or earlier (%)
Average household size
Household density (households per square mile)
Average household size - White
Average household size - Black or African American
Average household size - Asian
Average household size - Hispanic or Latino
Average household size - American Indian and Alaska Native
Average household size - Multirace
Average household size - Other Race
Occupied housing units (%)
Vacant housing units (%)
Owner occupied housing units (%)
Renter occupied housing units (%)
Vacancy status - For rent (%)
Vacancy status - For sale only (%)
Vacancy status - Rented or sold, not occupied (%)
Vacancy status - For seasonal, recreational, or occasional use (%)
Vacancy status - For migrant workers (%)
Vacancy status - Other vacant (%)
Residents with income below the poverty level (%)
Residents with income below 50% of the poverty level (%)
Children below poverty level (%)
Poor families by family type - Married-couple family (%)
Poor families by family type - Male, no wife present (%)
Poor families by family type - Female, no husband present (%)
Poverty status for native-born residents (%)
Poverty status for foreign-born residents (%)
Poverty among high school graduates not in families (%)
Poverty among people who did not graduate high school not in families (%)
Residents with income below the poverty level (%) - White
Residents with income below the poverty level (%) - Black or African American
Residents with income below the poverty level (%) - Asian
Residents with income below the poverty level (%) - Hispanic or Latino
Residents with income below the poverty level (%) - American Indian and Alaska Native
Residents with income below the poverty level (%) - Multirace
Residents with income below the poverty level (%) - Other Race
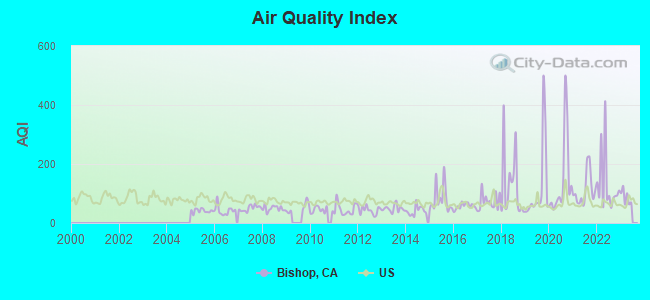
Air pollution - Air Quality Index (AQI)
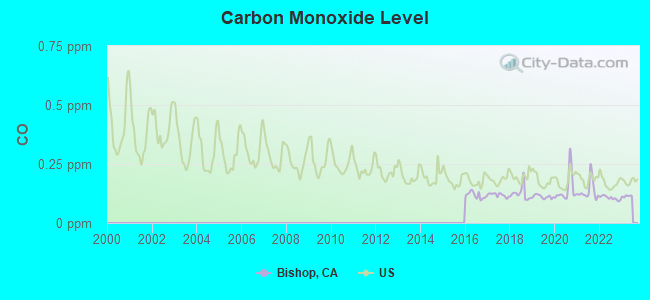
Air pollution - CO
Air pollution - NO2
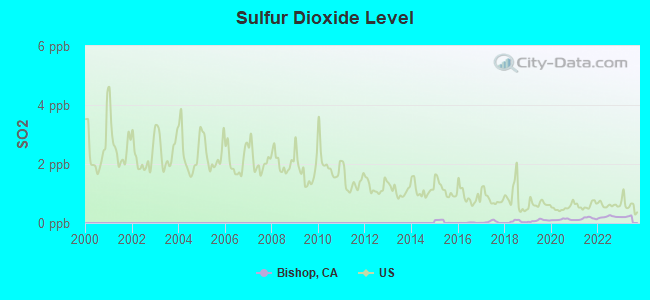
Air pollution - SO2
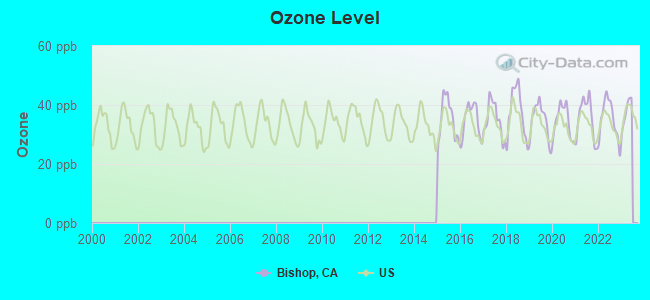
Air pollution - Ozone
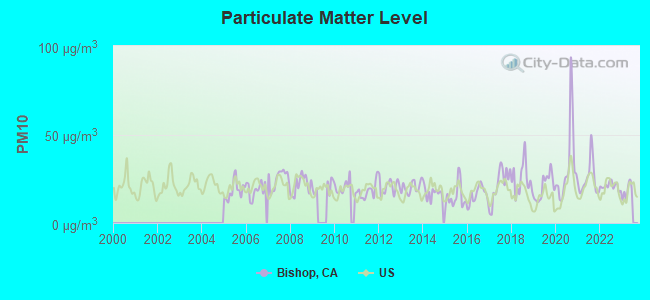
Air pollution - PM10
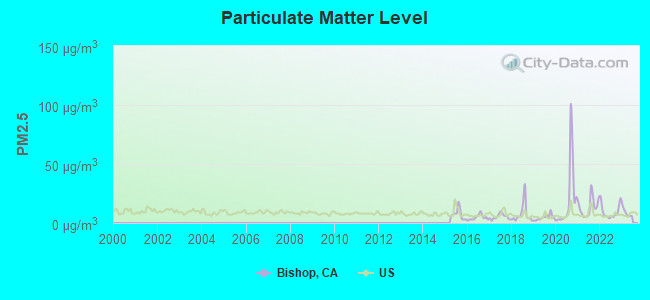
Air pollution - PM25
Air pollution - Pb
Crime - Murders per 100,000 population
Crime - Rapes per 100,000 population
Crime - Robberies per 100,000 population
Crime - Assaults per 100,000 population
Crime - Burglaries per 100,000 population
Crime - Thefts per 100,000 population
Crime - Auto thefts per 100,000 population
Crime - Arson per 100,000 population
Crime - City-data.com crime index
Crime - Violent crime index
Crime - Property crime index
Crime - Murders per 100,000 population (5 year average)
Crime - Rapes per 100,000 population (5 year average)
Crime - Robberies per 100,000 population (5 year average)
Crime - Assaults per 100,000 population (5 year average)
Crime - Burglaries per 100,000 population (5 year average)
Crime - Thefts per 100,000 population (5 year average)
Crime - Auto thefts per 100,000 population (5 year average)
Crime - Arson per 100,000 population (5 year average)
Crime - City-data.com crime index (5 year average)
Crime - Violent crime index (5 year average)
Crime - Property crime index (5 year average)
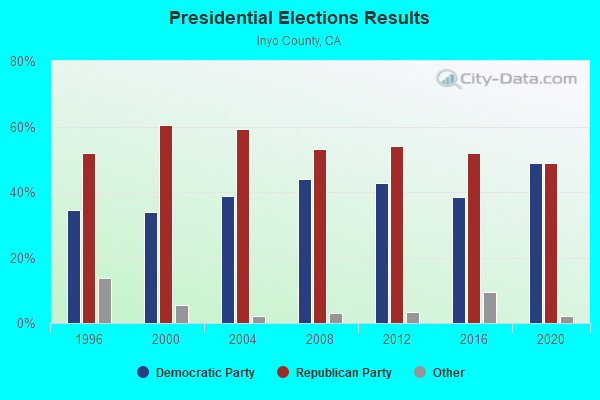
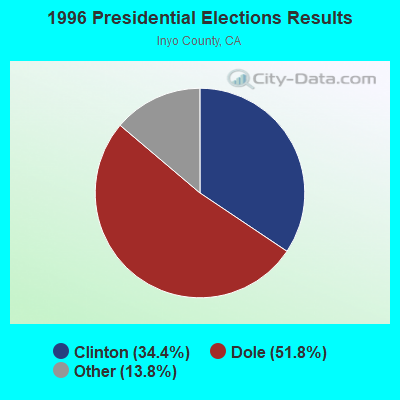
1996 Presidential Elections Results (%) - Democratic Party (Clinton)
1996 Presidential Elections Results (%) - Republican Party (Dole)
1996 Presidential Elections Results (%) - Other
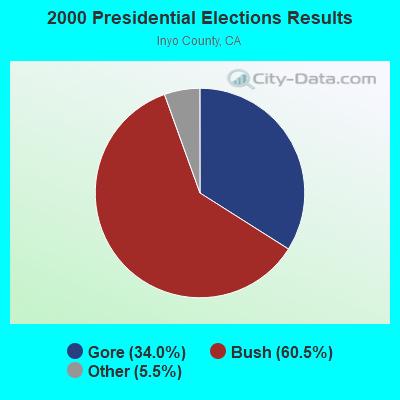
2000 Presidential Elections Results (%) - Democratic Party (Gore)
2000 Presidential Elections Results (%) - Republican Party (Bush)
2000 Presidential Elections Results (%) - Other
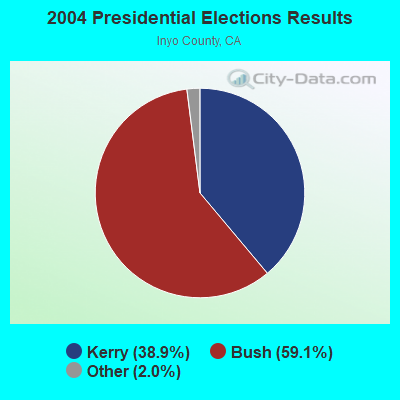
2004 Presidential Elections Results (%) - Democratic Party (Kerry)
2004 Presidential Elections Results (%) - Republican Party (Bush)
2004 Presidential Elections Results (%) - Other
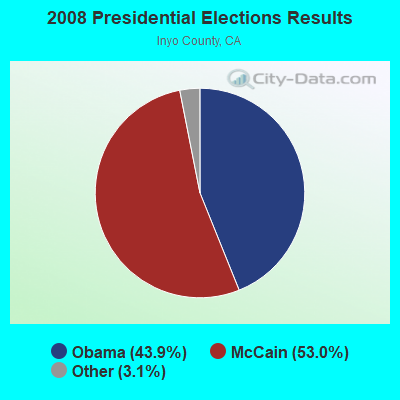
2008 Presidential Elections Results (%) - Democratic Party (Obama)
2008 Presidential Elections Results (%) - Republican Party (McCain)
2008 Presidential Elections Results (%) - Other
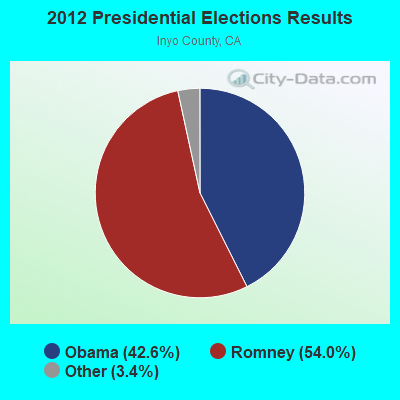
2012 Presidential Elections Results (%) - Democratic Party (Obama)
2012 Presidential Elections Results (%) - Republican Party (Romney)
2012 Presidential Elections Results (%) - Other
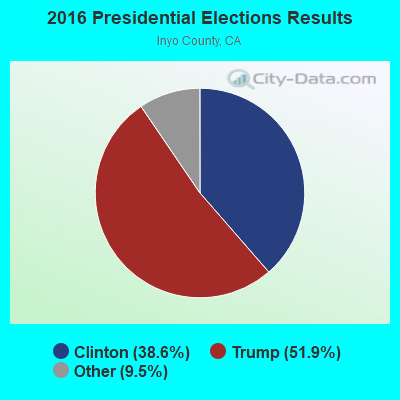
2016 Presidential Elections Results (%) - Democratic Party (Clinton)
2016 Presidential Elections Results (%) - Republican Party (Trump)
2016 Presidential Elections Results (%) - Other
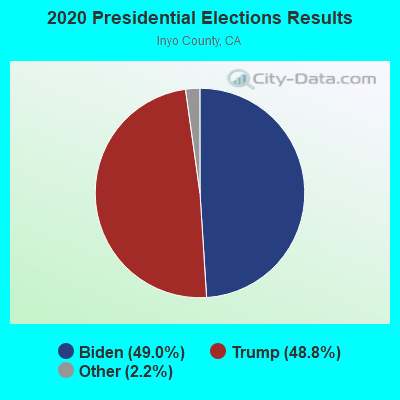
2020 Presidential Elections Results (%) - Democratic Party (Biden)
2020 Presidential Elections Results (%) - Republican Party (Trump)
2020 Presidential Elections Results (%) - Other
Ancestries Reported - Arab (%)
Ancestries Reported - Czech (%)
Ancestries Reported - Danish (%)
Ancestries Reported - Dutch (%)
Ancestries Reported - English (%)
Ancestries Reported - French (%)
Ancestries Reported - French Canadian (%)
Ancestries Reported - German (%)
Ancestries Reported - Greek (%)
Ancestries Reported - Hungarian (%)
Ancestries Reported - Irish (%)
Ancestries Reported - Italian (%)
Ancestries Reported - Lithuanian (%)
Ancestries Reported - Norwegian (%)
Ancestries Reported - Polish (%)
Ancestries Reported - Portuguese (%)
Ancestries Reported - Russian (%)
Ancestries Reported - Scotch-Irish (%)
Ancestries Reported - Scottish (%)
Ancestries Reported - Slovak (%)
Ancestries Reported - Subsaharan African (%)
Ancestries Reported - Swedish (%)
Ancestries Reported - Swiss (%)
Ancestries Reported - Ukrainian (%)
Ancestries Reported - United States (%)
Ancestries Reported - Welsh (%)
Ancestries Reported - West Indian (%)
Ancestries Reported - Other (%)
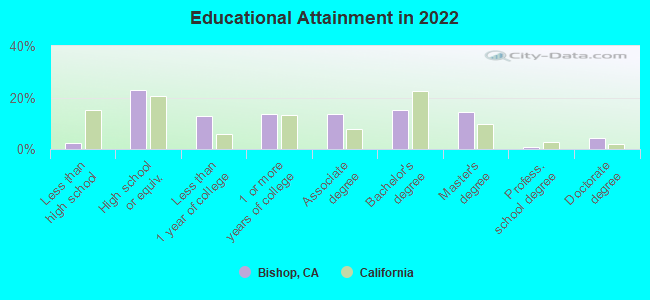
Educational Attainment - No schooling completed (%)
Educational Attainment - Less than high school (%)
Educational Attainment - High school or equivalent (%)
Educational Attainment - Less than 1 year of college (%)
Educational Attainment - 1 or more years of college (%)
Educational Attainment - Associate degree (%)
Educational Attainment - Bachelor's degree (%)
Educational Attainment - Master's degree (%)
Educational Attainment - Professional school degree (%)
Educational Attainment - Doctorate degree (%)
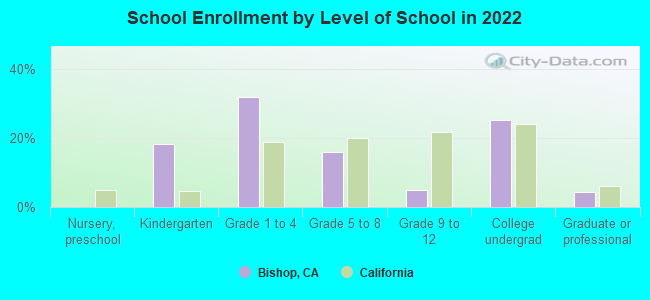
School Enrollment - Nursery, preschool (%)
School Enrollment - Kindergarten (%)
School Enrollment - Grade 1 to 4 (%)
School Enrollment - Grade 5 to 8 (%)
School Enrollment - Grade 9 to 12 (%)
School Enrollment - College undergrad (%)
School Enrollment - Graduate or professional (%)
School Enrollment - Not enrolled in school (%)
School enrollment - Public schools (%)
School enrollment - Private schools (%)
School enrollment - Not enrolled (%)
Median number of rooms in houses and condos
Median number of rooms in apartments
Housing units lacking complete plumbing facilities (%)
Housing units lacking complete kitchen facilities (%)
Density of houses
Urban houses (%)
Rural houses (%)
Households with people 60 years and over (%)
Households with people 65 years and over (%)
Households with people 75 years and over (%)
Households with one or more nonrelatives (%)
Households with no nonrelatives (%)
Population in households (%)
Family households (%)
Nonfamily households (%)
Population in families (%)
Family households with own children (%)
Median number of bedrooms in owner occupied houses
Mean number of bedrooms in owner occupied houses
Median number of bedrooms in renter occupied houses
Mean number of bedrooms in renter occupied houses
Median number of vehichles in owner occupied houses
Mean number of vehichles in owner occupied houses
Median number of vehichles in renter occupied houses
Mean number of vehichles in renter occupied houses
Mortgage status - with mortgage (%)
Mortgage status - with second mortgage (%)
Mortgage status - with home equity loan (%)
Mortgage status - with both second mortgage and home equity loan (%)
Mortgage status - without a mortgage (%)
Average family size
Average family size - White
Average family size - Black or African American
Average family size - Asian
Average family size - Hispanic or Latino
Average family size - American Indian and Alaska Native
Average family size - Multirace
Average family size - Other Race
Geographical mobility - Same house 1 year ago (%)
Geographical mobility - Moved within same county (%)
Geographical mobility - Moved from different county within same state (%)
Geographical mobility - Moved from different state (%)
Geographical mobility - Moved from abroad (%)
Place of birth - Born in state of residence (%)
Place of birth - Born in other state (%)
Place of birth - Native, outside of US (%)
Place of birth - Foreign born (%)
Housing units in structures - 1, detached (%)
Housing units in structures - 1, attached (%)
Housing units in structures - 2 (%)
Housing units in structures - 3 or 4 (%)
Housing units in structures - 5 to 9 (%)
Housing units in structures - 10 to 19 (%)
Housing units in structures - 20 to 49 (%)
Housing units in structures - 50 or more (%)
Housing units in structures - Mobile home (%)
Housing units in structures - Boat, RV, van, etc. (%)
House/condo owner moved in on average (years ago)
Renter moved in on average (years ago)
Year householder moved into unit - Moved in 1999 to March 2000 (%)
Year householder moved into unit - Moved in 1995 to 1998 (%)
Year householder moved into unit - Moved in 1990 to 1994 (%)
Year householder moved into unit - Moved in 1980 to 1989 (%)
Year householder moved into unit - Moved in 1970 to 1979 (%)
Year householder moved into unit - Moved in 1969 or earlier (%)
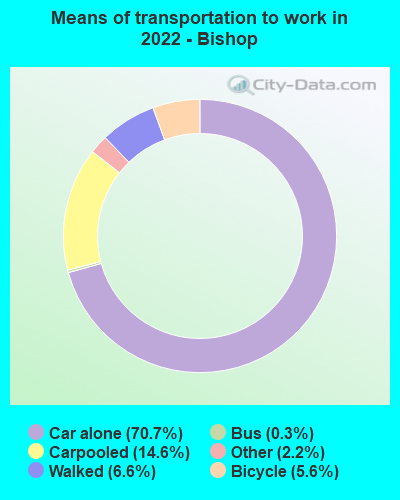
Means of transportation to work - Drove car alone (%)
Means of transportation to work - Carpooled (%)
Means of transportation to work - Public transportation (%)
Means of transportation to work - Bus or trolley bus (%)
Means of transportation to work - Streetcar or trolley car (%)
Means of transportation to work - Subway or elevated (%)
Means of transportation to work - Railroad (%)
Means of transportation to work - Ferryboat (%)
Means of transportation to work - Taxicab (%)
Means of transportation to work - Motorcycle (%)
Means of transportation to work - Bicycle (%)
Means of transportation to work - Walked (%)
Means of transportation to work - Other means (%)
Working at home (%)
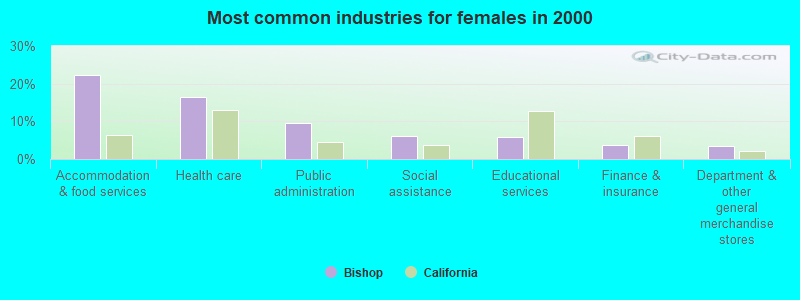
Industry diversity
Most Common Industries - Agriculture, forestry, fishing and hunting, and mining (%)
Most Common Industries - Agriculture, forestry, fishing and hunting (%)
Most Common Industries - Mining, quarrying, and oil and gas extraction (%)
Most Common Industries - Construction (%)
Most Common Industries - Manufacturing (%)
Most Common Industries - Wholesale trade (%)
Most Common Industries - Retail trade (%)
Most Common Industries - Transportation and warehousing, and utilities (%)
Most Common Industries - Transportation and warehousing (%)
Most Common Industries - Utilities (%)
Most Common Industries - Information (%)
Most Common Industries - Finance and insurance, and real estate and rental and leasing (%)
Most Common Industries - Finance and insurance (%)
Most Common Industries - Real estate and rental and leasing (%)
Most Common Industries - Professional, scientific, and management, and administrative and waste management services (%)
Most Common Industries - Professional, scientific, and technical services (%)
Most Common Industries - Management of companies and enterprises (%)
Most Common Industries - Administrative and support and waste management services (%)
Most Common Industries - Educational services, and health care and social assistance (%)
Most Common Industries - Educational services (%)
Most Common Industries - Health care and social assistance (%)
Most Common Industries - Arts, entertainment, and recreation, and accommodation and food services (%)
Most Common Industries - Arts, entertainment, and recreation (%)
Most Common Industries - Accommodation and food services (%)
Most Common Industries - Other services, except public administration (%)
Most Common Industries - Public administration (%)
Occupation diversity
Most Common Occupations - Management, business, science, and arts occupations (%)
Most Common Occupations - Management, business, and financial occupations (%)
Most Common Occupations - Management occupations (%)
Most Common Occupations - Business and financial operations occupations (%)
Most Common Occupations - Computer, engineering, and science occupations (%)
Most Common Occupations - Computer and mathematical occupations (%)
Most Common Occupations - Architecture and engineering occupations (%)
Most Common Occupations - Life, physical, and social science occupations (%)
Most Common Occupations - Education, legal, community service, arts, and media occupations (%)
Most Common Occupations - Community and social service occupations (%)
Most Common Occupations - Legal occupations (%)
Most Common Occupations - Education, training, and library occupations (%)
Most Common Occupations - Arts, design, entertainment, sports, and media occupations (%)
Most Common Occupations - Healthcare practitioners and technical occupations (%)
Most Common Occupations - Health diagnosing and treating practitioners and other technical occupations (%)
Most Common Occupations - Health technologists and technicians (%)
Most Common Occupations - Service occupations (%)
Most Common Occupations - Healthcare support occupations (%)
Most Common Occupations - Protective service occupations (%)
Most Common Occupations - Fire fighting and prevention, and other protective service workers including supervisors (%)
Most Common Occupations - Law enforcement workers including supervisors (%)
Most Common Occupations - Food preparation and serving related occupations (%)
Most Common Occupations - Building and grounds cleaning and maintenance occupations (%)
Most Common Occupations - Personal care and service occupations (%)
Most Common Occupations - Sales and office occupations (%)
Most Common Occupations - Sales and related occupations (%)
Most Common Occupations - Office and administrative support occupations (%)
Most Common Occupations - Natural resources, construction, and maintenance occupations (%)
Most Common Occupations - Farming, fishing, and forestry occupations (%)
Most Common Occupations - Construction and extraction occupations (%)
Most Common Occupations - Installation, maintenance, and repair occupations (%)
Most Common Occupations - Production, transportation, and material moving occupations (%)
Most Common Occupations - Production occupations (%)
Most Common Occupations - Transportation occupations (%)
Most Common Occupations - Material moving occupations (%)
People in Group quarters - Institutionalized population (%)
People in Group quarters - Correctional institutions (%)
People in Group quarters - Federal prisons and detention centers (%)
People in Group quarters - Halfway houses (%)
People in Group quarters - Local jails and other confinement facilities (including police lockups) (%)
People in Group quarters - Military disciplinary barracks (%)
People in Group quarters - State prisons (%)
People in Group quarters - Other types of correctional institutions (%)
People in Group quarters - Nursing homes (%)
People in Group quarters - Hospitals/wards, hospices, and schools for the handicapped (%)
People in Group quarters - Hospitals/wards and hospices for chronically ill (%)
People in Group quarters - Hospices or homes for chronically ill (%)
People in Group quarters - Military hospitals or wards for chronically ill (%)
People in Group quarters - Other hospitals or wards for chronically ill (%)
People in Group quarters - Hospitals or wards for drug/alcohol abuse (%)
People in Group quarters - Mental (Psychiatric) hospitals or wards (%)
People in Group quarters - Schools, hospitals, or wards for the mentally retarded (%)
People in Group quarters - Schools, hospitals, or wards for the physically handicapped (%)
People in Group quarters - Institutions for the deaf (%)
People in Group quarters - Institutions for the blind (%)
People in Group quarters - Orthopedic wards and institutions for the physically handicapped (%)
People in Group quarters - Wards in general hospitals for patients who have no usual home elsewhere (%)
People in Group quarters - Wards in military hospitals for patients who have no usual home elsewhere (%)
People in Group quarters - Juvenile institutions (%)
People in Group quarters - Long-term care (%)
People in Group quarters - Homes for abused, dependent, and neglected children (%)
People in Group quarters - Residential treatment centers for emotionally disturbed children (%)
People in Group quarters - Training schools for juvenile delinquents (%)
People in Group quarters - Short-term care, detention or diagnostic centers for delinquent children (%)
People in Group quarters - Type of juvenile institution unknown (%)
People in Group quarters - Noninstitutionalized population (%)
People in Group quarters - College dormitories (includes college quarters off campus) (%)
People in Group quarters - Military quarters (%)
People in Group quarters - On base (%)
People in Group quarters - Barracks, unaccompanied personnel housing (UPH), (Enlisted/Officer), ;and similar group living quarters for military personnel (%)
People in Group quarters - Transient quarters for temporary residents (%)
People in Group quarters - Military ships (%)
People in Group quarters - Group homes (%)
People in Group quarters - Homes or halfway houses for drug/alcohol abuse (%)
People in Group quarters - Homes for the mentally ill (%)
People in Group quarters - Homes for the mentally retarded (%)
People in Group quarters - Homes for the physically handicapped (%)
People in Group quarters - Other group homes (%)
People in Group quarters - Religious group quarters (%)
People in Group quarters - Dormitories (%)
People in Group quarters - Agriculture workers' dormitories on farms (%)
People in Group quarters - Job Corps and vocational training facilities (%)
People in Group quarters - Other workers' dormitories (%)
People in Group quarters - Crews of maritime vessels (%)
People in Group quarters - Other nonhousehold living situations (%)
People in Group quarters - Other noninstitutional group quarters (%)
Residents speaking English at home (%)
Residents speaking English at home - Born in the United States (%)
Residents speaking English at home - Native, born elsewhere (%)
Residents speaking English at home - Foreign born (%)
Residents speaking Spanish at home (%)
Residents speaking Spanish at home - Born in the United States (%)
Residents speaking Spanish at home - Native, born elsewhere (%)
Residents speaking Spanish at home - Foreign born (%)
Residents speaking other language at home (%)
Residents speaking other language at home - Born in the United States (%)
Residents speaking other language at home - Native, born elsewhere (%)
Residents speaking other language at home - Foreign born (%)
Class of Workers - Employee of private company (%)
Class of Workers - Self-employed in own incorporated business (%)
Class of Workers - Private not-for-profit wage and salary workers (%)
Class of Workers - Local government workers (%)
Class of Workers - State government workers (%)
Class of Workers - Federal government workers (%)
Class of Workers - Self-employed workers in own not incorporated business and Unpaid family workers (%)
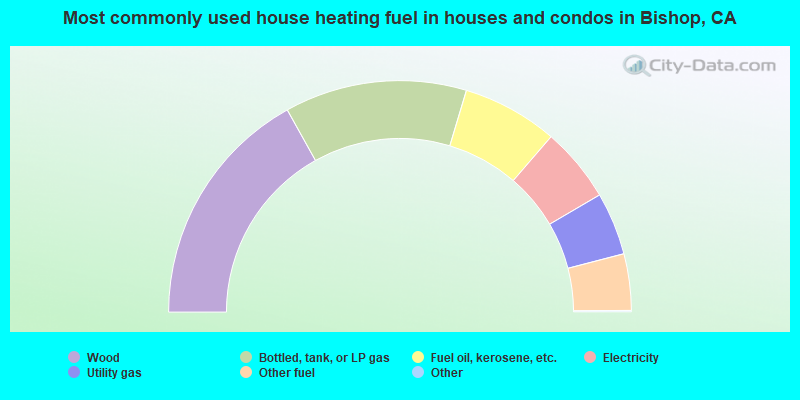
House heating fuel used in houses and condos - Utility gas (%)
House heating fuel used in houses and condos - Bottled, tank, or LP gas (%)
House heating fuel used in houses and condos - Electricity (%)
House heating fuel used in houses and condos - Fuel oil, kerosene, etc. (%)
House heating fuel used in houses and condos - Coal or coke (%)
House heating fuel used in houses and condos - Wood (%)
House heating fuel used in houses and condos - Solar energy (%)
House heating fuel used in houses and condos - Other fuel (%)
House heating fuel used in houses and condos - No fuel used (%)
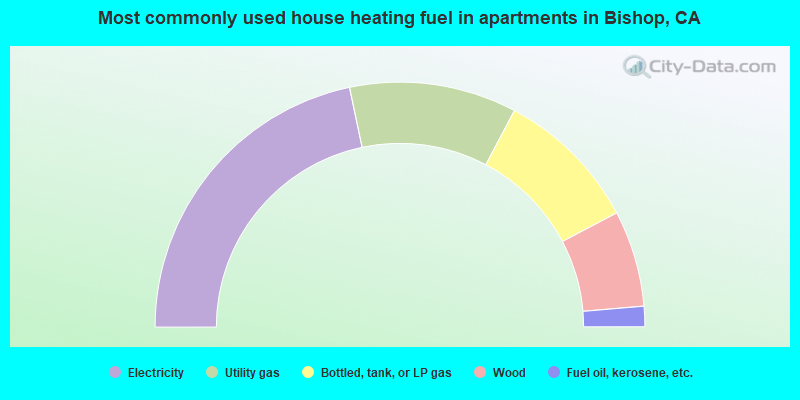
House heating fuel used in apartments - Utility gas (%)
House heating fuel used in apartments - Bottled, tank, or LP gas (%)
House heating fuel used in apartments - Electricity (%)
House heating fuel used in apartments - Fuel oil, kerosene, etc. (%)
House heating fuel used in apartments - Coal or coke (%)
House heating fuel used in apartments - Wood (%)
House heating fuel used in apartments - Solar energy (%)
House heating fuel used in apartments - Other fuel (%)
House heating fuel used in apartments - No fuel used (%)
Armed forces status - In Armed Forces (%)
Armed forces status - Civilian (%)
Armed forces status - Civilian - Veteran (%)
Armed forces status - Civilian - Nonveteran (%)
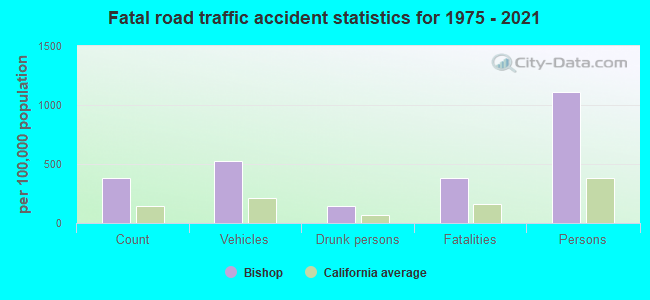
Fatal accidents locations in years 2005-2021
Fatal accidents locations in 2005
Fatal accidents locations in 2006
Fatal accidents locations in 2007
Fatal accidents locations in 2008
Fatal accidents locations in 2009
Fatal accidents locations in 2010
Fatal accidents locations in 2011
Fatal accidents locations in 2012
Fatal accidents locations in 2013
Fatal accidents locations in 2014
Fatal accidents locations in 2015
Fatal accidents locations in 2016
Fatal accidents locations in 2017
Fatal accidents locations in 2018
Fatal accidents locations in 2019
Fatal accidents locations in 2020
Fatal accidents locations in 2021
Alcohol use - People drinking some alcohol every month (%)
Alcohol use - People not drinking at all (%)
Alcohol use - Average days/month drinking alcohol
Alcohol use - Average drinks/week
Alcohol use - Average days/year people drink much
Audiometry - Average condition of hearing (%)
Audiometry - People that can hear a whisper from across a quiet room (%)
Audiometry - People that can hear normal voice from across a quiet room (%)
Audiometry - Ears ringing, roaring, buzzing (%)
Audiometry - Had a job exposure to loud noise (%)
Audiometry - Had off-work exposure to loud noise (%)
Blood Pressure & Cholesterol - Has high blood pressure (%)
Blood Pressure & Cholesterol - Checking blood pressure at home (%)
Blood Pressure & Cholesterol - Frequently checking blood cholesterol (%)
Blood Pressure & Cholesterol - Has high cholesterol level (%)
Consumer Behavior - Money monthly spent on food at supermarket/grocery store
Consumer Behavior - Money monthly spent on food at other stores
Consumer Behavior - Money monthly spent on eating out
Consumer Behavior - Money monthly spent on carryout/delivered foods
Consumer Behavior - Income spent on food at supermarket/grocery store (%)
Consumer Behavior - Income spent on food at other stores (%)
Consumer Behavior - Income spent on eating out (%)
Consumer Behavior - Income spent on carryout/delivered foods (%)
Current Health Status - General health condition (%)
Current Health Status - Blood donors (%)
Current Health Status - Has blood ever tested for HIV virus (%)
Current Health Status - Left-handed people (%)
Dermatology - People using sunscreen (%)
Diabetes - Diabetics (%)
Diabetes - Had a blood test for high blood sugar (%)
Diabetes - People taking insulin (%)
Diet Behavior & Nutrition - Diet health (%)
Diet Behavior & Nutrition - Milk product consumption (# of products/month)
Diet Behavior & Nutrition - Meals not home prepared (#/week)
Diet Behavior & Nutrition - Meals from fast food or pizza place (#/week)
Diet Behavior & Nutrition - Ready-to-eat foods (#/month)
Diet Behavior & Nutrition - Frozen meals/pizza (#/month)
Drug Use - People that ever used marijuana or hashish (%)
Drug Use - Ever used hard drugs (%)
Drug Use - Ever used any form of cocaine (%)
Drug Use - Ever used heroin (%)
Drug Use - Ever used methamphetamine (%)
Health Insurance - People covered by health insurance (%)
Kidney Conditions-Urology - Avg. # of times urinating at night
Medical Conditions - People with asthma (%)
Medical Conditions - People with anemia (%)
Medical Conditions - People with psoriasis (%)
Medical Conditions - People with overweight (%)
Medical Conditions - Elderly people having difficulties in thinking or remembering (%)
Medical Conditions - People who ever received blood transfusion (%)
Medical Conditions - People having trouble seeing even with glass/contacts (%)
Medical Conditions - People with arthritis (%)
Medical Conditions - People with gout (%)
Medical Conditions - People with congestive heart failure (%)
Medical Conditions - People with coronary heart disease (%)
Medical Conditions - People with angina pectoris (%)
Medical Conditions - People who ever had heart attack (%)
Medical Conditions - People who ever had stroke (%)
Medical Conditions - People with emphysema (%)
Medical Conditions - People with thyroid problem (%)
Medical Conditions - People with chronic bronchitis (%)
Medical Conditions - People with any liver condition (%)
Medical Conditions - People who ever had cancer or malignancy (%)
Mental Health - People who have little interest in doing things (%)
Mental Health - People feeling down, depressed, or hopeless (%)
Mental Health - People who have trouble sleeping or sleeping too much (%)
Mental Health - People feeling tired or having little energy (%)
Mental Health - People with poor appetite or overeating (%)
Mental Health - People feeling bad about themself (%)
Mental Health - People who have trouble concentrating on things (%)
Mental Health - People moving or speaking slowly or too fast (%)
Mental Health - People having thoughts they would be better off dead (%)
Oral Health - Average years since last visit a dentist
Oral Health - People embarrassed because of mouth (%)
Oral Health - People with gum disease (%)
Oral Health - General health of teeth and gums (%)
Oral Health - Average days a week using dental floss/device
Oral Health - Average days a week using mouthwash for dental problem
Oral Health - Average number of teeth
Pesticide Use - Households using pesticides to control insects (%)
Pesticide Use - Households using pesticides to kill weeds (%)
Physical Activity - People doing vigorous-intensity work activities (%)
Physical Activity - People doing moderate-intensity work activities (%)
Physical Activity - People walking or bicycling (%)
Physical Activity - People doing vigorous-intensity recreational activities (%)
Physical Activity - People doing moderate-intensity recreational activities (%)
Physical Activity - Average hours a day doing sedentary activities
Physical Activity - Average hours a day watching TV or videos
Physical Activity - Average hours a day using computer
Physical Functioning - People having limitations keeping them from working (%)
Physical Functioning - People limited in amount of work they can do (%)
Physical Functioning - People that need special equipment to walk (%)
Physical Functioning - People experiencing confusion/memory problems (%)
Physical Functioning - People requiring special healthcare equipment (%)
Prescription Medications - Average number of prescription medicines taking
Preventive Aspirin Use - Adults 40+ taking low-dose aspirin (%)
Reproductive Health - Vaginal deliveries (%)
Reproductive Health - Cesarean deliveries (%)
Reproductive Health - Deliveries resulted in a live birth (%)
Reproductive Health - Pregnancies resulted in a delivery (%)
Reproductive Health - Women breastfeeding newborns (%)
Reproductive Health - Women that had a hysterectomy (%)
Reproductive Health - Women that had both ovaries removed (%)
Reproductive Health - Women that have ever taken birth control pills (%)
Reproductive Health - Women taking birth control pills (%)
Reproductive Health - Women that have ever used Depo-Provera or injectables (%)
Reproductive Health - Women that have ever used female hormones (%)
Sexual Behavior - People 18+ that ever had sex (vaginal, anal, or oral) (%)
Sexual Behavior - Males 18+ that ever had vaginal sex with a woman (%)
Sexual Behavior - Males 18+ that ever performed oral sex on a woman (%)
Sexual Behavior - Males 18+ that ever had anal sex with a woman (%)
Sexual Behavior - Males 18+ that ever had any sex with a man (%)
Sexual Behavior - Females 18+ that ever had vaginal sex with a man (%)
Sexual Behavior - Females 18+ that ever performed oral sex on a man (%)
Sexual Behavior - Females 18+ that ever had anal sex with a man (%)
Sexual Behavior - Females 18+ that ever had any kind of sex with a woman (%)
Sexual Behavior - Average age people first had sex
Sexual Behavior - Average number of female sex partners in lifetime (males 18+)
Sexual Behavior - Average number of female vaginal sex partners in lifetime (males 18+)
Sexual Behavior - Average age people first performed oral sex on a woman (18+)
Sexual Behavior - Average number of woman performed oral sex on in lifetime (18+)
Sexual Behavior - Average number of male sex partners in lifetime (males 18+)
Sexual Behavior - Average number of male anal sex partners in lifetime (males 18+)
Sexual Behavior - Average age people first performed oral sex on a man (18+)
Sexual Behavior - Average number of male oral sex partners in lifetime (18+)
Sexual Behavior - People using protection when performing oral sex (%)
Sexual Behavior - Average number of times people have vaginal or anal sex a year
Sexual Behavior - People having sex without condom (%)
Sexual Behavior - Average number of male sex partners in lifetime (females 18+)
Sexual Behavior - Average number of male vaginal sex partners in lifetime (females 18+)
Sexual Behavior - Average number of female sex partners in lifetime (females 18+)
Sexual Behavior - Circumcised males 18+ (%)
Sleep Disorders - Average hours sleeping at night
Sleep Disorders - People that has trouble sleeping (%)
Smoking-Cigarette Use - People smoking cigarettes (%)
Taste & Smell - People 40+ having problems with smell (%)
Taste & Smell - People 40+ having problems with taste (%)
Taste & Smell - People 40+ that ever had wisdom teeth removed (%)
Taste & Smell - People 40+ that ever had tonsils teeth removed (%)
Taste & Smell - People 40+ that ever had a loss of consciousness because of a head injury (%)
Taste & Smell - People 40+ that ever had a broken nose or other serious injury to face or skull (%)
Taste & Smell - People 40+ that ever had two or more sinus infections (%)
Weight - Average height (inches)
Weight - Average weight (pounds)
Weight - Average BMI
Weight - People that are obese (%)
Weight - People that ever were obese (%)
Weight - People trying to lose weight (%)
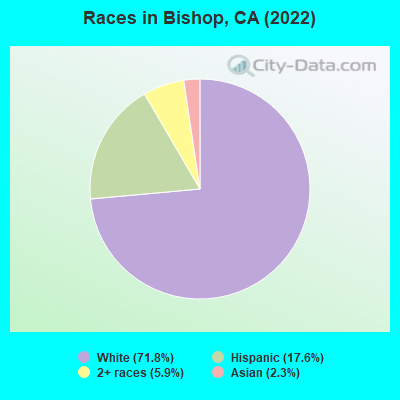
2,708 71.8% White alone 664 17.6% Hispanic 224 5.9% Two or more races 87 2.3% Asian alone 3 0.08% American Indian alone
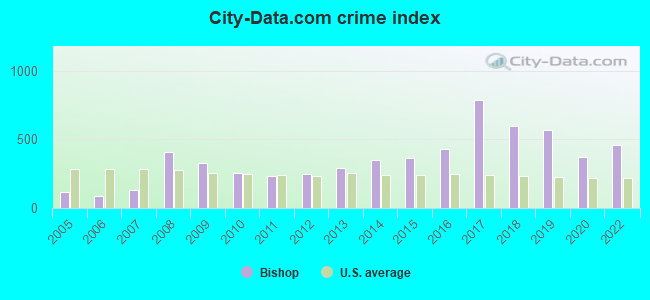
Officers per 1,000 residents here:
3.18California average:
2.30
Latest news from Bishop, CA collected exclusively by city-data.com from local newspapers, TV, and radio stations
Ancestries: American (13.4%), German (11.0%), European (6.8%), English (6.0%), Polish (5.1%), Italian (4.1%).
Current Local Time:
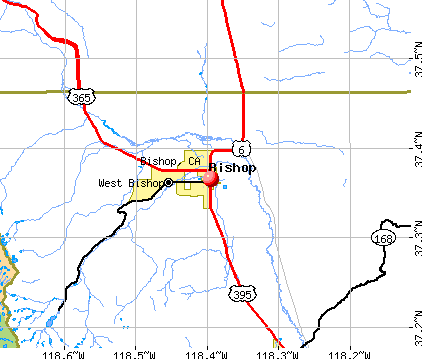
Land area: 1.75 square miles.
Population density: 2,155 people per square mile (low).
262 residents are foreign born (4.4% Latin America , 1.4% Asia , 0.7% North America ).
This city:
6.9%California:
26.5%
Median real estate property taxes paid for housing units with mortgages in 2022: $3,113 (0.6%)Median real estate property taxes paid for housing units with no mortgage in 2022: $2,067 (0.9%)
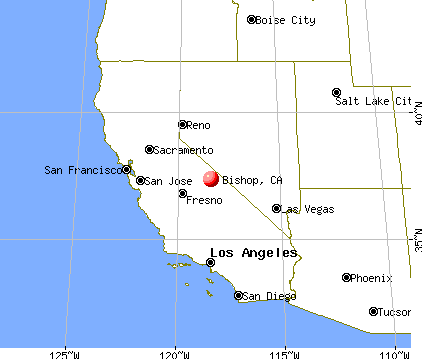
Nearest city with pop. 50,000+: Clovis, CA
Nearest city with pop. 200,000+: Fresno, CA
Nearest city with pop. 1,000,000+: Los Angeles, CA
Nearest cities:
Latitude: 37.37 N, Longitude: 118.39 W
Nickname or alias (official or unofficial): Mule Packer Capital of the World
Daytime population change due to commuting: +2,012 (+53.4%)Workers who live and work in this city: 1,678 (75.5%)
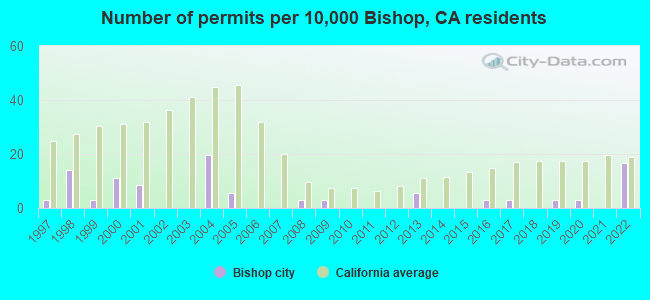
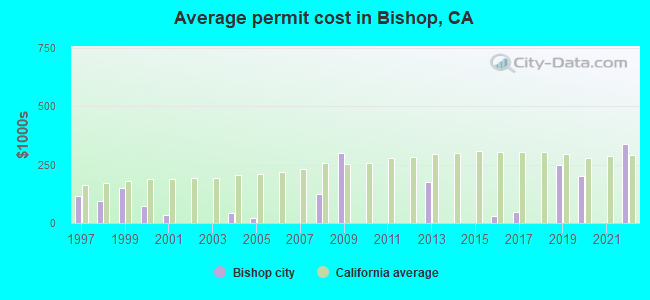
Single-family new house construction building permits:
2022: 6 buildings , average cost: $337,5002020: 1 building , cost: $200,0002019: 1 building , cost: $250,0002017: 1 building , cost: $47,5002016: 1 building , cost: $30,0002013: 2 buildings , average cost: $176,9002009: 1 building , cost: $300,0002008: 1 building , cost: $122,6002005: 2 buildings , average cost: $20,5002004: 7 buildings , average cost: $40,7002001: 3 buildings , average cost: $34,1002000: 4 buildings , average cost: $73,5001999: 1 building , cost: $149,6001998: 5 buildings , average cost: $93,2001997: 1 building , cost: $113,700Unemployment in December 2023:
Population change in the 1990s: +77 (+2.2%).
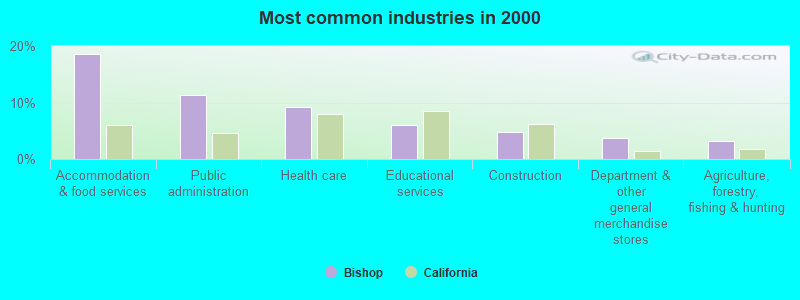
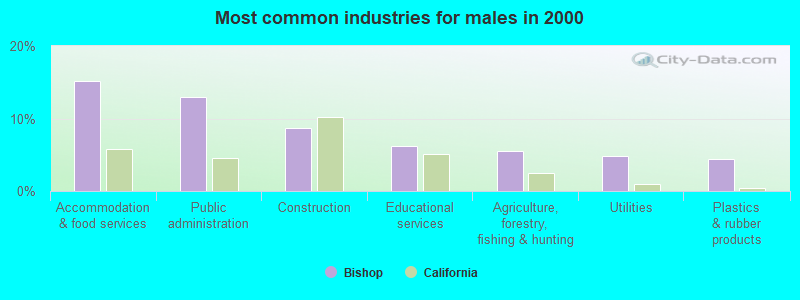
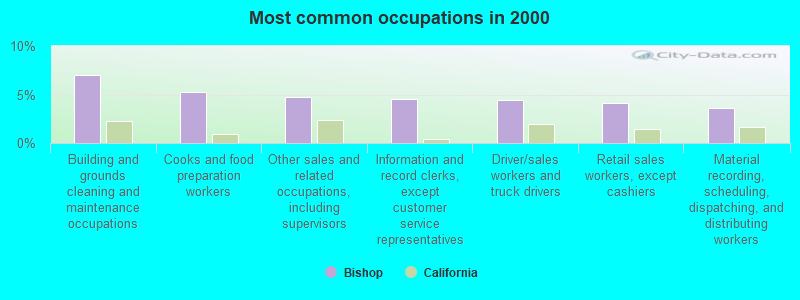
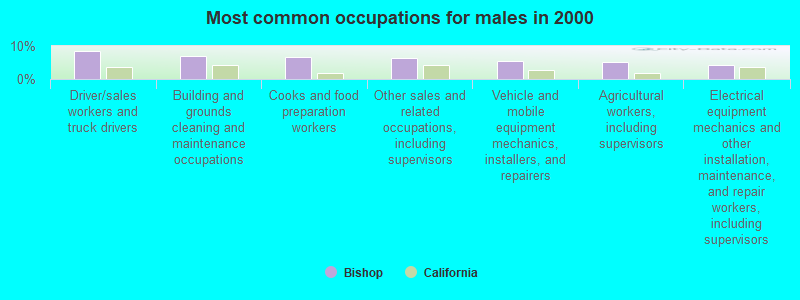
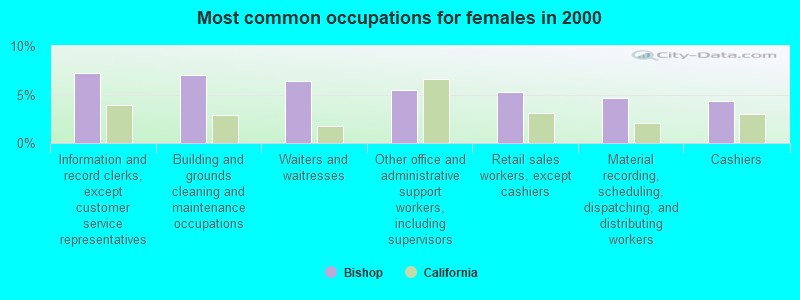
Most common occupations in Bishop, CA (%)
Both Males Females
Building and grounds cleaning and maintenance occupations (7.0%)
Cooks and food preparation workers (5.3%)
Other sales and related occupations, including supervisors (4.8%)
Information and record clerks, except customer service representatives (4.6%)
Driver/sales workers and truck drivers (4.4%)
Retail sales workers, except cashiers (4.1%)
Material recording, scheduling, dispatching, and distributing workers (3.6%)
Driver/sales workers and truck drivers (8.6%)
Building and grounds cleaning and maintenance occupations (7.1%)
Cooks and food preparation workers (6.7%)
Other sales and related occupations, including supervisors (6.3%)
Vehicle and mobile equipment mechanics, installers, and repairers (5.4%)
Agricultural workers, including supervisors (5.3%)
Electrical equipment mechanics and other installation, maintenance, and repair workers, including supervisors (4.3%)
Information and record clerks, except customer service representatives (7.2%)
Building and grounds cleaning and maintenance occupations (7.0%)
Waiters and waitresses (6.4%)
Other office and administrative support workers, including supervisors (5.5%)
Retail sales workers, except cashiers (5.2%)
Material recording, scheduling, dispatching, and distributing workers (4.6%)
Cashiers (4.4%)
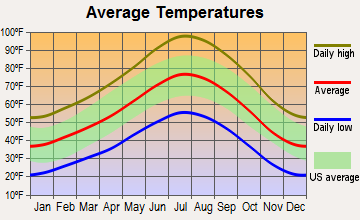
Earthquake activity:
Bishop-area historical earthquake activity is significantly above California state average. It is 8484% greater than the overall U.S. average. On 7/21/1952 at 11:52:14, a magnitude 7.7 (7.7 UK, Class: Major, Intensity: VIII - XII) earthquake occurred 167.0 miles away from the city center, causing $50,000,000 total damage On 12/21/1932 at 06:10:09, a magnitude 7.2 (7.2 UK) earthquake occurred 81.0 miles away from the city center On 4/18/1906 at 13:12:21, a magnitude 7.9 (7.9 UK) earthquake occurred 255.9 miles away from the city center, causing $524,000,000 total damage On 10/3/1915 at 06:52:48, a magnitude 7.6 (7.6 UK) earthquake occurred 222.1 miles away from the city center On 6/28/1992 at 11:57:34, a magnitude 7.6 (6.2 MB, 7.6 MS, 7.3 MW, Depth: 0.7 mi) earthquake occurred 243.6 miles away from the city center, causing 3 deaths ( 1 shaking deaths, 2 other deaths) and 400 injuries, causing $100,000,000 total damage and $40,000,000 insured lossesOn 11/4/1927 at 13:51:53, a magnitude 7.5 (7.5 UK) earthquake occurred 224.5 miles away from Bishop center Magnitude types: body-wave magnitude (MB), surface-wave magnitude (MS), moment magnitude (MW) Natural disasters: The number of natural disasters in Inyo County (11) is smaller than the US average (15).Major Disasters (Presidential) Declared: 5Emergencies Declared: 2Floods: 7, Winter Storms: 4, Mudslides: 3, Storms: 3, Drought: 1, Fire: 1, Hurricane: 1, Landslide: 1, Other: 1 (Note: some incidents may be assigned to more than one category). Hospitals and medical centers in Bishop: NORTHERN INYO HOSPITAL (Government - Hospital District or Authority, 150 PIONEER LANE) BISHOP CARE CENTER (151 PIONEER LANE)
TOIYABE DIALYSIS CENTER (44 TU SU LANE)
PIONEER HOME HEALTH CARE (162 E LINE ST)
Colleges/universities with over 2000 students nearest to Bishop:
Reedley College (about 79 miles; Reedley, CA ; Full-time enrollment: 8,144)
Institute of Technology Inc (about 82 miles; Clovis, CA ; FT enrollment: 2,483)
California State University-Fresno (about 84 miles; Fresno, CA ; FT enrollment: 18,993)
University of Phoenix-Central Valley Campus (about 85 miles; Fresno, CA ; FT enrollment: 2,109)
Heald College-Fresno (about 86 miles; Fresno, CA ; FT enrollment: 2,199)
Fresno Pacific University (about 87 miles; Fresno, CA ; FT enrollment: 3,083)
Fresno City College (about 88 miles; Fresno, CA ; FT enrollment: 12,994)
Public high schools in Bishop:
Public elementary/middle schools in Bishop:
Private elementary/middle school in Bishop:
See full list of schools located in Bishop
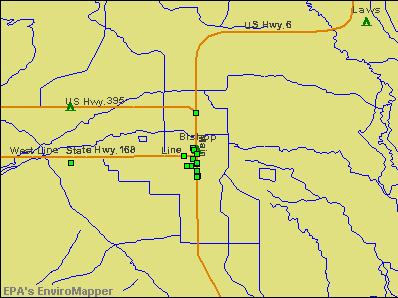
Notable locations in Bishop: (A) , Inyo National Forest Supervisors Ofiice (B) , Northern Inyo Hospital Medical Library (C) , Bishop Visitors Center (D) , Bishop Fire Department Station 1 Headquarters (E) , Bishop City Hall (F) , Symons Emergency Specialties (G) , United States Forest Service White Mountain Ranger Station (H) , Meadow Farms Fire Department Station 3 (I) . Display/hide their locations on the map
Churches in Bishop include: (A) , Church of Christ (B) , The Church of Jesus Christ of Latter Day Saints (C) , First Presbyterian Church (D) , First Southern Baptist Church (E) , First United Methodist Church (F) , Foursquare Gospel Church (G) , Grace Lutheran Church (H) , Kingdom Hall of Jehovahs Witnesses (I) . Display/hide their locations on the map
Parks in Bishop include: (1) , Bishop City Park (2) . Display/hide their locations on the map
Tourist attractions:
Hotels:
Court:
Birthplace of: Matt Williams (third baseman) - Baseball player, Stanton Barrett - Race car driver and movie stunt driver, Stanton Barrett Jr. - Nextel Cup series NASCAR driver (born : Dec 1, 1972).
Inyo County has a predicted average indoor radon screening level between 2 and 4 pCi/L (pico curies per liter) - Moderate Potential Drinking water stations with addresses in Bishop and their reported violations in the past:
BISHOP, CITY OF (Population served: 3,879, Groundwater):
Past health violations:
MCL, Monthly (TCR) - In MAR-2009, Contaminant: Coliform. Follow-up actions: St AO (w/o penalty) issued (JUL-15-2010)
Past monitoring violations:
2 regular monitoring violations
Population served: 1,000, Groundwater):
Past health violations:
MCL, Monthly (TCR) - In AUG-2005, Contaminant: Coliform. Follow-up actions: St Public Notif requested (SEP-16-2005)
MCL, Monthly (TCR) - In AUG-2005, Contaminant: Coliform. Follow-up actions: St Public Notif requested (SEP-16-2005)
Population served: 250, Groundwater):
Past health violations:
MCL, Monthly (TCR) - In NOV-2011, Contaminant: Coliform. Follow-up actions: St Compliance achieved (JAN-30-2012)
Past monitoring violations:
Initial Tap Sampling for Pb and Cu - In JUL-01-1993, Contaminant: Lead and Copper Rule. Follow-up actions: Fed Compliance achieved (SEP-30-2005)
Population served: 200, Groundwater):
Past monitoring violations:
4 routine major monitoring violations
Population served: 200, Groundwater):
Past monitoring violations:
2 routine major monitoring violations
Population served: 100, Groundwater):
Past health violations:
MCL, Monthly (TCR) - In NOV-2006, Contaminant: Coliform. Follow-up actions: St Tech Assistance Visit (NOV-13-2006), St Public Notif requested (NOV-16-2006), St Violation/Reminder Notice (NOV-16-2006), St Public Notif received (DEC-05-2006)
MCL, Monthly (TCR) - In NOV-2006, Contaminant: Coliform. Follow-up actions: St Tech Assistance Visit (NOV-13-2006), St Public Notif requested (NOV-16-2006), St Violation/Reminder Notice (NOV-16-2006), St Public Notif received (DEC-05-2006)
Population served: 60, Groundwater):
Past monitoring violations:
Initial Tap Sampling for Pb and Cu - In JUL-01-1993, Contaminant: Lead and Copper Rule. Follow-up actions: Fed Compliance achieved (SEP-30-2005)
Population served: 50, Groundwater):
Past monitoring violations:
9 routine major monitoring violations
One minor monitoring violation
Drinking water stations with addresses in Bishop that have no violations reported:
FOUR JEFFREY CAMPGROUND (Population served: 318, Primary Water Source Type: Groundwater)
KATHERINA MULLER WATER SYSTEM (Population served: 250, Primary Water Source Type: Groundwater)
SCHOBER LANE CAMPGROUND (Population served: 150, Primary Water Source Type: Groundwater)
FRENCH CAMPGROUND (Population served: 150, Primary Water Source Type: Groundwater)
EASTERN SIERRA TRI COUNTY FAIR (Population served: 100, Primary Water Source Type: Groundwater)
TUFF CAMPGROUND (Population served: 80, Primary Water Source Type: Groundwater)
ROCK CREEK LAKES RESORT (Population served: 56, Primary Water Source Type: Groundwater)
PARCHER S RESORT (Population served: 45, Primary Water Source Type: Groundwater)
WHITE MOUNTAIN RESEARCH CENTER (Population served: 45, Primary Water Source Type: Groundwater)
SABRINA CAMPGROUND (Population served: 30, Primary Water Source Type: Groundwater)
Average household size: This city:
2.2 peopleCalifornia:
2.9 people
Percentage of family households: This city:
48.9%Whole state:
68.7%
Percentage of households with unmarried partners: This city:
8.8%Whole state:
7.2%
Likely homosexual households (counted as self-reported same-sex unmarried-partner households)
Lesbian couples: 0.2% of all households Gay men: 0.3% of all households
People in group quarters in Bishop in 2010:
72 people in nursing facilities/skilled-nursing facilities
26 people in other noninstitutional facilities
9 people in group homes intended for adults
People in group quarters in Bishop in 2000:
65 people in nursing homes
10 people in homes for the mentally ill
2 people in other noninstitutional group quarters
Banks with branches in Bishop (2011 data):
JPMorgan Chase Bank, National Association: 400 North Main Street Branch at 400 North Main Street, branch established on 1976/05/18. Info updated 2011/11/10: Bank assets: $1,811,678.0 mil, Deposits: $1,190,738.0 mil, headquarters in Columbus, OH, positive income , International Specialization, 5577 total offices , Holding Company: Jpmorgan Chase & Co.
Oak Valley Community Bank: Bishop Branch at 351 North Main Street, branch established on 2002/05/29. Info updated 2006/11/03: Bank assets: $612.4 mil, Deposits: $536.2 mil, headquarters in Oakdale, CA, positive income , Commercial Lending Specialization, 14 total offices , Holding Company: Oak Valley Bancorp
Union Bank, National Association: Bishop Branch at 362 North Main Street, branch established on 1964/10/02. Info updated 2011/09/01: Bank assets: $88,967.5 mil, Deposits: $65,286.4 mil, headquarters in San Francisco, CA, positive income , Commercial Lending Specialization, 403 total offices , Holding Company: Mitsubishi Ufj Financial Group, Inc.
El Dorado Savings Bank, F.S.B.: Bishop Branch at 515 N Main St, branch established on 1956/01/01. Info updated 2011/07/21: Bank assets: $1,706.7 mil, Deposits: $1,536.5 mil, headquarters in Placerville, CA, positive income , Mortgage Lending Specialization, 35 total offices
Bank of America, National Association: Bishop Branch at 536 North Main Street, branch established on 1934/12/23. Info updated 2009/11/18: Bank assets: $1,451,969.3 mil, Deposits: $1,077,176.8 mil, headquarters in Charlotte, NC, positive income , 5782 total offices , Holding Company: Bank Of America Corporation
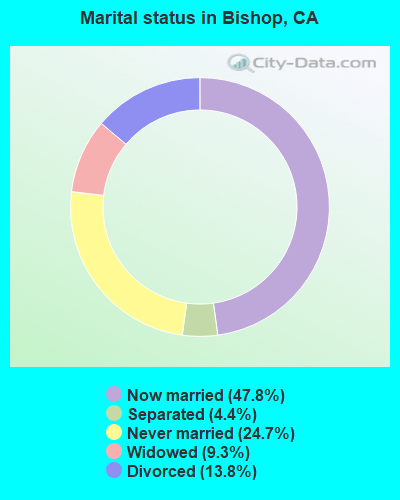
For population 15 years and over in Bishop:
Never married: 24.7%Now married: 47.8%Separated: 4.4%Widowed: 9.3%Divorced: 13.8% For population 25 years and over in Bishop:
High school or higher: 97.3%Bachelor's degree or higher: 33.4%Graduate or professional degree: 18.4%Unemployed: 5.3%Mean travel time to work (commute): 14.5 minutes
Education Gini index (Inequality in education) Here:
9.7California average:
15.5
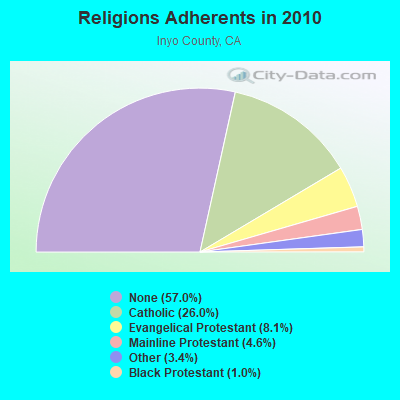
Religion statistics for Bishop, CA (based on Inyo County data)
Religion Adherents Congregations Catholic 4,827 5 Evangelical Protestant 1,494 23 Mainline Protestant 845 5 Other 629 4 Black Protestant 178 1 None 10,573 -
Source: Clifford Grammich, Kirk Hadaway, Richard Houseal, Dale E.Jones, Alexei Krindatch, Richie Stanley and Richard H.Taylor. 2012. 2010 U.S.Religion Census: Religious Congregations & Membership Study. Association of Statisticians of American Religious Bodies. Jones, Dale E., et al. 2002. Congregations and Membership in the United States 2000. Nashville, TN: Glenmary Research Center. Graphs represent county-level data
Food Environment Statistics: Number of grocery stores : 6Inyo County :
3.45 / 10,000 pop.California :
2.14 / 10,000 pop.
Number of convenience stores (no gas) : 1Inyo County :
0.57 / 10,000 pop.California :
0.62 / 10,000 pop.
Number of convenience stores (with gas) : 17Inyo County :
9.77 / 10,000 pop.California :
1.49 / 10,000 pop.
Number of full-service restaurants : 29Here :
16.67 / 10,000 pop.California :
7.42 / 10,000 pop.
Adult diabetes rate : Inyo County :
8.1%State :
7.3%
Low-income preschool obesity rate : Inyo County :
13.9%California :
17.9%
Health and Nutrition: Healthy diet rate : Bishop:
51.2%California:
49.4%
Average overall health of teeth and gums : This city:
49.0%California:
48.0%
People feeling badly about themselves : This city:
20.1%California:
20.2%
People not drinking alcohol at all : Bishop:
10.7%California:
11.2%
Average hours sleeping at night : Overweight people : This city:
34.1%California:
31.5%
General health condition : Bishop:
57.3%California:
56.4%
Average condition of hearing : Bishop:
78.0%California:
80.9%
More about Health and Nutrition of Bishop, CA Residents
Local government employment and payroll (March 2022)
Function
Full-time employees
Monthly full-time payroll
Average yearly full-time wage
Part-time employees
Monthly part-time payroll
Police Protection - Officers
12 $100,452 $100,452 0 $0 Police - Other
6 $32,509 $65,018 3 $1,428 Other Government Administration
4 $18,252 $54,756 10 $3,475 Water Supply
3 $19,411 $77,644 0 $0 Parks and Recreation
3 $18,577 $74,308 19 $18,537 Fire - Other
2 $8,170 $49,020 0 $0 Sewerage
2 $13,424 $80,544 0 $0 Streets and Highways
2 $23,128 $138,768 0 $0 Firefighters
2 $27,383 $164,298 0 $0 Financial Administration
2 $14,040 $84,240 2 $3,149 Housing and Community Development (Local)
0 $0 1 $995
Totals for Government
38 $275,346 $86,951 35 $27,584
Bishop government finances - Expenditure in 2017 (per resident):
Construction - Regular Highways: $379,000 ($100.50)
Water Utilities: $268,000 ($71.07)Sewerage: $137,000 ($36.33)Current Operations - Police Protection: $3,329,000 ($882.79)
Central Staff Services: $1,290,000 ($342.08)Parks and Recreation: $822,000 ($217.98)Water Utilities: $744,000 ($197.30)Sewerage: $743,000 ($197.03)Regular Highways: $498,000 ($132.06)Local Fire Protection: $358,000 ($94.94)Housing and Community Development: $105,000 ($27.84)General - Interest on Debt: $4,000 ($1.06)
Other Capital Outlay - Local Fire Protection: $87,000 ($23.07)
Police Protection: $45,000 ($11.93)Central Staff Services: $17,000 ($4.51)Parks and Recreation: $7,000 ($1.86)Water Utilities - Interest on Debt: $9,000 ($2.39)
Bishop government finances - Revenue in 2017 (per resident):
Charges - Sewerage: $1,061,000 ($281.36)
Parks and Recreation: $144,000 ($38.19)Other: $98,000 ($25.99)Housing and Community Development: $90,000 ($23.87)Federal Intergovernmental - General Local Government Support: $59,000 ($15.65)
Other: $11,000 ($2.92)Miscellaneous - General Revenue - Other: $436,000 ($115.62)
Rents: $127,000 ($33.68)Interest Earnings: $58,000 ($15.38)Sale of Property: $34,000 ($9.02)Fines and Forfeits: $10,000 ($2.65)Revenue - Water Utilities: $1,252,000 ($332.01)
State Intergovernmental - Other: $334,000 ($88.57)
Highways: $81,000 ($21.48)General Local Government Support: $3,000 ($0.80)Tax - Other Selective Sales: $2,618,000 ($694.25)
General Sales and Gross Receipts: $1,945,000 ($515.78)Property: $827,000 ($219.31)Other: $640,000 ($169.72)Other License: $69,000 ($18.30)Occupation and Business License - Other: $55,000 ($14.58)Public Utilities Sales: $42,000 ($11.14)Documentary and Stock Transfer: $7,000 ($1.86)
Bishop government finances - Debt in 2017 (per resident):
Long Term Debt - Outstanding Unspecified Public Purpose: $769,000 ($203.92)
Beginning Outstanding - Unspecified Public Purpose: $621,000 ($164.68)Issue, Unspecified Public Purpose: $270,000 ($71.60)Retired Unspecified Public Purpose: $122,000 ($32.35)
Bishop government finances - Cash and Securities in 2017 (per resident):
Bond Funds - Cash and Securities: $72,000 ($19.09)
Other Funds - Cash and Securities: $8,922,000 ($2365.95)
Businesses in Bishop, CA
Name Count Name Count
AT&T 1 MasterBrand Cabinets 4 Ace Hardware 1 McDonald's 1 Best Western 2 Motel 6 1 Carl\s Jr. 1 New Balance 1 Comfort Inn 1 Nike 2 Curves 1 RadioShack 1 Days Inn 1 Ramada 1 Dennys 1 Rite Aid 1 FedEx 3 Rodeway Inn 1 Ford 1 Safeway 1 GNC 1 Sears 1 H&R Block 1 Starbucks 2 Holiday Inn 1 Super 8 1 Honda 1 Taco Bell 1 JCPenney 1 Toyota 1 Jack In The Box 1 True Value 1 KFC 1 U-Haul 1 Kmart 1 UPS 6 La Quinta 1 Vans 1 La-Z-Boy 1 Vons 1 Lane Furniture 1
Strongest AM radio stations in Bishop:
KBOV (1230 AM; 1 kW; BISHOP, CA; Owner: GREAT COUNTRY BROADCASTING, INC.)
KMJ (580 AM; 50 kW; FRESNO, CA; Owner: INFINITY RADIO OPERATIONS INC.)
KWRU (940 AM; 50 kW; FRESNO, CA)
KCBC (770 AM; 50 kW; RIVERBANK, CA; Owner: KIERTRON, INC.)
KERI (1180 AM; 50 kW; WASCO-GREENACRES, CA; Owner: KWSO, INC.)
KKOH (780 AM; 50 kW; RENO, NV; Owner: CITADEL BROADCASTING COMPANY)
KOOR (790 AM; 10 kW; CLOVIS, CA; Owner: INFINITY RADIO OPERATIONS INC.)
KGDP (660 AM; 50 kW; ORCUTT, CA; Owner: RADIO REPRESENTATIVES, INC.)
KLAC (570 AM; 50 kW; LOS ANGELES, CA; Owner: AMFM RADIO LICENSES, L.L.C.)
KNBR (680 AM; 50 kW; SAN FRANCISCO, CA; Owner: KNBR LICO, INC.)
KHTK (1140 AM; 50 kW; SACRAMENTO, CA; Owner: INFINITY RADIO SUBSIDIARY OPERATIONS INC.)
KDWN (720 AM; 50 kW; LAS VEGAS, NV; Owner: RADIO NEVADA CORP.)
KGO (810 AM; 50 kW; SAN FRANCISCO, CA; Owner: KGO-AM RADIO, INC.)
Strongest FM radio stations in Bishop:
KRHV (93.3 FM; BIG PINE, CA; Owner: DAVID A. AND MARYANN M. DIGERNESS)
K208BS (89.5 FM; BISHOP, CA; Owner: WESTERN INSPIRATIONAL B/CASTERS, INC)
KWTW (88.5 FM; BISHOP, CA; Owner: LIVING PROOF, INC.)
KIBS (100.7 FM; BISHOP, CA; Owner: GREAT COUNTRY BROADCASTING, INC.)
KDAY (92.5 FM; INDEPENDENCE, CA; Owner: MS. BENETT KESSLER)
K205ET (88.9 FM; BIG PINE, ETC., CA; Owner: WESTERN INSPIRATIONAL BROADCASTERS, INC)
KMMT (106.5 FM; MAMMOTH LAKES, CA; Owner: MAMMOTH MOUNTAIN FM ASSOCIATES,INC.)
KFNO (90.3 FM; FRESNO, CA; Owner: FAMILY STATIONS, INC.)
KLBN (105.1 FM; AUBERRY, CA; Owner: LOTUS COMMUNICATIONS CORP.)
KRNC (105.9 FM; FRESNO, CA; Owner: INFINITY RADIO OPERATIONS INC.)
KOQO-FM (101.9 FM; FRESNO, CA; Owner: INFINITY RADIO OPERATIONS INC.)
K203CM (88.5 FM; SANGER, CA; Owner: EDUCATIONAL MEDIA FOUNDATION)
KSKS (93.7 FM; FRESNO, CA; Owner: INFINITY RADIO OPERATIONS INC.)
KFCF (88.1 FM; FRESNO, CA; Owner: FRESNO FREE COLLEGE FOUNDATION)
KVPR (89.3 FM; FRESNO, CA; Owner: WHITE ASH BROADCASTING, INC.)
K201GA (88.1 FM; BISHOP, CA; Owner: CALVARY CHAPEL OF TWIN FALLS, INC.)
K217EE (91.3 FM; BISHOP, CA; Owner: FAMILY WORSHIP CENTER CHURCH, INC.)
TV broadcast stations around Bishop:
K70AA (Channel 70; BISHOP, ETC., CA; Owner: MONO COUNTY SERVICE AREA NO. 5)
K73AA (Channel 73; BISHOP, ETC., CA; Owner: MONO COUNTY SERVICE AREA NO. 5)
K79AT (Channel 79; BISHOP, ETC., CA; Owner: MONO COUNTY SERVICE AREA NO. 5)
National Bridge Inventory (NBI) Statistics 13 Number of bridges62ft / 19.3m Total length131,326 Total average daily traffic13,797 Total average daily truck traffic156,558 Total future (year 2038) average daily traffic
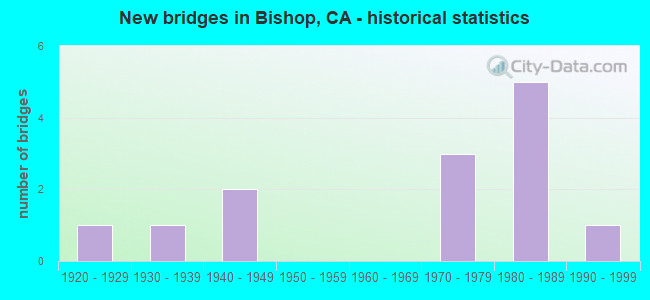
New bridges - historical statistics
1 1920-1929 1 1930-1939 2 1940-1949 3 1970-1979 5 1980-1989 1 1990-1999
See full National Bridge Inventory statistics for Bishop, CA
Fire-safe hotels and motels in Bishop, California:
Rodeway Inn, 150 E Elm St, Bishop, California 93514 Phone: (760) 873-3564, Fax: (760) 873-6936
Best Western Holiday Spa Lodge, 1025 N Main St, Bishop, California 93514 Phone: (760) 873-3543, Fax: (760) 872-4777
La Quinta Inn, 651 N Main St, Bishop, California 93514 Phone: (760) 873-6380
Motel 6, 1005 N Main St, Bishop, California 93514 Phone: (760) 873-8426, Fax: (760) 873-8060
All 4 fire-safe hotels and motels in Bishop, California
Most common first names in Bishop, CA among deceased individuals Name Count Lived (average)
John 114 74.7 years Robert 106 74.3 years William 103 76.0 years James 82 72.3 years Mary 82 80.9 years Charles 72 74.0 years George 61 76.8 years Dorothy 60 78.3 years Richard 45 72.4 years Margaret 40 79.7 years
Most common last names in Bishop, CA among deceased individuals Last name Count Lived (average)
Smith 45 70.6 years Williams 34 72.3 years Brown 31 74.0 years Johnson 27 76.7 years Wilson 21 76.5 years Young 19 79.9 years Thompson 18 84.8 years Jones 18 81.1 years Clark 17 77.7 years Nelson 17 77.2 years
Bishop compared to California state average:
Median house value below state average. Unemployed percentage significantly below state average. Black race population percentage significantly below state average. Hispanic race population percentage below state average. Median age above state average. Foreign-born population percentage significantly below state average. Length of stay since moving in significantly above state average.
Top Patent Applicants
Tani Tatum (3)
Andrew James Weitz (1)
Scott Richard Berger (1)
Michael J. Baron (1)
Colin Stephen Magowan (1)
Bon Wilson (1)
Heather C. Marvin (1)
Robert W. Wilson (1)
Andrew M. Marvin (1)
Shawn Beard (1)
Total of 10 patent applications in 2008-2024.


 Recent articles from our blog. Our writers, many of them Ph.D. graduates or candidates, create easy-to-read articles on a wide variety of topics.

 (81.0 miles
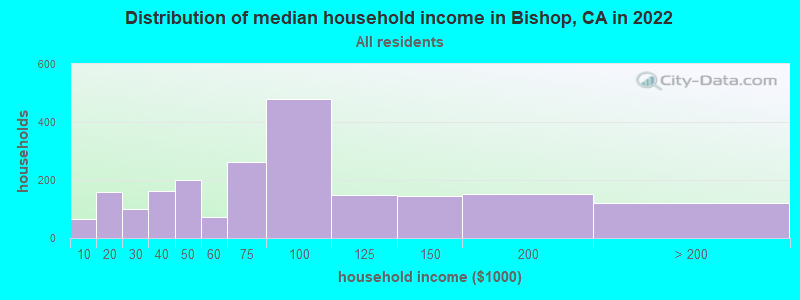


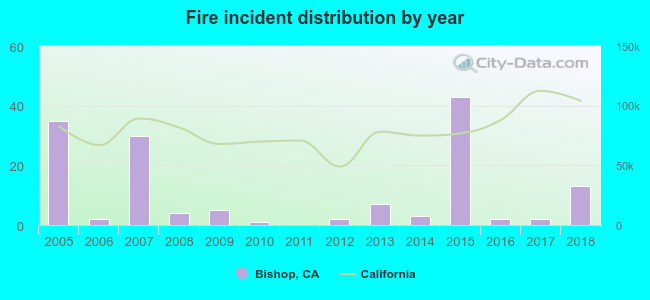 Based on the data from the years 2005 - 2018 the average number of fires per year is 11. The highest number of fires - 43 took place in 2015, and the least - 0 in 2011. The data has a declining trend.
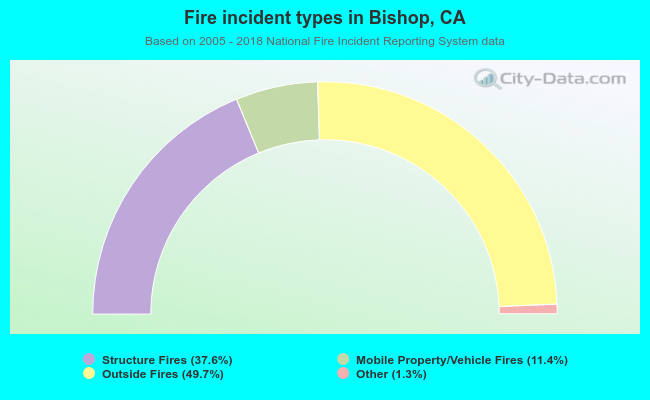 When looking into fire subcategories, the most reports belonged to: Outside Fires (49.7%), and Structure Fires (37.6%).