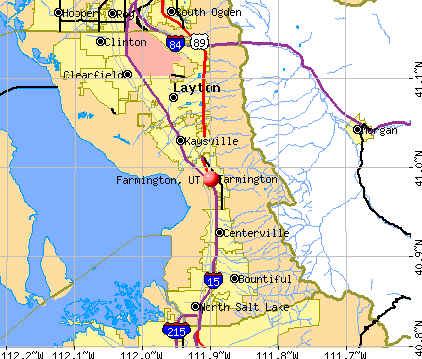
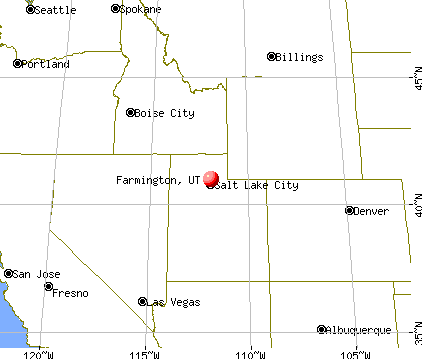
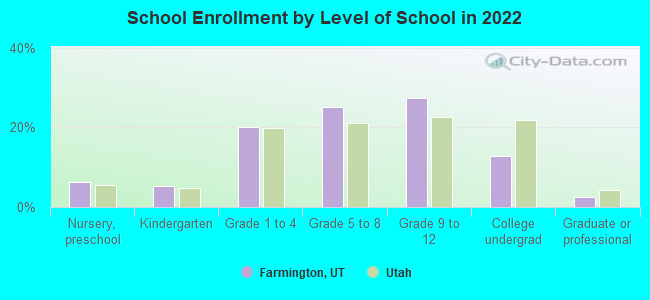
Farmington, Utah
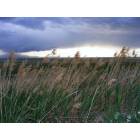
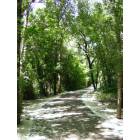
Farmington: Buffalo Trail (West Farmington)
Farmington: Buffalo Trail (West Farmington)
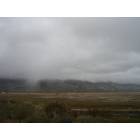
Farmington: Taken in the Farmington Bay Waterfowl Refuge.
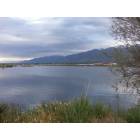
Farmington: Lagoon Trail
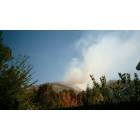
Farmington: The fire on Frances Peak from Farmington
- add
your
Submit your own pictures of this city and show them to the world
- OSM Map
- General Map
- Google Map
- MSN Map
Population change since 2000: +112.4%
| Males: 13,172 | |
| Females: 12,488 |
| Median resident age: | 30.7 years |
| Utah median age: | 32.1 years |
Zip codes: 84037.
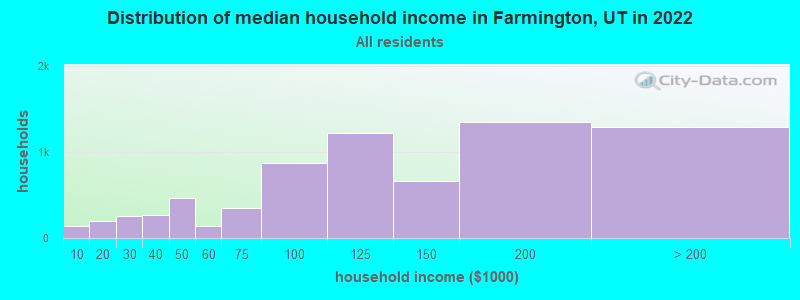
| Farmington: | $117,871 |
| UT: | $89,168 |
Estimated per capita income in 2022: $42,179 (it was $24,407 in 2000)
Farmington city income, earnings, and wages data
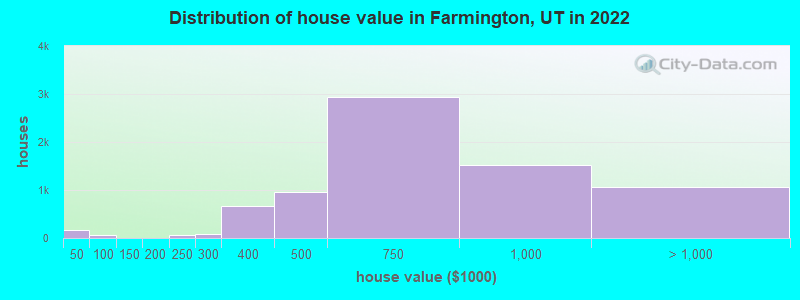
Estimated median house or condo value in 2022: $699,062 (it was $195,900 in 2000)
| Farmington: | $699,062 |
| UT: | $499,500 |
Mean prices in 2022: all housing units: $542,786; detached houses: $569,919; townhouses or other attached units: $417,045; in 2-unit structures: $316,176; in 3-to-4-unit structures: $320,740; in 5-or-more-unit structures: $373,951; mobile homes: $46,968
Median gross rent in 2022: $1,619.
(4.9% for White Non-Hispanic residents, 9.4% for Black residents, 4.3% for Hispanic or Latino residents, 25.0% for other race residents, 1.3% for two or more races residents)
Detailed information about poverty and poor residents in Farmington, UT
Compare current foreclosures near Farmington, UT:
| Photo | Address | Area | Beds / Baths | Price | Details |
|---|---|---|---|---|---|

|
#1
S 200 E
Farmington, UT 84025
|
2,028 sq. feet
|
- baths - beds |
show details | |

|
#2
N East Promontory
Farmington, UT 84025
|
- sq. feet
|
- baths - beds |
show details | |

|
#3
E 400 N # B
Farmington, UT 84025
|
1,674 sq. feet
|
- baths - beds |
show details | |

|
#4
S Mccall Ln
Farmington, UT 84025
|
- sq. feet
|
- baths - beds |
show details | |

|
#5
N 40 E, Apt 3
Farmington, UT 84025
|
- sq. feet
|
- baths - beds |
show details | |

|
#6
Broadway Apt D307
Farmington, UT 84025
|
- sq. feet
|
- baths - beds |
show details | |

|
#7
Broadway Apt B316
Farmington, UT 84025
|
- sq. feet
|
- baths - beds |
show details | |

|
#8
Broadway Apt D304
Farmington, UT 84025
|
- sq. feet
|
- baths - beds |
show details | |

|
#9
Farmington Xing
Farmington, UT 84025
|
1,496 sq. feet
|
- baths - beds |
show details | |

|
#10
N Jace Ln
Farmington, UT 84025
|
- sq. feet
|
- baths - beds |
show details |
| Photo | Address | Area | Beds / Baths | Price | Details |
|---|---|---|---|---|---|

|
#11
S 950 W
Farmington, UT 84025
|
1,911 sq. feet
|
- baths - beds |
show details | |

|
#12
W State St, Apt G206
Farmington, UT 84025
|
- sq. feet
|
- baths - beds |
show details | |

|
#13
Paulette Way
Farmington, UT 84025
|
1,639 sq. feet
|
- baths - beds |
show details | |

|
#14
E 1470 S
Farmington, UT 84025
|
980 sq. feet
|
- baths - beds |
show details | |

|
#15
Shetland Ln
Farmington, UT 84025
|
1,422 sq. feet
|
- baths - beds |
show details | |

|
#16
W State St
Farmington, UT 84025
|
1,624 sq. feet
|
- baths - beds |
show details | |

|
#17
Broadway Apt B220
Farmington, UT 84025
|
- sq. feet
|
- baths - beds |
show details | |

|
#18
S 650 W
Farmington, UT 84025
|
- sq. feet
|
- baths - beds |
show details | |

|
#19
N Station Pkwy, Apt G311
Farmington, UT 84025
|
- sq. feet
|
- baths - beds |
show details | |

|
#20
S 75 W
Farmington, UT 84025
|
1,418 sq. feet
|
- baths - beds |
show details |
| Photo | Address | Area | Beds / Baths | Price | Details |
|---|---|---|---|---|---|

|
#21
W Kenzie Way
Farmington, UT 84025
|
- sq. feet
|
- baths - beds |
show details | |

|
#22
S 250 E
Farmington, UT 84025
|
- sq. feet
|
- baths - beds |
show details | |

|
#23
N 100 E
Farmington, UT 84025
|
1,772 sq. feet
|
- baths - beds |
show details | |

|
#24
S 2900 W
Ogden, UT 84401
|
1,186 sq. feet
|
2 baths 3 beds |
show details | |

|
#25
W 3975 S Apt 28d
Ogden, UT 84401
|
1,133 sq. feet
|
2 baths 3 beds |
show details | |

|
#26
W 4925 S
Roy, UT 84067
|
3,668 sq. feet
|
1 baths 5 beds |
show details | |

|
#27
S 2825 W
Roy, UT 84067
|
979 sq. feet
|
2 baths 5 beds |
show details | |

|
#28
W 300 S
Salt Lake City, UT 84104
|
1,313 sq. feet
|
1 baths 3 beds |
show details | |

|
#29
E Canyon Dr
Ogden, UT 84405
|
1,595 sq. feet
|
2 baths 2 beds |
show details | |

|
#30
Foothill Dr
Ogden, UT 84403
|
3,219 sq. feet
|
3 baths 4 beds |
show details |
| Photo | Address | Area | Beds / Baths | Price | Details |
|---|---|---|---|---|---|

|
#31
W 4275 S
Ogden, UT 84401
|
2,154 sq. feet
|
3 baths 3 beds |
show details | |

|
#32
S 1500 W
Woods Cross, UT 84087
|
1,228 sq. feet
|
3 baths 5 beds |
show details | |

|
#33
W 500 S
Salt Lake City, UT 84104
|
644 sq. feet
|
1 baths 1 beds |
show details | |

|
#34
E 700 S
Salt Lake City, UT 84111
|
2,025 sq. feet
|
1 baths 4 beds |
show details | |

|
#35
N Mandalay Rd
Salt Lake City, UT 84116
|
1,805 sq. feet
|
2 baths 3 beds |
show details | |

|
#36
W 1700 N
Salt Lake City, UT 84116
|
1,404 sq. feet
|
2 baths 2 beds |
show details | |

|
#37
N Oakley St
Salt Lake City, UT 84116
|
1,520 sq. feet
|
1 baths 4 beds |
show details | |

|
#38
W 600 S
Salt Lake City, UT 84104
|
1,230 sq. feet
|
2 baths 4 beds |
show details | |

|
#39
W Arapahoe Ave
Salt Lake City, UT 84104
|
624 sq. feet
|
1 baths 1 beds |
show details | |

|
#40
Stallion Ln
Salt Lake City, UT 84116
|
1,412 sq. feet
|
2 baths 4 beds |
show details |
| Photo | Address | Area | Beds / Baths | Price | Details |
|---|---|---|---|---|---|

|
#41
W 900 N
Salt Lake City, UT 84116
|
2,661 sq. feet
|
2 baths 4 beds |
show details | |

|
#42
E 900 S
Salt Lake City, UT 84108
|
5,489 sq. feet
|
2 baths 7 beds |
show details | |

|
#43
S 1000 W
Salt Lake City, UT 84104
|
1,772 sq. feet
|
2 baths 4 beds |
show details | |

|
#44
E 700 S
Salt Lake City, UT 84102
|
1,917 sq. feet
|
2 baths 4 beds |
show details | |

|
#45
W 800 N
Salt Lake City, UT 84116
|
1,050 sq. feet
|
1 baths 4 beds |
show details | |

|
#46
N Morton Dr
Salt Lake City, UT 84116
|
1,777 sq. feet
|
2 baths 3 beds |
show details | |

|
#47
Sir Patrick Dr
Salt Lake City, UT 84116
|
2,471 sq. feet
|
4 baths 5 beds |
show details | |

|
#48
Wasatch Ave
Salt Lake City, UT 84104
|
1,508 sq. feet
|
2 baths 3 beds |
show details | |

|
#49
E 800 S, # E301
Salt Lake City, UT 84111
|
756 sq. feet
|
2 baths 2 beds |
show details | |

|
Check over 1 million property listings on Foreclosure.com!
|
browse all offers | |||


- 21,49686.2%White alone
- 1,6876.8%Hispanic
- 5752.3%Two or more races
- 4801.9%Asian alone
- 2020.8%Native Hawaiian and Other
Pacific Islander alone - 1830.7%Black alone
- 410.2%American Indian alone
- 540.2%Other race alone
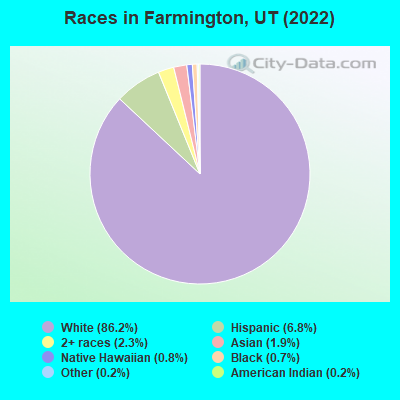
Races in Farmington detailed stats: ancestries, foreign born residents, place of birth
According to our research of Utah and other state lists, there were 21 registered sex offenders living in Farmington, Utah as of April 26, 2024.
The ratio of all residents to sex offenders in Farmington is 1,088 to 1.
The ratio of registered sex offenders to all residents in this city is much lower than the state average.
Type |
2009 |
2010 |
2011 |
2012 |
2013 |
2014 |
2015 |
2016 |
2017 |
2018 |
2019 |
2020 |
2021 |
|---|---|---|---|---|---|---|---|---|---|---|---|---|---|
| Murders (per 100,000) | 0 (0.0) | 0 (0.0) | 0 (0.0) | 0 (0.0) | 0 (0.0) | 0 (0.0) | 0 (0.0) | 0 (0.0) | 0 (0.0) | 0 (0.0) | 0 (0.0) | 0 (0.0) | 0 (0.0) |
| Rapes (per 100,000) | 3 (16.9) | 1 (5.5) | 2 (10.7) | 3 (15.9) | 6 (27.8) | 9 (40.1) | 6 (25.9) | 6 (25.5) | 5 (20.8) | 7 (28.0) | 9 (35.4) | 10 (38.1) | 16 (61.0) |
| Robberies (per 100,000) | 0 (0.0) | 1 (5.5) | 0 (0.0) | 0 (0.0) | 0 (0.0) | 1 (4.5) | 1 (4.3) | 3 (12.8) | 2 (8.3) | 1 (4.0) | 0 (0.0) | 4 (15.2) | 2 (7.6) |
| Assaults (per 100,000) | 0 (0.0) | 3 (16.4) | 5 (26.8) | 3 (15.9) | 9 (41.7) | 6 (26.7) | 9 (38.8) | 5 (21.3) | 8 (33.3) | 8 (32.0) | 10 (39.4) | 5 (19.0) | 8 (30.5) |
| Burglaries (per 100,000) | 31 (174.3) | 28 (153.2) | 23 (123.5) | 34 (180.5) | 42 (194.6) | 33 (146.9) | 63 (271.6) | 45 (191.4) | 38 (158.1) | 39 (156.0) | 29 (114.1) | 35 (133.3) | 33 (125.9) |
| Thefts (per 100,000) | 130 (730.8) | 139 (760.6) | 209 (1,122) | 264 (1,402) | 360 (1,668) | 223 (992.4) | 280 (1,207) | 406 (1,727) | 268 (1,115) | 245 (979.8) | 296 (1,165) | 218 (830.3) | 261 (995.5) |
| Auto thefts (per 100,000) | 10 (56.2) | 7 (38.3) | 11 (59.1) | 19 (100.9) | 27 (125.1) | 20 (89.0) | 37 (159.5) | 18 (76.6) | 32 (133.1) | 23 (92.0) | 26 (102.3) | 21 (80.0) | 25 (95.4) |
| Arson (per 100,000) | 0 (0.0) | 0 (0.0) | 3 (16.1) | 5 (26.5) | 3 (13.9) | 2 (8.9) | 2 (8.6) | 8 (34.0) | 0 (0.0) | 4 (16.0) | 1 (3.9) | 0 (0.0) | 1 (3.8) |
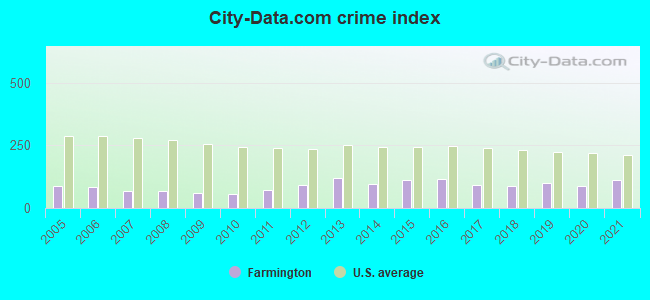
| City-Data.com crime index | 59.4 | 53.5 | 72.2 | 92.7 | 120.9 | 95.8 | 109.8 | 117.1 | 92.1 | 87.5 | 99.0 | 87.8 | 113.5 |
The City-Data.com crime index weighs serious crimes and violent crimes more heavily. Higher means more crime, U.S. average is 246.1. It adjusts for the number of visitors and daily workers commuting into cities.
Crime rate in Farmington detailed stats: murders, rapes, robberies, assaults, burglaries, thefts, arson
Full-time law enforcement employees in 2021, including police officers: 25 (22 officers - 21 male; 1 female).
| Officers per 1,000 residents here: | 0.84 |
| Utah average: | 1.67 |
 Recent articles from our blog. Our writers, many of them Ph.D. graduates or candidates, create easy-to-read articles on a wide variety of topics.

 | Farmington/Bountiful vs sun crest/South Draper areas (2 replies) |
| Draper/Sandy Area vs Farmington/Kaysville, etc. Area (17 replies) |
| Wondering about Farmington (3 replies) |
| Utility Costs in Layton, Kaysville, Farmington, etc? (9 replies) |
| Relocating to Ogden from Nashville Tn (24 replies) |
| Farmington to KUC mine in winter? (6 replies) |
Latest news from Farmington, UT collected exclusively by city-data.com from local newspapers, TV, and radio stations
Ancestries: English (34.3%), European (9.4%), American (7.3%), German (6.2%), British (3.2%), Danish (3.0%).
Current Local Time: MST time zone
Incorporated on 12/15/1892
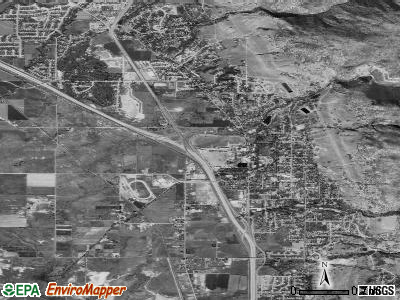
Elevation: 4302 feet
Land area: 7.76 square miles.
Population density: 3,309 people per square mile (average).
1,169 residents are foreign born (1.4% Asia, 1.1% Europe, 1.0% Latin America, 0.5% Oceania).
| This city: | 4.7% |
| Utah: | 8.4% |
Median real estate property taxes paid for housing units with mortgages in 2022: $3,283 (0.5%)
Median real estate property taxes paid for housing units with no mortgage in 2022: $3,088 (0.4%)
Nearest city with pop. 50,000+: South Davis, UT (5.9 miles  , pop. 89,128).
Nearest city with pop. 200,000+: Northeast Jefferson, CO (368.0 miles , pop. 450,166).
Nearest city with pop. 1,000,000+: Phoenix, AZ (516.0 miles , pop. 1,321,045).
Nearest cities:
), ), ), )Latitude: 40.99 N, Longitude: 111.90 W
Daytime population change due to commuting: +858 (+3.4%)
Workers who live and work in this city: 4,791 (43.9%)
Area code: 801
Farmington tourist attractions:
Farmington, Utah accommodation & food services, waste management - Economy and Business Data
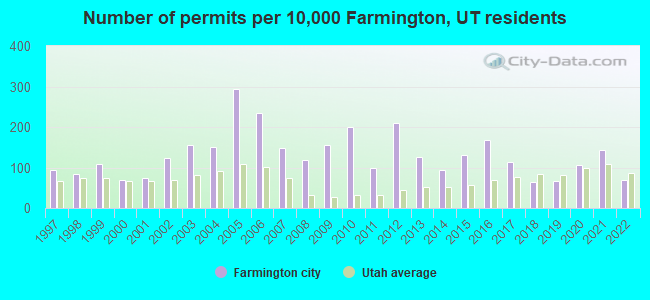
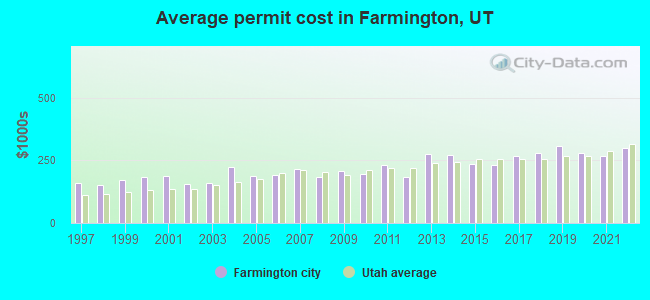
Single-family new house construction building permits:
- 2022: 85 buildings, average cost: $297,700
- 2021: 172 buildings, average cost: $267,500
- 2020: 128 buildings, average cost: $279,900
- 2019: 80 buildings, average cost: $306,300
- 2018: 76 buildings, average cost: $280,800
- 2017: 137 buildings, average cost: $267,300
- 2016: 202 buildings, average cost: $232,600
- 2015: 160 buildings, average cost: $235,200
- 2014: 115 buildings, average cost: $272,700
- 2013: 154 buildings, average cost: $273,600
- 2012: 252 buildings, average cost: $182,900
- 2011: 118 buildings, average cost: $233,300
- 2010: 242 buildings, average cost: $195,500
- 2009: 189 buildings, average cost: $205,500
- 2008: 144 buildings, average cost: $182,100
- 2007: 180 buildings, average cost: $214,200
- 2006: 284 buildings, average cost: $192,400
- 2005: 355 buildings, average cost: $188,300
- 2004: 183 buildings, average cost: $222,800
- 2003: 189 buildings, average cost: $161,000
- 2002: 148 buildings, average cost: $155,800
- 2001: 91 buildings, average cost: $187,100
- 2000: 82 buildings, average cost: $184,800
- 1999: 130 buildings, average cost: $171,600
- 1998: 102 buildings, average cost: $152,100
- 1997: 115 buildings, average cost: $157,500
| Here: | 2.0% |
| Utah: | 2.5% |
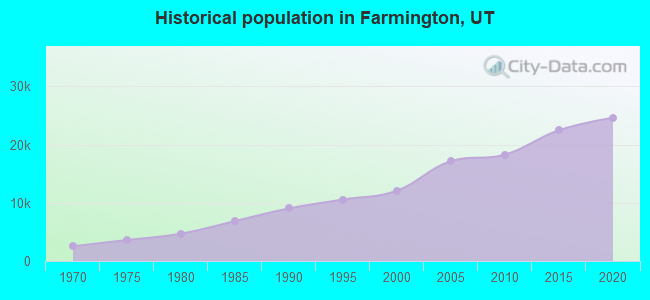
Population change in the 1990s: +2,575 (+27.1%).
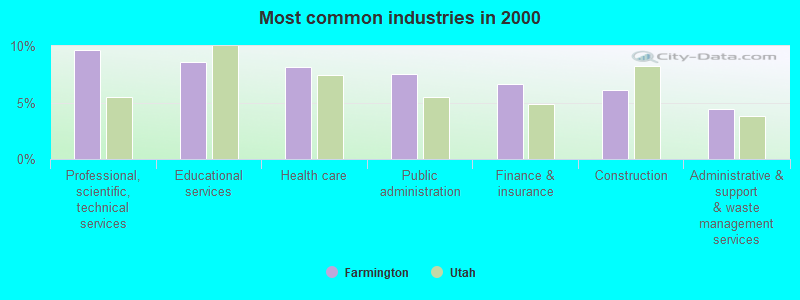
- Professional, scientific, technical services (9.6%)
- Educational services (8.6%)
- Health care (8.2%)
- Public administration (7.5%)
- Finance & insurance (6.6%)
- Construction (6.1%)
- Administrative & support & waste management services (4.4%)
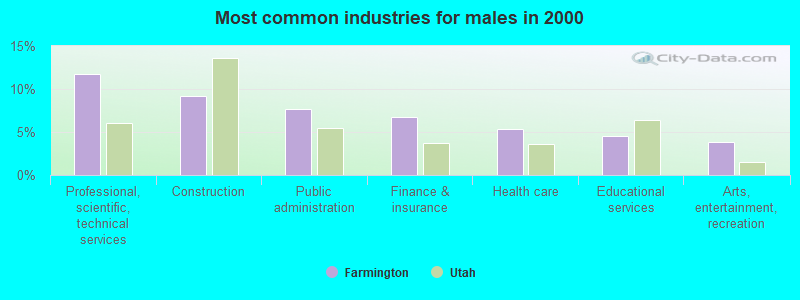
- Professional, scientific, technical services (11.8%)
- Construction (9.2%)
- Public administration (7.7%)
- Finance & insurance (6.8%)
- Health care (5.4%)
- Educational services (4.5%)
- Arts, entertainment, recreation (3.8%)
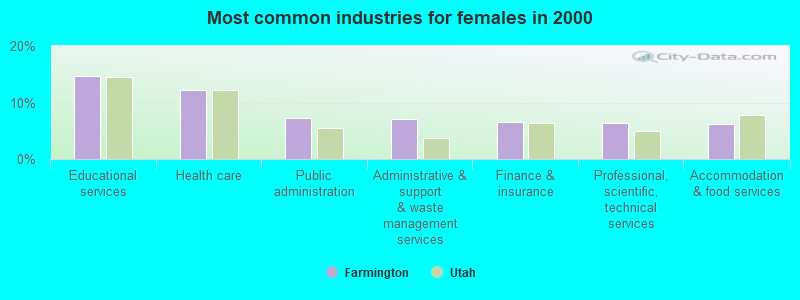
- Educational services (14.6%)
- Health care (12.2%)
- Public administration (7.3%)
- Administrative & support & waste management services (7.1%)
- Finance & insurance (6.5%)
- Professional, scientific, technical services (6.4%)
- Accommodation & food services (6.2%)
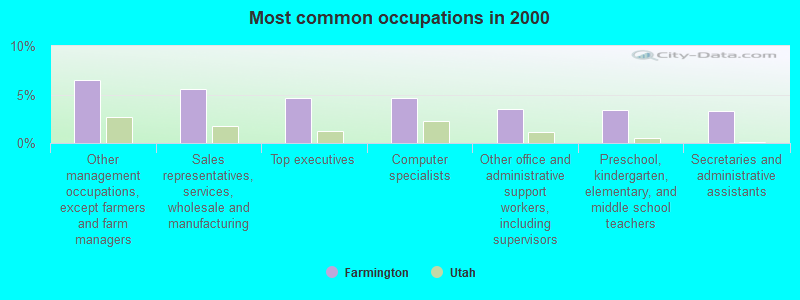
- Other management occupations, except farmers and farm managers (6.5%)
- Sales representatives, services, wholesale and manufacturing (5.6%)
- Top executives (4.6%)
- Computer specialists (4.6%)
- Other office and administrative support workers, including supervisors (3.5%)
- Preschool, kindergarten, elementary, and middle school teachers (3.4%)
- Secretaries and administrative assistants (3.3%)
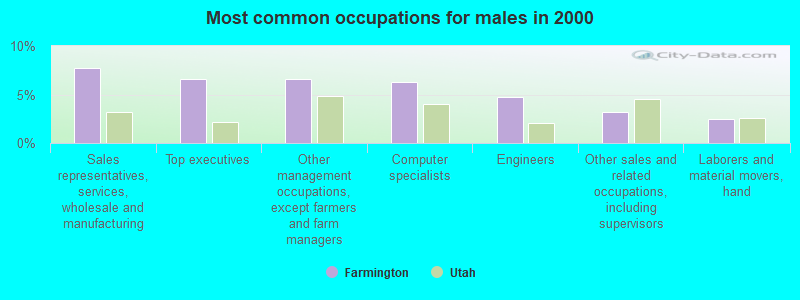
- Sales representatives, services, wholesale and manufacturing (7.7%)
- Top executives (6.6%)
- Other management occupations, except farmers and farm managers (6.6%)
- Computer specialists (6.3%)
- Engineers (4.7%)
- Other sales and related occupations, including supervisors (3.2%)
- Laborers and material movers, hand (2.4%)
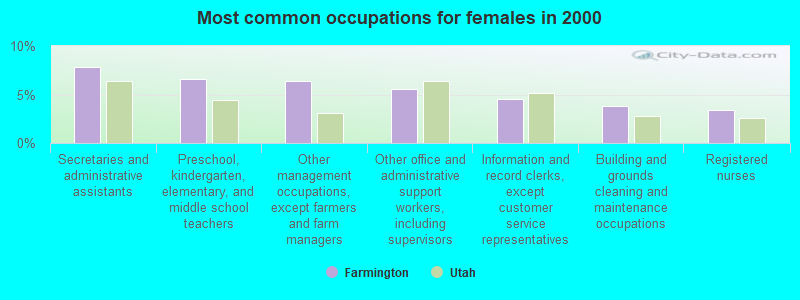
- Secretaries and administrative assistants (7.9%)
- Preschool, kindergarten, elementary, and middle school teachers (6.6%)
- Other management occupations, except farmers and farm managers (6.4%)
- Other office and administrative support workers, including supervisors (5.6%)
- Information and record clerks, except customer service representatives (4.6%)
- Building and grounds cleaning and maintenance occupations (3.8%)
- Registered nurses (3.4%)
Average climate in Farmington, Utah
Based on data reported by over 4,000 weather stations


|
|


(lower is better)
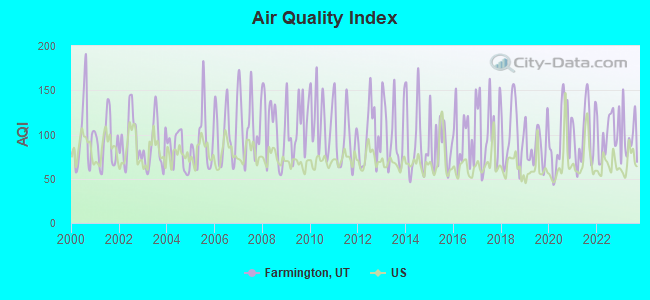
Air Quality Index (AQI) level in 2023 was 96.2. This is worse than average.
| City: | 96.2 |
| U.S.: | 72.6 |
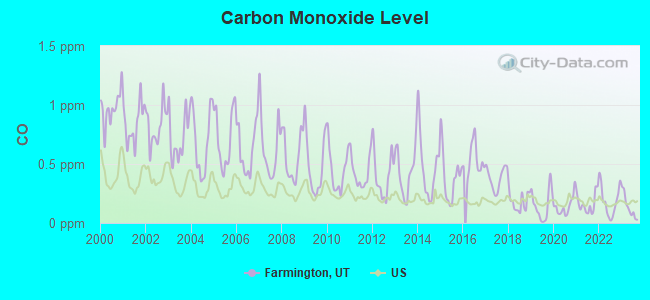
Carbon Monoxide (CO) [ppm] level in 2023 was 0.136. This is significantly better than average. Closest monitor was 7.0 miles away from the city center.
| City: | 0.136 |
| U.S.: | 0.251 |
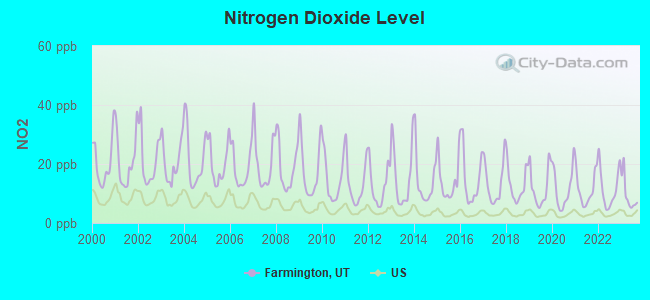
Nitrogen Dioxide (NO2) [ppb] level in 2023 was 9.45. This is significantly worse than average. Closest monitor was 5.8 miles away from the city center.
| City: | 9.45 |
| U.S.: | 5.11 |
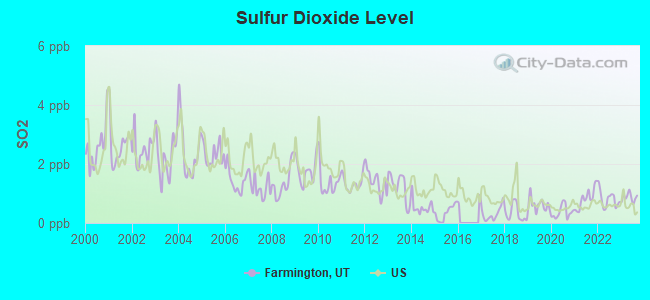
Sulfur Dioxide (SO2) [ppb] level in 2023 was 0.872. This is significantly better than average. Closest monitor was 5.8 miles away from the city center.
| City: | 0.872 |
| U.S.: | 1.515 |
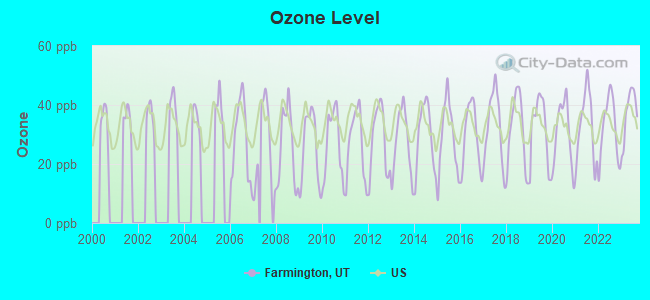
Ozone [ppb] level in 2023 was 37.5. This is about average. Closest monitor was 2.2 miles away from the city center.
| City: | 37.5 |
| U.S.: | 33.3 |
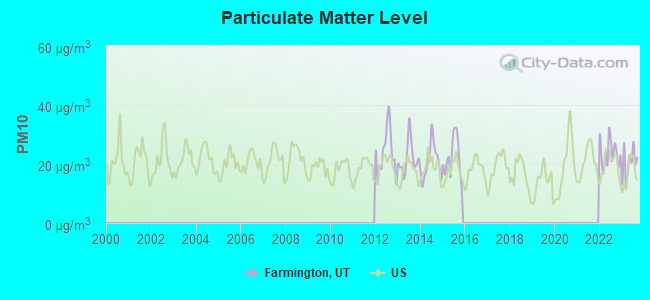
Particulate Matter (PM10) [µg/m3] level in 2023 was 20.3. This is about average. Closest monitor was 5.8 miles away from the city center.
| City: | 20.3 |
| U.S.: | 19.2 |
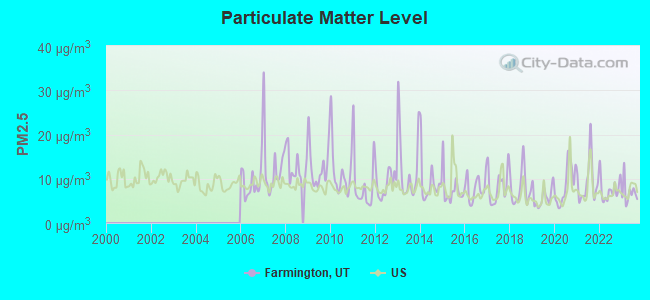
Particulate Matter (PM2.5) [µg/m3] level in 2023 was 6.88. This is about average. Closest monitor was 5.8 miles away from the city center.
| City: | 6.88 |
| U.S.: | 8.11 |
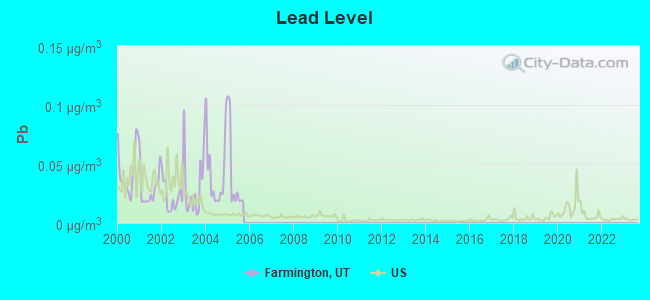
Lead (Pb) [µg/m3] level in 2005 was 0.0394. This is significantly worse than average. Closest monitor was 5.8 miles away from the city center.
| City: | 0.0394 |
| U.S.: | 0.0093 |
Earthquake activity:
Farmington-area historical earthquake activity is significantly above Utah state average. It is 2130% greater than the overall U.S. average.On 8/18/1959 at 06:37:13, a magnitude 7.7 (7.7 UK, Class: Major, Intensity: VIII - XII) earthquake occurred 255.5 miles away from Farmington center, causing $26,000,000 total damage
On 10/3/1915 at 06:52:48, a magnitude 7.6 (7.6 UK) earthquake occurred 295.4 miles away from the city center
On 10/28/1983 at 14:06:06, a magnitude 7.3 (6.2 MB, 7.3 MS, 7.0 MW) earthquake occurred 234.7 miles away from the city center, causing 2 deaths (2 shaking deaths) and 3 injuries, causing $15,000,000 total damage
On 3/28/1975 at 02:31:05, a magnitude 6.2 (6.1 MB, 6.0 MS, 6.2 ML, Class: Strong, Intensity: VII - IX) earthquake occurred 76.9 miles away from Farmington center
On 3/18/2020 at 13:09:31, a magnitude 5.7 (5.7 MW, Depth: 7.4 mi, Class: Moderate, Intensity: VI - VII) earthquake occurred 18.8 miles away from Farmington center
On 12/21/1932 at 06:10:09, a magnitude 7.2 (7.2 UK) earthquake occurred 370.7 miles away from the city center
Magnitude types: body-wave magnitude (MB), local magnitude (ML), surface-wave magnitude (MS), moment magnitude (MW)
Natural disasters:
The number of natural disasters in Davis County (7) is smaller than the US average (15).Major Disasters (Presidential) Declared: 3
Emergencies Declared: 2
Causes of natural disasters: Storms: 3, Floods: 2, Landslides: 2, Drought: 1, Earthquake: 1, Hurricane: 1, Mudslide: 1, Other: 1 (Note: some incidents may be assigned to more than one category).

Hospitals and medical centers in Farmington:
Other hospitals and medical centers near Farmington:
- FARMINGTON BAY DIALYSIS CENTER (Dialysis Facility, about 6 miles away; LAYTON, UT)
- FAMILY FIRST HOME HEALTH AND HOSPICE, INC (Hospital, about 6 miles away; BOUNTIFUL, UT)
- THATCHER BROOK HOME HEALTH CARE, INC (Home Health Center, about 7 miles away; EAST LAYTON, UT)
- AVALON CARE CENTER-BOUNTIFUL (Nursing Home, about 7 miles away; BOUNTIFUL, UT)
- BOUNTIFUL HEALTH CARE AND REHABILITATION (Nursing Home, about 7 miles away; BOUNTIFUL, UT)
- NORTH SIDE CENTER (Hospital, about 7 miles away; BOUNTIFUL, UT)
- RENEW HOME HEALTH INC (Home Health Center, about 7 miles away; BOUNTIFUL, UT)
Amtrak station near Farmington:
Colleges/universities with over 2000 students nearest to Farmington:
- Weber State University (about 15 miles; Ogden, UT; Full-time enrollment: 17,655)
- Latter-day Saints Business College (about 15 miles; Salt Lake City, UT; FT enrollment: 2,059)
- University of Utah (about 16 miles; Salt Lake City, UT; FT enrollment: 28,454)
- Westminster College (about 18 miles; Salt Lake City, UT; FT enrollment: 2,870)
- Western Governors University (about 21 miles; Salt Lake City, UT; FT enrollment: 31,481)
- Salt Lake Community College (about 22 miles; Salt Lake City, UT; FT enrollment: 20,797)
- Stevens-Henager College-Murray (about 23 miles; Murray, UT; FT enrollment: 6,395)
Public high schools in Farmington:
- FARMINGTON JR HIGH (Students: 1,057, Location: 150 S 200 W, Grades: 7-9)
- STAR TRANSITION (Location: 97 S 200 EAST, Grades: 7-12)
Public elementary/middle schools in Farmington:
- EAGLE BAY SCHOOL (Students: 801, Location: 100 N 1933 W, Grades: PK-6)
- KNOWLTON SCHOOL (Students: 693, Location: 801 SHEPARD LANE, Grades: PK-6)
- FARMINGTON SCHOOL (Students: 504, Location: 50 W 200 S, Grades: KG-6)
- ASCENT ACADEMIES OF UTAH FARMINGTON (Location: 22 SOUTH 650 WEST, Grades: KG-8, Charter school)
- ONLINE SCHOOL (Location: 45 E STATE ST, Grades: KG-8)
Points of interest:
Notable locations in Farmington: Utah State Experiment Farm (A), Farmington Siding (B), Farmington City Fire Department (C). Display/hide their locations on the map
Shopping Center: Shepard Creek Towne Center Shopping Center (1). Display/hide its location on the map
Churches in Farmington include: The Church of Jesus Christ of Latter Day Saints (A), Interfaith Christian Center (B), The Church of Jesus Christ of Latter Day Saints (C). Display/hide their locations on the map
Cemetery: Farmington City Cemetery (1). Display/hide its location on the map
Creeks: Rudd Creek (A), Davis Creek (B), Steed Creek (C), Shepard Creek (D). Display/hide their locations on the map
Parks in Farmington include: Lagoo (1), Pioneer Village Camp (2). Display/hide their locations on the map
Tourist attractions: S & S Shortline Train Park & Museum (577 North 1525 West), Lagoon's RV Park & Campground (Amusement & Theme Parks; 375 Lagoon Drive), American Experience (Tours & Charters; 240 South 200 West).
Courts: Davis County Of (28 East State Street), Davis County - Attorney- Juvenile Court Division (28 East State Street), Courts - Juvenile Court- Farmington (800 West State Street), Utah State - Courts- Second District Court- Farmington Dept- Child Sup (800 West State Street), Davis County - Court-Justice Court (800 West State Street).
Birthplace of: Daniel Summerhays - Professional golfer, John R. Lasater - Soilder, Obert C. Tanner - Businessman, Ryan Prince - 2005 NFL player (St. Louis Rams, born: May 16, 1977), Milton H. Welling - Congressman, Annette Richardson Dinwoodey - Centenarian, Henry McBride (politician) - Politician, Robert L. Rice - Philanthropist.
Drinking water stations with addresses in Farmington and their reported violations in the past:
LAGOON INVESTMENT COMPANY (Population served: 100, Groundwater):Past monitoring violations:
- One regular monitoring violation
| This city: | 3.4 people |
| Utah: | 3.1 people |
| This city: | 85.2% |
| Whole state: | 75.2% |
| This city: | 2.2% |
| Whole state: | 4.6% |
Likely homosexual households (counted as self-reported same-sex unmarried-partner households)
- Lesbian couples: 0.3% of all households
- Gay men: 0.2% of all households
People in group quarters in Farmington in 2010:
- 578 people in local jails and other municipal confinement facilities
- 97 people in correctional residential facilities
- 40 people in correctional facilities intended for juveniles
62 people in unknown juvenile institutions in 2000
Banks with branches in Farmington (2011 data):
- JPMorgan Chase Bank, National Association: Farmington Station Park Banking Cent at 100 North Station Pkwy, branch established on 2011/09/13. Info updated 2011/11/10: Bank assets: $1,811,678.0 mil, Deposits: $1,190,738.0 mil, headquarters in Columbus, OH, positive income, International Specialization, 5577 total offices, Holding Company: Jpmorgan Chase & Co.
- Zions First National Bank: Farmington Branch at 1663 North Main, branch established on 1988/06/29. Info updated 2006/11/03: Bank assets: $17,531.3 mil, Deposits: $14,905.3 mil, headquarters in Salt Lake City, UT, positive income, Commercial Lending Specialization, 151 total offices, Holding Company: Zions Bancorporation
- U.S. Bank National Association: Farmington Smith's Branch at 1316 North Highway 89, branch established on 2009/02/20. Info updated 2012/01/30: Bank assets: $330,470.8 mil, Deposits: $236,091.5 mil, headquarters in Cincinnati, OH, positive income, 3121 total offices, Holding Company: U.S. Bancorp
- Wells Fargo Bank, National Association: Farmington Branch at 12 West State Street, branch established on 1892/03/30. Info updated 2011/04/05: Bank assets: $1,161,490.0 mil, Deposits: $905,653.0 mil, headquarters in Sioux Falls, SD, positive income, 6395 total offices, Holding Company: Wells Fargo & Company
For population 15 years and over in Farmington:
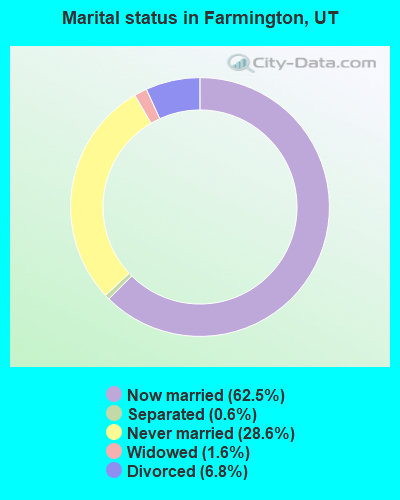
- Never married: 28.6%
- Now married: 62.5%
- Separated: 0.6%
- Widowed: 1.6%
- Divorced: 6.8%
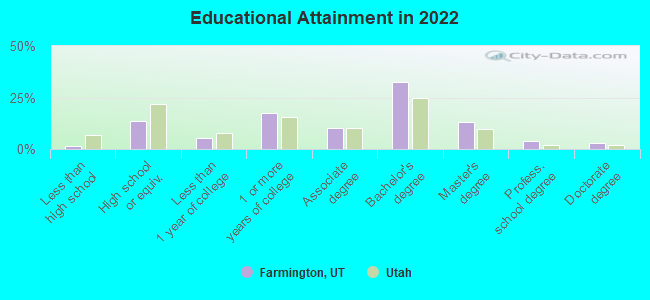
For population 25 years and over in Farmington:
- High school or higher: 98.3%
- Bachelor's degree or higher: 49.6%
- Graduate or professional degree: 17.8%
- Unemployed: 3.2%
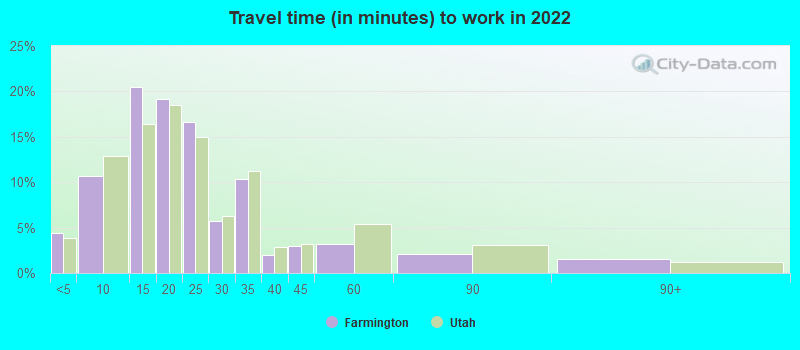
- Mean travel time to work (commute): 15.7 minutes
| Here: | 8.7 |
| Utah average: | 10.9 |
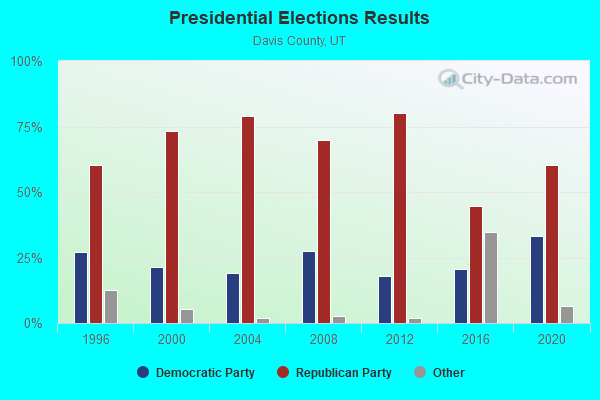
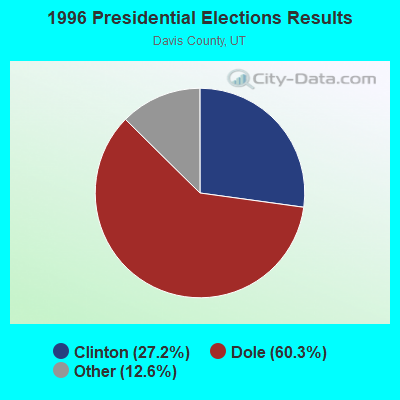
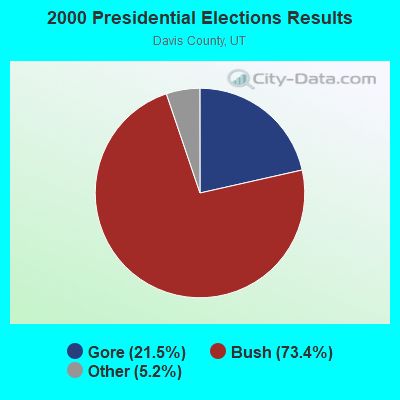
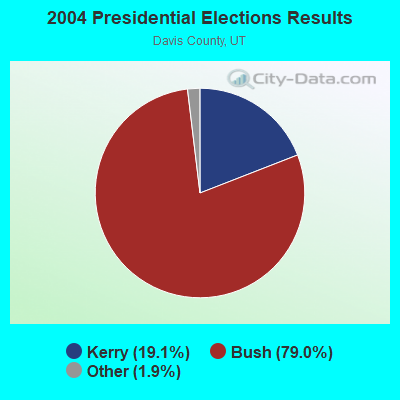
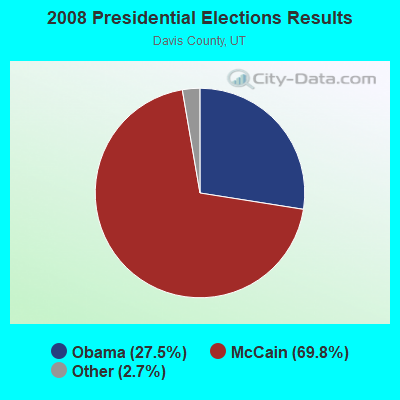
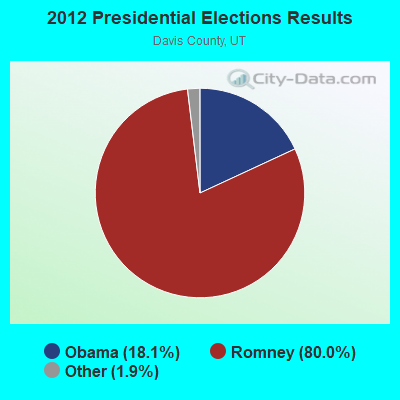
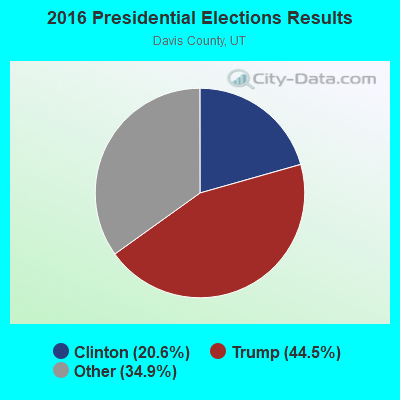
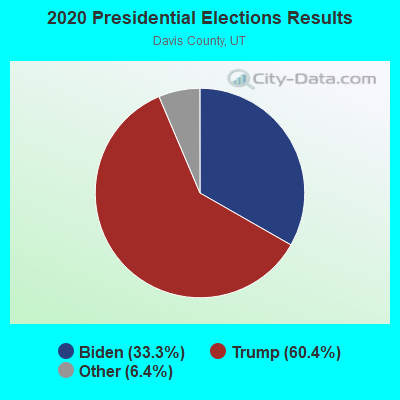
Graphs represent county-level data. Detailed 2008 Election Results
Religion statistics for Farmington, UT (based on Davis County data)
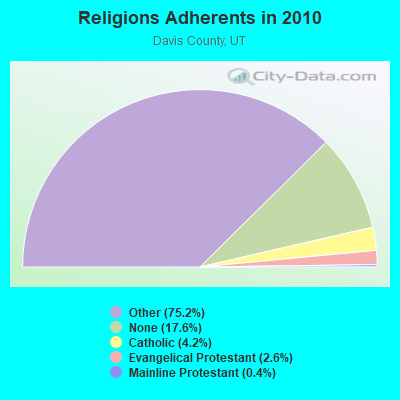
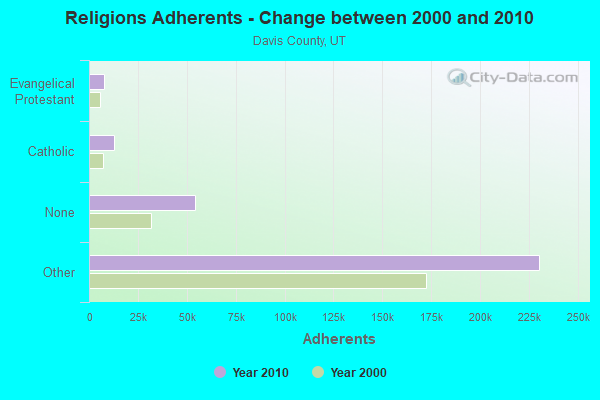
| Religion | Adherents | Congregations |
|---|---|---|
| Other | 230,405 | 556 |
| Catholic | 12,782 | 1 |
| Evangelical Protestant | 7,928 | 34 |
| Mainline Protestant | 1,135 | 7 |
| Black Protestant | 200 | 1 |
| None | 54,029 | - |
Food Environment Statistics:
| This county: | 0.87 / 10,000 pop. |
| Utah: | 1.37 / 10,000 pop. |
| Davis County: | 0.21 / 10,000 pop. |
| Utah: | 0.18 / 10,000 pop. |
| This county: | 0.21 / 10,000 pop. |
| State: | 0.41 / 10,000 pop. |
| Davis County: | 1.95 / 10,000 pop. |
| State: | 2.82 / 10,000 pop. |
| This county: | 3.68 / 10,000 pop. |
| State: | 5.09 / 10,000 pop. |
| This county: | 5.4% |
| State: | 6.3% |
| This county: | 23.4% |
| State: | 23.6% |
Health and Nutrition:
| Here: | 50.5% |
| Utah: | 48.9% |
| Farmington: | 49.7% |
| State: | 47.0% |
| Here: | 28.5 |
| Utah: | 28.4 |
| This city: | 21.7% |
| Utah: | 21.0% |
| Here: | 9.4% |
| Utah: | 10.3% |
| Here: | 6.8 |
| Utah: | 6.8 |
| Farmington: | 33.5% |
| State: | 31.9% |
| This city: | 59.3% |
| State: | 57.4% |
| Here: | 80.5% |
| Utah: | 80.1% |
More about Health and Nutrition of Farmington, UT Residents
| Local government employment and payroll (March 2022) | |||||
| Function | Full-time employees | Monthly full-time payroll | Average yearly full-time wage | Part-time employees | Monthly part-time payroll |
|---|---|---|---|---|---|
| Police Protection - Officers | 21 | $120,134 | $68,648 | 0 | $0 |
| Parks and Recreation | 15 | $67,339 | $53,871 | 41 | $15,262 |
| Firefighters | 15 | $98,478 | $78,782 | 11 | $10,242 |
| Other Government Administration | 11 | $83,338 | $90,914 | 9 | $10,752 |
| Streets and Highways | 8 | $49,796 | $74,694 | 0 | $0 |
| Water Supply | 7 | $40,583 | $69,571 | 0 | $0 |
| Financial Administration | 4 | $25,917 | $77,751 | 0 | $0 |
| Police - Other | 3 | $14,594 | $58,376 | 17 | $8,403 |
| Other and Unallocable | 2 | $17,338 | $104,028 | 0 | $0 |
| Solid Waste Management | 1 | $5,196 | $62,352 | 0 | $0 |
| Sewerage | 1 | $5,339 | $64,068 | 0 | $0 |
| Fire - Other | 0 | $0 | 1 | $4,215 | |
| Totals for Government | 88 | $528,051 | $72,007 | 79 | $48,876 |
Farmington government finances - Expenditure in 2021 (per resident):
- Construction - Regular Highways: $3,098,000 ($120.73)
Sewerage: $770,000 ($30.01)
Water Utilities: $404,000 ($15.74)
Housing and Community Development: $197,000 ($7.68)
Parks and Recreation: $24,000 ($0.94)
- Current Operations - Sewerage: $2,506,000 ($97.66)
Police Protection: $2,318,000 ($90.34)
Parks and Recreation: $2,234,000 ($87.06)
Central Staff Services: $1,825,000 ($71.12)
General - Other: $1,619,000 ($63.09)
Water Utilities: $1,464,000 ($57.05)
Solid Waste Management: $1,405,000 ($54.75)
Regular Highways: $1,008,000 ($39.28)
Local Fire Protection: $912,000 ($35.54)
General Public Buildings: $608,000 ($23.69)
Housing and Community Development: $436,000 ($16.99)
Protective Inspection and Regulation - Other: $429,000 ($16.72)
Health - Other: $273,000 ($10.64)
Transit Utilities: $6,000 ($0.23)
- General - Interest on Debt: $156,000 ($6.08)
- Intergovernmental to Local - Other - Housing and Community Development: $2,666,000 ($103.90)
- Other Capital Outlay - Housing and Community Development: $3,008,000 ($117.23)
Transit Utilities: $694,000 ($27.05)
Regular Highways: $462,000 ($18.00)
Parks and Recreation: $388,000 ($15.12)
General - Other: $312,000 ($12.16)
General Public Building: $170,000 ($6.63)
Police Protection: $44,000 ($1.71)
Solid Waste Management: $35,000 ($1.36)
Health - Other: $24,000 ($0.94)
Water Utilities: $19,000 ($0.74)
Sewerage: $12,000 ($0.47)
- Total Salaries and Wages: $6,357,000 ($247.74)
Farmington government finances - Revenue in 2021 (per resident):
- Charges - Sewerage: $3,239,000 ($126.23)
Other: $1,626,000 ($63.37)
Solid Waste Management: $1,616,000 ($62.98)
Parks and Recreation: $1,336,000 ($52.07)
Regular Highways: $538,000 ($20.97)
Miscellaneous Commercial Activities: $32,000 ($1.25)
- Local Intergovernmental - Housing and Community Development: $344,000 ($13.41)
Other: $144,000 ($5.61)
- Miscellaneous - General Revenue - Other: $249,000 ($9.70)
Interest Earnings: $177,000 ($6.90)
Fines and Forfeits: $168,000 ($6.55)
Rents: $167,000 ($6.51)
Donations From Private Sources: $36,000 ($1.40)
Sale of Property: $22,000 ($0.86)
- Revenue - Water Utilities: $2,552,000 ($99.45)
- State Intergovernmental - Other: $2,866,000 ($111.69)
- Tax - General Sales and Gross Receipts: $4,982,000 ($194.15)
Public Utilities Sales: $1,339,000 ($52.18)
Property: $763,000 ($29.73)
Other License: $742,000 ($28.92)
Other Selective Sales: $433,000 ($16.87)
Occupation and Business License - Other: $75,000 ($2.92)
Farmington government finances - Debt in 2021 (per resident):
- Long Term Debt - Outstanding Nonguaranteed - Industrial Revenue: $2,500,000 ($97.43)
Beginning Outstanding - Public Debt for Private Purpose: $2,500,000 ($97.43)
Beginning Outstanding - Unspecified Public Purpose: $2,383,000 ($92.87)
Retired Unspecified Public Purpose: $1,711,000 ($66.68)
Outstanding Unspecified Public Purpose: $673,000 ($26.23)
Farmington government finances - Cash and Securities in 2021 (per resident):
- Bond Funds - Cash and Securities: $4,523,000 ($176.27)
- Other Funds - Cash and Securities: $18,964,000 ($739.05)
- Sinking Funds - Cash and Securities: $2,530,000 ($98.60)
9.07% of this county's 2021 resident taxpayers lived in other counties in 2020 ($67,737 average adjusted gross income)
| Here: | 9.07% |
| Utah average: | 7.95% |
0.10% of residents moved from foreign countries ($694 average AGI)
Davis County: 0.10% Utah average: 0.02%
Top counties from which taxpayers relocated into this county between 2020 and 2021:
| from Salt Lake County, UT | |
| from Weber County, UT | |
| from Utah County, UT |
8.88% of this county's 2020 resident taxpayers moved to other counties in 2021 ($65,750 average adjusted gross income)
| Here: | 8.88% |
| Utah average: | 7.39% |
0.08% of residents moved to foreign countries ($598 average AGI)
Davis County: 0.08% Utah average: 0.02%
Top counties to which taxpayers relocated from this county between 2020 and 2021:
| to Weber County, UT | |
| to Salt Lake County, UT | |
| to Utah County, UT |
| Businesses in Farmington, UT | ||||
| Name | Count | Name | Count | |
|---|---|---|---|---|
| Arby's | 1 | Papa John's Pizza | 1 | |
| Burger King | 1 | U-Haul | 1 | |
| Kroger | 1 | UPS | 2 | |
Strongest AM radio stations in Farmington:
- KALL (700 AM; 50 kW; NORTH SALT LAKE CITY, UT; Owner: CITICASTERS LICENSES, L.P.)
- KIQN (1010 AM; 50 kW; TOOELE, UT)
- KSL (1160 AM; 50 kW; SALT LAKE CITY, UT; Owner: BONNEVILLE HOLDING COMPANY)
- KLO (1430 AM; 10 kW; OGDEN, UT; Owner: KLO BROADCASTING CO.)
- KSGO (1600 AM; 5 kW; CENTERVILLE, UT; Owner: UTAH SPANISH RADIO CORP)
- KANN (1120 AM; 10 kW; ROY, UT; Owner: FAITH COMMUNICATIONS CORPORATION)
- KZNS (1280 AM; 10 kW; SALT LAKE CITY, UT; Owner: SIMMONS-SLC, LS, LLC)
- KNRS (570 AM; 5 kW; SALT LAKE CITY, UT; Owner: CITICASTERS LICENSES, L.P.)
- KTKK (630 AM; 10 kW; SANDY, UT; Owner: UNITED BROADCASTING COMPANY)
- KBEE (860 AM; 10 kW; SALT LAKE CITY, UT; Owner: CITADEL BROADCASTING COMPANY)
- KBJA (1640 AM; 10 kW; SANDY, UT; Owner: UNITED BROADCASTING COMPANY, INC)
- KMRI (1550 AM; 10 kW; WEST VALLEY CITY, UT; Owner: KMRI RADIO, LLC)
- KSOP (1370 AM; 5 kW; SOUTH SALT LAKE, UT; Owner: KSOP, INC.)
Strongest FM radio stations in Farmington:
- KCPX (105.7 FM; CENTERVILLE, UT; Owner: MERCURY BROADCASTING COMPANY, INC.)
- KSOP-FM (104.3 FM; SALT LAKE CITY, UT; Owner: KSOP, INC.)
- K272DP (102.3 FM; TOOELE, UT; Owner: FAMILY STATIONS, INC.)
- KBZN (97.9 FM; OGDEN, UT; Owner: CAPITOL BROADCASTING, INC.)
- KRCL (90.9 FM; SALT LAKE CITY, UT; Owner: LISTENERS COMMUNITY RADIO OF UTAH)
- KBER (101.1 FM; OGDEN, UT; Owner: CITADEL BROADCASTING COMPANY)
- KISN-FM (97.1 FM; SALT LAKE CITY, UT; Owner: CLEAR CHANNEL BROADCASTING LICENSES, INC.)
- KKAT (101.9 FM; OGDEN, UT; Owner: CITICASTERS LICENSES, L.P.)
- KSFI (100.3 FM; SALT LAKE CITY, UT; Owner: SIMMONS-SLC, LS, LLC)
- KUBL-FM (93.3 FM; SALT LAKE CITY, UT; Owner: CITADEL BROADCASTING COMPANY)
- KOSY-FM (106.5 FM; SPANISH FORK, UT; Owner: MERCURY BROADCASTING COMPANY, INC.)
- KRSP-FM (103.5 FM; SALT LAKE CITY, UT; Owner: SIMMONS-SLC, LS, LLC)
- KBZN-FM1 (97.9 FM; PARK CITY, UT; Owner: CAPITOL BROADCASTING INC.)
- K201AE (88.1 FM; COALVILLE, ETC., UT; Owner: COMMUNITY WIRELESS OF PARK CITY, INC)
- KZHT-FM1 (94.9 FM; PARK CITY, UT; Owner: CITICASTERS LICENSES, L.P.)
- K252DI (98.3 FM; SALT LAKE CITY, UT; Owner: FIRST NATIONAL BROADCASTING CORPORATION)
- K276DP (103.1 FM; MILLCREEK, UT; Owner: FIRST NATIONAL B/CING CORPORATION)
- KCUA (92.5 FM; COALVILLE, UT; Owner: COMMUNITY WIRELESS OF PARK CITY, INC)
- KODJ (94.1 FM; SALT LAKE CITY, UT; Owner: CITICASTERS LICENSES, L.P.)
- KUER-FM (90.1 FM; SALT LAKE CITY, UT; Owner: UNIVERSITY OF UTAH)
TV broadcast stations around Farmington:
- KUTV (Channel 2; SALT LAKE CITY, UT; Owner: KUTV HOLDINGS, INC.)
- K59GS (Channel 59; SALT LAKE CITY, UT; Owner: ALPHA & OMEGA COMMUNICATIONS, LLC)
- KULX-CA (Channel 51; OGDEN, UT; Owner: AIRWAVES, INC.)
- KSVN-CA (Channel 49; OGDEN, UT; Owner: AZTECA BROADCASTING CORPORATION)
- K66FN (Channel 66; SALT LAKE CITY, UT; Owner: AZTECA BROADCASTING CORPORATION)
- KEJT-LP (Channel 48; SALT LAKE CITY, UT; Owner: TELEMUNDO OF NORTHERN CALIFORNIA LICENSE CORP.)
- KPNZ (Channel 24; OGDEN, UT; Owner: UTAH COMMUNICATIONS, LLC)
- K56GR (Channel 56; OGDEN, UT; Owner: TRINITY BROADCASTING NETWORK)
- National Bridge Inventory (NBI) Statistics
- 49Number of bridges
- 984ft / 300mTotal length
- 1,801,214Total average daily traffic
- 357,492Total average daily truck traffic
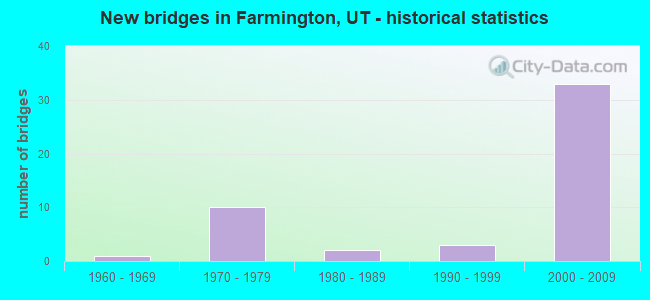
- New bridges - historical statistics
- 11960-1969
- 101970-1979
- 21980-1989
- 31990-1999
- 332000-2009
FCC Registered Antenna Towers: 34 (See the full list of FCC Registered Antenna Towers)
FCC Registered Broadcast Land Mobile Towers: 32 (See the full list of FCC Registered Broadcast Land Mobile Towers in Farmington, UT)
FCC Registered Microwave Towers: 53 (See the full list of FCC Registered Microwave Towers in this town)
FCC Registered Paging Towers: 1 (See the full list of FCC Registered Paging Towers)
FCC Registered Amateur Radio Licenses: 194 (See the full list of FCC Registered Amateur Radio Licenses in Farmington)
FAA Registered Aircraft Manufacturers and Dealers: 2 (See the full list of FAA Registered Manufacturers and Dealers in Farmington)
FAA Registered Aircraft: 24 (See the full list of FAA Registered Aircraft)
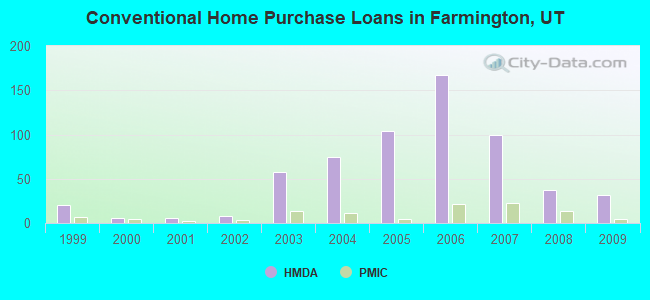
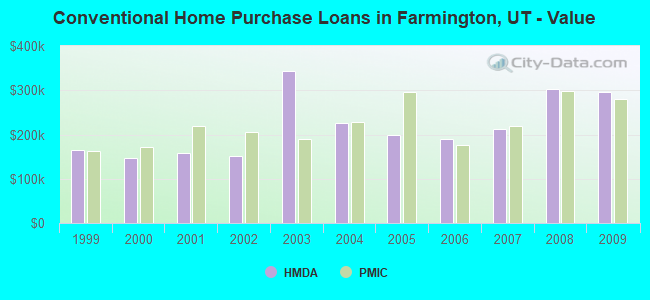
| Home Mortgage Disclosure Act Aggregated Statistics For Year 2009 (Based on 2 partial tracts) | ||||||||||
| A) FHA, FSA/RHS & VA Home Purchase Loans | B) Conventional Home Purchase Loans | C) Refinancings | D) Home Improvement Loans | F) Non-occupant Loans on < 5 Family Dwellings (A B C & D) | ||||||
|---|---|---|---|---|---|---|---|---|---|---|
| Number | Average Value | Number | Average Value | Number | Average Value | Number | Average Value | Number | Average Value | |
| LOANS ORIGINATED | 20 | $251,425 | 32 | $295,558 | 205 | $247,444 | 6 | $79,392 | 3 | $150,457 |
| APPLICATIONS APPROVED, NOT ACCEPTED | 1 | $144,060 | 3 | $589,900 | 24 | $286,890 | 3 | $41,003 | 0 | $0 |
| APPLICATIONS DENIED | 2 | $156,815 | 4 | $284,308 | 37 | $358,680 | 1 | $1,870 | 1 | $293,400 |
| APPLICATIONS WITHDRAWN | 1 | $187,490 | 2 | $182,885 | 33 | $316,832 | 2 | $149,740 | 2 | $132,220 |
| FILES CLOSED FOR INCOMPLETENESS | 0 | $0 | 0 | $0 | 14 | $227,997 | 0 | $0 | 2 | $61,670 |
Detailed HMDA statistics for the following Tracts: 1262.02 , 1262.03
| Private Mortgage Insurance Companies Aggregated Statistics For Year 2009 (Based on 2 partial tracts) | ||||
| A) Conventional Home Purchase Loans | B) Refinancings | |||
|---|---|---|---|---|
| Number | Average Value | Number | Average Value | |
| LOANS ORIGINATED | 4 | $280,060 | 2 | $314,495 |
| APPLICATIONS APPROVED, NOT ACCEPTED | 1 | $270,630 | 4 | $247,428 |
| APPLICATIONS DENIED | 0 | $0 | 2 | $273,865 |
| APPLICATIONS WITHDRAWN | 1 | $236,470 | 0 | $0 |
| FILES CLOSED FOR INCOMPLETENESS | 0 | $0 | 0 | $0 |
Detailed PMIC statistics for the following Tracts: 1262.02 , 1262.03
2003 - 2018 National Fire Incident Reporting System (NFIRS) incidents
- Fire incident types reported to NFIRS in Farmington, UT
- 26444.4%Outside Fires
- 17028.6%Structure Fires
- 11819.8%Mobile Property/Vehicle Fires
- 437.2%Other
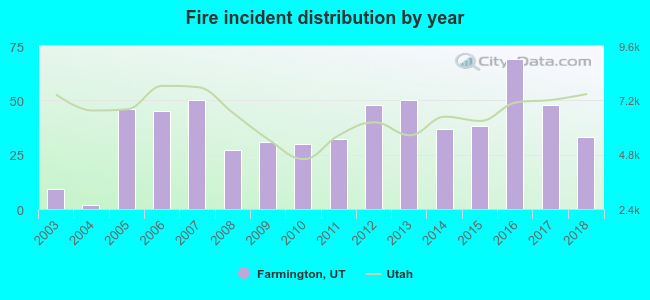 Based on the data from the years 2003 - 2018 the average number of fire incidents per year is 37. The highest number of fire incidents - 69 took place in 2016, and the least - 2 in 2004. The data has a rising trend.
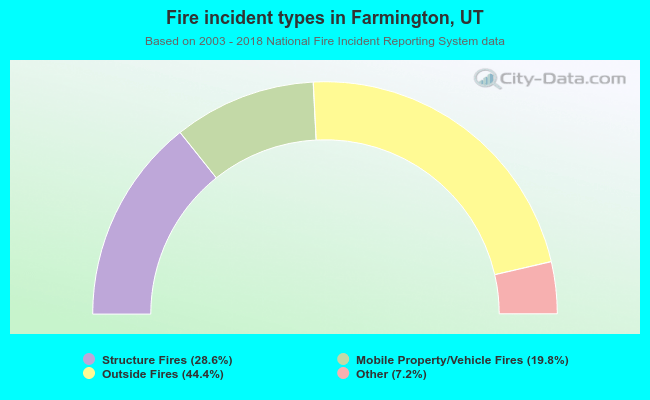 When looking into fire subcategories, the most reports belonged to: Outside Fires (44.4%), and Structure Fires (28.6%).
Fire-safe hotels and motels in Farmington, Utah:
- Hampton Inn & Suites, 332 W Park Ln, Farmington, Utah 84025 , Phone: (801) 451-7999, Fax: (801) 451-7066
- Hyatt Place Salt Lake City Farmington Station Park, 222 N Union Ave, Farmington, Utah 84025 , Phone: (801) 682-4444
| Most common first names in Farmington, UT among deceased individuals | ||
| Name | Count | Lived (average) |
|---|---|---|
| John | 20 | 80.6 years |
| Mary | 16 | 86.5 years |
| James | 13 | 74.0 years |
| George | 11 | 81.7 years |
| Ruth | 11 | 84.0 years |
| Helen | 10 | 82.0 years |
| Frank | 9 | 80.9 years |
| William | 9 | 71.1 years |
| Richard | 8 | 67.2 years |
| Margaret | 7 | 82.6 years |
| Most common last names in Farmington, UT among deceased individuals | ||
| Last name | Count | Lived (average) |
|---|---|---|
| Hess | 18 | 79.4 years |
| Johnson | 14 | 72.1 years |
| Wood | 13 | 77.3 years |
| Anderson | 13 | 79.5 years |
| Steed | 10 | 78.6 years |
| Robinson | 9 | 84.2 years |
| Moon | 9 | 77.4 years |
| Jensen | 9 | 81.3 years |
| Smith | 8 | 74.7 years |
| White | 7 | 86.6 years |
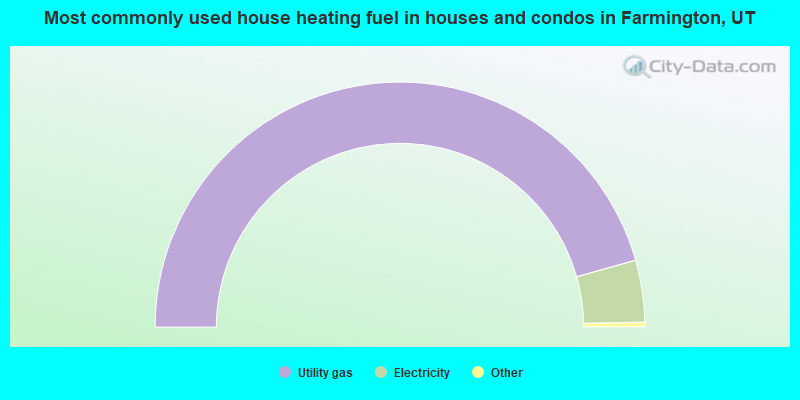
- 91.2%Utility gas
- 8.2%Electricity
- 0.4%Bottled, tank, or LP gas
- 0.1%Solar energy
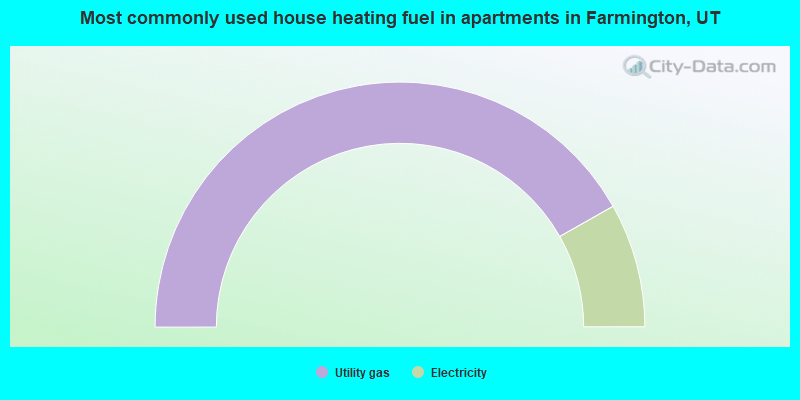
- 83.6%Utility gas
- 16.4%Electricity
Farmington compared to Utah state average:
- Unemployed percentage significantly below state average.
- Renting percentage below state average.
- Length of stay since moving in above state average.
- Number of rooms per house above state average.
- House age below state average.
- Institutionalized population percentage significantly above state average.
- Percentage of population with a bachelor's degree or higher above state average.
Farmington on our top lists:
- #59 on the list of "Top 101 cities with the lowest number of police officers per 1000 residents (population 5,000+)"
- #64 on the list of "Top 101 cities with the largest city-data.com crime index decrease from 2002 to 2012 (population 5,000+)"
- #69 on the list of "Top 101 cities with the largest percentage of people in unknown juvenile institutions (population 1,000+)"
- #81 on the list of "Top 101 cities with the most residents born in Sierra Leone (population 500+)"
- #87 on the list of "Top 101 cities with largest percentage of females in occupations: arts, design, entertainment, sports, and media occupations (population 5,000+)"
- #101 on the list of "Top 101 cities with the most cars per house, population 5,000+"
- #10 (84037) on the list of "Top 101 zip codes with the largest charity contributions deductions as a percentage of AGI in 2012 (pop 5,000+)"
- #27 (84037) on the list of "Top 101 zip codes with the largest percentage of English first ancestries (pop 5,000+)"
- #40 (84037) on the list of "Top 101 zip codes with the largest percentage of Danish first ancestries (pop 5,000+)"
- #2 on the list of "Top 101 counties with the lowest percentage of residents that smoked 100+ cigarettes in their lives"
- #5 on the list of "Top 101 counties with the most Other congregations"
- #7 on the list of "Top 101 counties with the highest number of births per 1000 residents 2007-2013"
- #7 on the list of "Top 101 counties with the most Other adherents"
- #12 on the list of "Top 101 counties with highest percentage of residents voting for Romney (Republican) in the 2012 Presidential Election (pop. 50,000+)"

|
|
Total of 317 patent applications in 2008-2024.