Haines City, Florida Submit your own pictures of this city and show them to the world
OSM Map
General Map
Google Map
MSN Map
OSM Map
General Map
Google Map
MSN Map
OSM Map
General Map
Google Map
MSN Map
OSM Map
General Map
Google Map
MSN Map
Please wait while loading the map...
Population in 2022: 33,629 (97% urban, 3% rural). Population change since 2000: +155.3%Males: 16,552 Females: 17,077
March 2022 cost of living index in Haines City: 87.1 (less than average, U.S. average is 100) Percentage of residents living in poverty in 2022: 16.9%for White Non-Hispanic residents , 26.4% for Black residents , 14.2% for Hispanic or Latino residents , 13.6% for American Indian residents , 11.0% for other race residents , 13.1% for two or more races residents )
Profiles of local businesses
Business Search - 14 Million verified businesses
Data:
Median household income ($)
Median household income (% change since 2000)
Household income diversity
Ratio of average income to average house value (%)
Ratio of average income to average rent
Median household income ($) - White
Median household income ($) - Black or African American
Median household income ($) - Asian
Median household income ($) - Hispanic or Latino
Median household income ($) - American Indian and Alaska Native
Median household income ($) - Multirace
Median household income ($) - Other Race
Median household income for houses/condos with a mortgage ($)
Median household income for apartments without a mortgage ($)
Races - White alone (%)
Races - White alone (% change since 2000)
Races - Black alone (%)
Races - Black alone (% change since 2000)
Races - American Indian alone (%)
Races - American Indian alone (% change since 2000)
Races - Asian alone (%)
Races - Asian alone (% change since 2000)
Races - Hispanic (%)
Races - Hispanic (% change since 2000)
Races - Native Hawaiian and Other Pacific Islander alone (%)
Races - Native Hawaiian and Other Pacific Islander alone (% change since 2000)
Races - Two or more races (%)
Races - Two or more races (% change since 2000)
Races - Other race alone (%)
Races - Other race alone (% change since 2000)
Racial diversity
Unemployment (%)
Unemployment (% change since 2000)
Unemployment (%) - White
Unemployment (%) - Black or African American
Unemployment (%) - Asian
Unemployment (%) - Hispanic or Latino
Unemployment (%) - American Indian and Alaska Native
Unemployment (%) - Multirace
Unemployment (%) - Other Race
Population density (people per square mile)
Population - Males (%)
Population - Females (%)
Population - Males (%) - White
Population - Males (%) - Black or African American
Population - Males (%) - Asian
Population - Males (%) - Hispanic or Latino
Population - Males (%) - American Indian and Alaska Native
Population - Males (%) - Multirace
Population - Males (%) - Other Race
Population - Females (%) - White
Population - Females (%) - Black or African American
Population - Females (%) - Asian
Population - Females (%) - Hispanic or Latino
Population - Females (%) - American Indian and Alaska Native
Population - Females (%) - Multirace
Population - Females (%) - Other Race
Coronavirus confirmed cases (Apr 26, 2024)
Deaths caused by coronavirus (Apr 26, 2024)
Coronavirus confirmed cases (per 100k population) (Apr 26, 2024)
Deaths caused by coronavirus (per 100k population) (Apr 26, 2024)
Daily increase in number of cases (Apr 26, 2024)
Weekly increase in number of cases (Apr 26, 2024)
Cases doubled (in days) (Apr 26, 2024)
Hospitalized patients (Apr 18, 2022)
Negative test results (Apr 18, 2022)
Total test results (Apr 18, 2022)
COVID Vaccine doses distributed (per 100k population) (Sep 19, 2023)
COVID Vaccine doses administered (per 100k population) (Sep 19, 2023)
COVID Vaccine doses distributed (Sep 19, 2023)
COVID Vaccine doses administered (Sep 19, 2023)
Likely homosexual households (%)
Likely homosexual households (% change since 2000)
Likely homosexual households - Lesbian couples (%)
Likely homosexual households - Lesbian couples (% change since 2000)
Likely homosexual households - Gay men (%)
Likely homosexual households - Gay men (% change since 2000)
Cost of living index
Median gross rent ($)
Median contract rent ($)
Median monthly housing costs ($)
Median house or condo value ($)
Median house or condo value ($ change since 2000)
Mean house or condo value by units in structure - 1, detached ($)
Mean house or condo value by units in structure - 1, attached ($)
Mean house or condo value by units in structure - 2 ($)
Mean house or condo value by units in structure by units in structure - 3 or 4 ($)
Mean house or condo value by units in structure - 5 or more ($)
Mean house or condo value by units in structure - Boat, RV, van, etc. ($)
Mean house or condo value by units in structure - Mobile home ($)
Median house or condo value ($) - White
Median house or condo value ($) - Black or African American
Median house or condo value ($) - Asian
Median house or condo value ($) - Hispanic or Latino
Median house or condo value ($) - American Indian and Alaska Native
Median house or condo value ($) - Multirace
Median house or condo value ($) - Other Race
Median resident age
Resident age diversity
Median resident age - Males
Median resident age - Females
Median resident age - White
Median resident age - Black or African American
Median resident age - Asian
Median resident age - Hispanic or Latino
Median resident age - American Indian and Alaska Native
Median resident age - Multirace
Median resident age - Other Race
Median resident age - Males - White
Median resident age - Males - Black or African American
Median resident age - Males - Asian
Median resident age - Males - Hispanic or Latino
Median resident age - Males - American Indian and Alaska Native
Median resident age - Males - Multirace
Median resident age - Males - Other Race
Median resident age - Females - White
Median resident age - Females - Black or African American
Median resident age - Females - Asian
Median resident age - Females - Hispanic or Latino
Median resident age - Females - American Indian and Alaska Native
Median resident age - Females - Multirace
Median resident age - Females - Other Race
Commute - mean travel time to work (minutes)
Travel time to work - Less than 5 minutes (%)
Travel time to work - Less than 5 minutes (% change since 2000)
Travel time to work - 5 to 9 minutes (%)
Travel time to work - 5 to 9 minutes (% change since 2000)
Travel time to work - 10 to 19 minutes (%)
Travel time to work - 10 to 19 minutes (% change since 2000)
Travel time to work - 20 to 29 minutes (%)
Travel time to work - 20 to 29 minutes (% change since 2000)
Travel time to work - 30 to 39 minutes (%)
Travel time to work - 30 to 39 minutes (% change since 2000)
Travel time to work - 40 to 59 minutes (%)
Travel time to work - 40 to 59 minutes (% change since 2000)
Travel time to work - 60 to 89 minutes (%)
Travel time to work - 60 to 89 minutes (% change since 2000)
Travel time to work - 90 or more minutes (%)
Travel time to work - 90 or more minutes (% change since 2000)
Marital status - Never married (%)
Marital status - Now married (%)
Marital status - Separated (%)
Marital status - Widowed (%)
Marital status - Divorced (%)
Median family income ($)
Median family income (% change since 2000)
Median non-family income ($)
Median non-family income (% change since 2000)
Median per capita income ($)
Median per capita income (% change since 2000)
Median family income ($) - White
Median family income ($) - Black or African American
Median family income ($) - Asian
Median family income ($) - Hispanic or Latino
Median family income ($) - American Indian and Alaska Native
Median family income ($) - Multirace
Median family income ($) - Other Race
Median year house/condo built
Median year apartment built
Year house built - Built 2005 or later (%)
Year house built - Built 2000 to 2004 (%)
Year house built - Built 1990 to 1999 (%)
Year house built - Built 1980 to 1989 (%)
Year house built - Built 1970 to 1979 (%)
Year house built - Built 1960 to 1969 (%)
Year house built - Built 1950 to 1959 (%)
Year house built - Built 1940 to 1949 (%)
Year house built - Built 1939 or earlier (%)
Average household size
Household density (households per square mile)
Average household size - White
Average household size - Black or African American
Average household size - Asian
Average household size - Hispanic or Latino
Average household size - American Indian and Alaska Native
Average household size - Multirace
Average household size - Other Race
Occupied housing units (%)
Vacant housing units (%)
Owner occupied housing units (%)
Renter occupied housing units (%)
Vacancy status - For rent (%)
Vacancy status - For sale only (%)
Vacancy status - Rented or sold, not occupied (%)
Vacancy status - For seasonal, recreational, or occasional use (%)
Vacancy status - For migrant workers (%)
Vacancy status - Other vacant (%)
Residents with income below the poverty level (%)
Residents with income below 50% of the poverty level (%)
Children below poverty level (%)
Poor families by family type - Married-couple family (%)
Poor families by family type - Male, no wife present (%)
Poor families by family type - Female, no husband present (%)
Poverty status for native-born residents (%)
Poverty status for foreign-born residents (%)
Poverty among high school graduates not in families (%)
Poverty among people who did not graduate high school not in families (%)
Residents with income below the poverty level (%) - White
Residents with income below the poverty level (%) - Black or African American
Residents with income below the poverty level (%) - Asian
Residents with income below the poverty level (%) - Hispanic or Latino
Residents with income below the poverty level (%) - American Indian and Alaska Native
Residents with income below the poverty level (%) - Multirace
Residents with income below the poverty level (%) - Other Race
Air pollution - Air Quality Index (AQI)
Air pollution - CO
Air pollution - NO2
Air pollution - SO2
Air pollution - Ozone
Air pollution - PM10
Air pollution - PM25
Air pollution - Pb
Crime - Murders per 100,000 population
Crime - Rapes per 100,000 population
Crime - Robberies per 100,000 population
Crime - Assaults per 100,000 population
Crime - Burglaries per 100,000 population
Crime - Thefts per 100,000 population
Crime - Auto thefts per 100,000 population
Crime - Arson per 100,000 population
Crime - City-data.com crime index
Crime - Violent crime index
Crime - Property crime index
Crime - Murders per 100,000 population (5 year average)
Crime - Rapes per 100,000 population (5 year average)
Crime - Robberies per 100,000 population (5 year average)
Crime - Assaults per 100,000 population (5 year average)
Crime - Burglaries per 100,000 population (5 year average)
Crime - Thefts per 100,000 population (5 year average)
Crime - Auto thefts per 100,000 population (5 year average)
Crime - Arson per 100,000 population (5 year average)
Crime - City-data.com crime index (5 year average)
Crime - Violent crime index (5 year average)
Crime - Property crime index (5 year average)
1996 Presidential Elections Results (%) - Democratic Party (Clinton)
1996 Presidential Elections Results (%) - Republican Party (Dole)
1996 Presidential Elections Results (%) - Other
2000 Presidential Elections Results (%) - Democratic Party (Gore)
2000 Presidential Elections Results (%) - Republican Party (Bush)
2000 Presidential Elections Results (%) - Other
2004 Presidential Elections Results (%) - Democratic Party (Kerry)
2004 Presidential Elections Results (%) - Republican Party (Bush)
2004 Presidential Elections Results (%) - Other
2008 Presidential Elections Results (%) - Democratic Party (Obama)
2008 Presidential Elections Results (%) - Republican Party (McCain)
2008 Presidential Elections Results (%) - Other
2012 Presidential Elections Results (%) - Democratic Party (Obama)
2012 Presidential Elections Results (%) - Republican Party (Romney)
2012 Presidential Elections Results (%) - Other
2016 Presidential Elections Results (%) - Democratic Party (Clinton)
2016 Presidential Elections Results (%) - Republican Party (Trump)
2016 Presidential Elections Results (%) - Other
2020 Presidential Elections Results (%) - Democratic Party (Biden)
2020 Presidential Elections Results (%) - Republican Party (Trump)
2020 Presidential Elections Results (%) - Other
Ancestries Reported - Arab (%)
Ancestries Reported - Czech (%)
Ancestries Reported - Danish (%)
Ancestries Reported - Dutch (%)
Ancestries Reported - English (%)
Ancestries Reported - French (%)
Ancestries Reported - French Canadian (%)
Ancestries Reported - German (%)
Ancestries Reported - Greek (%)
Ancestries Reported - Hungarian (%)
Ancestries Reported - Irish (%)
Ancestries Reported - Italian (%)
Ancestries Reported - Lithuanian (%)
Ancestries Reported - Norwegian (%)
Ancestries Reported - Polish (%)
Ancestries Reported - Portuguese (%)
Ancestries Reported - Russian (%)
Ancestries Reported - Scotch-Irish (%)
Ancestries Reported - Scottish (%)
Ancestries Reported - Slovak (%)
Ancestries Reported - Subsaharan African (%)
Ancestries Reported - Swedish (%)
Ancestries Reported - Swiss (%)
Ancestries Reported - Ukrainian (%)
Ancestries Reported - United States (%)
Ancestries Reported - Welsh (%)
Ancestries Reported - West Indian (%)
Ancestries Reported - Other (%)
Educational Attainment - No schooling completed (%)
Educational Attainment - Less than high school (%)
Educational Attainment - High school or equivalent (%)
Educational Attainment - Less than 1 year of college (%)
Educational Attainment - 1 or more years of college (%)
Educational Attainment - Associate degree (%)
Educational Attainment - Bachelor's degree (%)
Educational Attainment - Master's degree (%)
Educational Attainment - Professional school degree (%)
Educational Attainment - Doctorate degree (%)
School Enrollment - Nursery, preschool (%)
School Enrollment - Kindergarten (%)
School Enrollment - Grade 1 to 4 (%)
School Enrollment - Grade 5 to 8 (%)
School Enrollment - Grade 9 to 12 (%)
School Enrollment - College undergrad (%)
School Enrollment - Graduate or professional (%)
School Enrollment - Not enrolled in school (%)
School enrollment - Public schools (%)
School enrollment - Private schools (%)
School enrollment - Not enrolled (%)
Median number of rooms in houses and condos
Median number of rooms in apartments
Housing units lacking complete plumbing facilities (%)
Housing units lacking complete kitchen facilities (%)
Density of houses
Urban houses (%)
Rural houses (%)
Households with people 60 years and over (%)
Households with people 65 years and over (%)
Households with people 75 years and over (%)
Households with one or more nonrelatives (%)
Households with no nonrelatives (%)
Population in households (%)
Family households (%)
Nonfamily households (%)
Population in families (%)
Family households with own children (%)
Median number of bedrooms in owner occupied houses
Mean number of bedrooms in owner occupied houses
Median number of bedrooms in renter occupied houses
Mean number of bedrooms in renter occupied houses
Median number of vehichles in owner occupied houses
Mean number of vehichles in owner occupied houses
Median number of vehichles in renter occupied houses
Mean number of vehichles in renter occupied houses
Mortgage status - with mortgage (%)
Mortgage status - with second mortgage (%)
Mortgage status - with home equity loan (%)
Mortgage status - with both second mortgage and home equity loan (%)
Mortgage status - without a mortgage (%)
Average family size
Average family size - White
Average family size - Black or African American
Average family size - Asian
Average family size - Hispanic or Latino
Average family size - American Indian and Alaska Native
Average family size - Multirace
Average family size - Other Race
Geographical mobility - Same house 1 year ago (%)
Geographical mobility - Moved within same county (%)
Geographical mobility - Moved from different county within same state (%)
Geographical mobility - Moved from different state (%)
Geographical mobility - Moved from abroad (%)
Place of birth - Born in state of residence (%)
Place of birth - Born in other state (%)
Place of birth - Native, outside of US (%)
Place of birth - Foreign born (%)
Housing units in structures - 1, detached (%)
Housing units in structures - 1, attached (%)
Housing units in structures - 2 (%)
Housing units in structures - 3 or 4 (%)
Housing units in structures - 5 to 9 (%)
Housing units in structures - 10 to 19 (%)
Housing units in structures - 20 to 49 (%)
Housing units in structures - 50 or more (%)
Housing units in structures - Mobile home (%)
Housing units in structures - Boat, RV, van, etc. (%)
House/condo owner moved in on average (years ago)
Renter moved in on average (years ago)
Year householder moved into unit - Moved in 1999 to March 2000 (%)
Year householder moved into unit - Moved in 1995 to 1998 (%)
Year householder moved into unit - Moved in 1990 to 1994 (%)
Year householder moved into unit - Moved in 1980 to 1989 (%)
Year householder moved into unit - Moved in 1970 to 1979 (%)
Year householder moved into unit - Moved in 1969 or earlier (%)
Means of transportation to work - Drove car alone (%)
Means of transportation to work - Carpooled (%)
Means of transportation to work - Public transportation (%)
Means of transportation to work - Bus or trolley bus (%)
Means of transportation to work - Streetcar or trolley car (%)
Means of transportation to work - Subway or elevated (%)
Means of transportation to work - Railroad (%)
Means of transportation to work - Ferryboat (%)
Means of transportation to work - Taxicab (%)
Means of transportation to work - Motorcycle (%)
Means of transportation to work - Bicycle (%)
Means of transportation to work - Walked (%)
Means of transportation to work - Other means (%)
Working at home (%)
Industry diversity
Most Common Industries - Agriculture, forestry, fishing and hunting, and mining (%)
Most Common Industries - Agriculture, forestry, fishing and hunting (%)
Most Common Industries - Mining, quarrying, and oil and gas extraction (%)
Most Common Industries - Construction (%)
Most Common Industries - Manufacturing (%)
Most Common Industries - Wholesale trade (%)
Most Common Industries - Retail trade (%)
Most Common Industries - Transportation and warehousing, and utilities (%)
Most Common Industries - Transportation and warehousing (%)
Most Common Industries - Utilities (%)
Most Common Industries - Information (%)
Most Common Industries - Finance and insurance, and real estate and rental and leasing (%)
Most Common Industries - Finance and insurance (%)
Most Common Industries - Real estate and rental and leasing (%)
Most Common Industries - Professional, scientific, and management, and administrative and waste management services (%)
Most Common Industries - Professional, scientific, and technical services (%)
Most Common Industries - Management of companies and enterprises (%)
Most Common Industries - Administrative and support and waste management services (%)
Most Common Industries - Educational services, and health care and social assistance (%)
Most Common Industries - Educational services (%)
Most Common Industries - Health care and social assistance (%)
Most Common Industries - Arts, entertainment, and recreation, and accommodation and food services (%)
Most Common Industries - Arts, entertainment, and recreation (%)
Most Common Industries - Accommodation and food services (%)
Most Common Industries - Other services, except public administration (%)
Most Common Industries - Public administration (%)
Occupation diversity
Most Common Occupations - Management, business, science, and arts occupations (%)
Most Common Occupations - Management, business, and financial occupations (%)
Most Common Occupations - Management occupations (%)
Most Common Occupations - Business and financial operations occupations (%)
Most Common Occupations - Computer, engineering, and science occupations (%)
Most Common Occupations - Computer and mathematical occupations (%)
Most Common Occupations - Architecture and engineering occupations (%)
Most Common Occupations - Life, physical, and social science occupations (%)
Most Common Occupations - Education, legal, community service, arts, and media occupations (%)
Most Common Occupations - Community and social service occupations (%)
Most Common Occupations - Legal occupations (%)
Most Common Occupations - Education, training, and library occupations (%)
Most Common Occupations - Arts, design, entertainment, sports, and media occupations (%)
Most Common Occupations - Healthcare practitioners and technical occupations (%)
Most Common Occupations - Health diagnosing and treating practitioners and other technical occupations (%)
Most Common Occupations - Health technologists and technicians (%)
Most Common Occupations - Service occupations (%)
Most Common Occupations - Healthcare support occupations (%)
Most Common Occupations - Protective service occupations (%)
Most Common Occupations - Fire fighting and prevention, and other protective service workers including supervisors (%)
Most Common Occupations - Law enforcement workers including supervisors (%)
Most Common Occupations - Food preparation and serving related occupations (%)
Most Common Occupations - Building and grounds cleaning and maintenance occupations (%)
Most Common Occupations - Personal care and service occupations (%)
Most Common Occupations - Sales and office occupations (%)
Most Common Occupations - Sales and related occupations (%)
Most Common Occupations - Office and administrative support occupations (%)
Most Common Occupations - Natural resources, construction, and maintenance occupations (%)
Most Common Occupations - Farming, fishing, and forestry occupations (%)
Most Common Occupations - Construction and extraction occupations (%)
Most Common Occupations - Installation, maintenance, and repair occupations (%)
Most Common Occupations - Production, transportation, and material moving occupations (%)
Most Common Occupations - Production occupations (%)
Most Common Occupations - Transportation occupations (%)
Most Common Occupations - Material moving occupations (%)
People in Group quarters - Institutionalized population (%)
People in Group quarters - Correctional institutions (%)
People in Group quarters - Federal prisons and detention centers (%)
People in Group quarters - Halfway houses (%)
People in Group quarters - Local jails and other confinement facilities (including police lockups) (%)
People in Group quarters - Military disciplinary barracks (%)
People in Group quarters - State prisons (%)
People in Group quarters - Other types of correctional institutions (%)
People in Group quarters - Nursing homes (%)
People in Group quarters - Hospitals/wards, hospices, and schools for the handicapped (%)
People in Group quarters - Hospitals/wards and hospices for chronically ill (%)
People in Group quarters - Hospices or homes for chronically ill (%)
People in Group quarters - Military hospitals or wards for chronically ill (%)
People in Group quarters - Other hospitals or wards for chronically ill (%)
People in Group quarters - Hospitals or wards for drug/alcohol abuse (%)
People in Group quarters - Mental (Psychiatric) hospitals or wards (%)
People in Group quarters - Schools, hospitals, or wards for the mentally retarded (%)
People in Group quarters - Schools, hospitals, or wards for the physically handicapped (%)
People in Group quarters - Institutions for the deaf (%)
People in Group quarters - Institutions for the blind (%)
People in Group quarters - Orthopedic wards and institutions for the physically handicapped (%)
People in Group quarters - Wards in general hospitals for patients who have no usual home elsewhere (%)
People in Group quarters - Wards in military hospitals for patients who have no usual home elsewhere (%)
People in Group quarters - Juvenile institutions (%)
People in Group quarters - Long-term care (%)
People in Group quarters - Homes for abused, dependent, and neglected children (%)
People in Group quarters - Residential treatment centers for emotionally disturbed children (%)
People in Group quarters - Training schools for juvenile delinquents (%)
People in Group quarters - Short-term care, detention or diagnostic centers for delinquent children (%)
People in Group quarters - Type of juvenile institution unknown (%)
People in Group quarters - Noninstitutionalized population (%)
People in Group quarters - College dormitories (includes college quarters off campus) (%)
People in Group quarters - Military quarters (%)
People in Group quarters - On base (%)
People in Group quarters - Barracks, unaccompanied personnel housing (UPH), (Enlisted/Officer), ;and similar group living quarters for military personnel (%)
People in Group quarters - Transient quarters for temporary residents (%)
People in Group quarters - Military ships (%)
People in Group quarters - Group homes (%)
People in Group quarters - Homes or halfway houses for drug/alcohol abuse (%)
People in Group quarters - Homes for the mentally ill (%)
People in Group quarters - Homes for the mentally retarded (%)
People in Group quarters - Homes for the physically handicapped (%)
People in Group quarters - Other group homes (%)
People in Group quarters - Religious group quarters (%)
People in Group quarters - Dormitories (%)
People in Group quarters - Agriculture workers' dormitories on farms (%)
People in Group quarters - Job Corps and vocational training facilities (%)
People in Group quarters - Other workers' dormitories (%)
People in Group quarters - Crews of maritime vessels (%)
People in Group quarters - Other nonhousehold living situations (%)
People in Group quarters - Other noninstitutional group quarters (%)
Residents speaking English at home (%)
Residents speaking English at home - Born in the United States (%)
Residents speaking English at home - Native, born elsewhere (%)
Residents speaking English at home - Foreign born (%)
Residents speaking Spanish at home (%)
Residents speaking Spanish at home - Born in the United States (%)
Residents speaking Spanish at home - Native, born elsewhere (%)
Residents speaking Spanish at home - Foreign born (%)
Residents speaking other language at home (%)
Residents speaking other language at home - Born in the United States (%)
Residents speaking other language at home - Native, born elsewhere (%)
Residents speaking other language at home - Foreign born (%)
Class of Workers - Employee of private company (%)
Class of Workers - Self-employed in own incorporated business (%)
Class of Workers - Private not-for-profit wage and salary workers (%)
Class of Workers - Local government workers (%)
Class of Workers - State government workers (%)
Class of Workers - Federal government workers (%)
Class of Workers - Self-employed workers in own not incorporated business and Unpaid family workers (%)
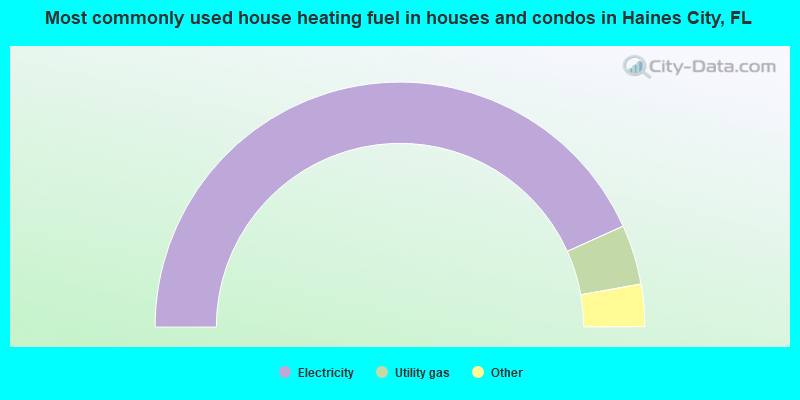
House heating fuel used in houses and condos - Utility gas (%)
House heating fuel used in houses and condos - Bottled, tank, or LP gas (%)
House heating fuel used in houses and condos - Electricity (%)
House heating fuel used in houses and condos - Fuel oil, kerosene, etc. (%)
House heating fuel used in houses and condos - Coal or coke (%)
House heating fuel used in houses and condos - Wood (%)
House heating fuel used in houses and condos - Solar energy (%)
House heating fuel used in houses and condos - Other fuel (%)
House heating fuel used in houses and condos - No fuel used (%)
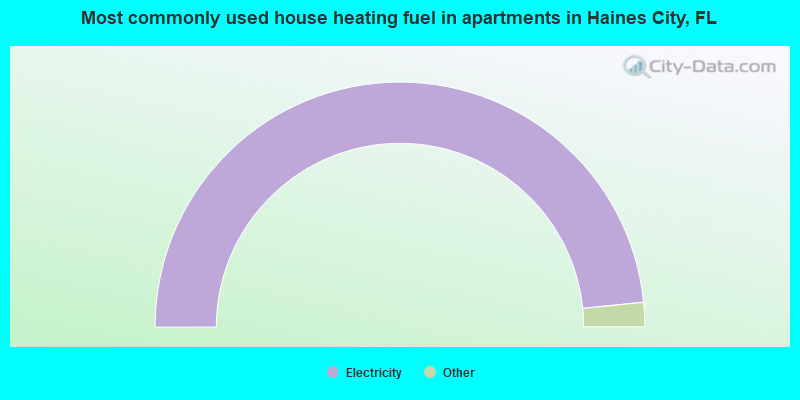
House heating fuel used in apartments - Utility gas (%)
House heating fuel used in apartments - Bottled, tank, or LP gas (%)
House heating fuel used in apartments - Electricity (%)
House heating fuel used in apartments - Fuel oil, kerosene, etc. (%)
House heating fuel used in apartments - Coal or coke (%)
House heating fuel used in apartments - Wood (%)
House heating fuel used in apartments - Solar energy (%)
House heating fuel used in apartments - Other fuel (%)
House heating fuel used in apartments - No fuel used (%)
Armed forces status - In Armed Forces (%)
Armed forces status - Civilian (%)
Armed forces status - Civilian - Veteran (%)
Armed forces status - Civilian - Nonveteran (%)
Fatal accidents locations in years 2005-2021
Fatal accidents locations in 2005
Fatal accidents locations in 2006
Fatal accidents locations in 2007
Fatal accidents locations in 2008
Fatal accidents locations in 2009
Fatal accidents locations in 2010
Fatal accidents locations in 2011
Fatal accidents locations in 2012
Fatal accidents locations in 2013
Fatal accidents locations in 2014
Fatal accidents locations in 2015
Fatal accidents locations in 2016
Fatal accidents locations in 2017
Fatal accidents locations in 2018
Fatal accidents locations in 2019
Fatal accidents locations in 2020
Fatal accidents locations in 2021
Alcohol use - People drinking some alcohol every month (%)
Alcohol use - People not drinking at all (%)
Alcohol use - Average days/month drinking alcohol
Alcohol use - Average drinks/week
Alcohol use - Average days/year people drink much
Audiometry - Average condition of hearing (%)
Audiometry - People that can hear a whisper from across a quiet room (%)
Audiometry - People that can hear normal voice from across a quiet room (%)
Audiometry - Ears ringing, roaring, buzzing (%)
Audiometry - Had a job exposure to loud noise (%)
Audiometry - Had off-work exposure to loud noise (%)
Blood Pressure & Cholesterol - Has high blood pressure (%)
Blood Pressure & Cholesterol - Checking blood pressure at home (%)
Blood Pressure & Cholesterol - Frequently checking blood cholesterol (%)
Blood Pressure & Cholesterol - Has high cholesterol level (%)
Consumer Behavior - Money monthly spent on food at supermarket/grocery store
Consumer Behavior - Money monthly spent on food at other stores
Consumer Behavior - Money monthly spent on eating out
Consumer Behavior - Money monthly spent on carryout/delivered foods
Consumer Behavior - Income spent on food at supermarket/grocery store (%)
Consumer Behavior - Income spent on food at other stores (%)
Consumer Behavior - Income spent on eating out (%)
Consumer Behavior - Income spent on carryout/delivered foods (%)
Current Health Status - General health condition (%)
Current Health Status - Blood donors (%)
Current Health Status - Has blood ever tested for HIV virus (%)
Current Health Status - Left-handed people (%)
Dermatology - People using sunscreen (%)
Diabetes - Diabetics (%)
Diabetes - Had a blood test for high blood sugar (%)
Diabetes - People taking insulin (%)
Diet Behavior & Nutrition - Diet health (%)
Diet Behavior & Nutrition - Milk product consumption (# of products/month)
Diet Behavior & Nutrition - Meals not home prepared (#/week)
Diet Behavior & Nutrition - Meals from fast food or pizza place (#/week)
Diet Behavior & Nutrition - Ready-to-eat foods (#/month)
Diet Behavior & Nutrition - Frozen meals/pizza (#/month)
Drug Use - People that ever used marijuana or hashish (%)
Drug Use - Ever used hard drugs (%)
Drug Use - Ever used any form of cocaine (%)
Drug Use - Ever used heroin (%)
Drug Use - Ever used methamphetamine (%)
Health Insurance - People covered by health insurance (%)
Kidney Conditions-Urology - Avg. # of times urinating at night
Medical Conditions - People with asthma (%)
Medical Conditions - People with anemia (%)
Medical Conditions - People with psoriasis (%)
Medical Conditions - People with overweight (%)
Medical Conditions - Elderly people having difficulties in thinking or remembering (%)
Medical Conditions - People who ever received blood transfusion (%)
Medical Conditions - People having trouble seeing even with glass/contacts (%)
Medical Conditions - People with arthritis (%)
Medical Conditions - People with gout (%)
Medical Conditions - People with congestive heart failure (%)
Medical Conditions - People with coronary heart disease (%)
Medical Conditions - People with angina pectoris (%)
Medical Conditions - People who ever had heart attack (%)
Medical Conditions - People who ever had stroke (%)
Medical Conditions - People with emphysema (%)
Medical Conditions - People with thyroid problem (%)
Medical Conditions - People with chronic bronchitis (%)
Medical Conditions - People with any liver condition (%)
Medical Conditions - People who ever had cancer or malignancy (%)
Mental Health - People who have little interest in doing things (%)
Mental Health - People feeling down, depressed, or hopeless (%)
Mental Health - People who have trouble sleeping or sleeping too much (%)
Mental Health - People feeling tired or having little energy (%)
Mental Health - People with poor appetite or overeating (%)
Mental Health - People feeling bad about themself (%)
Mental Health - People who have trouble concentrating on things (%)
Mental Health - People moving or speaking slowly or too fast (%)
Mental Health - People having thoughts they would be better off dead (%)
Oral Health - Average years since last visit a dentist
Oral Health - People embarrassed because of mouth (%)
Oral Health - People with gum disease (%)
Oral Health - General health of teeth and gums (%)
Oral Health - Average days a week using dental floss/device
Oral Health - Average days a week using mouthwash for dental problem
Oral Health - Average number of teeth
Pesticide Use - Households using pesticides to control insects (%)
Pesticide Use - Households using pesticides to kill weeds (%)
Physical Activity - People doing vigorous-intensity work activities (%)
Physical Activity - People doing moderate-intensity work activities (%)
Physical Activity - People walking or bicycling (%)
Physical Activity - People doing vigorous-intensity recreational activities (%)
Physical Activity - People doing moderate-intensity recreational activities (%)
Physical Activity - Average hours a day doing sedentary activities
Physical Activity - Average hours a day watching TV or videos
Physical Activity - Average hours a day using computer
Physical Functioning - People having limitations keeping them from working (%)
Physical Functioning - People limited in amount of work they can do (%)
Physical Functioning - People that need special equipment to walk (%)
Physical Functioning - People experiencing confusion/memory problems (%)
Physical Functioning - People requiring special healthcare equipment (%)
Prescription Medications - Average number of prescription medicines taking
Preventive Aspirin Use - Adults 40+ taking low-dose aspirin (%)
Reproductive Health - Vaginal deliveries (%)
Reproductive Health - Cesarean deliveries (%)
Reproductive Health - Deliveries resulted in a live birth (%)
Reproductive Health - Pregnancies resulted in a delivery (%)
Reproductive Health - Women breastfeeding newborns (%)
Reproductive Health - Women that had a hysterectomy (%)
Reproductive Health - Women that had both ovaries removed (%)
Reproductive Health - Women that have ever taken birth control pills (%)
Reproductive Health - Women taking birth control pills (%)
Reproductive Health - Women that have ever used Depo-Provera or injectables (%)
Reproductive Health - Women that have ever used female hormones (%)
Sexual Behavior - People 18+ that ever had sex (vaginal, anal, or oral) (%)
Sexual Behavior - Males 18+ that ever had vaginal sex with a woman (%)
Sexual Behavior - Males 18+ that ever performed oral sex on a woman (%)
Sexual Behavior - Males 18+ that ever had anal sex with a woman (%)
Sexual Behavior - Males 18+ that ever had any sex with a man (%)
Sexual Behavior - Females 18+ that ever had vaginal sex with a man (%)
Sexual Behavior - Females 18+ that ever performed oral sex on a man (%)
Sexual Behavior - Females 18+ that ever had anal sex with a man (%)
Sexual Behavior - Females 18+ that ever had any kind of sex with a woman (%)
Sexual Behavior - Average age people first had sex
Sexual Behavior - Average number of female sex partners in lifetime (males 18+)
Sexual Behavior - Average number of female vaginal sex partners in lifetime (males 18+)
Sexual Behavior - Average age people first performed oral sex on a woman (18+)
Sexual Behavior - Average number of woman performed oral sex on in lifetime (18+)
Sexual Behavior - Average number of male sex partners in lifetime (males 18+)
Sexual Behavior - Average number of male anal sex partners in lifetime (males 18+)
Sexual Behavior - Average age people first performed oral sex on a man (18+)
Sexual Behavior - Average number of male oral sex partners in lifetime (18+)
Sexual Behavior - People using protection when performing oral sex (%)
Sexual Behavior - Average number of times people have vaginal or anal sex a year
Sexual Behavior - People having sex without condom (%)
Sexual Behavior - Average number of male sex partners in lifetime (females 18+)
Sexual Behavior - Average number of male vaginal sex partners in lifetime (females 18+)
Sexual Behavior - Average number of female sex partners in lifetime (females 18+)
Sexual Behavior - Circumcised males 18+ (%)
Sleep Disorders - Average hours sleeping at night
Sleep Disorders - People that has trouble sleeping (%)
Smoking-Cigarette Use - People smoking cigarettes (%)
Taste & Smell - People 40+ having problems with smell (%)
Taste & Smell - People 40+ having problems with taste (%)
Taste & Smell - People 40+ that ever had wisdom teeth removed (%)
Taste & Smell - People 40+ that ever had tonsils teeth removed (%)
Taste & Smell - People 40+ that ever had a loss of consciousness because of a head injury (%)
Taste & Smell - People 40+ that ever had a broken nose or other serious injury to face or skull (%)
Taste & Smell - People 40+ that ever had two or more sinus infections (%)
Weight - Average height (inches)
Weight - Average weight (pounds)
Weight - Average BMI
Weight - People that are obese (%)
Weight - People that ever were obese (%)
Weight - People trying to lose weight (%)
Officers per 1,000 residents here:
1.96Florida average:
2.33
Latest news from Haines City, FL collected exclusively by city-data.com from local newspapers, TV, and radio stations
Ancestries: American (15.1%), Haitian (8.1%), English (2.6%), Jamaican (2.1%), African (1.2%), Irish (1.1%).
Current Local Time:
Land area: 8.29 square miles.
Population density: 4,056 people per square mile (average).
5,597 residents are foreign born (16.3% Latin America ).
This city:
18.1%Florida:
21.1%
Median real estate property taxes paid for housing units with mortgages in 2022: $2,527 (0.8%)Median real estate property taxes paid for housing units with no mortgage in 2022: $1,581 (1.1%)
Nearest city with pop. 50,000+: Lakeland, FL
Nearest city with pop. 200,000+: Tampa, FL
Nearest city with pop. 1,000,000+: Houston, TX
Nearest cities:
Latitude: 28.11 N, Longitude: 81.63 W
Nickname or alias (official or unofficial): The Heart of Florida
Daytime population change due to commuting: -463 (-1.5%)Workers who live and work in this city: 4,144 (30.8%)
Property values in Haines City, FL
Haines City tourist attractions:
Single-family new house construction building permits:
2022: 1472 buildings , average cost: $371,9002021: 1515 buildings , average cost: $322,1002020: 768 buildings , average cost: $299,0002019: 696 buildings , average cost: $296,8002018: 340 buildings , average cost: $287,1002017: 238 buildings , average cost: $219,0002016: 205 buildings , average cost: $219,0002015: 142 buildings , average cost: $295,7002014: 166 buildings , average cost: $287,3002013: 151 buildings , average cost: $270,7002012: 133 buildings , average cost: $258,4002011: 41 buildings , average cost: $230,3002010: 34 buildings , average cost: $221,5002009: 21 buildings , average cost: $237,6002008: 65 buildings , average cost: $172,1002007: 199 buildings , average cost: $184,3002006: 441 buildings , average cost: $159,1002005: 528 buildings , average cost: $134,6002004: 769 buildings , average cost: $116,5002003: 216 buildings , average cost: $111,7002002: 116 buildings , average cost: $132,8002001: 88 buildings , average cost: $106,0002000: 102 buildings , average cost: $90,8001999: 140 buildings , average cost: $92,2001998: 107 buildings , average cost: $95,9001997: 60 buildings , average cost: $77,500Unemployment in December 2023:
Most common industries in Haines City, FL (%)
Both Males Females
Accommodation & food services (19.9%)
Construction (9.9%)
Educational services (8.2%)
Arts, entertainment, recreation (6.9%)
Health care (5.8%)
Administrative & support & waste management services (5.6%)
Agriculture, forestry, fishing & hunting (5.0%)
Construction (18.6%)
Accommodation & food services (13.0%)
Agriculture, forestry, fishing & hunting (8.8%)
Administrative & support & waste management services (8.1%)
Arts, entertainment, recreation (7.6%)
Educational services (4.6%)
Food & beverage stores (3.1%)
Accommodation & food services (27.5%)
Educational services (12.1%)
Health care (10.8%)
Arts, entertainment, recreation (6.2%)
Food & beverage stores (5.2%)
Department & other general merchandise stores (4.6%)
Public administration (4.3%)
Most common occupations in Haines City, FL (%)
Both Males Females
Building and grounds cleaning and maintenance occupations (14.6%)
Agricultural workers, including supervisors (4.6%)
Cooks and food preparation workers (4.3%)
Construction laborers (4.3%)
Cashiers (4.1%)
Preschool, kindergarten, elementary, and middle school teachers (3.3%)
Laborers and material movers, hand (3.1%)
Building and grounds cleaning and maintenance occupations (11.9%)
Construction laborers (8.2%)
Agricultural workers, including supervisors (6.6%)
Driver/sales workers and truck drivers (5.5%)
Carpenters (4.4%)
Laborers and material movers, hand (3.7%)
Material recording, scheduling, dispatching, and distributing workers (3.6%)
Building and grounds cleaning and maintenance occupations (17.5%)
Cashiers (7.0%)
Other office and administrative support workers, including supervisors (5.7%)
Cooks and food preparation workers (5.6%)
Preschool, kindergarten, elementary, and middle school teachers (4.9%)
Information and record clerks, except customer service representatives (4.8%)
Waiters and waitresses (4.2%)
Air pollution and air quality trends(lower is better)
AQI PM10 PM2.5
Tornado activity:
Haines City-area historical tornado activity is above Florida state average. It is 64% greater than the overall U.S. average.
On 2/22/1998, a category F3 (max. wind speeds 158-206 mph) tornado 12.2 miles away from the Haines City city center killed 25 people and injured 150 people and caused $55 million in damages.
On 2/22/1998, a category F3 tornado 26.1 miles away from the city center killed 3 people and injured 70 people and caused $15 million in damages.
Earthquake activity:
Haines City-area historical earthquake activity is significantly above Florida state average. It is 90% smaller than the overall U.S. average. On 9/10/2006 at 14:56:08, a magnitude 5.9 (5.9 MB, 5.5 MS, 5.8 MW, Class: Moderate, Intensity: VI - VII) earthquake occurred 333.5 miles away from Haines City center On 11/22/1974 at 05:25:55, a magnitude 4.7 (4.7 MB, Class: Light, Intensity: IV - V) earthquake occurred 342.8 miles away from Haines City center On 6/23/2016 at 17:20:29, a magnitude 3.8 (3.8 ML, Class: Light, Intensity: II - III) earthquake occurred 185.3 miles away from Haines City center On 9/4/2016 at 18:29:29, a magnitude 3.8 (3.8 ML) earthquake occurred 186.4 miles away from the city center On 9/21/2016 at 16:30:52, a magnitude 3.8 (3.8 ML) earthquake occurred 186.8 miles away from the city center On 7/16/2016 at 20:00:10, a magnitude 3.7 (3.7 MB) earthquake occurred 175.3 miles away from Haines City center Magnitude types: body-wave magnitude (MB), local magnitude (ML), surface-wave magnitude (MS), moment magnitude (MW) Natural disasters: The number of natural disasters in Polk County (23) is greater than the US average (15).Major Disasters (Presidential) Declared: 12Emergencies Declared: 5Hurricanes: 10, Fires: 6, Tropical Storms: 4, Tornadoes: 3, Floods: 2, Freeze: 1, Storm: 1, Wind: 1, Other: 1 (Note: some incidents may be assigned to more than one category). Hospitals and medical centers in Haines City: HAINES CITY HEALTH CARE (409 S 10TH ST)
RAI CARE CENTERS - HAINES CITY (110 PATTERSON RD)
1ST CHOICE HEALTHCARE SERVICES, LLC (320 SOUTH 10TH STREET)
HOMECARE OPTIONS (210 S DIXIE DR)
Amtrak stations near Haines City: 10 miles: WINTER HAVEN (1800 7TH ST. S.W.) Services: ticket office, fully wheelchair accessible, enclosed waiting area, public restrooms, public payphones, vending machines, free short-term parking, free long-term parking, taxi stand.
19 miles: KISSIMMEE (111 DAKIN ST.) Services: ticket office, enclosed waiting area, public restrooms, public payphones, vending machines, free short-term parking, free long-term parking, call for car rental service, call for taxi service, intercity bus service, public transit connection.
Colleges/universities with over 2000 students nearest to Haines City:
Polk State College (about 8 miles; Winter Haven, FL ; Full-time enrollment: 7,935)
Southeastern University (about 19 miles; Lakeland, FL ; FT enrollment: 2,407)
Florida Southern College (about 21 miles; Lakeland, FL ; FT enrollment: 2,460)
Universal Technical Institute-Auto Motorcycle & Marine Mechanics Institute Division-Orlando (about 26 miles; Orlando, FL ; FT enrollment: 4,338)
Everest University-South Orlando (about 26 miles; Orlando, FL ; FT enrollment: 33,859)
Valencia College (about 31 miles; Orlando, FL ; FT enrollment: 30,467)
Rollins College (about 38 miles; Winter Park, FL ; FT enrollment: 3,085)
Public high school in Haines City:
Private high schools in Haines City: LANDMARK CHRISTIAN SCHOOL Students: 243, Location: 2020 E HINSON AVE, Grades: PK-12)
NORTHRIDGE CHRISTIAN ACADEMY Students: 236, Location: 2250 STATE ROAD 17 S, Grades: PK-10)
LIGHTHOUSE CHRISTIAN LEARNING CENTER Students: 42, Location: 706 MELBOURNE AVE, Grades: 2-12)
Public elementary/middle schools in Haines City: SANDHILL ELEMENTARY SCHOOL Students: 1,135, Location: 1801 TYNER RD, Grades: PK-5)SHELLEY S. BOONE MIDDLE SCHOOL Students: 975, Location: 225 22ND ST S, Grades: 6-8)BETHUNE ACADEMY Students: 749, Location: 900 AVENUE F, Grades: KG-5)ALTA VISTA ELEMENTARY SCHOOL Students: 266, Location: 801 SCENIC HWY S, Grades: PK-5)DANIEL JENKINS ACADEMY OF TECHNOLOGY MIDDLE SCHOOL Students: 48, Location: 701 LEDWITH AVE, Grades: 6-8)EASTSIDE ELEMENTARY SCHOOL Location: 1820 JOHNSON AVE E, Grades: PK-5)
See full list of schools located in Haines City User-submitted facts and corrections:
Heart of Florida Hospital is listed in Davenport Florida which is incorrect. If you look at the boundries it is actually located in Haines City Florida. Just North of the hospital is a city sign indicating that Haines City starts before the hospital. I believe in actually starts at Development Road another 1/2 mile to a mile further north.
Notable locations in Haines City: (A) , Haines City Fire and Rescue (B) , Polk County Emergency Medical Services Station 13 Haines City (C) , Polk County Fire Department Station 33 Baker Diary (D) , Haines City Police Department (E) , Haines City Public Library (F) , Haines City Parks and Recreation Department Community Center (G) , Haines City Community Center (H) . Display/hide their locations on the map
Cemetery: (1) . Display/hide its location on the map
Lakes and swamps: (A) , Lake Hester (B) , Lake Brooks (C) , Lake Brown (D) , Lake Butler (E) , Lake Joe (F) , Lake Eva (G) , Lake Elsie (H) . Display/hide their locations on the map
Parks in Haines City include: (1) , 8 Acre Park (2) , Boomerang Park (3) , Cook Field (4) , Railroad Park (5) , Larry Parrish Baseball Complex (6) , East Park Softball Complex (7) . Display/hide their locations on the map
Hotels:
Birthplace of: Luther Burden - Basketball player, Mary Hatcher - Film actor, Wayne Gandy - 2005 NFL player (New Orleans Saints, born : Feb 10, 1971), Robert Williams - College basketball player (Fla Atlantic Owls).
Polk County has a predicted average indoor radon screening level between 2 and 4 pCi/L (pico curies per liter) - Moderate Potential Drinking water stations with addresses in Haines City and their reported violations in the past:
JUNCTION FOODS INC. (Population served: 100, Groundwater):
Past health violations:
MCL, Single Sample - In MAR-2011, Contaminant: Nitrate. Follow-up actions: St Tech Assistance Visit (MAR-18-2011), St Public Notif requested (MAR-18-2011), St Violation/Reminder Notice (MAR-25-2011), St Public Notif received (APR-07-2011), St Compliance achieved (FEB-01-2012), St Tech Assistance Visit (FEB-16-2012)
Population served: 64, Groundwater):
Past monitoring violations:
Failure to Conduct Assessment Monitoring - Between OCT-2011 and DEC-2011, Contaminant: E. COLI
3 routine major monitoring violations
63 regular monitoring violations
Population served: 35, Groundwater):
Past monitoring violations:
Failure to Conduct Assessment Monitoring - Between JUL-2012 and SEP-2012, Contaminant: E. COLI
Failure to Conduct Assessment Monitoring - Between APR-2012 and JUN-2012, Contaminant: E. COLI. Follow-up actions: St Public Notif requested (AUG-10-2012), St Public Notif received (AUG-28-2012)
Failure to Conduct Assessment Monitoring - Between JAN-2012 and MAR-2012, Contaminant: E. COLI. Follow-up actions: St Public Notif requested (AUG-10-2012), St Public Notif received (AUG-28-2012)
7 routine major monitoring violations
One regular monitoring violation
Population served: 30, Groundwater):
Past monitoring violations:
One routine major monitoring violation
One regular monitoring violation
Population served: 25, Groundwater):
Past monitoring violations:
One routine major monitoring violation
Drinking water stations with addresses in Haines City that have no violations reported:
DAVENPORT MOB EST (Population served: 390, Primary Water Source Type: Groundwater)
M ; S INVESTMENT PROPERTY ENTERPRISES (Population served: 30, Primary Water Source Type: Groundwater)
Average household size: This city:
3.0 peopleFlorida:
2.5 people
Percentage of family households: This city:
75.5%Whole state:
65.2%
Percentage of households with unmarried partners: This city:
8.4%Whole state:
7.3%
Likely homosexual households (counted as self-reported same-sex unmarried-partner households)
Lesbian couples: 0.5% of all households Gay men: 0.5% of all households
People in group quarters in Haines City in 2010:
105 people in nursing facilities/skilled-nursing facilities
57 people in college/university student housing
26 people in other noninstitutional facilities
4 people in group homes intended for adults
people in nursing homes in 2000people in college dormitories (includes college quarters off campus) in 2000Banks with branches in Haines City (2011 data):
Wells Fargo Bank, National Association: Lucerne Park Branch at 32959 Highway 27, branch established on 1981/08/03; Haines City Branch at 615 East Hinson Avenue, branch established on 1913/01/21. Info updated 2011/04/05: Bank assets: $1,161,490.0 mil, Deposits: $905,653.0 mil, headquarters in Sioux Falls, SD, positive income , 6395 total offices , Holding Company: Wells Fargo & Company
Citizens Bank and Trust: Haines City Branch at 1400 U.S. Highway 27 North, branch established on 2000/11/09. Info updated 2007/08/06: Bank assets: $429.4 mil, Deposits: $378.5 mil, headquarters in Frostproof, FL, positive income , Commercial Lending Specialization, 13 total offices , Holding Company: Citizens Banking Corporation
Bank of America, National Association: Haines City Branch at 905 East Hinson Avenue, branch established on 1982/10/18. Info updated 2009/11/18: Bank assets: $1,451,969.3 mil, Deposits: $1,077,176.8 mil, headquarters in Charlotte, NC, positive income , 5782 total offices , Holding Company: Bank Of America Corporation
SunTrust Bank: Haines City Branch at 99 Highway 17-92 West, branch established on 1989/07/03. Info updated 2010/05/27: Bank assets: $171,291.7 mil, Deposits: $129,833.2 mil, headquarters in Atlanta, GA, positive income , Commercial Lending Specialization, 1716 total offices , Holding Company: Suntrust Banks, Inc.
CenterState Bank of Florida, National Association: Southern Dunes Branch at 36099 State Highway 27 North, branch established on 1995/05/11. Info updated 2012/01/30: Bank assets: $2,082.6 mil, Deposits: $1,779.8 mil, headquarters in Winter Haven, FL, positive income , Commercial Lending Specialization, 65 total offices , Holding Company: Centerstate Banks, Inc.
Community Bank of Florida, Inc.: Haines City Branch at 36205 U.S. Highway 27 North, branch established on 1999/05/19. Info updated 2006/11/03: Bank assets: $525.2 mil, Deposits: $459.3 mil, headquarters in Homestead, FL, negative income in the last year , Commercial Lending Specialization, 12 total offices , Holding Company: Community Bank Of South Florida, Inc.
For population 15 years and over in Haines City:
Never married: 37.5%Now married: 46.0%Separated: 0.9%Widowed: 4.8%Divorced: 10.8% For population 25 years and over in Haines City:
High school or higher: 83.0%Bachelor's degree or higher: 17.7%Graduate or professional degree: 5.5%Unemployed: 6.5%Mean travel time to work (commute): 31.7 minutes
Education Gini index (Inequality in education) Here:
14.3Florida average:
12.2
Religion statistics for Haines City, FL (based on Polk County data)
Religion Adherents Congregations Evangelical Protestant 148,424 504 Catholic 45,251 13 Mainline Protestant 31,347 74 Black Protestant 10,761 46 Other 8,630 36 Orthodox 307 3 None 357,375 -
Source: Clifford Grammich, Kirk Hadaway, Richard Houseal, Dale E.Jones, Alexei Krindatch, Richie Stanley and Richard H.Taylor. 2012. 2010 U.S.Religion Census: Religious Congregations & Membership Study. Association of Statisticians of American Religious Bodies. Jones, Dale E., et al. 2002. Congregations and Membership in the United States 2000. Nashville, TN: Glenmary Research Center. Graphs represent county-level data
Food Environment Statistics: Number of grocery stores : 94Here :
1.64 / 10,000 pop.Florida :
2.04 / 10,000 pop.
Number of supercenters and club stores : 6Polk County :
0.10 / 10,000 pop.State :
0.11 / 10,000 pop.
Number of convenience stores (no gas) : 104This county :
1.82 / 10,000 pop.Florida :
1.28 / 10,000 pop.
Number of convenience stores (with gas) : 215Polk County :
3.75 / 10,000 pop.Florida :
3.04 / 10,000 pop.
Number of full-service restaurants : 281This county :
4.90 / 10,000 pop.Florida :
7.45 / 10,000 pop.
Adult diabetes rate : Polk County :
9.8%Florida :
9.2%
Adult obesity rate : This county :
30.1%Florida :
23.7%
Low-income preschool obesity rate : Polk County :
15.0%Florida :
14.0%
Health and Nutrition: Healthy diet rate : This city:
49.4%Florida:
51.4%
Average overall health of teeth and gums : Average BMI : This city:
29.0Florida:
28.6
People feeling badly about themselves : People not drinking alcohol at all : This city:
11.7%State:
10.7%
Average hours sleeping at night : Haines City:
6.8Florida:
6.9
Overweight people : Haines City:
34.5%Florida:
34.7%
General health condition : Haines City:
54.8%Florida:
57.0%
Average condition of hearing : Haines City:
79.1%Florida:
79.2%
More about Health and Nutrition of Haines City, FL Residents
Local government employment and payroll (March 2022)
Function
Full-time employees
Monthly full-time payroll
Average yearly full-time wage
Part-time employees
Monthly part-time payroll
Police Protection - Officers
59 $270,834 $55,085 0 $0 Parks and Recreation
44 $155,589 $42,433 3 $4,305 Other and Unallocable
31 $142,414 $55,128 3 $4,756 Firefighters
30 $165,091 $66,036 0 $0 Water Supply
20 $76,552 $45,931 0 $0 Sewerage
19 $77,996 $49,261 0 $0 Financial Administration
18 $105,666 $70,444 1 $2,577 Police - Other
12 $48,329 $48,329 1 $1,714 Streets and Highways
8 $34,596 $51,894 0 $0 Other Government Administration
8 $57,474 $86,211 2 $2,449 Local Libraries
7 $29,512 $50,592 6 $7,458 Solid Waste Management
1 $3,472 $41,664 0 $0
Totals for Government
257 $1,167,524 $54,515 16 $23,259
Haines City government finances - Expenditure in 2017 (per resident):
Construction - Parks and Recreation: $140,000 ($4.16)
Regular Highways: $106,000 ($3.15)General - Other: $79,000 ($2.35)Current Operations - Police Protection: $5,851,000 ($173.99)
Sewerage: $3,332,000 ($99.08)Parks and Recreation: $2,641,000 ($78.53)Natural Resources - Other: $2,632,000 ($78.27)Local Fire Protection: $2,318,000 ($68.93)General - Other: $1,888,000 ($56.14)Solid Waste Management: $1,848,000 ($54.95)Water Utilities: $1,108,000 ($32.95)Central Staff Services: $785,000 ($23.34)Regular Highways: $777,000 ($23.11)Libraries: $583,000 ($17.34)Protective Inspection and Regulation - Other: $413,000 ($12.28)Financial Administration: $383,000 ($11.39)Judicial and Legal Services: $165,000 ($4.91)General - Interest on Debt: $1,880,000 ($55.90)
Other Capital Outlay - Local Fire Protection: $845,000 ($25.13)
Police Protection: $347,000 ($10.32)Financial Administration: $158,000 ($4.70)Libraries: $60,000 ($1.78)Water Utilities - Interest on Debt: $246,000 ($7.32)
Haines City government finances - Revenue in 2017 (per resident):
Charges - Sewerage: $5,772,000 ($171.64)
Solid Waste Management: $2,530,000 ($75.23)Parks and Recreation: $501,000 ($14.90)Other: $324,000 ($9.63)Regular Highways: $133,000 ($3.95)Miscellaneous Commercial Activities: $67,000 ($1.99)Natural Resources - Other: $62,000 ($1.84)Federal Intergovernmental - Other: $15,000 ($0.45)
Local Intergovernmental - General Local Government Support: $191,000 ($5.68)
Other: $6,000 ($0.18)Miscellaneous - Special Assessments: $4,012,000 ($119.30)
General Revenue - Other: $2,502,000 ($74.40)Fines and Forfeits: $1,652,000 ($49.12)Interest Earnings: $163,000 ($4.85)Donations From Private Sources: $126,000 ($3.75)Rents: $65,000 ($1.93)Sale of Property: $2,000 ($0.06)Revenue - Water Utilities: $3,705,000 ($110.17)
State Intergovernmental - General Local Government Support: $2,185,000 ($64.97)
Highways: $9,000 ($0.27)Tax - Property: $7,797,000 ($231.85)
Public Utilities Sales: $2,290,000 ($68.10)Occupation and Business License - Other: $1,884,000 ($56.02)Other License: $1,253,000 ($37.26)Motor Fuels Sales: $962,000 ($28.61)Insurance Premiums Sales: $245,000 ($7.29)
Haines City government finances - Debt in 2017 (per resident):
Long Term Debt - Outstanding Unspecified Public Purpose: $54,250,000 ($1613.19)
Beginning Outstanding - Unspecified Public Purpose: $52,221,000 ($1552.86)Issue, Unspecified Public Purpose: $24,109,000 ($716.91)Retired Unspecified Public Purpose: $22,080,000 ($656.58)
Haines City government finances - Cash and Securities in 2017 (per resident):
Other Funds - Cash and Securities: $26,197,000 ($779.00)
Sinking Funds - Cash and Securities: $176,000 ($5.23)
10.64% of this county's 2021 resident taxpayers lived in other counties in 2020 ($52,063 average adjusted gross income )
Here:
10.64%Florida average:
8.80%
0.06% of residents moved from foreign countries ($247 average AGI )Polk County:
0.06%Florida average:
0.05%
Top counties from which taxpayers relocated into this county between 2020 and 2021:
7.04% of this county's 2020 resident taxpayers moved to other counties in 2021 ($47,159 average adjusted gross income )
Here:
7.04%Florida average:
7.45%
0.06% of residents moved to foreign countries ($256 average AGI )Polk County:
0.06%Florida average:
0.04%
Top counties to which taxpayers relocated from this county between 2020 and 2021:
Businesses in Haines City, FL
Name Count Name Count
Ace Hardware 1 MasterBrand Cabinets 1 Advance Auto Parts 1 McDonald's 2 AutoZone 1 Penske 1 Blockbuster 1 Pizza Hut 1 Burger King 2 Popeyes 1 CVS 2 Publix Super Markets 1 Curves 1 RadioShack 1 DHL 1 T-Mobile 1 Dairy Queen 1 Taco Bell 1 Domino's Pizza 1 U-Haul 1 FedEx 2 UPS 3 H&R Block 1 Walgreens 1 KFC 1 Walmart 1 Lowe's 1
Strongest AM radio stations in Haines City:
WFLF (540 AM; 50 kW; PINE HILLS, FL; Owner: CLEAR CHANNEL BROADCASTING LICENSES, INC.)
WLVF (930 AM; 0 kW; HAINES CITY, FL; Owner: LANDMARK BAPTIST CHURCH, INC.)
WQTM (740 AM; 50 kW; ORLANDO, FL; Owner: CLEAR CHANNEL BROADCASTING LICENSES, INC.)
WHNR (1360 AM; 5 kW; CYPRESS GARDENS, FL; Owner: GB ENTERPRISES COMMUNICATIONS CORP.)
WHOO (1080 AM; daytime; 35 kW; KISSIMMEE, FL; Owner: GENESIS COMMUNICATIONS I, INC.)
WDYZ (990 AM; 50 kW; ORLANDO, FL; Owner: ABC, INC.)
WQYK (1010 AM; 50 kW; SEFFNER, FL; Owner: INFINITY BROADCASTING CORPORATION OF TAMPA)
WTWB (1570 AM; 5 kW; AUBURNDALE, FL; Owner: CARPENTER'S HOME CHURCH, INC.)
WONQ (1030 AM; 45 kW; OVIEDO, FL; Owner: FLORIDA BROADCASTERS)
WIXC (1060 AM; 50 kW; TITUSVILLE, FL; Owner: GENESIS COMMUNICATIONS I, INC.)
WTLN (950 AM; 12 kW; ORLANDO, FL; Owner: TM2, INC.)
WMGG (820 AM; 50 kW; LARGO, FL; Owner: MEGA COMMUNICATIONS OF ST. PETERSBURG LICENSEE)
WLKF (1430 AM; 5 kW; LAKELAND, FL; Owner: HALL COMMUNICATIONS, LTD.)
Strongest FM radio stations in Haines City:
WPCV (97.5 FM; WINTER HAVEN, FL; Owner: HALL COMMUNICATIONS, INC.)
WLVF-FM (90.3 FM; HAINES CITY, FL; Owner: LANDMARK BAPTIST CHURCH, INC.)
WXXL (106.7 FM; TAVARES, FL; Owner: AMFM RADIO LICENSES, L.L.C.)
WSJT (94.1 FM; LAKELAND, FL; Owner: INFINITY RADIO OPERATIONS INC.)
WWRM (94.9 FM; TAMPA, FL; Owner: COX RADIO, INC.)
WPOI (101.5 FM; ST. PETERSBURG, FL; Owner: CXR HOLDINGS, INC.)
WJRR (101.1 FM; COCOA BEACH, FL; Owner: CLEAR CHANNEL BROADCASTING LICENSES, INC.)
WSHE (100.3 FM; ORLANDO, FL; Owner: CLEAR CHANNEL BROADCASTING LICENSES, INC.)
WTKS-FM (104.1 FM; COCOA BEACH, FL; Owner: CLEAR CHANNEL BROADCASTING LICENSES, INC.)
WHTQ (96.5 FM; ORLANDO, FL; Owner: COX RADIO, INC.)
WOMX-FM (105.1 FM; ORLANDO, FL; Owner: INFINITY RADIO OPERATIONS INC.)
WFLZ-FM (93.3 FM; TAMPA, FL; Owner: CITICASTERS LICENSES, L.P.)
WMTX (100.7 FM; TAMPA, FL; Owner: CITICASTERS LICENSES, L.P.)
WQYK-FM (99.5 FM; ST. PETERSBURG, FL; Owner: INFINITY BROADCASTING CORPORATION OF FLORIDA)
WTBT (103.5 FM; BRADENTON, FL; Owner: CITICASTERS LICENSES, L.P.)
WLAZ (89.1 FM; KISSIMMEE, FL; Owner: CAGUAS EDUCATIONAL TV, INC.)
WWKA (92.3 FM; ORLANDO, FL; Owner: COX RADIO, INC.)
WPOZ (88.3 FM; UNION PARK, FL; Owner: CENTRAL FLORIDA EDUCATIONAL FOUNDATION, INC.)
W254AI (98.7 FM; AUBURNDALE, FL; Owner: RADIO TRAINING NETWORK, INC.)
WRBQ-FM (104.7 FM; TAMPA, FL; Owner: INFINITY RADIO OPERATIONS INC.)
TV broadcast stations around Haines City:
WLWA-LP (Channel 14; LAKELAND, FL; Owner: TRI-MEDIA GROUP, INC.)
WZXZ-CA (Channel 11; ORLANDO, ETC., FL; Owner: THE BOX WORLDWIDE LLC)
WMOR-TV (Channel 32; LAKELAND, FL; Owner: WMOR-TV COMPANY)
WOPX (Channel 56; MELBOURNE, FL; Owner: PAXSON ORLANDO LICENSE, INC.)
WRDQ (Channel 27; ORLANDO, FL; Owner: WFTV-TV HOLDINGS, INC.)
WEDU (Channel 3; TAMPA, FL; Owner: FLORIDA WEST COAST PUBLIC BROADCASTING, INC.)
WFTV (Channel 9; ORLANDO, FL; Owner: WFTV-TV HOLDINGS, INC.)
WFLA-TV (Channel 8; TAMPA, FL; Owner: MEDIA GENERAL COMMUNICATIONS, INC.)
WFTS-TV (Channel 28; TAMPA, FL; Owner: TAMPA BAY TELEVISION, INC.)
WXPX (Channel 66; BRADENTON, FL; Owner: PAXSON COMMUNICATION LICENSE COMPANY, LLC)
WTGL-TV (Channel 52; COCOA, FL; Owner: GOOD LIFE BROADCASTING, INC.)
WTOG (Channel 44; ST. PETERSBURG, FL; Owner: VIACOM INTERNATIONAL INC.)
WACX (Channel 55; LEESBURG, FL; Owner: ASSOCIATED CHRISTIAN TELEVISION SYSTEM, INC.)
WUSF-TV (Channel 16; TAMPA, FL; Owner: UNIVERSITY OF SOUTH FLORIDA)
WKCF (Channel 18; CLERMONT, FL; Owner: EMMIS TELEVISION LICENSE CORPORATION)
WKMG-TV (Channel 6; ORLANDO, FL; Owner: POST-NEWSWEEK STATIONS ORLANDO, INC.)
WLCB-TV (Channel 45; LEESBURG, FL; Owner: GOOD LIFE BROADCASTING, INC.)
WBCC (Channel 68; COCOA, FL; Owner: BREVARD COMMUNITY COLLEGE)
WTTA (Channel 38; ST. PETERSBURG, FL; Owner: BAY TELEVISION, INC.)
WFTT (Channel 50; TAMPA, FL; Owner: TELEFUTURA TAMPA LLC)
WRBW (Channel 65; ORLANDO, FL; Owner: FOX TELEVISION STATIONS, INC.)
WTVT (Channel 13; TAMPA, FL; Owner: TVT LICENSE, INC.)
WCLF (Channel 22; CLEARWATER, FL; Owner: CHRISTIAN TELEVISION CORPORATION, INC.)
WOFL (Channel 35; ORLANDO, FL; Owner: FOX TELEVISION STATIONS, INC.)
WTAM-LP (Channel 6; TAMPA, FL; Owner: U.S. INTERACTIVE, L.L.C.)
National Bridge Inventory (NBI) Statistics 8 Number of bridges59ft / 18.4m Total length188,453 Total average daily traffic21,547 Total average daily truck traffic
Home Mortgage Disclosure Act Aggregated Statistics For Year 2009(Based on 4 partial tracts) A) FHA, FSA/RHS & VA B) Conventional C) Refinancings D) Home Improvement Loans F) Non-occupant Loans on G) Loans On Manufactured Number Average Value Number Average Value Number Average Value Number Average Value Number Average Value Number Average Value
LOANS ORIGINATED 23 $117,139 31 $107,788 29 $118,888 2 $4,030 22 $100,801 9 $51,247 APPLICATIONS APPROVED, NOT ACCEPTED 4 $164,465 3 $62,623 8 $141,740 0 $0 1 $183,230 2 $40,125 APPLICATIONS DENIED 10 $94,612 12 $135,763 32 $116,440 10 $39,912 14 $118,790 6 $79,073 APPLICATIONS WITHDRAWN 6 $129,548 4 $206,480 11 $137,061 0 $0 2 $141,280 0 $0 FILES CLOSED FOR INCOMPLETENESS 2 $146,560 0 $0 5 $143,612 0 $0 0 $0 0 $0
Aggregated Statistics For Year 2008(Based on 4 partial tracts) A) FHA, FSA/RHS & VA B) Conventional C) Refinancings D) Home Improvement Loans E) Loans on Dwellings For 5+ Families F) Non-occupant Loans on G) Loans On Manufactured Number Average Value Number Average Value Number Average Value Number Average Value Number Average Value Number Average Value Number Average Value
LOANS ORIGINATED 28 $145,052 38 $139,173 56 $109,005 12 $46,925 1 $461,820 29 $129,954 16 $46,952 APPLICATIONS APPROVED, NOT ACCEPTED 2 $154,315 9 $145,391 12 $150,653 1 $8,870 0 $0 7 $178,153 4 $52,965 APPLICATIONS DENIED 16 $125,721 31 $182,717 110 $122,627 20 $57,786 0 $0 30 $185,068 5 $85,096 APPLICATIONS WITHDRAWN 3 $149,817 13 $142,350 28 $108,060 2 $78,705 1 $5,131,320 9 $134,514 1 $47,540 FILES CLOSED FOR INCOMPLETENESS 2 $121,160 2 $273,190 4 $112,938 1 $34,940 0 $0 1 $233,780 0 $0
Aggregated Statistics For Year 2007(Based on 4 partial tracts) A) FHA, FSA/RHS & VA B) Conventional C) Refinancings D) Home Improvement Loans E) Loans on Dwellings For 5+ Families F) Non-occupant Loans on G) Loans On Manufactured Number Average Value Number Average Value Number Average Value Number Average Value Number Average Value Number Average Value Number Average Value
LOANS ORIGINATED 10 $169,964 110 $158,364 128 $113,715 25 $59,391 2 $691,885 65 $144,933 15 $53,784 APPLICATIONS APPROVED, NOT ACCEPTED 1 $143,340 22 $150,201 40 $112,139 7 $37,714 0 $0 13 $148,344 7 $48,814 APPLICATIONS DENIED 5 $144,312 72 $132,213 173 $130,581 33 $56,769 2 $614,040 57 $137,606 11 $55,243 APPLICATIONS WITHDRAWN 1 $148,820 28 $159,760 67 $131,714 5 $65,996 0 $0 21 $164,095 2 $126,360 FILES CLOSED FOR INCOMPLETENESS 1 $141,640 8 $142,936 21 $151,082 1 $49,190 0 $0 5 $197,336 0 $0
Aggregated Statistics For Year 2006(Based on 4 partial tracts) A) FHA, FSA/RHS & VA B) Conventional C) Refinancings D) Home Improvement Loans E) Loans on Dwellings For 5+ Families F) Non-occupant Loans on G) Loans On Manufactured Number Average Value Number Average Value Number Average Value Number Average Value Number Average Value Number Average Value Number Average Value
LOANS ORIGINATED 10 $127,225 321 $142,693 189 $121,329 27 $71,942 1 $1,857,370 176 $156,718 25 $56,686 APPLICATIONS APPROVED, NOT ACCEPTED 0 $0 51 $115,237 67 $86,404 6 $49,612 1 $1,682,400 48 $95,596 9 $64,116 APPLICATIONS DENIED 3 $175,983 163 $132,829 163 $118,788 48 $40,573 0 $0 92 $151,039 15 $57,201 APPLICATIONS WITHDRAWN 1 $188,510 48 $153,265 95 $126,414 9 $102,308 0 $0 19 $178,261 0 $0 FILES CLOSED FOR INCOMPLETENESS 0 $0 17 $178,945 19 $149,594 1 $60,090 2 $1,884,290 11 $161,661 0 $0
Aggregated Statistics For Year 2005(Based on 4 partial tracts) A) FHA, FSA/RHS & VA B) Conventional C) Refinancings D) Home Improvement Loans E) Loans on Dwellings For 5+ Families F) Non-occupant Loans on G) Loans On Manufactured Number Average Value Number Average Value Number Average Value Number Average Value Number Average Value Number Average Value Number Average Value
LOANS ORIGINATED 13 $121,582 307 $125,730 135 $99,197 15 $94,487 1 $1,451,070 183 $144,800 18 $57,416 APPLICATIONS APPROVED, NOT ACCEPTED 2 $124,570 56 $103,123 38 $82,869 5 $59,110 0 $0 18 $126,617 16 $57,402 APPLICATIONS DENIED 1 $159,590 100 $104,639 158 $97,144 25 $59,731 0 $0 36 $121,712 20 $65,104 APPLICATIONS WITHDRAWN 2 $121,080 50 $114,423 106 $100,673 7 $102,461 0 $0 16 $114,891 1 $67,520 FILES CLOSED FOR INCOMPLETENESS 1 $58,880 16 $120,901 19 $130,261 1 $21,030 0 $0 6 $178,398 0 $0
Aggregated Statistics For Year 2004(Based on 4 partial tracts) A) FHA, FSA/RHS & VA B) Conventional C) Refinancings D) Home Improvement Loans E) Loans on Dwellings For 5+ Families F) Non-occupant Loans on G) Loans On Manufactured Number Average Value Number Average Value Number Average Value Number Average Value Number Average Value Number Average Value Number Average Value
LOANS ORIGINATED 21 $93,469 236 $94,934 101 $84,687 20 $23,612 1 $1,358,540 145 $111,987 72 $30,858 APPLICATIONS APPROVED, NOT ACCEPTED 2 $68,885 53 $80,477 34 $76,976 9 $21,356 0 $0 31 $100,757 24 $31,980 APPLICATIONS DENIED 7 $105,693 62 $79,162 121 $73,367 25 $20,354 0 $0 19 $82,649 22 $44,627 APPLICATIONS WITHDRAWN 3 $137,703 19 $99,496 78 $80,959 4 $34,732 0 $0 13 $104,215 1 $62,110 FILES CLOSED FOR INCOMPLETENESS 0 $0 10 $68,545 13 $93,014 0 $0 0 $0 4 $95,590 0 $0
Aggregated Statistics For Year 2003(Based on 4 partial tracts) A) FHA, FSA/RHS & VA B) Conventional C) Refinancings D) Home Improvement Loans E) Loans on Dwellings For 5+ Families F) Non-occupant Loans on Number Average Value Number Average Value Number Average Value Number Average Value Number Average Value Number Average Value
LOANS ORIGINATED 29 $89,906 143 $97,009 151 $77,692 18 $18,514 1 $679,690 107 $99,965 APPLICATIONS APPROVED, NOT ACCEPTED 1 $155,100 25 $62,075 49 $78,023 2 $13,405 0 $0 18 $67,934 APPLICATIONS DENIED 4 $86,260 37 $70,665 124 $68,021 17 $16,706 0 $0 20 $75,066 APPLICATIONS WITHDRAWN 3 $89,677 18 $80,578 67 $79,863 1 $37,850 0 $0 13 $74,237 FILES CLOSED FOR INCOMPLETENESS 0 $0 6 $62,052 11 $92,674 0 $0 0 $0 4 $63,875
Aggregated Statistics For Year 2002(Based on 2 partial tracts) A) FHA, FSA/RHS & VA B) Conventional C) Refinancings D) Home Improvement Loans E) Loans on Dwellings For 5+ Families F) Non-occupant Loans on Number Average Value Number Average Value Number Average Value Number Average Value Number Average Value Number Average Value
LOANS ORIGINATED 13 $84,402 53 $69,528 45 $80,010 12 $24,089 1 $121,970 26 $59,290 APPLICATIONS APPROVED, NOT ACCEPTED 0 $0 8 $43,415 15 $68,717 0 $0 0 $0 4 $53,205 APPLICATIONS DENIED 2 $63,930 18 $59,262 41 $65,781 13 $13,142 0 $0 6 $83,548 APPLICATIONS WITHDRAWN 1 $55,410 7 $61,461 20 $109,006 1 $16,820 0 $0 2 $52,295 FILES CLOSED FOR INCOMPLETENESS 1 $62,250 5 $65,936 8 $66,428 0 $0 0 $0 2 $86,030
Aggregated Statistics For Year 2001(Based on 2 partial tracts) A) FHA, FSA/RHS & VA B) Conventional C) Refinancings D) Home Improvement Loans F) Non-occupant Loans on Number Average Value Number Average Value Number Average Value Number Average Value Number Average Value
LOANS ORIGINATED 17 $66,900 68 $67,343 68 $65,497 14 $12,329 33 $57,342 APPLICATIONS APPROVED, NOT ACCEPTED 0 $0 12 $58,056 14 $74,246 2 $21,475 5 $68,464 APPLICATIONS DENIED 3 $98,140 24 $70,402 59 $64,794 18 $17,482 6 $56,393 APPLICATIONS WITHDRAWN 6 $80,452 10 $66,722 25 $64,096 3 $14,667 3 $51,217 FILES CLOSED FOR INCOMPLETENESS 3 $42,060 3 $41,683 4 $98,795 0 $0 1 $21,870
Aggregated Statistics For Year 2000(Based on 2 partial tracts) A) FHA, FSA/RHS & VA B) Conventional C) Refinancings D) Home Improvement Loans E) Loans on Dwellings For 5+ Families F) Non-occupant Loans on Number Average Value Number Average Value Number Average Value Number Average Value Number Average Value Number Average Value
LOANS ORIGINATED 17 $69,054 71 $66,298 18 $51,782 7 $18,407 1 $180,020 29 $76,641 APPLICATIONS APPROVED, NOT ACCEPTED 2 $57,450 20 $49,997 4 $35,305 5 $10,004 0 $0 4 $85,912 APPLICATIONS DENIED 3 $46,160 51 $52,629 36 $42,191 18 $21,002 0 $0 7 $68,374 APPLICATIONS WITHDRAWN 3 $100,523 4 $61,995 17 $51,312 1 $16,820 0 $0 2 $69,940 FILES CLOSED FOR INCOMPLETENESS 3 $77,950 1 $36,680 8 $55,779 0 $0 0 $0 0 $0
Aggregated Statistics For Year 1999(Based on 3 partial tracts) A) FHA, FSA/RHS & VA B) Conventional C) Refinancings D) Home Improvement Loans E) Loans on Dwellings For 5+ Families F) Non-occupant Loans on Number Average Value Number Average Value Number Average Value Number Average Value Number Average Value Number Average Value
LOANS ORIGINATED 19 $64,806 127 $71,215 84 $54,276 17 $17,630 0 $0 59 $87,672 APPLICATIONS APPROVED, NOT ACCEPTED 1 $42,540 20 $57,350 39 $40,811 6 $27,498 0 $0 8 $71,348 APPLICATIONS DENIED 1 $112,360 92 $50,287 120 $51,475 27 $16,246 1 $12,020 13 $61,370 APPLICATIONS WITHDRAWN 0 $0 15 $63,963 61 $44,570 6 $27,537 0 $0 4 $63,780 FILES CLOSED FOR INCOMPLETENESS 3 $48,397 5 $64,944 22 $54,156 0 $0 0 $0 2 $70,905
Detailed HMDA statistics for the following Tracts:
0126.01
, 0126.02 , 0127.00 , 0128.00
Private Mortgage Insurance Companies Aggregated Statistics For Year 2009(Based on 2 partial tracts) A) Conventional Number Average Value
LOANS ORIGINATED 1 $144,200 APPLICATIONS APPROVED, NOT ACCEPTED 0 $0 APPLICATIONS DENIED 0 $0 APPLICATIONS WITHDRAWN 0 $0 FILES CLOSED FOR INCOMPLETENESS 0 $0
Aggregated Statistics For Year 2008(Based on 4 partial tracts) A) Conventional B) Refinancings C) Non-occupant Loans on Number Average Value Number Average Value Number Average Value
LOANS ORIGINATED 13 $165,255 3 $217,630 3 $153,520 APPLICATIONS APPROVED, NOT ACCEPTED 10 $157,313 3 $196,363 2 $218,660 APPLICATIONS DENIED 3 $146,207 1 $277,520 2 $68,020 APPLICATIONS WITHDRAWN 1 $243,450 0 $0 0 $0 FILES CLOSED FOR INCOMPLETENESS 0 $0 0 $0 0 $0
Aggregated Statistics For Year 2007(Based on 4 partial tracts) A) Conventional B) Refinancings C) Non-occupant Loans on Number Average Value Number Average Value Number Average Value
LOANS ORIGINATED 23 $162,305 13 $169,082 4 $156,202 APPLICATIONS APPROVED, NOT ACCEPTED 3 $222,310 3 $219,983 2 $249,010 APPLICATIONS DENIED 2 $113,330 2 $144,815 2 $80,555 APPLICATIONS WITHDRAWN 0 $0 1 $60,480 0 $0 FILES CLOSED FOR INCOMPLETENESS 0 $0 0 $0 0 $0
Aggregated Statistics For Year 2006(Based on 4 partial tracts) A) Conventional B) Refinancings C) Non-occupant Loans on Number Average Value Number Average Value Number Average Value
LOANS ORIGINATED 28 $132,440 3 $167,027 7 $119,444 APPLICATIONS APPROVED, NOT ACCEPTED 6 $154,822 1 $130,390 4 $160,158 APPLICATIONS DENIED 1 $148,050 0 $0 0 $0 APPLICATIONS WITHDRAWN 3 $167,117 1 $206,620 1 $357,500 FILES CLOSED FOR INCOMPLETENESS 1 $121,130 0 $0 0 $0
Aggregated Statistics For Year 2005(Based on 4 partial tracts) A) Conventional B) Refinancings C) Non-occupant Loans on Number Average Value Number Average Value Number Average Value
LOANS ORIGINATED 31 $124,970 6 $97,845 13 $137,656 APPLICATIONS APPROVED, NOT ACCEPTED 6 $116,487 0 $0 2 $138,945 APPLICATIONS DENIED 5 $100,272 1 $72,340 4 $112,720 APPLICATIONS WITHDRAWN 2 $76,865 0 $0 1 $111,820 FILES CLOSED FOR INCOMPLETENESS 2 $50,710 0 $0 0 $0
Aggregated Statistics For Year 2004(Based on 4 partial tracts) A) Conventional B) Refinancings C) Non-occupant Loans on Number Average Value Number Average Value Number Average Value
LOANS ORIGINATED 22 $98,104 6 $86,385 6 $102,802 APPLICATIONS APPROVED, NOT ACCEPTED 2 $175,115 4 $128,643 0 $0 APPLICATIONS DENIED 0 $0 0 $0 0 $0 APPLICATIONS WITHDRAWN 3 $58,167 1 $116,090 0 $0 FILES CLOSED FOR INCOMPLETENESS 0 $0 2 $94,215 1 $122,820
Aggregated Statistics For Year 2003(Based on 4 partial tracts) A) Conventional B) Refinancings C) Non-occupant Loans on Number Average Value Number Average Value Number Average Value
LOANS ORIGINATED 25 $100,315 14 $103,771 7 $125,970 APPLICATIONS APPROVED, NOT ACCEPTED 4 $145,188 4 $82,095 0 $0 APPLICATIONS DENIED 2 $70,220 0 $0 1 $110,200 APPLICATIONS WITHDRAWN 2 $153,650 2 $68,145 3 $89,447 FILES CLOSED FOR INCOMPLETENESS 0 $0 0 $0 0 $0
Aggregated Statistics For Year 2002(Based on 2 partial tracts) A) Conventional B) Refinancings C) Non-occupant Loans on Number Average Value Number Average Value Number Average Value
LOANS ORIGINATED 12 $115,921 9 $124,264 1 $52,150 APPLICATIONS APPROVED, NOT ACCEPTED 0 $0 2 $115,615 1 $57,200 APPLICATIONS DENIED 1 $92,160 0 $0 0 $0 APPLICATIONS WITHDRAWN 1 $67,300 3 $90,363 1 $67,300 FILES CLOSED FOR INCOMPLETENESS 0 $0 0 $0 0 $0
Aggregated Statistics For Year 2001(Based on 2 partial tracts) A) Conventional B) Refinancings C) Non-occupant Loans on Number Average Value Number Average Value Number Average Value
LOANS ORIGINATED 11 $75,581 7 $119,830 3 $58,797 APPLICATIONS APPROVED, NOT ACCEPTED 1 $104,150 2 $103,360 0 $0 APPLICATIONS DENIED 0 $0 0 $0 0 $0 APPLICATIONS WITHDRAWN 1 $68,140 0 $0 0 $0 FILES CLOSED FOR INCOMPLETENESS 0 $0 0 $0 0 $0
Aggregated Statistics For Year 2000(Based on 2 partial tracts) A) Conventional B) Refinancings C) Non-occupant Loans on Number Average Value Number Average Value Number Average Value
LOANS ORIGINATED 9 $79,266 1 $68,140 0 $0 APPLICATIONS APPROVED, NOT ACCEPTED 0 $0 1 $54,680 0 $0 APPLICATIONS DENIED 1 $51,160 0 $0 1 $50,470 APPLICATIONS WITHDRAWN 0 $0 0 $0 0 $0 FILES CLOSED FOR INCOMPLETENESS 1 $109,360 0 $0 0 $0
Aggregated Statistics For Year 1999(Based on 3 partial tracts) A) Conventional B) Refinancings C) Non-occupant Loans on Number Average Value Number Average Value Number Average Value
LOANS ORIGINATED 7 $107,254 4 $52,810 2 $107,640 APPLICATIONS APPROVED, NOT ACCEPTED 0 $0 0 $0 0 $0 APPLICATIONS DENIED 0 $0 0 $0 0 $0 APPLICATIONS WITHDRAWN 0 $0 0 $0 0 $0 FILES CLOSED FOR INCOMPLETENESS 0 $0 0 $0 0 $0
Detailed PMIC statistics for the following Tracts:
0126.01
, 0126.02 , 0127.00 , 0128.00
Most common first names in Haines City, FL among deceased individuals Name Count Lived (average)
John 190 74.0 years James 174 72.4 years William 159 73.9 years Robert 150 74.1 years Mary 137 76.9 years George 109 75.1 years Charles 104 73.9 years Thomas 74 70.8 years Richard 71 69.1 years Joseph 59 76.3 years
Most common last names in Haines City, FL among deceased individuals Last name Count Lived (average)
Smith 94 74.9 years Johnson 76 73.5 years Williams 73 70.3 years Davis 59 75.5 years Brown 50 73.0 years Jones 50 75.3 years Miller 48 75.3 years Anderson 32 72.9 years Taylor 32 77.2 years Moore 30 73.0 years
Haines City compared to Florida state average:
Unemployed percentage below state average. Black race population percentage significantly above state average. Hispanic race population percentage significantly above state average. Median age below state average. Foreign-born population percentage above state average. House age below state average. Number of college students above state average. Haines City on our top lists :
#8 on the list of "Top 101 cities with largest percentage of females in occupations: building and grounds cleaning and maintenance occupations (population 5,000+)"
#36 on the list of "Top 101 cities with largest percentage of females in industries: accommodation and food services (population 5,000+)"
#49 on the list of "Top 100 cities with strongest arts, entertainment, recreation, accommodation and food services industries (pop. 5,000+)"
#69 on the list of "Top 101 cities with the most residents born in Haiti (population 500+)"
#76 on the list of "Top 101 cities with largest percentage of males in occupations: building and grounds cleaning and maintenance occupations (population 5,000+)"
#92 on the list of "Top 101 cities with largest percentage of males in industries: arts, entertainment, and recreation (population 5,000+)"
#28 on the list of "Top 101 counties with the most Evangelical Protestant congregations"
#32 on the list of "Top 101 counties with the highest ground withdrawal of fresh water for public supply"
#39 on the list of "Top 101 counties with the lowest surface withdrawal of fresh water for public supply"
#44 on the list of "Top 101 counties with the most Evangelical Protestant adherents"
#45 on the list of "Top 101 counties with the highest number of infant deaths per 1000 residents 2007-2013 (pop. 50,000+)"
Top Patent Applicants
Richard A. Samsel (6)
Albert A. Lucio (4)
Garland Mathews (2)
Ryan Johnston (1)
Howard L. Wray (1)
Ronald Arthur Treacy (1)
Jeff Hughes (1)
Cheryl De Zayas (1)
Timothy Carr (1)
Thomas Benson (1)
Total of 20 patent applications in 2008-2024.
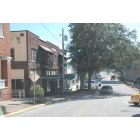
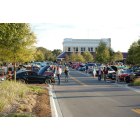
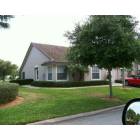
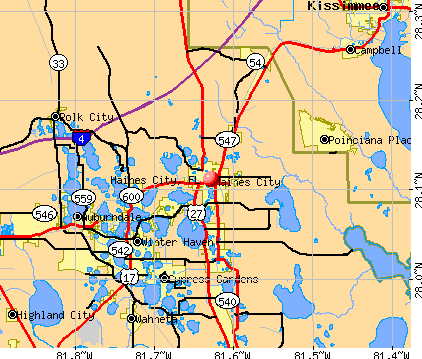


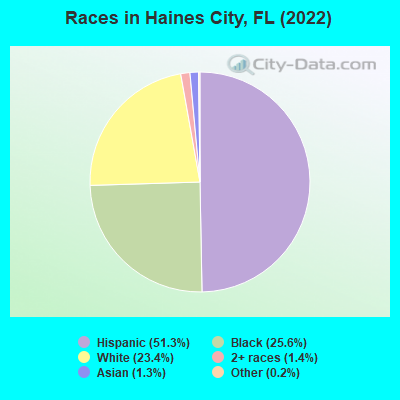
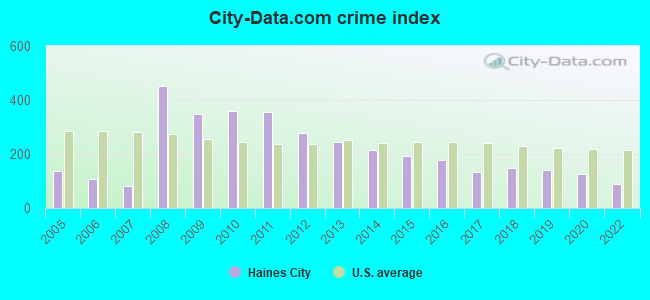
 Recent articles from our blog. Our writers, many of them Ph.D. graduates or candidates, create easy-to-read articles on a wide variety of topics.

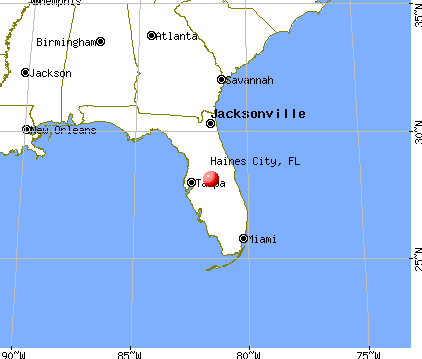
 (20.7 miles
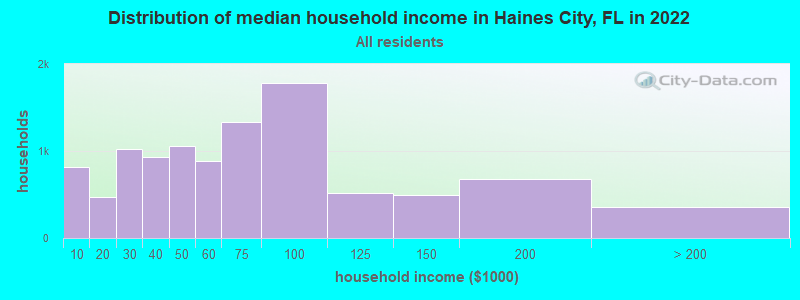
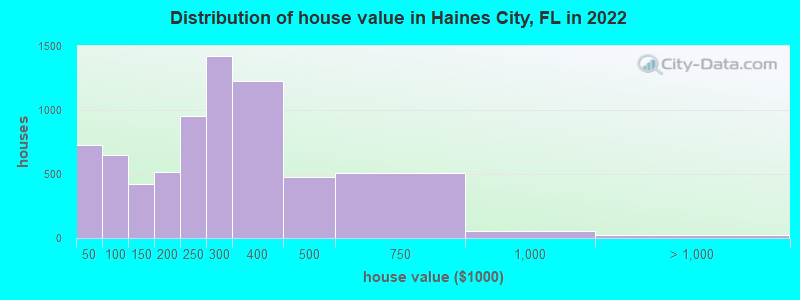
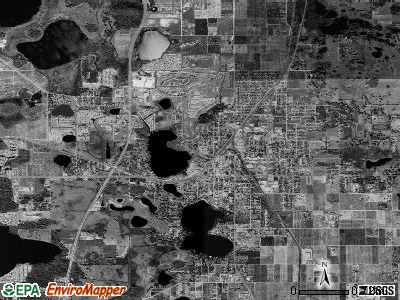
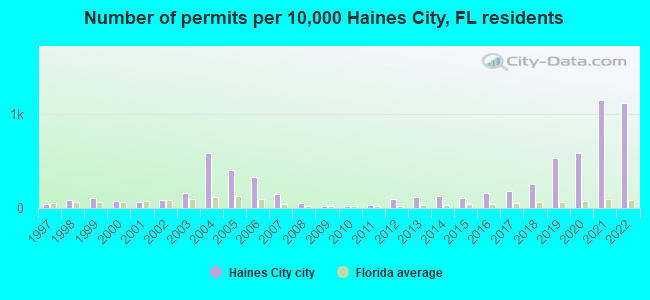
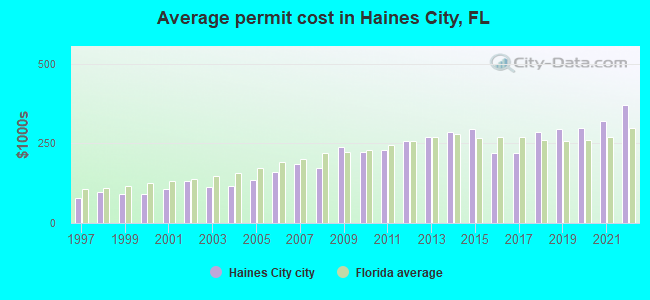
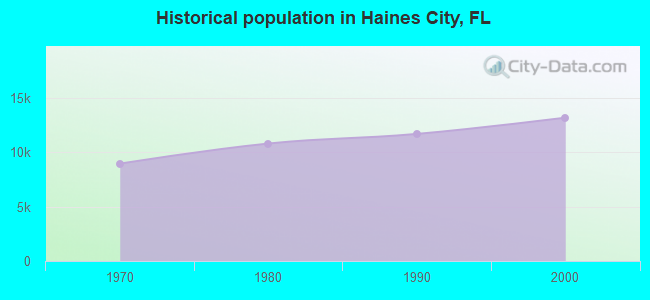
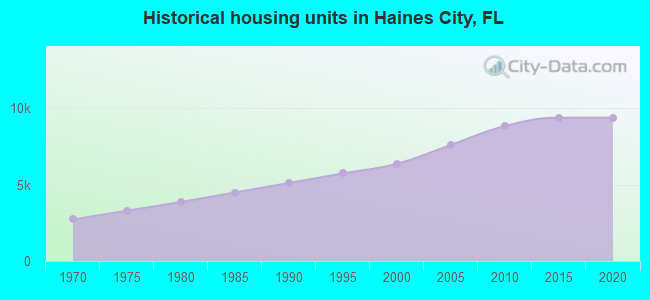
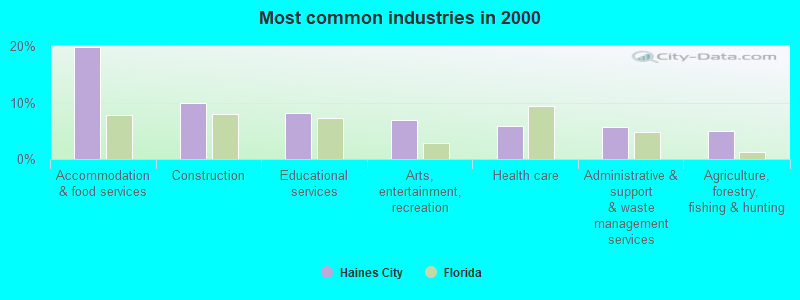
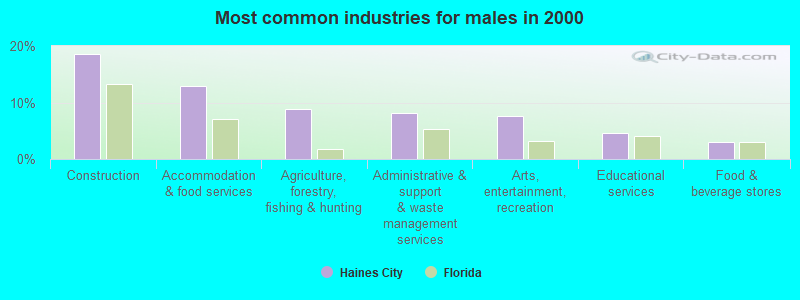
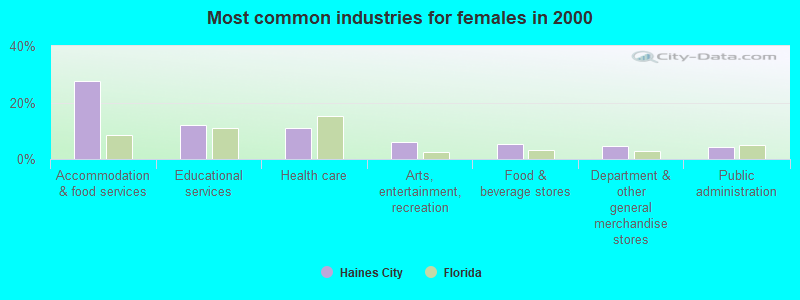
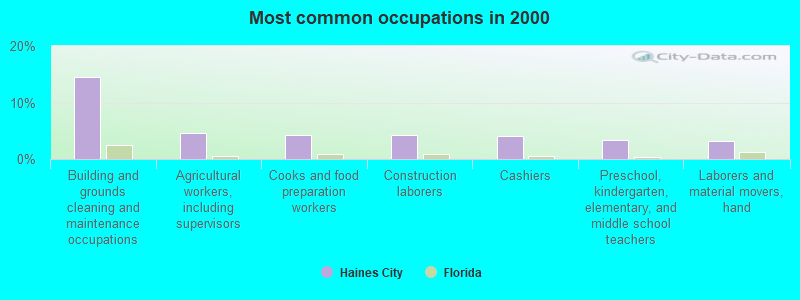

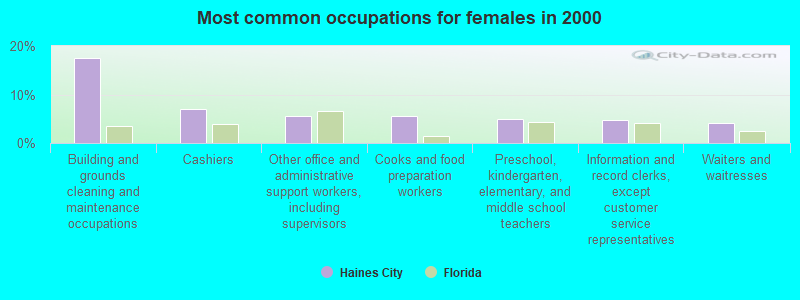
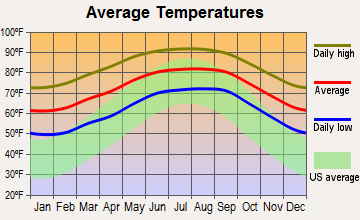
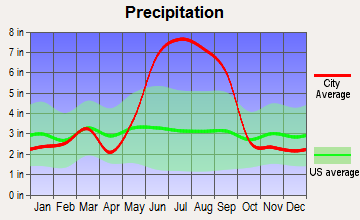
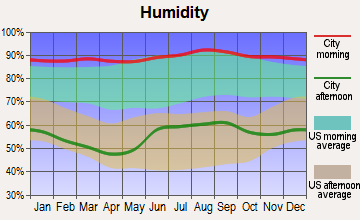
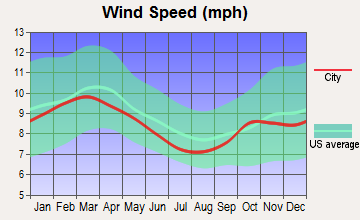
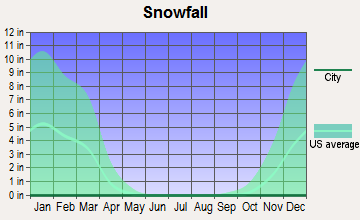
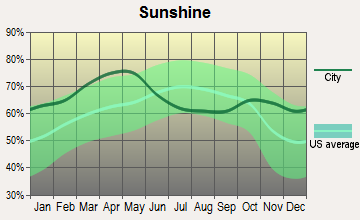
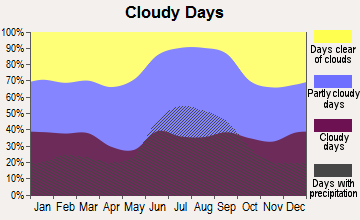
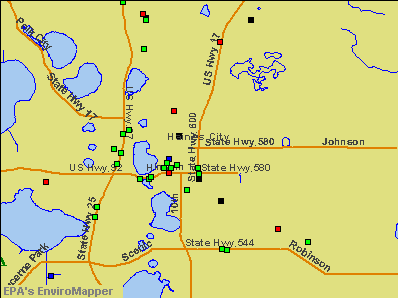

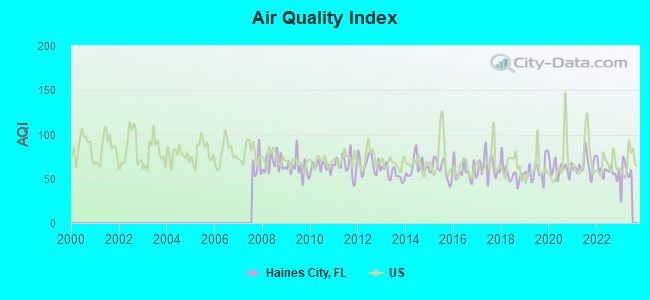
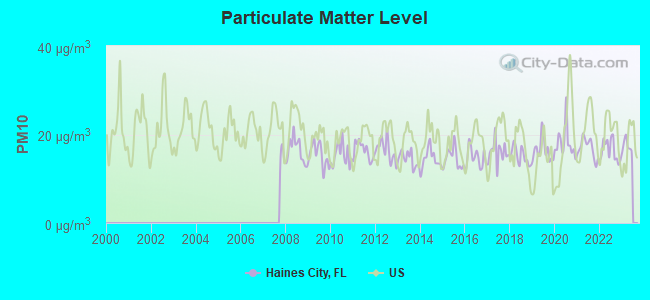
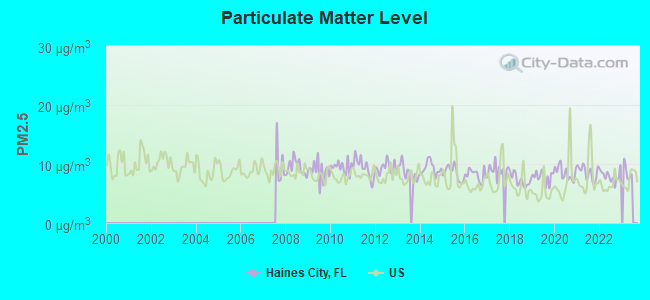
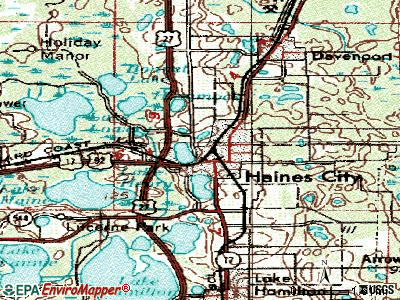

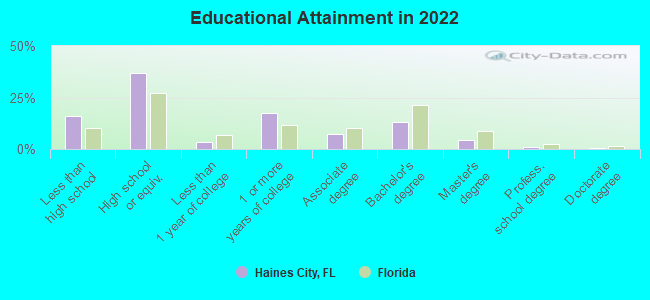
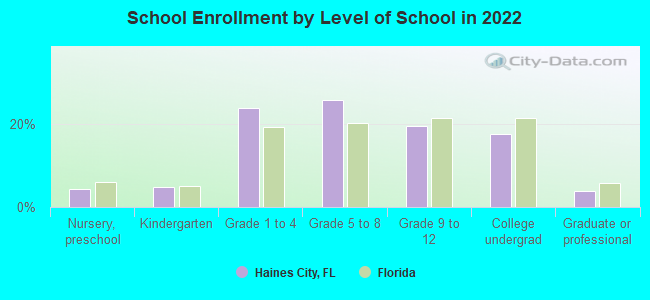
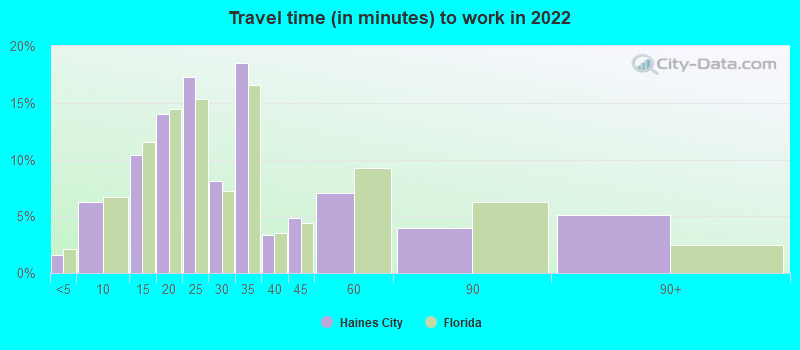
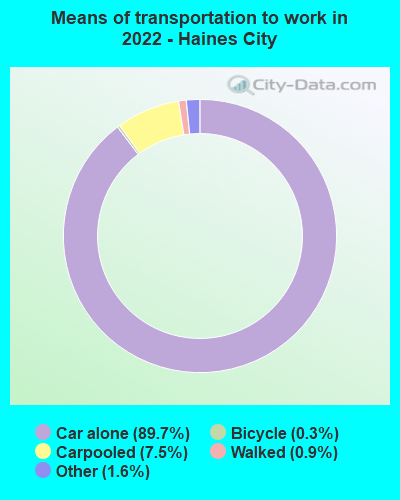
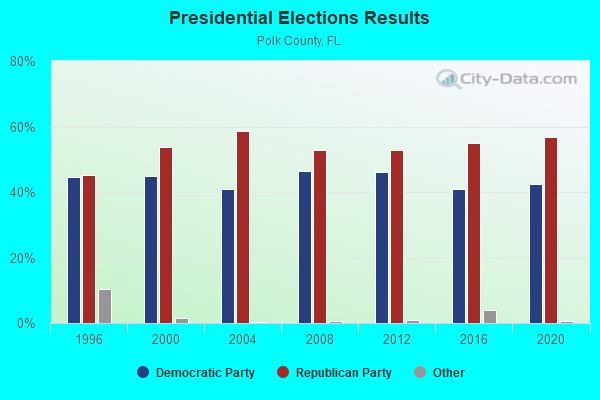
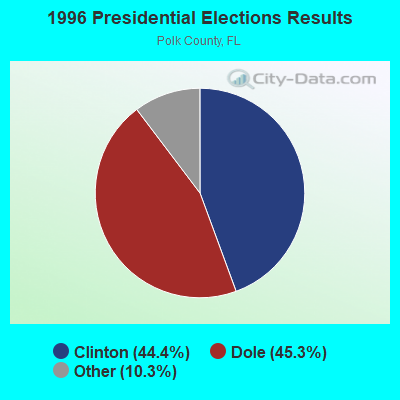
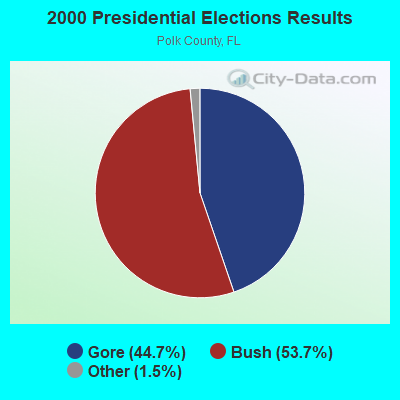
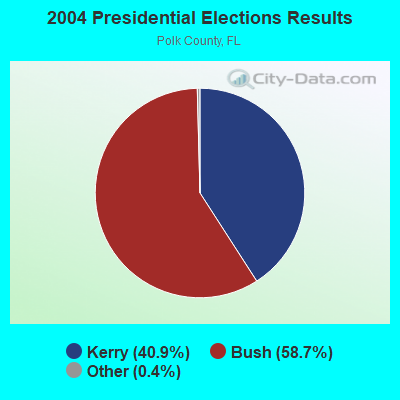
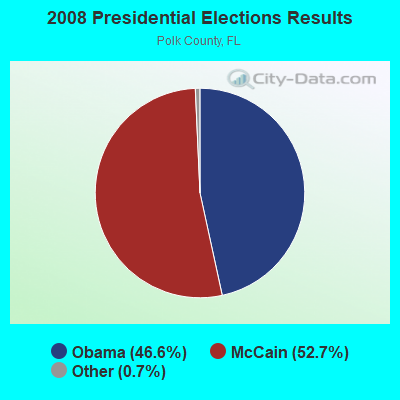
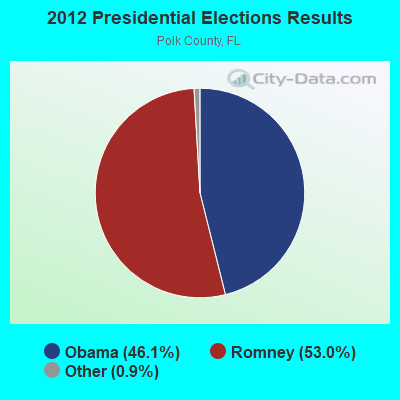
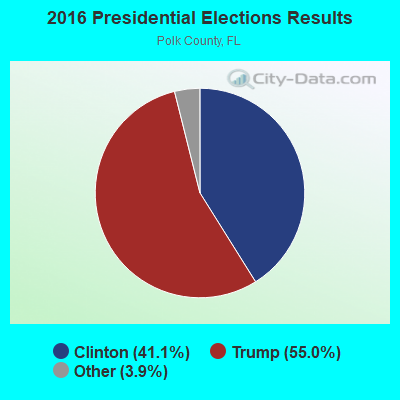
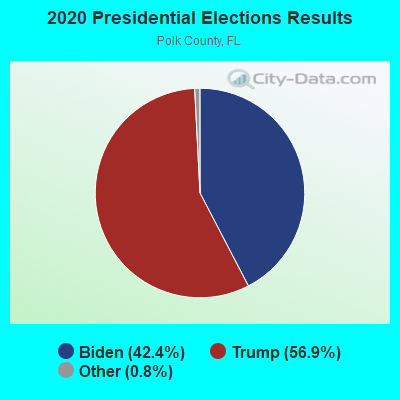
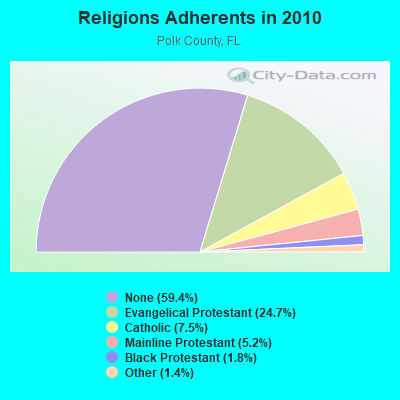
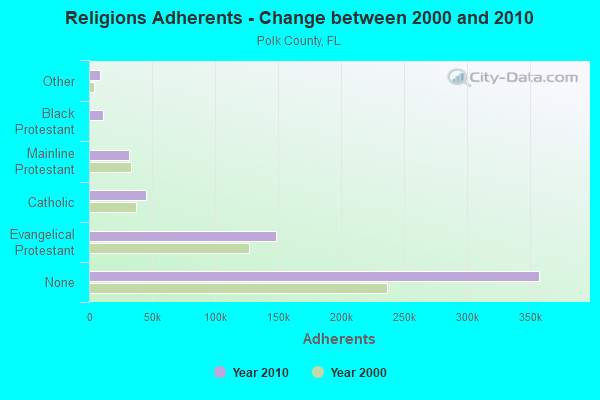
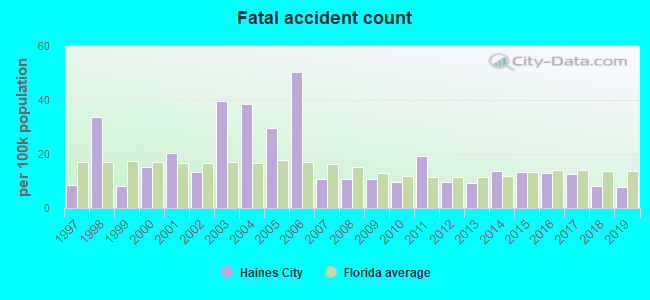
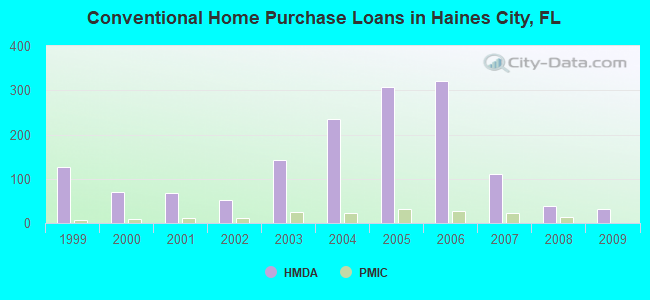
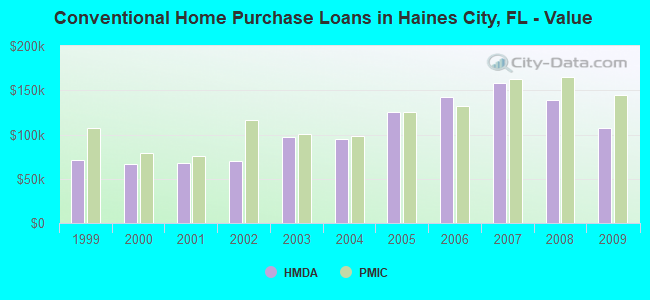
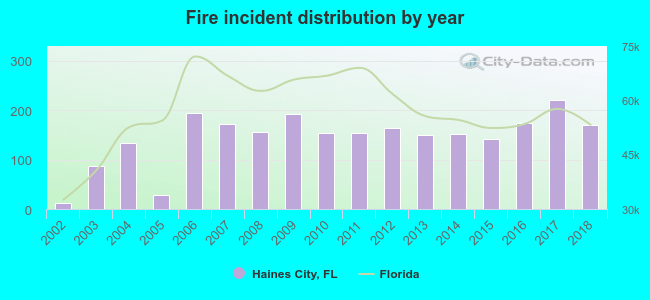 Based on the data from the years 2002 - 2018 the average number of fire incidents per year is 144. The highest number of fire incidents - 220 took place in 2017, and the least - 13 in 2002. The data has an increasing trend.
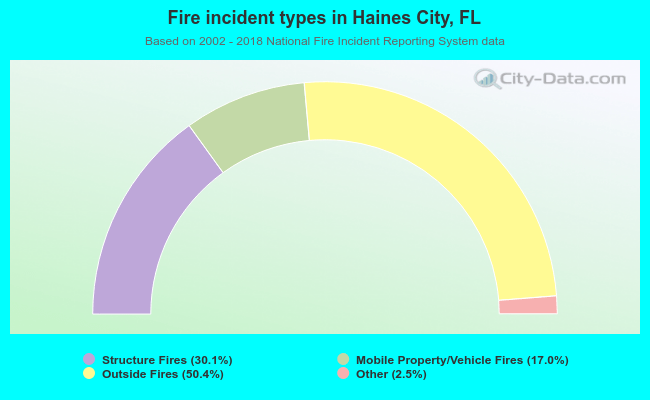 When looking into fire subcategories, the most reports belonged to: Outside Fires (50.4%), and Structure Fires (30.1%).